1. Introduction
Antimicrobial resistance (AMR) continues to hinder the effectiveness of infectious disease treatment and remains a major global challenge for antibacterial discovery and public health. The most recent global burden analysis estimated that bacterial AMR was linked to an estimated 4.71 million deaths globally in 2021, including 1.14 million deaths caused directly by resistant bacterial infections [
1].
Among Gram-negative pathogens,
Pseudomonas aeruginosa (
P. aeruginosa) is a clinically significant pathogen because of its ability to cause severe infections in vulnerable populations, including individuals with cystic fibrosis, burns, immunodeficiency, cancer, and chronic respiratory disease, and it remains a major cause of hospital-acquired infections [
2,
3]. The World Health Organization Bacterial Priority Pathogen List 2024 classifies carbapenem-resistant
P. aeruginosa as a high-priority threat, emphasizing the urgent need for novel antibacterial agents and targeted public health interventions [
4]. Eradicating this pathogen is exceptionally challenging because of its complex network of resistance mechanisms, which include low outer membrane permeability, active multidrug efflux, β-lactamase production, biofilm-associated tolerance, and rapid adaptive responses under antimicrobial pressure [
3,
5]. Together, these clinical and biological challenges render
P. aeruginosa a compelling target for antibacterial discovery, highlighting the urgent need to identify and prioritize compounds.
Computational prioritization approaches offer a powerful means to narrow down antibacterial libraries before resource-intensive experimental screening. Among these approaches, ligand-based quantitative structure–activity relationship (QSAR) modeling provides a robust framework for linking molecular structures to biological activities [
6,
7]. By identifying key patterns across molecular descriptors, fingerprints, and experimentally derived activity data, QSAR models can effectively support the identification of promising candidate compounds from large chemical library collections. However, the practical utility of a QSAR model strongly depends on its intended decision-making context. In virtual screening, the primary objective is typically to nominate a selective list of high-probability candidates for experimental validation, rather than to assign equal predictive weight to every compound in a library [
8,
9]. Consequently, maximizing model interpretability and success requires careful optimization of endpoint definitions, data quality, chemical domain coverage, validation design, and screening-centric performance metrics [
7,
10]. In this screening paradigm, QSAR is intended not to replace microbiological testing but to enrich the follow-up pool with compounds more likely to exhibit the endpoint of interest; whether such enrichment reduces the experimental workload must ultimately be assessed prospectively.
Disk diffusion inhibition-zone (IZ) assays provide a widely adopted phenotypic measure of antibacterial activity. The standardized single-disk method introduced by Bauer, Kirby, Sherris, and Turck established the IZ diameter as an experimentally accessible readout of antimicrobial effects [
11]. Modern disk diffusion testing remains highly valuable because of its reproducibility under standardized laboratory conditions [
12]. However, the IZ diameter is not a direct measure of intrinsic molecular potency; rather, it represents a composite phenotype reflecting antibacterial activity alongside agar diffusion and physicochemical behaviors, including molecular weight, lipophilicity, charge state, and matrix binding [
11,
12,
13]. In addition to these physicochemical dependencies, disk diffusion IZ measurements carry inherent technical noise. IZ diameters can be modulated by variations in inoculum density, agar depth and composition, disk application, incubation conditions, and the specific method—manual or automated—used to determine the zone edge [
14]. While standardized protocols are specifically designed to minimize these sources of variation [
15], this technical noise cannot be completely eliminated. Consequently, QSAR models trained on heterogeneous, publicly available IZ records should be interpreted as models of a noisy whole-cell phenotypic screening readout, rather than as direct predictors of intrinsic potency, minimum inhibitory concentrations (MICs), clinical susceptibility, or in vivo efficacy. While this multi-factorial nature makes the IZ a challenging endpoint for machine learning, it raises a critical, testable question: whether the original continuous diameter contains ranking-relevant information that is systematically lost when converted into a binary activity label.
Earlier QSAR studies targeting
P. aeruginosa provided valuable insights but were largely constrained by their local or target-specific scope. Podunavac-Kuzmanović et al. utilized multiple linear regression and leave-one-out validation to model the MIC-derived activity of 14 substituted benzimidazoles, evaluating their approach on an external set of five structurally related analogues [
16]. The authors restricted the applicability domain (AD) of their models to substituted 1-benzyl or 1-benzoylbenzimidazole derivatives, underscoring that these relationships were tailored for intra-class prediction rather than generalization across diverse chemotypes [
16]. Similarly, Kadam and Roy investigated
P. aeruginosa LpxC inhibitors across three distinct structural classes [
17]. They observed that a global model pooled across all classes underperformed relative to cluster-specific models, a finding consistent with class-dependent SARs that are better captured locally. Furthermore, their endpoint was restricted to target-specific LpxC inhibition rather than a heterogeneous whole-cell antibacterial phenotype. Datar modeled inhibition-zone (IZ) diameters for a series of 15 indolylpyrimidines, again limiting inference to a small local chemical series [
18]. More recently, Gajjar et al. expanded QSAR modeling of anti-
P. aeruginosa activity but reported reduced external predictivity relative to internal validation, highlighting dataset expansion as a prerequisite for robust model generalization [
19]. Taken together, these studies indicate that continuous antibacterial QSAR modeling is not inherently flawed; rather, earlier anti-
P. aeruginosa models were primarily designed for localized chemotype or target-specific predictions, leaving broader external validation underexplored.
To address these limitations, Bugeac et al. subsequently established a substantially larger, ChEMBL-derived
P. aeruginosa disk diffusion benchmark centered on binary activity classification [
20]. Because the original IZ diameters and predefined training and external validation partitions were available, this benchmark also created an opportunity to examine the same phenotypic endpoint without first reducing it to a single activity label. The resulting methodological question is whether continuous-IZ prediction provides useful compound prioritization information beyond binary classification when both formulations are evaluated using the same compounds and data partitions. This question is relevant because antibacterial screening datasets are frequently imbalanced. Under severe class imbalance, conventional accuracy can be a misleading metric because a model can achieve a high score simply by assigning most compounds to the majority inactive class [
21]. To address this problem, metrics derived from precision–recall (PR) analysis are widely considered more informative than receiver operating characteristic (ROC) curves, as precision directly isolates the fraction of the predicted positives that are true actives [
21,
22,
23]. Recent virtual screening studies have emphasized positive predictive value (PPV) and top-k precision as practical indicators of hit-list utility [
8,
9], while enrichment-based metrics evaluate the critical early-recognition capability among top-ranked compounds [
24]. These metrics are therefore appropriate for retrospective evaluation of nomination quality under class imbalance, although their prospective operational value requires experimental confirmation.
In the present study, we conducted a retrospective methodological evaluation of the
P. aeruginosa disk diffusion QSAR benchmark established by Bugeac et al. [
20]. The central question was whether modeling the original IZ measurements as a continuous endpoint preserves assay-scale prioritization information that is not fully represented by a single binary activity definition. By retaining the same compounds and predefined training and external validation partitions, the study provides a matched comparison of endpoint formulations rather than a comparison confounded by different datasets.
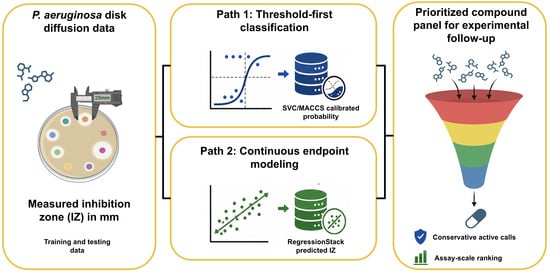
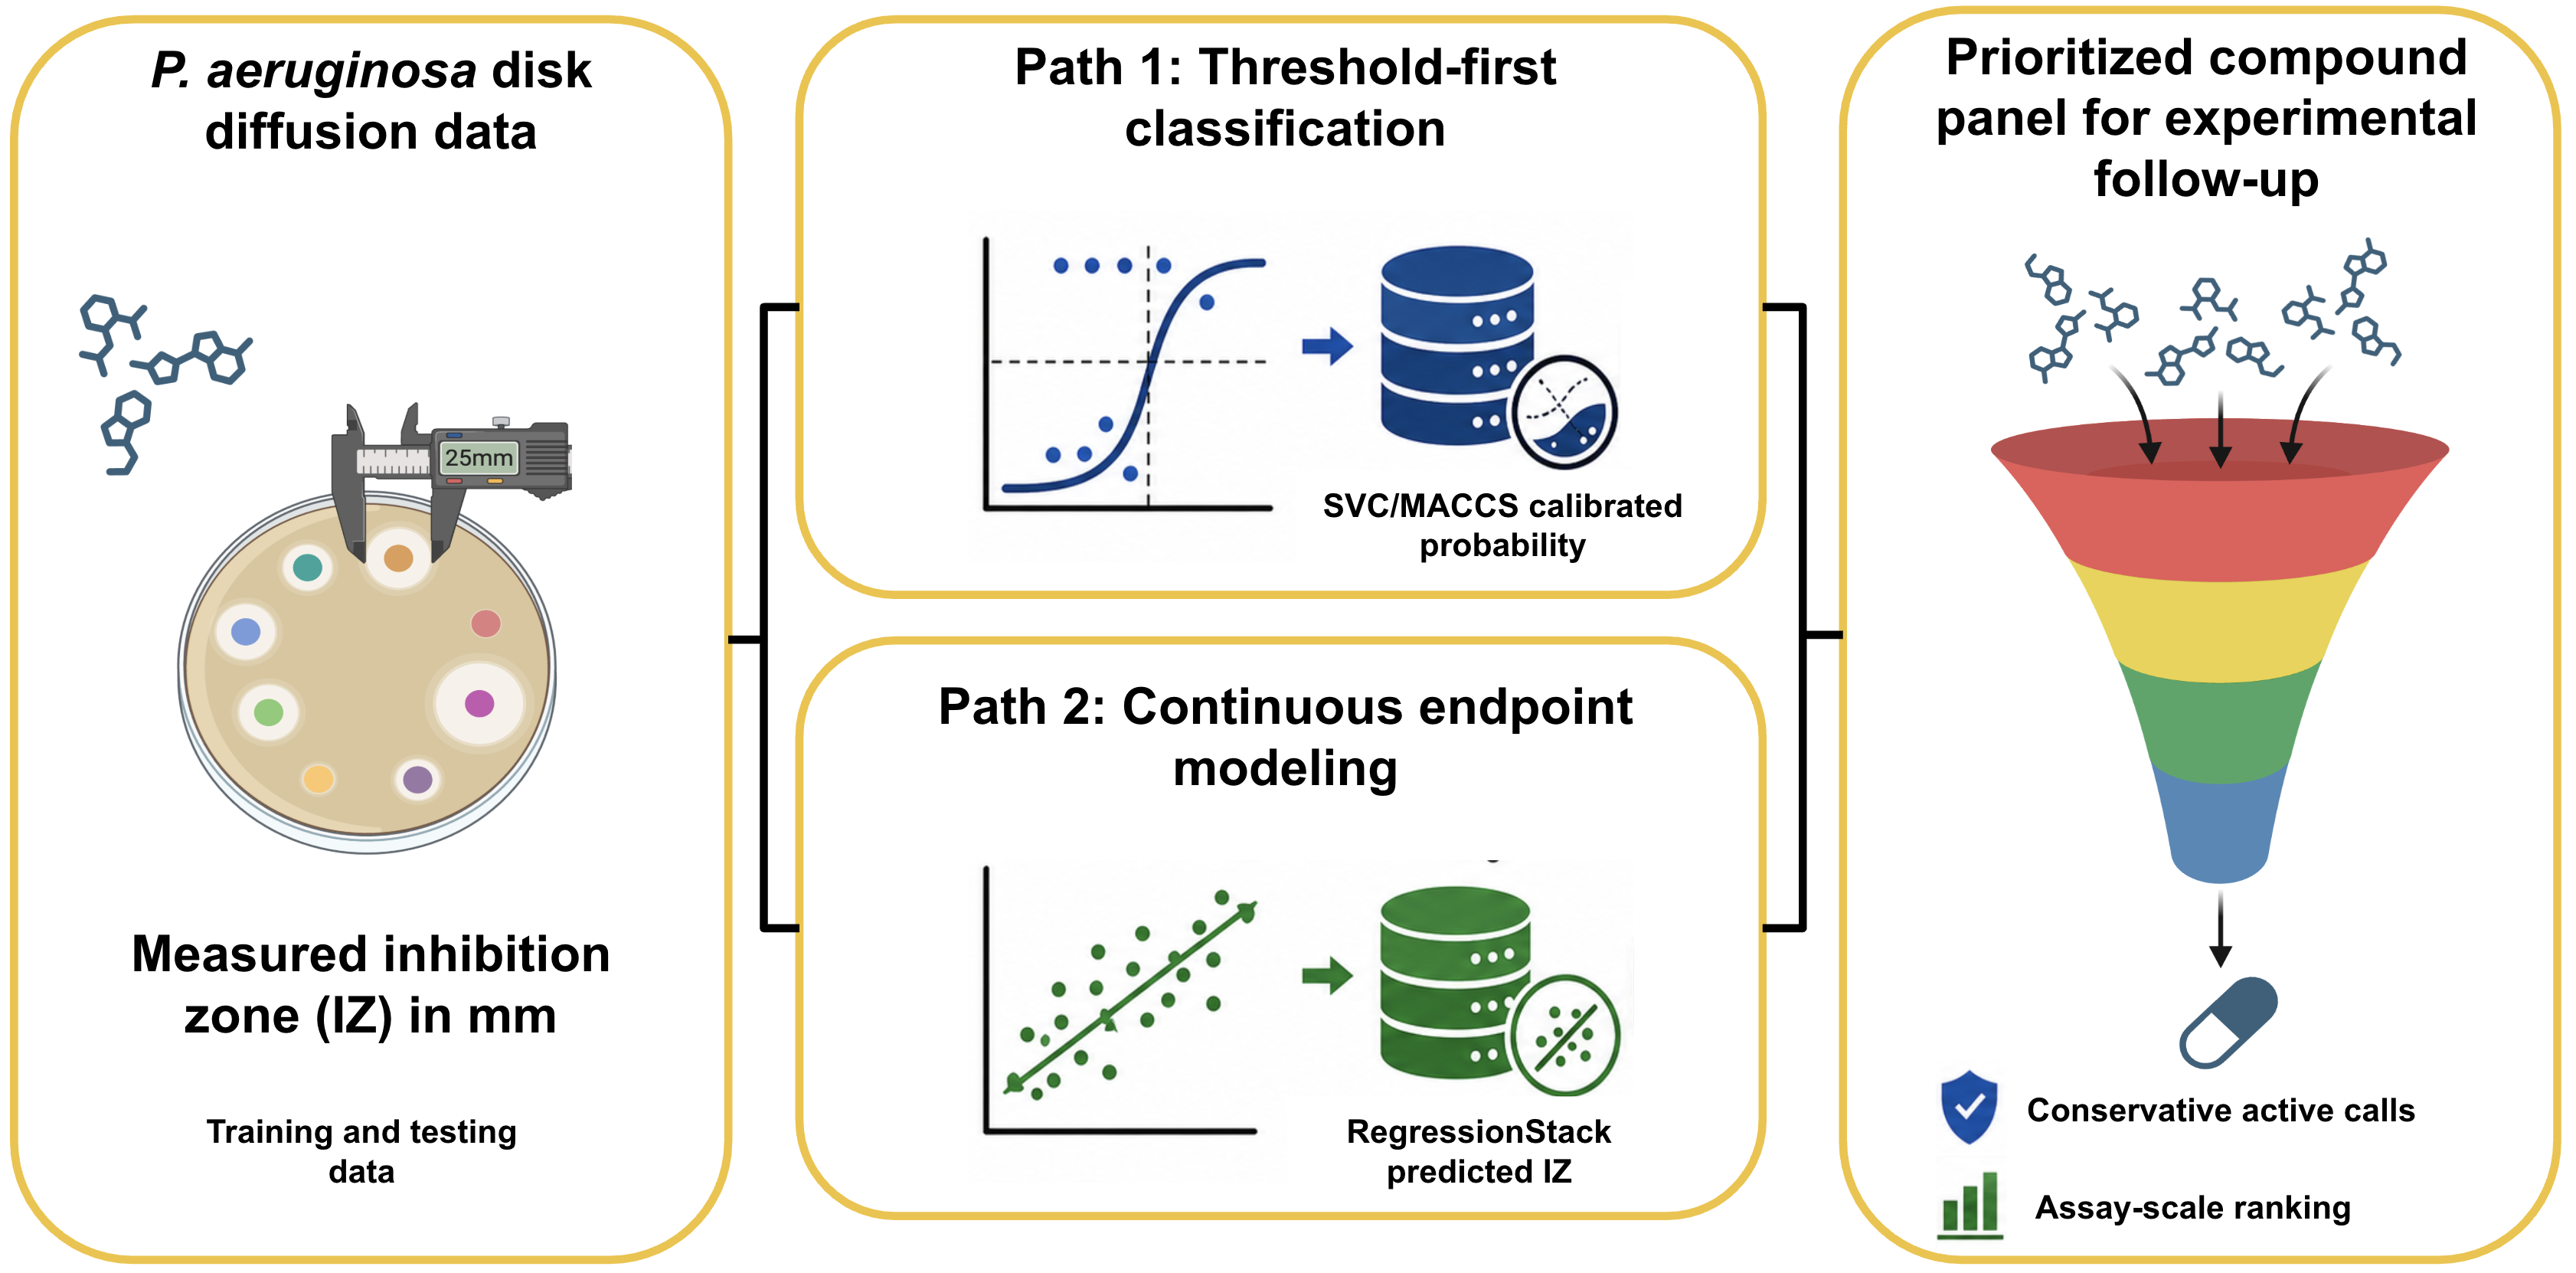
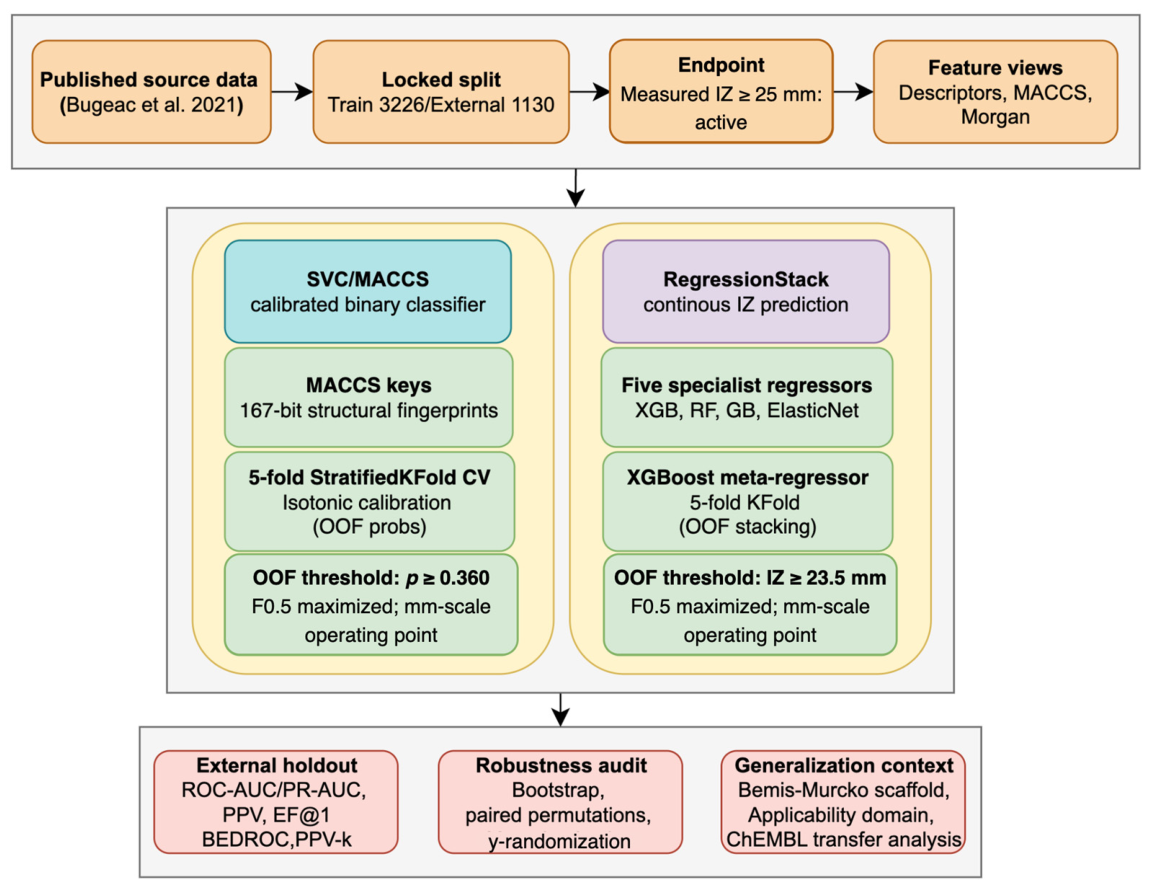
To evaluate this hypothesis, we established two distinct model roles. First, a calibrated support vector classifier (SVC) using Molecular ACCess System (MACCS) keys was used for conservative binary active calling under the benchmark threshold of IZ ≥ 25 mm. In parallel, a stacked regression framework (RegressionStack) was trained to predict continuous-IZ values as a threshold-flexible prioritization coordinate. Because conservative active calling and assay-scale prioritization are related but distinct virtual screening tasks, we investigated whether these two model outputs provided redundant or complementary decision information (
Figure 1). The proposed framework positions continuous-IZ modeling neither as a replacement for calibrated binary QSAR classification nor as a direct predictor of in vivo efficacy, but as a complementary strategy for early-stage
P. aeruginosa phenotypic-screening prioritization. The principal methodological contribution of this retrospective study is therefore a matched-data evaluation of two predefined modeling roles using the same experimentally measured disk diffusion endpoint, compound sets, and preserved training and external validation partitions, together with nomination-level analyses of their agreement and disagreement. The study evaluates retrospective predictive and prioritization behavior rather than prospective screening performance. No prospective experimental validation of model-nominated, previously unmeasured compounds was performed; all reported nomination metrics were calculated using compounds with existing experimentally measured IZ values.
3. Discussion
3.1. Matched-Data Evaluation of Complementary Model Roles
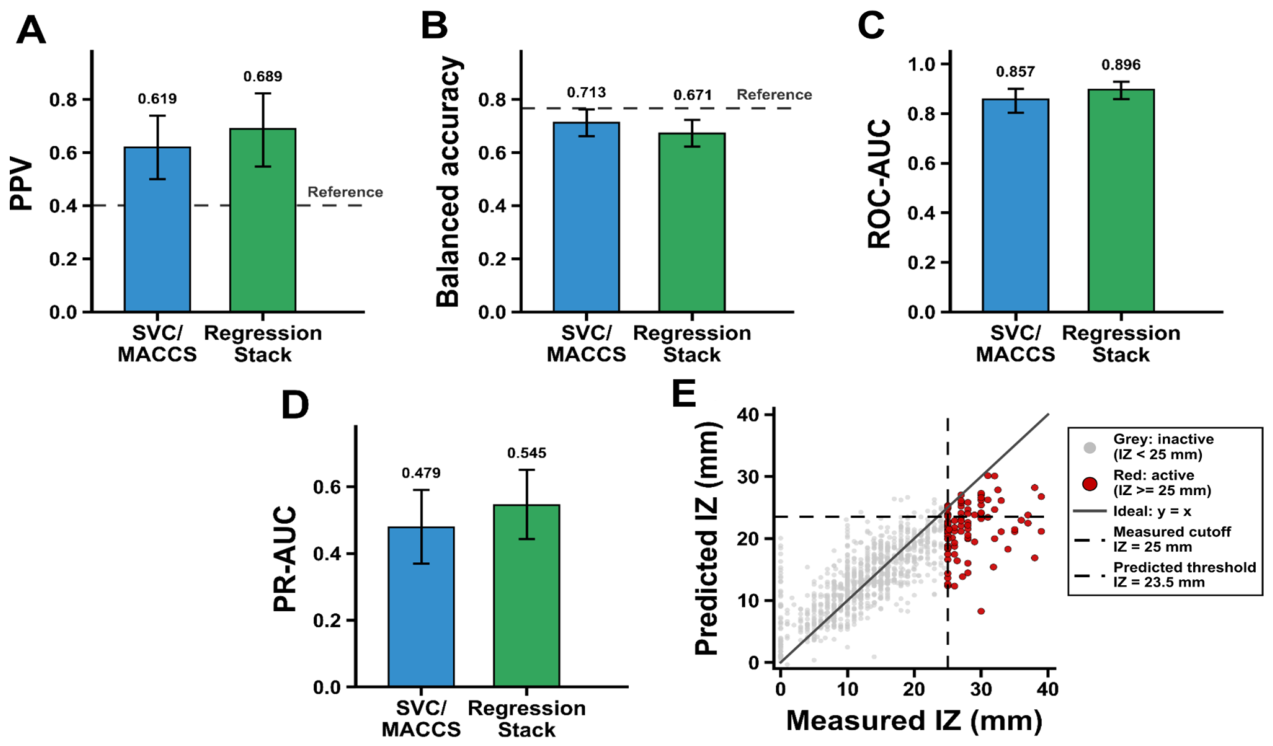
The principal methodological contribution of this study is a matched-data evaluation of two predefined QSAR roles using the same experimentally measured disk diffusion endpoint, compound sets, and preserved training and locked external validation partitions. SVC/MACCS was designed for precision-oriented active calling under the benchmark definition of measured IZ ≥ 25 mm, whereas RegressionStack used the continuous-IZ diameter as its training target and generated assay-referenced values for ranking and retrospective threshold analysis. The two outputs should therefore be interpreted as complementary computational views rather than as members of a statistically established performance hierarchy. Because the pipelines differ in endpoint formulation, model architecture, and molecular representation, the observed differences cannot be attributed solely to continuous versus binary endpoint treatment.
On the locked external benchmark, SVC/MACCS nominated 63 of 1130 compounds, including 39 measured actives, whereas RegressionStack produced capacity-dependent ranked and thresholded nomination sets. These results quantify retrospective PPV, enrichment, and nomination behavior under the evaluated data conditions. Whether comparable enrichment would be obtained when the workflows nominate previously unmeasured compounds remains a question for prospective experimental evaluation.
3.2. Performance Divergence, Error Structure, and Model Parsimony
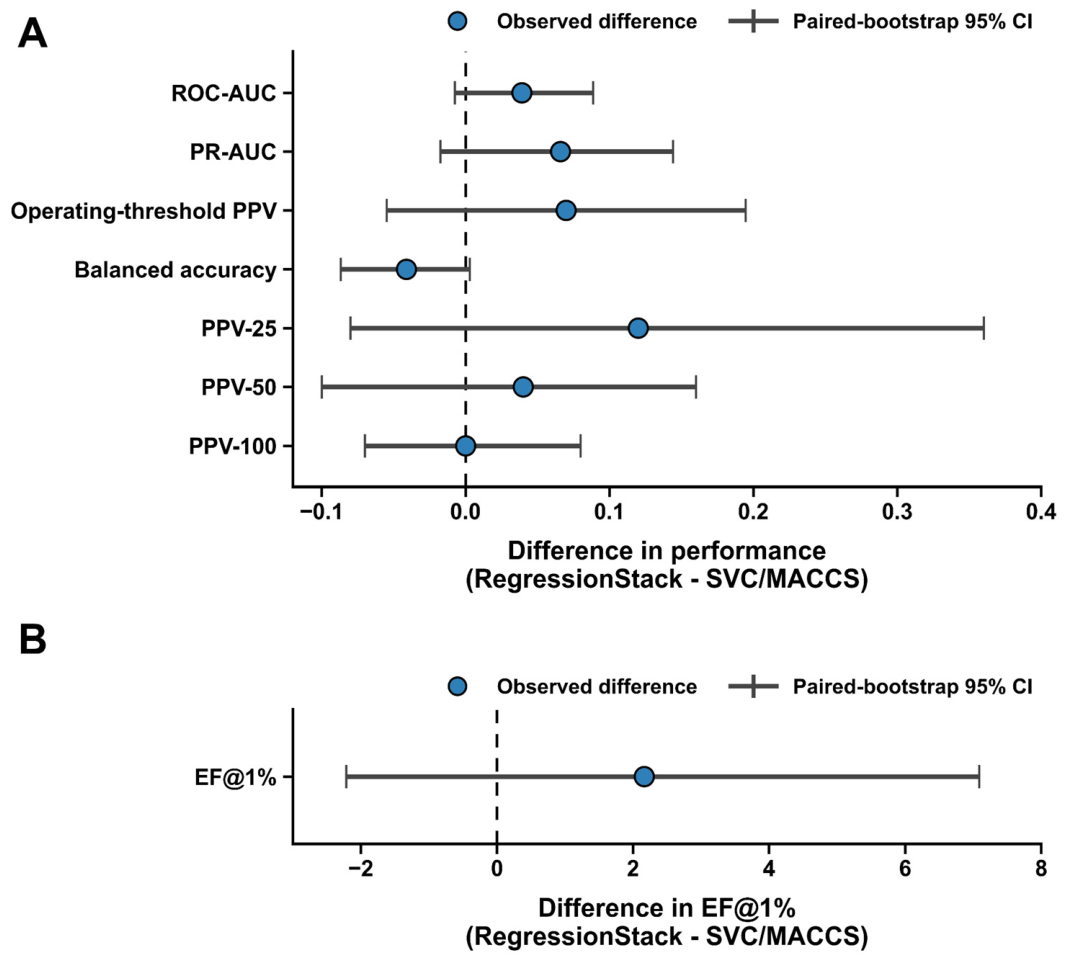
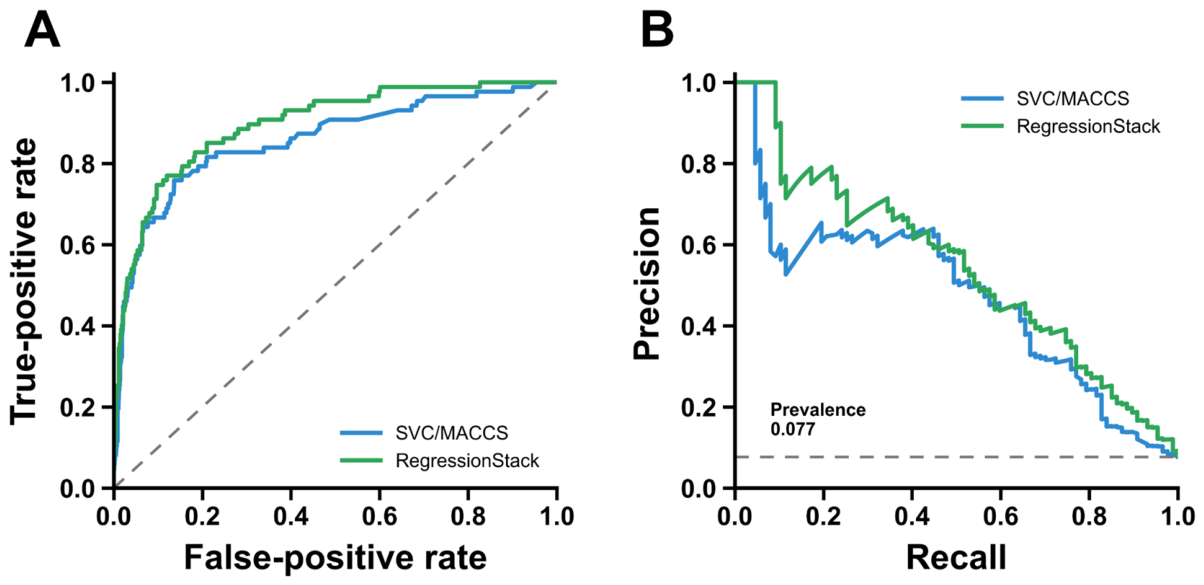
The RegressionStack achieved higher point estimates than the SVC/MACCS model across several threshold-independent and early-recognition metrics (ROC-AUC, PR-AUC, EF@1%, PPV-25). However, paired permutation tests and bootstrap confidence intervals spanning zero revealed that these numerical differences were not statistically significant (ROC-AUC: p = 0.501; PR-AUC: p = 0.442). Accordingly, the observed numerical differences were not statistically resolved on the available external set. The distinct contribution of RegressionStack in this analysis is its assay-referenced output and associated retrospective threshold and nomination analyses, rather than demonstrated superiority in discrimination.
Architecturally, RegressionStack reduced the external-set MAE from 3.38 to 3.20 mm, corresponding to a 5.3% reduction relative to the strongest single specialist regressor, XGBoost/MACCS. This modest continuous-error reduction should be weighed against the additional complexity of the stacked architecture. However, the present analyses do not establish that a single regressor is an equivalent replacement for RegressionStack. The SVC/Morgan sensitivity analysis evaluated molecular representation within the binary classifier and does not address replacement of the stacked regression architecture.
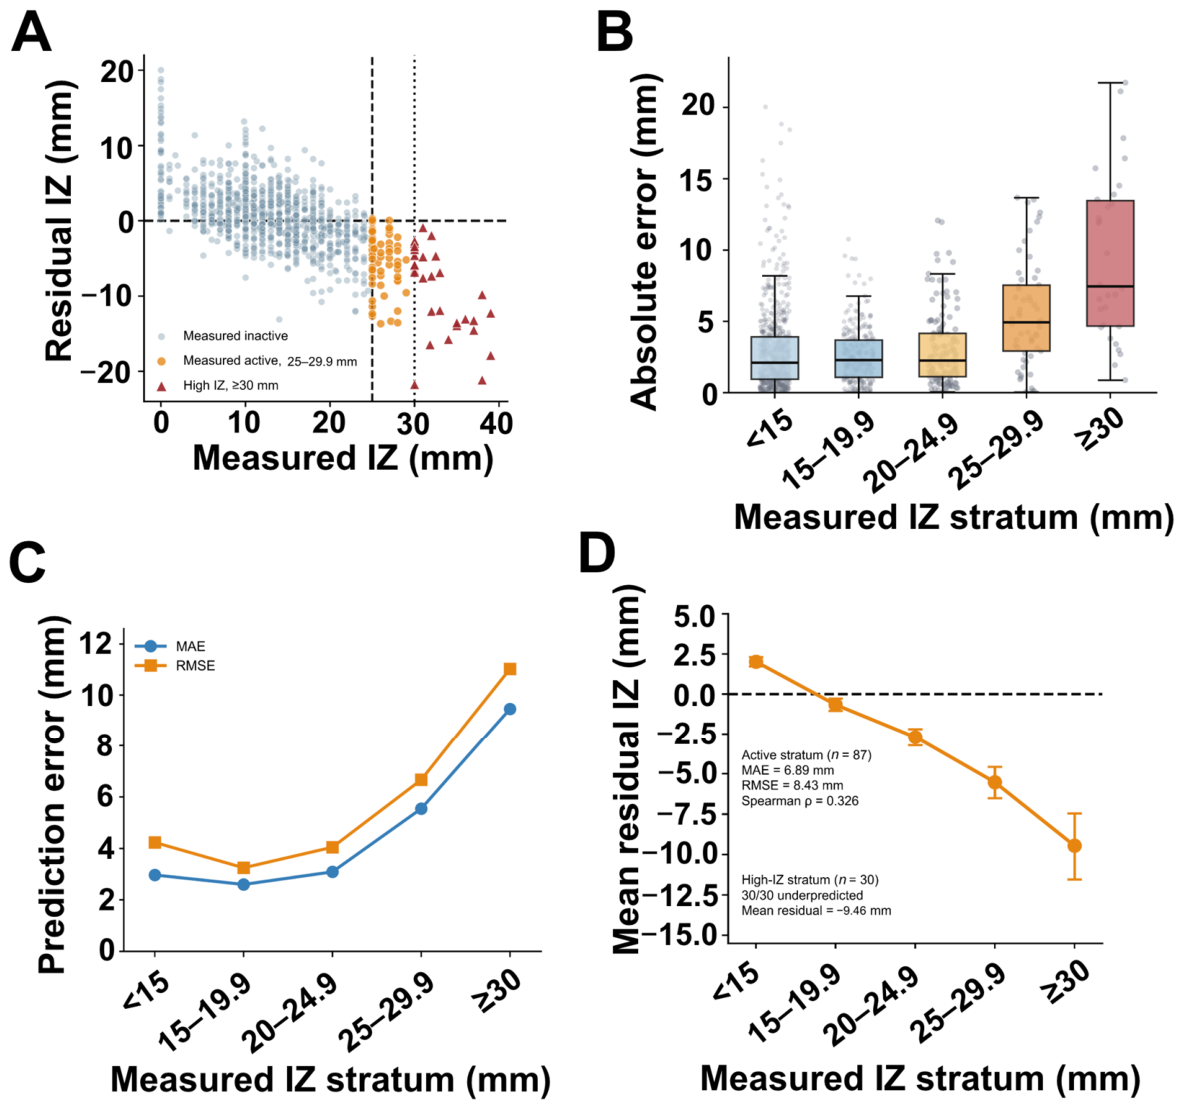
Moreover, the prediction error increased across the measured IZ range: the overall MAE of 3.20 mm increased to 6.89 mm in the measured-active stratum (IZ ≥ 25 mm) and to 9.46 mm among high-IZ compounds (measured IZ ≥ 30 mm). All 30 high-IZ compounds were underpredicted. This systematic compression and the modest within-active Spearman correlation of 0.326 indicate that the continuous model supports coarse retrospective prioritization within the evaluated domain but not for resolving small activity differences among measured-active compounds. Because disk diffusion is a composite phenotype reflecting antibacterial effects and agar-diffusion behavior, neither model output should be interpreted as a direct measure of MIC, intrinsic molecular potency, or clinical efficacy [
11,
12,
13].
3.3. Retrospective Hit-Tier Stratification and Nomination Complementarity
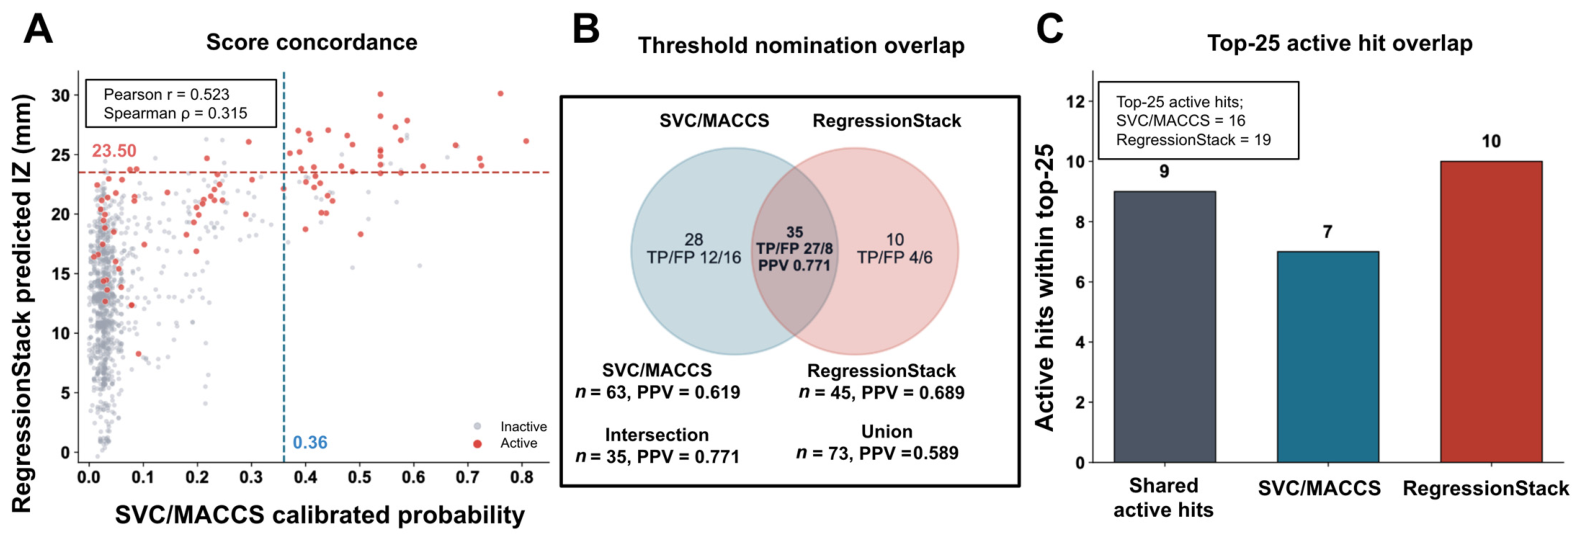
Nomination-level analysis provided the clearest evidence that the two workflows generated partially overlapping retrospective nomination sets. The consensus-positive tier contained 27 active compounds among 35 compounds, corresponding to a PPV of 0.771, whereas the SVC/MACCS-only and RegressionStack-only tiers yielded PPVs of 0.429 and 0.400, respectively.
Label-permutation analysis confirmed that all three tiers recovered significantly more actives than expected by chance (p < 0.05). Because 24 of the 38 model-specific discrepant nominations exceeded the predefined near-boundary criteria, disagreement was not confined to compounds immediately adjacent to the operating thresholds. This margin analysis does not identify the structural basis of disagreement or quantify prediction confidence. Extreme score discordance alone did not isolate an enriched subset. Under the evaluated retrospective conditions, the consensus-positive set represented the highest-PPV tier, whereas the model-specific sets represented lower-PPV but significantly enriched exploratory tiers. These designations describe retrospective nomination performance and do not establish prospective confidence or validation priority.
3.4. Robustness, Transferability, and ADs
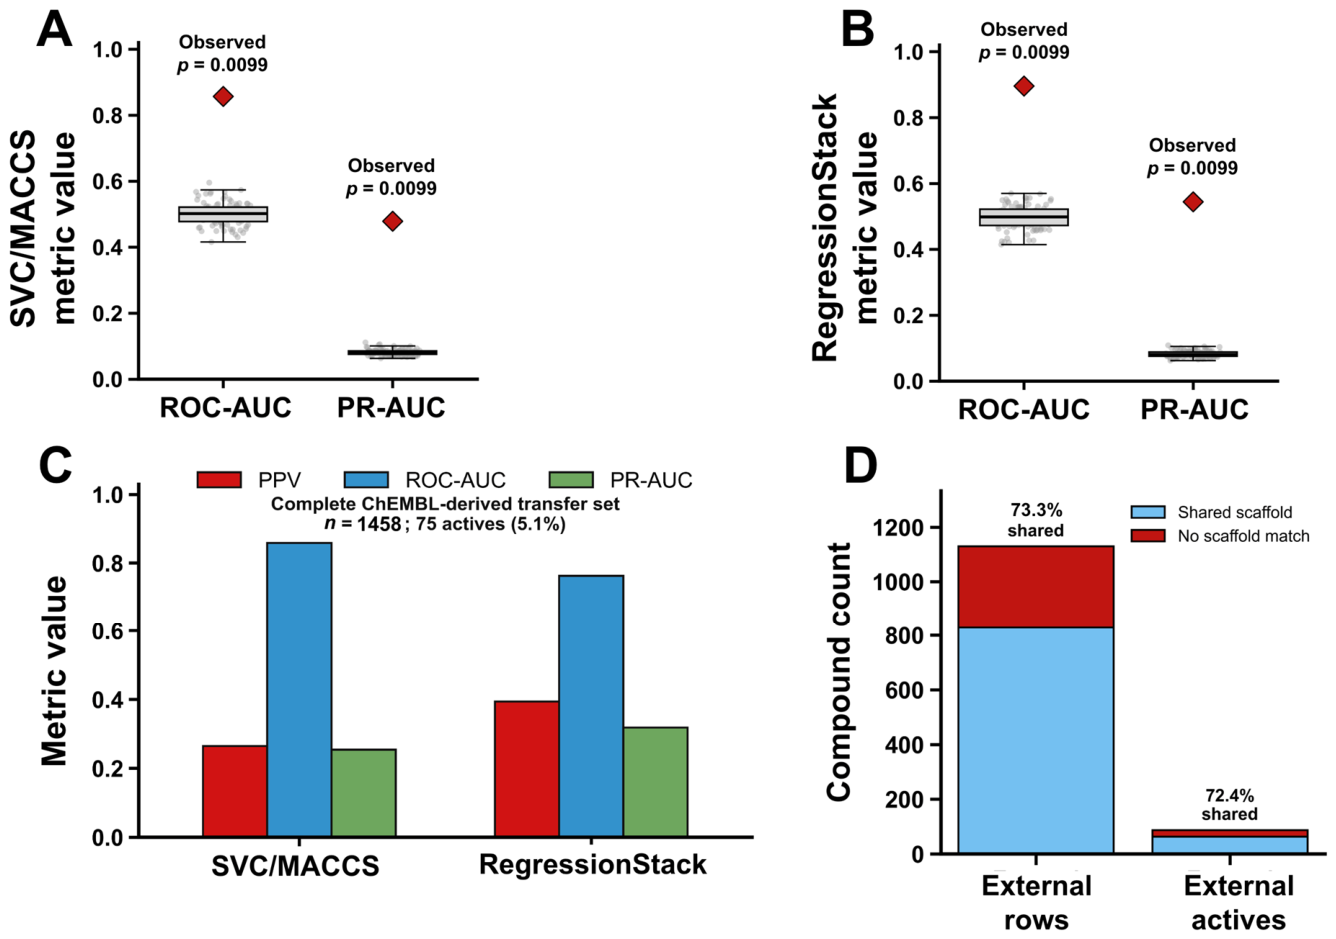
The y-randomization null distributions were well below the observed values, supporting that the measured performance was unlikely to arise from randomized label or target associations under the implemented tests. In the separately assembled ChEMBL-derived transfer set, SVC/MACCS maintained threshold-independent discrimination, whereas RegressionStack retained early enrichment under greater chemical and assay-condition heterogeneity. Reconstructing the descriptor panel introduced numerical drift in 32 of 199 features but produced only small source-holdout prediction differences (mean absolute difference between reconstructed and saved predictions = 0.063 mm). However, the lower operating-point precision observed in the transfer set highlights that thresholds optimized on a single benchmark require dataset-specific empirical recalibration [
38].
Active enrichment persisted under scaffold-grouped cross-validation (EF@1% of 6.52 ± 0.71 for SVC/MACCS; 8.28 ± 1.18 for RegressionStack). However, broader discrimination metrics declined relative to out-of-fold evaluation, indicating that both models rely on structurally related chemotypes in the training data. This is consistent with the external validation set, where 73.3% of the compounds shared a Bemis–Murcko scaffold with the training set, and all nominated hits fell within the Morgan/Tanimoto AD. The present evidence therefore supports retrospective prioritization primarily within the represented chemical domain; performance for unrelated or substantially novel scaffold spaces remains unestablished.
3.5. Mechanistic Plausibility and Activity Cliffs
Influential MACCS keys identified by feature attribution captured heteroatom-containing, ring-associated, polar/ionizable, and halogenated motifs. These features align with known Gram-negative permeation rules and agar diffusion physics, though they represent statistical associations rather than causal mechanisms of action [
13,
31,
32,
33,
34,
35]. Additionally, the identification of 55 highly similar compound pairs possessing localized IZ differences ≥ 10 mm highlights structural discontinuities within the dataset. These local activity cliffs are intrinsically difficult for both classification and regression topologies to resolve [
36,
37]. Reflecting either genuine biological shifts, diffusion anomalies, or experimental variance, these activity-cliff pairs may be suitable candidates for targeted experimental re-evaluation, but the current associative analyses do not establish their mechanistic basis.
3.6. Study Limitations and Future Directions
This study is a retrospective computational evaluation of published, experimentally measured disk diffusion records and a separately assembled ChEMBL-derived transfer set. No prospective experimental testing of compounds newly nominated by these workflows was performed; all reported nomination metrics were calculated retrospectively using compounds with existing experimentally measured IZ values. Accordingly, the observed PPV, enrichment, ranking, and nomination-overlap results quantify performance under the evaluated data conditions but do not establish prospective hit rates, reduced experimental workload, improved discovery yield, or pharmacological efficacy.
Several additional considerations bound the interpretation of the findings. First, the two pipelines differed not only in endpoint formulation but also in model architecture and molecular representation; consequently, the analysis does not isolate continuous versus binary endpoint treatment as the sole cause of their performance or nomination differences. Second, the locked external set functioned primarily as a defined-domain benchmark: 73.3% of the external compounds shared a Bemis–Murcko scaffold with the training set, and broader performance declined under repeated scaffold-grouped validation. Performance in substantially different or unrelated chemical space therefore remains unestablished. Third, RegressionStack systematically underpredicted compounds with high measured IZ values and showed modest ordering within the measured-active subset; predicted IZ should therefore be interpreted as a coarse prioritization coordinate rather than a millimeter-accurate estimate. Fourth, disk diffusion IZ is a composite phenotype influenced by antibacterial activity, agar diffusion, and physicochemical properties and is not a direct surrogate for MIC, intrinsic molecular potency, clinical susceptibility, or in vivo efficacy. Fifth, the ChEMBL-derived transfer set exhibited greater chemical and assay-condition heterogeneity, and the RegressionStack transfer analysis additionally relied on Mordred-reconstructed descriptors that showed numerical drift in 32 of 199 columns. Although prediction agreement on the source-paper external set remained close, the absolute RegressionStack transfer metrics should therefore be interpreted as descriptor-reconstruction and cross-dataset transfer sensitivity estimates rather than exact descriptor-transfer performance.
Future work should prospectively evaluate prespecified consensus-positive and model-specific nominations among compounds lacking pre-existing IZ measurements. Such evaluation should use standardized disk diffusion and MIC assays; include scaffold-novel compounds; prespecify the nomination rules, operating thresholds, and experimental budget; and report prospective hit rates and the experimental workload directly. This would determine whether the retrospective enrichment and nomination-tier structure observed here translate into improved compound selection under prospective screening conditions.
4. Materials and Methods
4.1. Study Design, Dataset, and Endpoint Definition
We conducted a retrospective ligand-based QSAR evaluation using experimentally measured disk diffusion IZ records originally curated by Bugeac et al. [
20]. The primary objective was to compare the retrospective predictive and nomination behavior of two predefined modeling roles using the same compounds and preserved training and external validation partitions.
To address this objective, two modeling strategies were evaluated, each corresponding to a distinct screening method. The first approach employs a calibrated binary classifier designed for conservative active/inactive calling under the source benchmark activity definition. The second implemented a regression-first model in which IZ values were treated as a continuous variable, and binary thresholding was deferred until after prediction, allowing predicted-IZ values to be used directly as screening triage coordinates. This design follows QSAR best-practice principles regarding endpoint definition, external validation, AD, and alignment between model evaluation and intended practical use [
6,
7], which is consistent with recent benchmarking recommendations emphasizing that virtual screening evaluation should consider dataset quality, featurization, metrics, and data splits [
8]. Because the intended application is virtual screening prioritization, evaluation is extended beyond conventional classification metrics to include nomination-set metrics, including PPV-k, top-k precision, and EFs, for imbalanced screening datasets [
8,
9,
24].
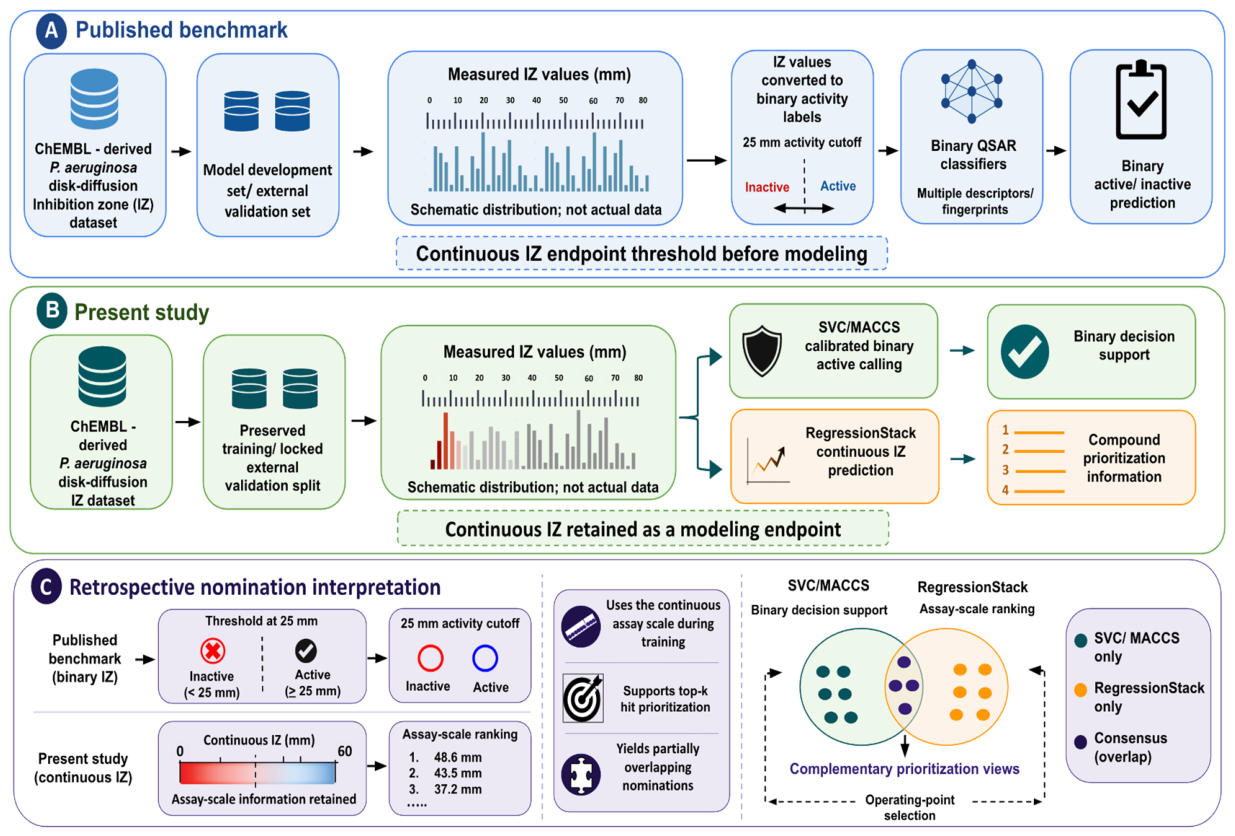
To preserve direct comparability with the published benchmark and minimize external-set leakage, we retained the original training and external validation split. All model selection procedures, probability calibration, threshold optimization, and stacked-model meta-learning were performed exclusively using training data or training out-of-fold prediction. The external validation set remained completely locked during model development and was used only for the final performance estimation. The integrated workflow is shown in
Figure 11.
The chemical structures and corresponding IZ measurements were obtained from the supplementary datasets provided by Bugeac et al. [
20]. The source study curated disk diffusion assay data for
P. aeruginosa from the ChEMBL bioactivity database [
28] and reported fixed training and external validation partitions.
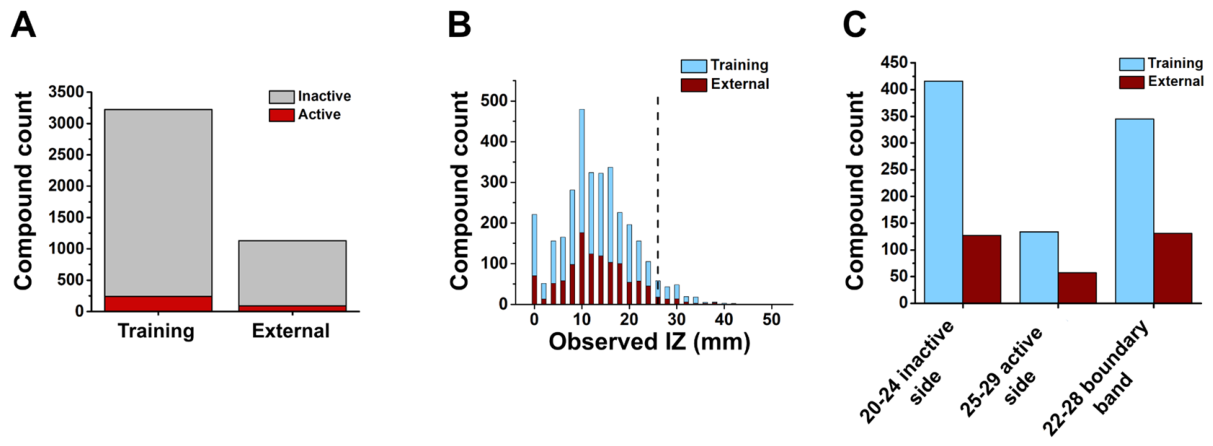
To ensure a direct comparison with the established benchmark, we used the original training and external validation partitions without any reassignment. The training set comprised 3226 compounds, including 240 active and 2986 inactive compounds, whereas the external validation set contained 1130 compounds, including 87 active and 1043 inactive ones. The active prevalence was 7.44% in the training set and 7.70% in the locked external validation set, representing the rare-positive structure typical of early-stage antibacterial virtual screening.
The primary experimental endpoint was the IZ measured in millimeters. To maintain direct comparability with the source benchmark, a binary activity label was established using the source’s 25 mm IZ cutoff. Compounds with an IZ ≥ 25 mm were classified as active (y = 1), while those with IZ < 25 mm were classified as inactive (y = 0).
This binary classification was applied to the SVC/MACCS classifier and all threshold-dependent performance evaluation. Conversely, continuous-IZ values were retained for the regression-first modeling pipeline to support compound ranking and assay-scale threshold exploration. The IZ ≥ 25 mm cutoff was used solely as the benchmark-specific activity definition and does not represent a Clinical and Laboratory Standards Institute (CLSI) susceptibility breakpoint.
4.2. Chemical Curation and Molecular Representation
We treated the source-paper training and external validation workbooks as curated benchmark datasets and maintained the original compound assignments between splits. Chemical validity, canonicalization, and duplicate verification were performed using the RDKit, an open-source cheminformatics toolkit [
39]. The processed benchmark files included a training set and an external validation set, both consisting exclusively of valid, unique canonical Simplified Molecular Input Line Entry System (SMILES) strings with no missing IZ values or exact canonical duplicates.
To preserve the fidelity of the source benchmark data, no additional structural standardization procedures were applied, including salt stripping, tautomer enumeration, charge neutralization, or stereochemical collapse. A structure-format audit confirmed the absence of dot-disconnected salt or mixture records in either split. Stereochemical markers were identified in 206 training and 81 external structures, directional bond markers in 675 training and 250 external structures, and explicit bracket-charge annotations in 399 training and 137 external structures. No non-numeric or missing entries were detected across the 199 source descriptor columns in either of the splits. For the generated extended RDKit descriptors, columns with more than 20% missing values in the training set were removed, remaining missing or infinite values were median-imputed, and zero-variance columns were excluded. All filtering and imputation parameters were derived from the training set and applied to the external validation and transfer sets, where applicable, to prevent cross-set leakage.
Molecules were represented using fixed source-paper descriptors and molecular features derived from SMILES. The original workbooks provided 199 descriptor columns after excluding metadata and endpoint fields. Additional molecular features were generated using RDKit. Morgan fingerprints were calculated as 2048-bit circular fingerprints with a radius of 2 [
40,
41]. MACCS structural keys were generated as 167-position RDKit vectors, in which bit 0 was unused and positions 1–166 corresponded to the public MACCS key definitions described by Durant et al. [
42]. These keys were selected because they provide sparse structural encoding with partial interpretability, using predefined substructure patterns. The molecular features were computed separately for each split of the dataset.
The software versions used for molecular curation, feature generation, and model fitting are listed in
Table S13 in the
Supporting Information. The original 199 source-paper descriptor columns were used directly for the primary benchmark analyses and were not re-generated. For the ChEMBL-derived RegressionStack transfer analysis, these descriptor columns were reconstructed using the exact descriptor name using Mordred. Because 32 of the 199 reconstructed descriptor columns showed numeric drift relative to the original source workbook, the RegressionStack transfer results were interpreted as a descriptor-reconstruction sensitivity analysis rather than as an exact descriptor transfer.
4.3. Model Training, Cross-Validation, and Hyperparameter Selection
All operating threshold selection and stacked-model meta-learning procedures used training data and training-derived out-of-fold predictions only; the locked external validation set was reserved for final performance estimation. For SVC/MACCS, the selected configuration was used to generate calibrated out-of-fold probabilities by five-fold shuffled stratified cross-validation with random seed 42. Within each outer-training partition, isotonic calibration used five-fold internal cross-validation. For RegressionStack, specialist-regressor and meta-regressor out-of-fold predictions were generated using five-fold shuffled cross-validation with random seed 42. The same fold definitions were used across specialist regressors, and stratification was not applied because the primary regression target was continuous IZ. A stage-by-stage summary is provided in
Table S14.
To maintain methodological consistency, the same fold definitions were used across all the RegressionStack specialist regressors during the generation of the meta-regressor training data. This ensured that each meta-model training value was derived from specialist predictions for compounds not used during the fitting of the corresponding models. After out-of-fold predictions were generated, all final specialist models were refitted to the complete training set and applied once to the locked external validation set.
The detailed model configurations and hyperparameter settings are presented in
Table S15. These included the SVC kernel and regularization parameter C; XGBoost parameters such as the number of estimators, maximum depth, learning rate, subsampling, column sampling, and regularization settings; random forest tree and feature sampling parameters; gradient-boosting parameters; ElasticNet regularization strength (α) and L1 mixing ratio (l1_ratio); calibration settings; and all associated random seeds.
SVC/MACCS hyperparameters were selected by three-fold stratified randomized search within the full training set. RegressionStack specialist and meta-regressor hyperparameters were selected using five-fold randomized searches, followed by five-fold out-of-fold prediction generation for stack construction and operating threshold selection. Because hyperparameter selection was not nested within the out-of-fold-generation folds, training-side out-of-fold estimates may be optimistic relative to a fully nested design. This limitation does not affect the independence of the locked external validation results because final configurations and operating thresholds were fixed before the models were refitted on the complete training set and applied to the external set.
4.4. Model Architectures
4.4.1. Calibrated Binary SVC/MACCS Classifier
The primary binary classifier used an SVC model trained on MACCS keys and calibrated via isotonic regression. SVCs, a specific implementation of support vector machines (SVMs), are max-margin classifiers for two-group classification [
43] and were implemented using the scikit-learn library [
44]. Isotonic calibration was used to convert raw classifier scores into probability estimates; both isotonic and sigmoid calibration approaches have been characterized for supervised classifiers [
45,
46].
SVC/MACCS was selected as the primary binary classifier based on the training out-of-fold performance, MACCS-key interpretability, and calibrated probability outputs suitable for screening decision support. The final probability threshold was determined from training out-of-fold predictions by maximizing the F0.5 score, which prioritizes precision over recall. The selected operating threshold was a probability of ≥0.360.
4.4.2. RegressionStack Continuous-IZ Model
RegressionStack was designed to predict continuous-IZ values and use these predictions as a threshold-flexible prioritization coordinate before applying any binary operating thresholds. This model follows the stacked generalization framework [
47] and comprises five first-level specialist regressors: an XGBoost regressor trained on source-paper descriptors [
48], a random forest regressor on Morgan fingerprints [
49], a gradient boosting regressor on Morgan fingerprints [
50], an XGBoost regressor on MACCS keys, and an ElasticNet regressor on source-paper descriptors [
51]. Specialist out-of-fold predictions were then combined using an XGBoost meta-regressor to generate the final predicted-IZ output.
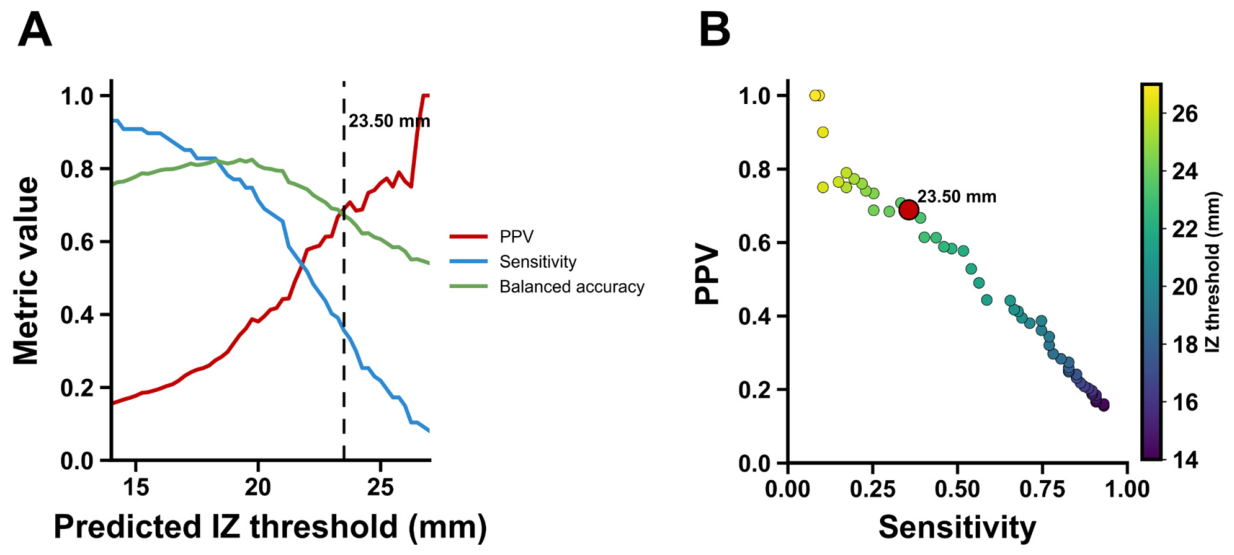
The primary RegressionStack operating threshold of predicted IZ ≥ 23.50 mm was selected from training out-of-fold predicted values by maximizing F0.5 against the binary IZ ≥ 25 mm activity label. This threshold served as a model operating point, and the ground-truth activity definition remained measured IZ ≥ 25 mm throughout the study period.
4.4.3. SVC/Morgan Descriptor-Representation Sensitivity Analysis
To assess whether the primary binary SVC/MACCS comparator was disadvantaged by the use of relatively simple MACCS structural keys, we performed an additional descriptor-representation sensitivity analysis using Morgan fingerprints. The SVC/Morgan model used 2048-bit Morgan fingerprints with radius 2 and the same binary activity definition as the primary classifier, measured IZ greater than or equal to 25 mm. Model selection, isotonic calibration, and operating threshold selection were performed using training set data and training out-of-fold predictions. The locked external validation set was used only after the SVC/Morgan pipeline and the operating threshold were fixed. This analysis was used as a sensitivity comparison for descriptor representation and was not used to redefine primary binary comparators.
4.5. Performance Metrics, Residual Diagnostics, and Calibration
The model performance on the locked external validation set was evaluated using continuous-target metrics, threshold-dependent classification metrics, threshold-independent ranking metrics, screening-oriented nomination metrics, and probability-calibration metrics, where applicable.
For continuous-IZ prediction, we calculated the RMSE, MAE, R
2, Pearson’s correlation, Spearman’s rank correlation, and Lin’s CCC. The CCC was included because it jointly captures the correlation and systematic bias between the measured and predicted values [
52,
53].
To evaluate whether the RegressionStack error varied across the measured IZ range, residual diagnostics were performed on a locked external validation set. Residuals were defined as the predicted IZ minus the measured IZ; thus, negative residuals indicated underprediction. Error metrics were summarized across measured IZ bins of less than 15 mm, 15–19.9 mm, 20–24.9 mm, 25–29.9 mm, and greater than or equal to 30 mm. The measured IZ greater than or equal to 25 mm subset was additionally evaluated as the active stratum, and the measured IZ greater than or equal to 30 mm subset was evaluated as the high-IZ stratum. Pearson and Spearman correlations were also calculated within the active stratum to assess whether the predicted IZ retained within-active ordering information despite the increased absolute error.
Because the residual diagnostics indicated systematic high-IZ underprediction, a training-only monotonic calibration sensitivity analysis was performed for the RegressionStack predicted-IZ values. Four candidate mappings were evaluated using training out-of-fold prediction pairs only: identity, ordinary least squares linear calibration, robust Huber linear calibration, and isotonic calibration. Calibration selection used repeated internal validation across the same five measured IZ bins, with the macro-averaged bin-wise MAE as the primary criterion and the overall MAE retained as a safety check. The locked external validation set was not used for calibration selection; the selected mapping was applied to the external set only after the calibration rule had been fixed. This analysis was used to test whether high-IZ underprediction reflected a correctable monotonic scale-calibration artifact rather than defining a new primary model.
Threshold-dependent binary classification performance was evaluated using the PPV, sensitivity, specificity, balanced accuracy, F0.5, F1, and Matthews correlation coefficient (MCC). The MCC was retained as a threshold-dependent performance metric.
For threshold-independent ranking, we assessed the ROC-AUC and PR-AUC. The PR-AUC was emphasized because active compounds are rare, and this metric is more informative than the ROC-AUC under a strong class imbalance [
22,
23]. Screening-oriented nomination performance was evaluated using PPV-k, top-k active recovery, and enrichment over random expectation at fixed hit-list sizes of k = 25, 50, and 100. These metrics are analogous to the PPV-N criteria proposed for virtual screening workflows with limited experimental capacity [
8] and are consistent with broader recommendations for evaluating virtual screening methods [
54]. Early recognition was additionally summarized using an EF@1% and BEDROC with α = 20.0 [
24]. The α = 20.0 parameter was selected because it corresponds to exponential decay weighting that concentrates scoring emphasis on approximately the top 8% of the ranked list, a stringency level appropriate for virtual screening settings in which only a small fraction of nominated compounds can be advanced to experimental testing [
24]. BEDROC was treated as a secondary metric because it depends on the user-defined α parameter and is less directly interpretable than nomination-set precision [
8].
Probability calibration was evaluated for SVC/MACCS using the Brier score, log loss, and ECE computed over ten fixed-width probability bins spanning the probability interval from 0 to 1 [
38,
45,
46]. Probability-calibration metrics were not applied to RegressionStack because the predicted-IZ values were not probabilities.
The metric interpretation was aligned with the screening task. PPV quantified hit-list purity among nominated compounds; sensitivity quantified the fraction of true actives recovered; specificity quantified rejection of inactive compounds; balanced accuracy averaged sensitivity and specificity under class imbalance; F0.5 summarized a precision-weighted threshold tradeoff; F1 summarized the equal precision–recall tradeoff; and MCC summarized binary prediction agreement while accounting for all four confusion-matrix cells. For continuous-IZ prediction, MAE and RMSE quantified the prediction error in millimeters, R2 quantified the explained variance, Pearson r and Spearman ρ quantified linear and rank agreement, and CCC quantified concordance while penalizing systematic bias. For ranking, ROC-AUC measures the global ordering of actives above inactives, whereas PR-AUC, PPV-k, EFs, and BEDROC emphasize active recovery in rare-positive screening settings. The Brier score, log loss, and ECE assessed whether the calibrated probability outputs matched the observed active frequencies, which is important for threshold-based decision support.
4.6. Statistical Validation and Model-Difference Uncertainty
Uncertainty in external validation performance estimates was assessed using bootstrap resampling with 1000 resamples of the locked external validation set [
25]. Model comparison was first conducted using paired permutation tests for the ROC-AUC and PR-AUC. Because paired permutation
p-values alone do not quantify the magnitude or uncertainty of model differences, paired bootstrap confidence intervals were additionally calculated for RegressionStack minus SVC/MACCS performance differences using 10,000 paired resamples of the locked external validation set. In each bootstrap iteration, the same resampled compound indices were applied to both models, preserving the paired structure of the comparison. Confidence intervals were calculated for ROC-AUC, PR-AUC, EF@1%, PPV, balanced accuracy, and top-k PPV. These paired bootstrap intervals were used to assess whether the observed point estimate differences supported model-wide superiority or were more appropriately interpreted as uncertain descriptive differences.
To test whether the observed performance exceeded the randomized label or randomized target null distributions, y-randomization was performed as a standard QSAR null test [
26,
27]. For SVC/MACCS, the binary training labels were randomly permuted before retraining. For RegressionStack, continuous training IZ values were permuted, followed by retraining of all specialist regressors and the meta-regressor under fixed hyperparameters. Each experiment comprised 100 permutations, with empirical
p-values calculated using a plus-one correction method. Therefore,
p = 0.0099 represents the minimum attainable empirical
p-value for 100 permutations and indicates that no randomized model matched or exceeded the corresponding observed metric. These tests were interpreted as evidence against chance correlation, rather than as high-resolution significance estimates.
For the descriptor-representation sensitivity analysis, the same paired bootstrap procedure was applied to differences defined as SVC/Morgan minus SVC/MACCS using 10,000 paired resamples of the locked external validation set. Confidence intervals were calculated for PPV, ROC-AUC, PR-AUC, EF@1%, and PPV-25 using identical resampled compound indices for both representations. Balanced accuracy, PPV-50, and PPV-100 were reported descriptively because paired bootstrap confidence intervals were not calculated for these metrics.
4.7. Scaffold-Grouped Validation and Applicability Domain Analysis
The chemical space overlap between the training and external validation sets was assessed using canonical SMILES and Bemis–Murcko scaffolds [
55]. Scaffold and AD analyses were included because nominal external sets often assess interpolation within the represented chemical series rather than extrapolation to novel chemotypes [
6,
7,
56]. To evaluate the model performance under stricter scaffold separation, repeated scaffold-grouped validation was performed using Bemis–Murcko scaffold groups generated from canonical SMILES. Acyclic compounds were assigned fallback scaffold groups based on their achiral canonical SMILES to avoid the collapse of all acyclic molecules into a single artificial group. Scaffold-grouped validation was performed using five folds and three repeated group-stratified splits with random seeds 42, 101, and 202, while ensuring that compounds sharing the same scaffold group did not appear in both training and held-out folds.
For SVC/MACCS, the primary binary classification pipeline was re-evaluated under scaffold-grouped validation using the same modeling framework, isotonic calibration strategy, and precision-weighted F0.5 threshold-selection criterion. For the RegressionStack, a near-exact fixed-architecture scaffold-grouped sensitivity analysis was performed. The original five-specialist stacked architecture and XGBoost meta-regressor were retained and retrained within each scaffold-grouped outer fold, but the manuscript hyperparameter settings were kept fixed rather than repeating the full randomized hyperparameter-search procedure in every fold. Fold-specific operating thresholds were selected using only outer-training predictions. These scaffold-grouped analyses were used to assess whether active enrichment survived scaffold separation, not to replace the locked external validation benchmarks.
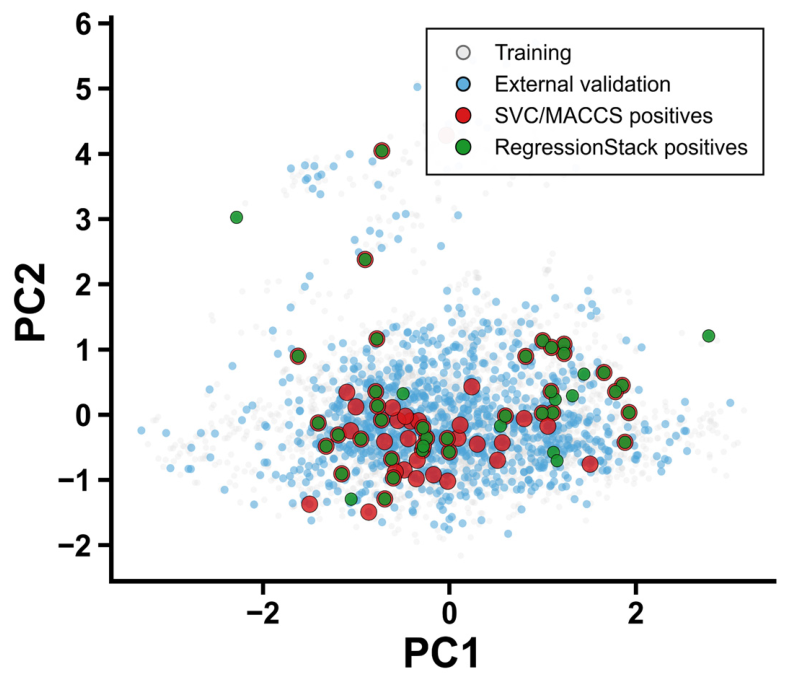
The chemical space structure was visualized using principal component analysis (PCA) of the molecular fingerprints. The AD was defined by the nearest-neighbor Tanimoto similarity to the training set, computed using 2048-bit Morgan fingerprints with a radius of 2. External compounds with a maximum training-set Tanimoto similarity ≥ 0.474 were classified as being within the domain. Following nearest-neighbor AD concepts [
56], this empirical threshold was set to the 5th percentile of leave-one-out nearest-neighbor Tanimoto similarities in the training set. Coverage, predicted-positive counts, and domain-stratified performance metrics were calculated separately for external compounds classified as inside and outside the AD. Outside-domain PPV was interpreted descriptively when the number of predicted positives was small.
4.8. ChEMBL-Derived Transfer and Descriptor Reconstruction
To evaluate cross-dataset transfer beyond the source-paper holdout, a ChEMBL-derived disk diffusion/IZ endpoint set was assembled [
28]. Records were retained only if they included usable SMILES strings, a disk diffusion or IZ endpoint annotation, an equality relation, and an IZ value interpretable in millimeters. Canonical SMILES strings were generated using RDKit, and any exact canonical SMILES overlap with source-paper compounds was removed before evaluation. The final transfer set comprised 1458 compounds with 75 actives, corresponding to 5.1% active prevalence, and exhibited zero exact canonical SMILES overlap with the original source-paper compounds. Parent- and scaffold-level overlaps were subsequently computed as sensitivity metadata.
For evaluation, SVC/MACCS was applied directly to the ChEMBL-derived transfer set without model refitting. RegressionStack was also applied without refitting after reconstructing the 199 source-paper descriptor columns by exact name using Mordred [
29]. Because 32 of the 199 reconstructed descriptor columns exhibited numerical drift relative to the original source workbook, the ChEMBL-derived RegressionStack results were interpreted as a descriptor-reconstruction and cross-dataset transfer sensitivity analysis rather than as exact descriptor-transfer performance. These transfer results were not used to revise the primary conclusions from the locked source-paper holdout. To quantify the practical impact of descriptor drift, reconstructed and originally saved RegressionStack predictions were compared systematically on the locked source-paper external set before transfer evaluation; the corresponding source files and agreement summary are included in the deposited data repository.
4.9. Feature Interpretation
Feature interpretation focused on the MACCS-based classifier because MACCS keys can be mapped to predefined structural motifs with established definitions [
42]. SHapley Additive exPlanations (SHAP) analysis [
30] was applied to identify the influential MACCS keys, which were interpreted using predefined MACCS key definitions, where available [
42]. Feature attribution was interpreted as associative rather than mechanistic because disk diffusion IZ values reflect both the antibacterial effect and physicochemical determinants of agar diffusion [
11,
13].
4.10. Nomination Overlap, Label-Permutation Null, and Tiered Complementarity Analysis
Nomination-level overlap between SVC/MACCS and RegressionStack was assessed using the locked external validation set with saved final model predictions without model refitting. Score concordance was quantified using Pearson and Spearman’s correlation coefficients. Fixed-threshold overlap was evaluated using the operating thresholds selected from training out-of-fold predictions: SVC/MACCS probability ≥ 0.360 and RegressionStack predicted IZ ≥ 23.50 mm. The nominations were grouped into four tiers: consensus-positive, SVC/MACCS-only, RegressionStack-only, and both-negative compounds. For each tier, the selected compound counts, TP, FP, PPV, and sensitivity were calculated. The union of model-selected compounds was evaluated as an exploratory expansion set rather than as a default-combined model decision rule.
A label-permutation nomination-null analysis was performed by holding model predictions, thresholds, rankings, and nomination memberships fixed while randomly permuting external active/inactive labels 10,000 times. Empirical p-values were calculated using a plus-one correction method. This analysis tested fixed-nomination enrichment relative to random label assignment, not retraining model stability.
Threshold-margin analysis was performed for the model-specific nominations. The SVC/MACCS margin was defined as the calibrated probability minus 0.360, and the RegressionStack margin was defined as the predicted IZ minus 23.50 mm. Two descriptive near-boundary rules were applied. The absolute cutoffs were margins from 0 to less than 0.05 probability units for SVC/MACCS and from 0 to less than 1.0 mm for RegressionStack. The model-specific relative cutoffs were defined by the first quartile (Q1) of the positive-margin distributions: 0.0587599 probability units for SVC/MACCS and 0.670473 mm for RegressionStack. A model-specific nomination was classified as near-boundary if it satisfied either the absolute cutoff or the relative-Q1 cutoff; all remaining nominations were classified as higher-margin. Strong-disagreement subsets were defined using within-model percentile ranks. High-SVC/low-RegressionStack compounds had SVC/MACCS percentile ranks ≥ 0.75 and RegressionStack percentile ranks ≤ 0.25; high-RegressionStack/low-SVC compounds met the converse criteria.