1. Introduction
Salidroside is the principal bioactive constituent of the traditional Chinese medicinal herb
Rhodiola rosea L. and is also present in other medicinal plants such as
Ligustrum lucidum Ait. As a phenylethanol glycoside, salidroside is rapidly and extensively metabolized in vivo to tyrosol, which represents its major circulating and tissue-distributed form following administration. Tyrosol itself is also a naturally occurring phenolic compound abundant in olive oil and red wine. Pharmacokinetic studies have demonstrated that, after intravenous administration, salidroside is immediately and extensively metabolized to tyrosol, which has been identified as the main form present in all rat tissues, rather than salidroside [
1]. Both salidroside and tyrosol belong to the phenylethanol derivative family and exhibit a broad spectrum of biological activities in vivo.
Extensive pharmacological studies have shown that salidroside exerts antioxidant, anti-inflammatory, anticancer, cardioprotective, neuroprotective, antidepressant, anti-aging, antidiabetic, lipid-lowering, and immunomodulatory effects [
2,
3]. Similarly, tyrosol has been reported to possess antioxidant, anti-inflammatory, anticancer, cardioprotective, neuroprotective, and antidepressant activities [
4,
5]. At the molecular level, these diverse bioactivities have been associated with the modulation of multiple signaling pathways and regulatory molecules, including nuclear factor kappa-B(NF-κB), tumor necrosis factor-α (TNF-α), adenosine 5′-monophosphate-activated protein kinase (AMPK), phosphatidylinositol 3-kinase/protein kinase B (PI3K/Akt), janus kinase/signal transducer and activator of transcription (JAK/STAT), and mitogen-activated protein kinase kinase/extracellular signal-regulated kinase (MEK/ERK) pathways for salidroside [
2,
6,
7], as well as cyclooxygenase-2 (COX-2), 3-hydroxy-3-methylglutaryl coenzyme A reductase (HMGCoAR), p38 mitogen-activated protein kinase (p38 MAPK), ERK, and α-amino-3-hydroxy-5-methyl-4-isoxazolepropionic acid (AMPA)-related signaling for tyrosol [
8,
9,
10]. Despite these advances, most existing studies have focused on downstream signaling events or pathological models, and the direct molecular targets responsible for the primary actions of salidroside and tyrosol remain largely undefined.
Notably, our previous studies demonstrated that salidroside exerted pronounced neuroprotective effects in a rat model of cerebral ischemia–reperfusion (I/R) injury [
11,
12]. Using in vivo cerebral microdialysis, we further observed that salidroside administration rapidly increased dopamine levels and its metabolites in the striatum of I/R model rats [
13], suggesting a regulatory effect on the dopaminergic nervous system following ischemic insult. These findings raised the possibility that salidroside and its metabolite tyrosol may directly interact with key components of dopaminergic signaling; however, the molecular basis for this regulation has not yet been elucidated.
The Connectivity Map (CMap), first reported in Nature in 2007 [
14], is a transcriptome-based pharmacogenomic platform that links gene expression signatures induced by small molecules to those generated by reference compounds with known mechanisms of action. By comparing similarities between transcriptional perturbation profiles, CMap enables the identification of compounds with shared targets or biological activities and has been increasingly applied to drug target identification, drug repurposing, and mechanism-of-action studies [
15]. This approach is particularly well suited for natural products and traditional Chinese medicine-derived compounds, whose pharmacological effects are often multifaceted and whose direct molecular targets are difficult to predict based solely on chemical structure.
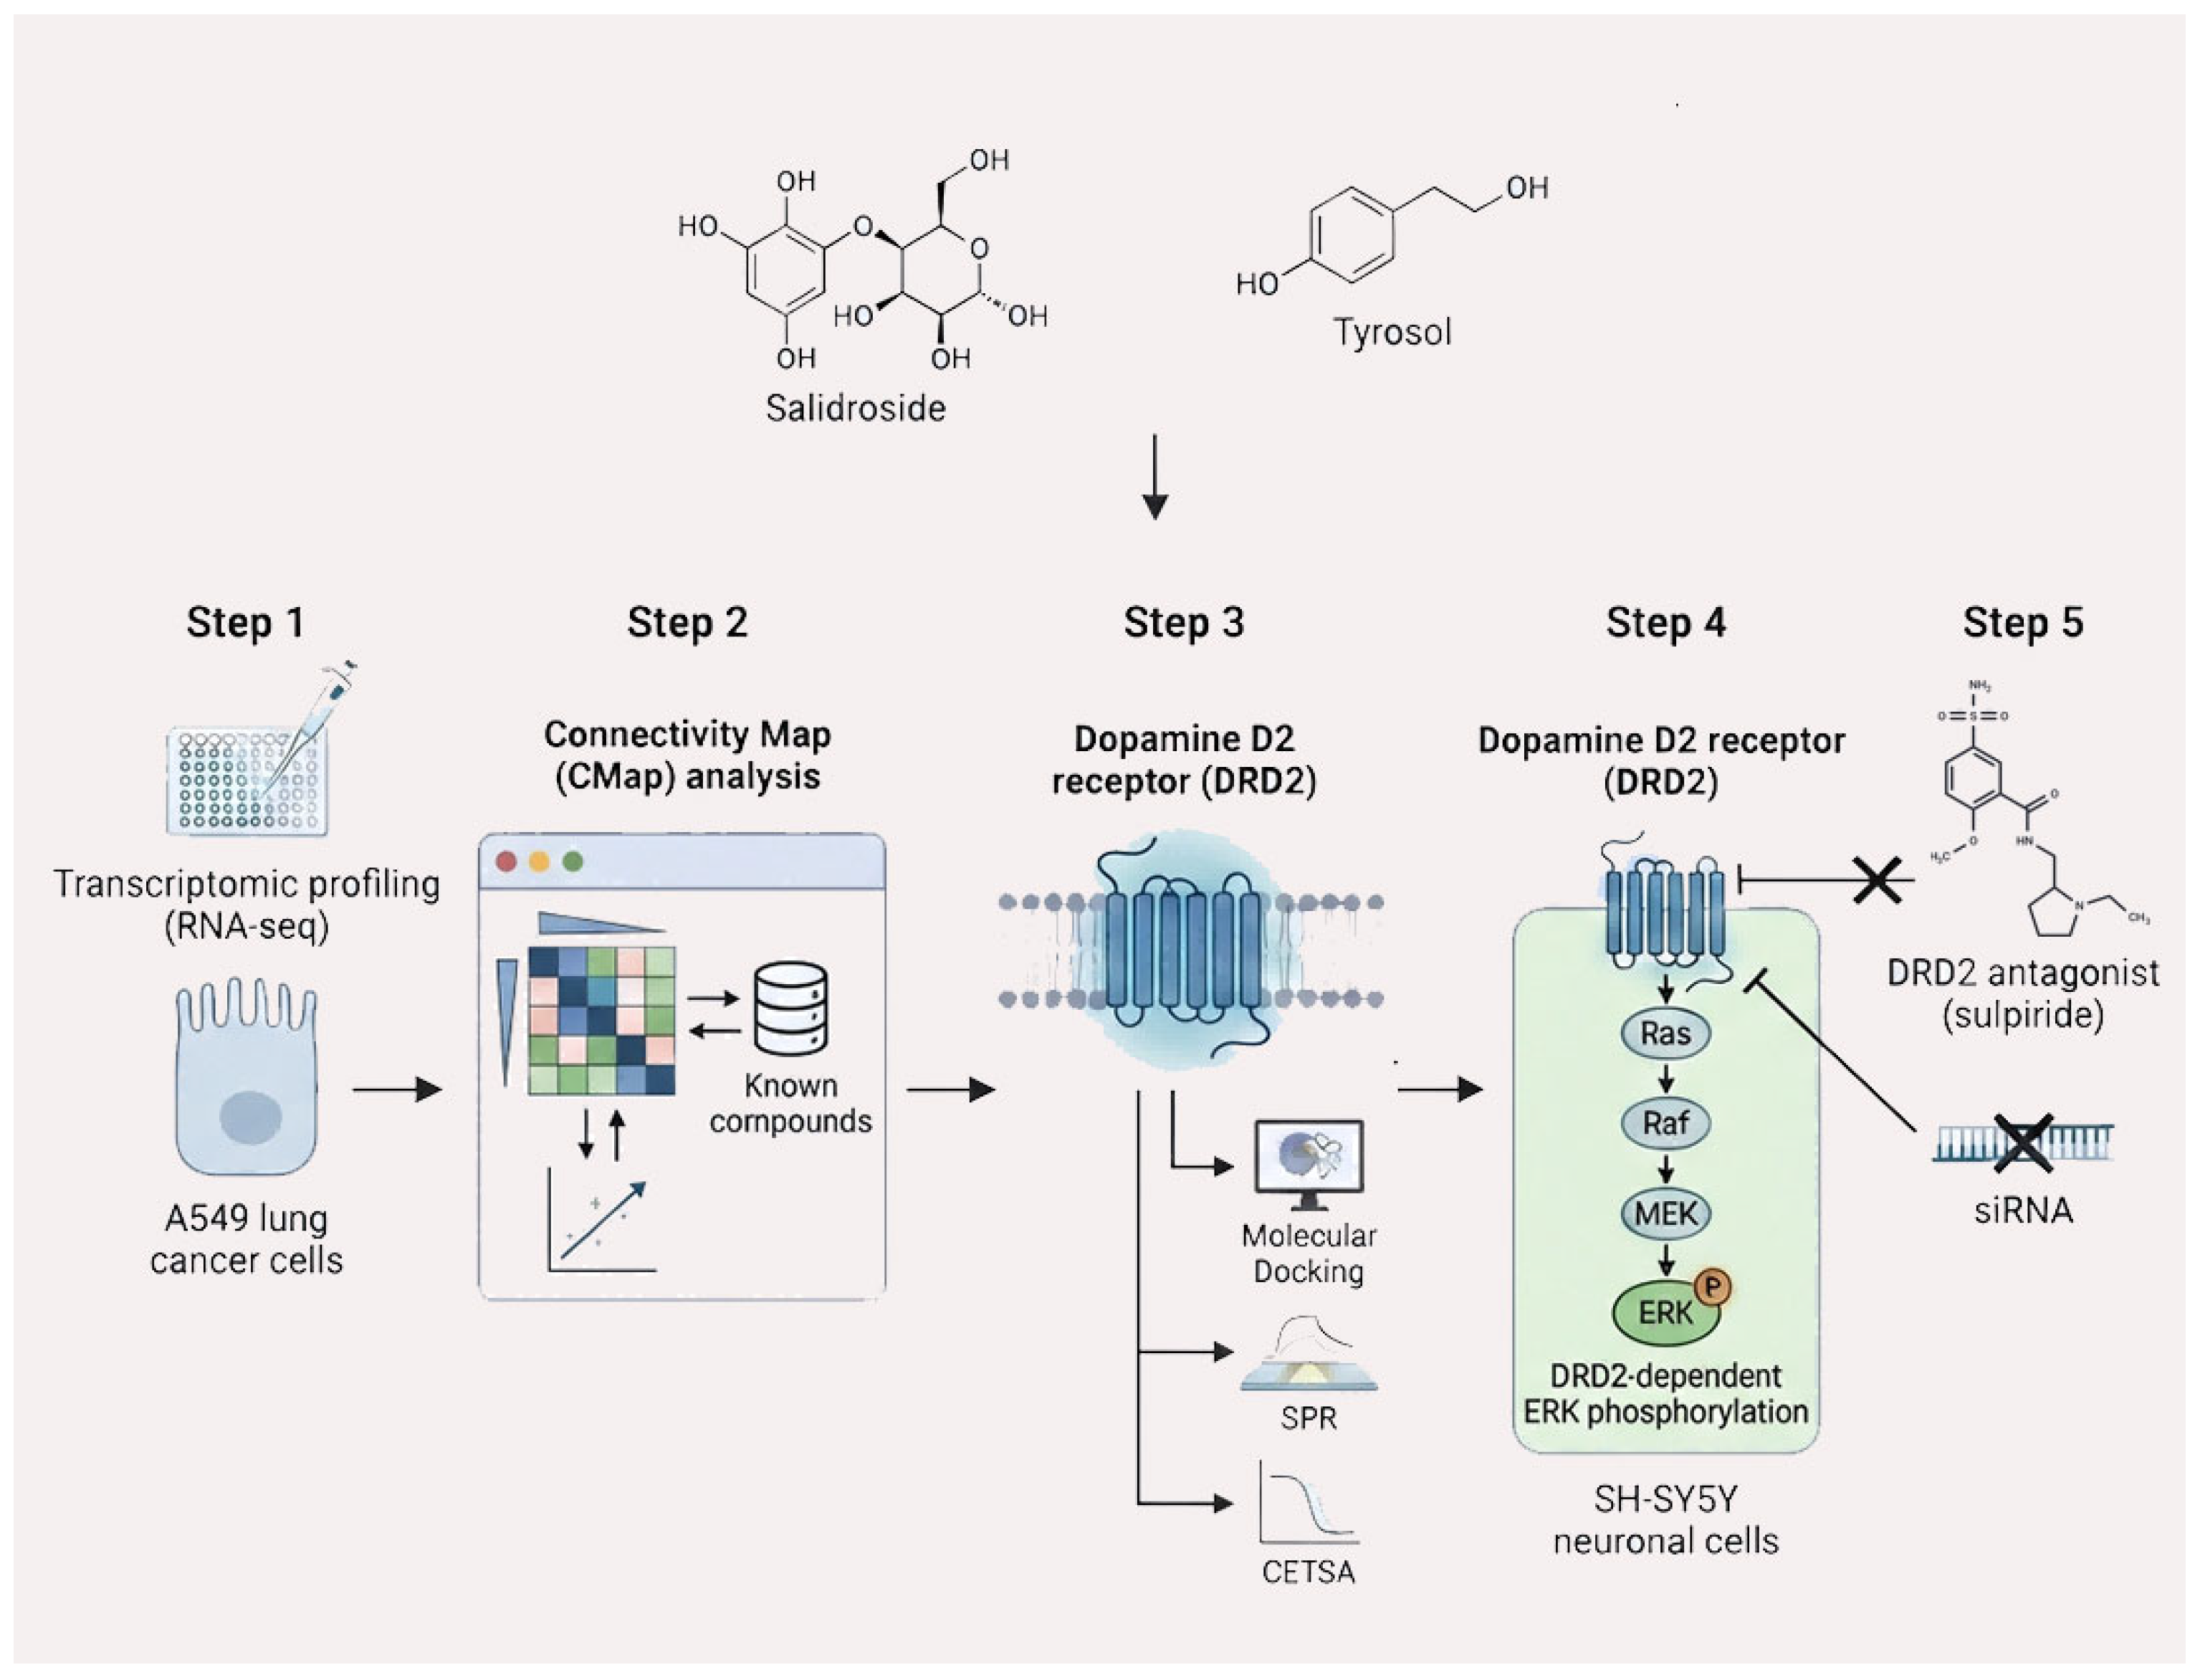
In the present study, we employed RNA sequencing to obtain the transcriptome signatures from A549 cells treated with salidroside and tyrosol. Then the signatures were used to query the CMap database. Based on CMap-guided target prioritization, we further applied a series of complementary validation approaches, including molecular docking, surface plasmon resonance (SPR), cellular thermal shift assay (CETSA) [
16], and functional signaling analyses, to determine whether salidroside and tyrosol directly engage the predicted target. This integrated strategy was designed to systematically identify and validate the direct molecular targets of salidroside and its major metabolite tyrosol. The process flow of the study, detailing each step from chemical analysis to experimental verification, is clearly depicted in
Figure 1.
3. Discussion
In the present study, we integrated transcriptomic profiling with CMap analysis and multi-level experimental validation to systematically identify the direct target of salidroside and its major in vivo metabolite, tyrosol. Using this strategy, we demonstrate that DRD2 represents a direct molecular target of both compounds. This conclusion is supported by convergent data from molecular docking, SPR, CETSA, and functional signaling analyses, thereby providing a mechanistic basis for the dopaminergic regulatory effects previously attributed to salidroside and tyrosol [
4,
13,
18,
19].
Identifying the direct molecular targets of bioactive compounds derived from medicinal plants remains a major challenge in pharmacological research. Currently, several methods have emerged, including labeled and non-labeled approaches [
20]. Among them, CMap is a non-labeled method that works by linking input transcriptional “signatures” to gene expression profiles induced by thousands of small molecules with known mechanisms of action [
14]. This strategy has been increasingly applied for drug repurposing, mechanism-of-action studies, and target discovery, particularly for compounds with unclear or multiple biological activities. In the context of traditional Chinese medicine and natural products, CMap offers a distinct advantage by enabling hypothesis generation without prior assumptions regarding chemical structure–target relationships [
21]. To date, several studies have already applied this method for target discovery of compounds [
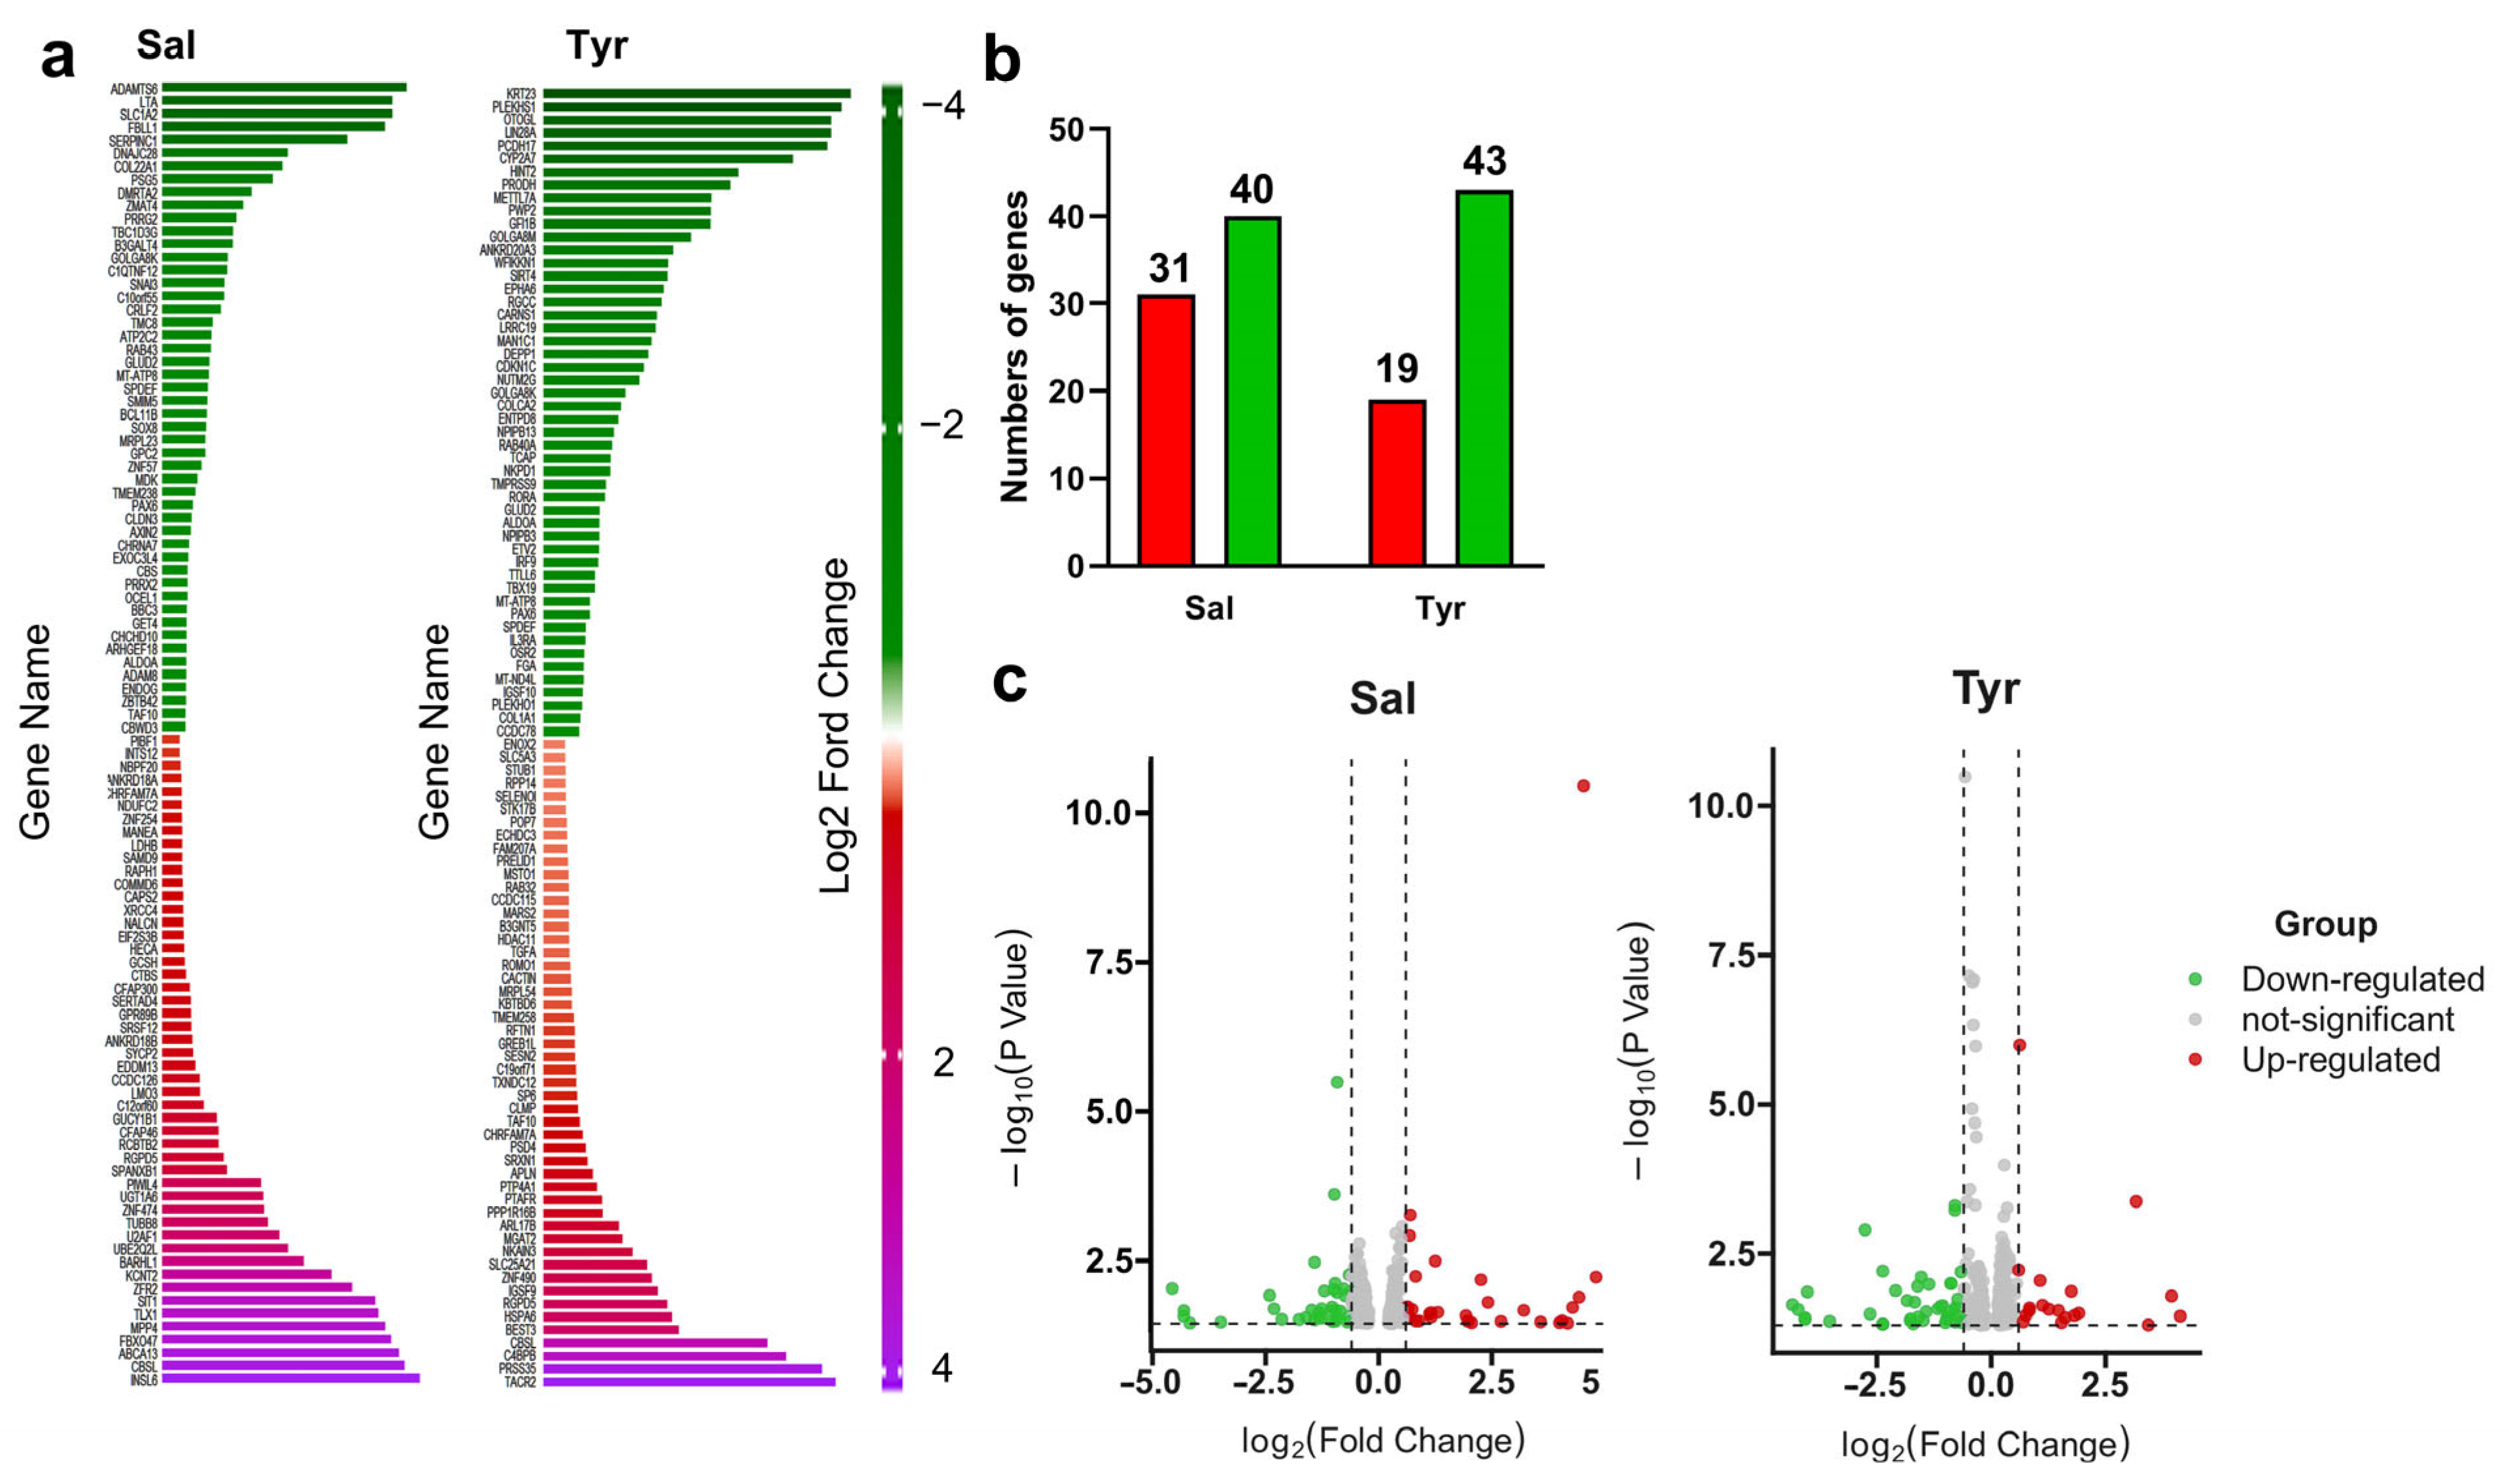
22]. In this study, transcriptomic signatures derived from salidroside- and tyrosol-treated cells exhibited strong positive or negative connectivity with compounds known to modulate DRD2, highlighting the utility of CMap as an effective upstream screening tool for target identification. Importantly, CMap analysis alone does not establish causality; rather, it provides direction for subsequent experimental validation. Our study exemplifies how CMap-guided hypotheses can be rigorously tested and confirmed through complementary biochemical and cellular approaches.
A critical distinction in this study is the confirmation of direct physical binding. While previous studies have reported that salidroside modulates dopaminergic systems [
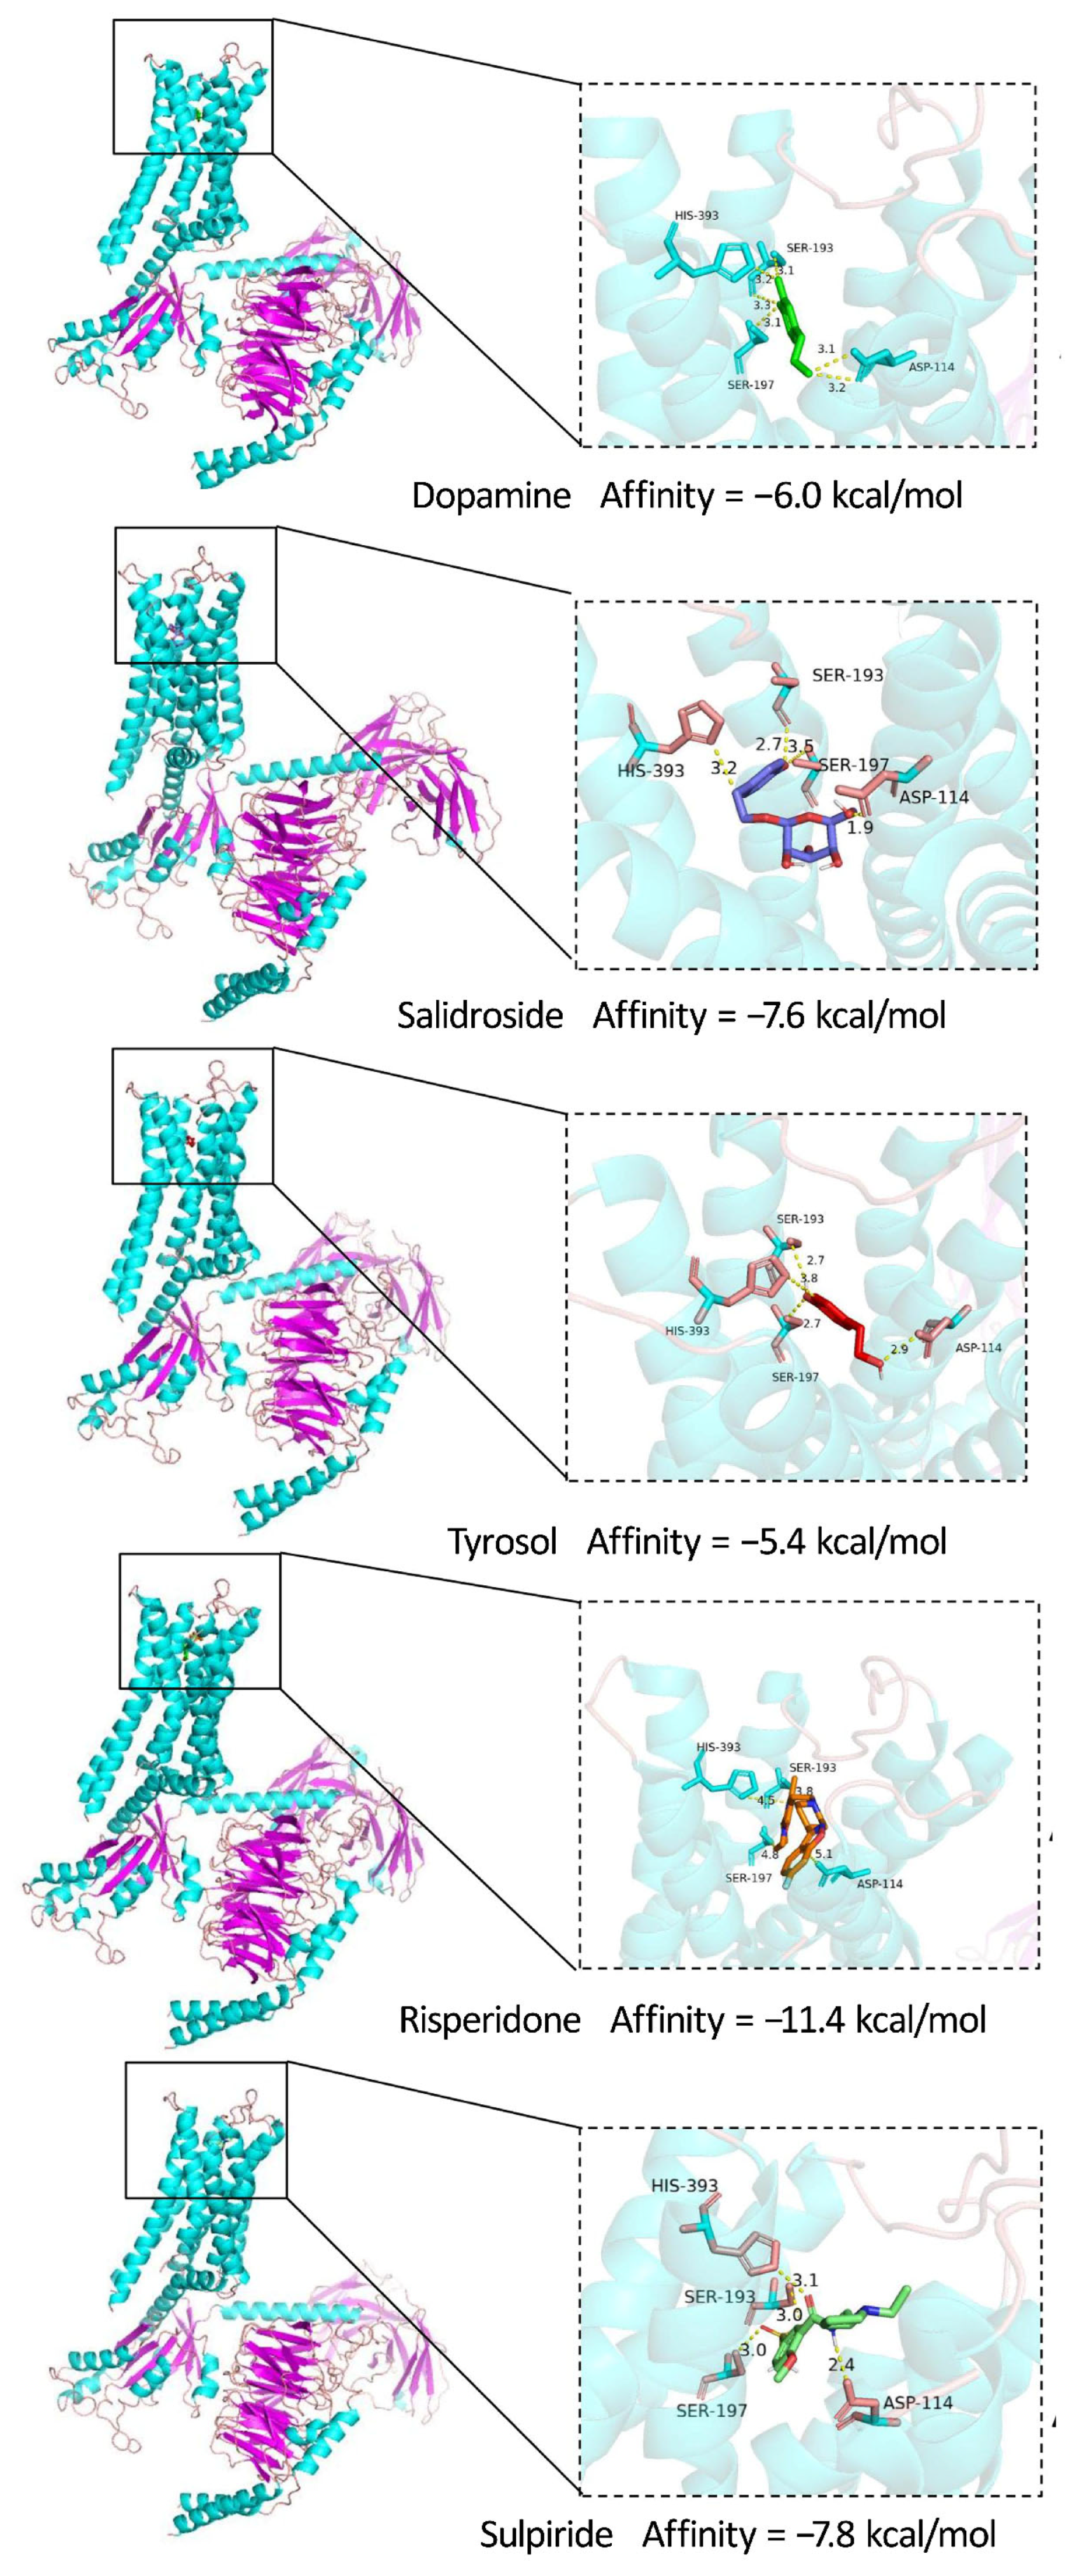
23], it was unclear whether this was an indirect effect such as regulating synthesis enzymes or direct receptor interaction. Beyond target prediction, our study provides direct biochemical and biophysical evidence supporting the interaction between salidroside, tyrosol, and DRD2. Molecular docking analysis revealed that both compounds occupy a binding pocket overlapping with that of dopamine and the DRD2 antagonist risperidone [
24], suggesting potential competition or functional relevance at the site. Importantly, our docking analyses revealed that salidroside and tyrosol share a conserved binding pattern with both DRD2 agonists and antagonists: similarly to the endogenous agonist dopamine, and the clinical antagonists risperidone and sulpiride, both compounds form stable hydrogen bonds with the core functional residues Asp114 and Ser193 of DRD2. It has been well established in prior work that Asp114 is the determinant residue for the high-affinity state (D2
HighR) of DRD2, whereas Ser193 is the key residue that mediates the low-affinity state (D2
LowR) of the receptor [
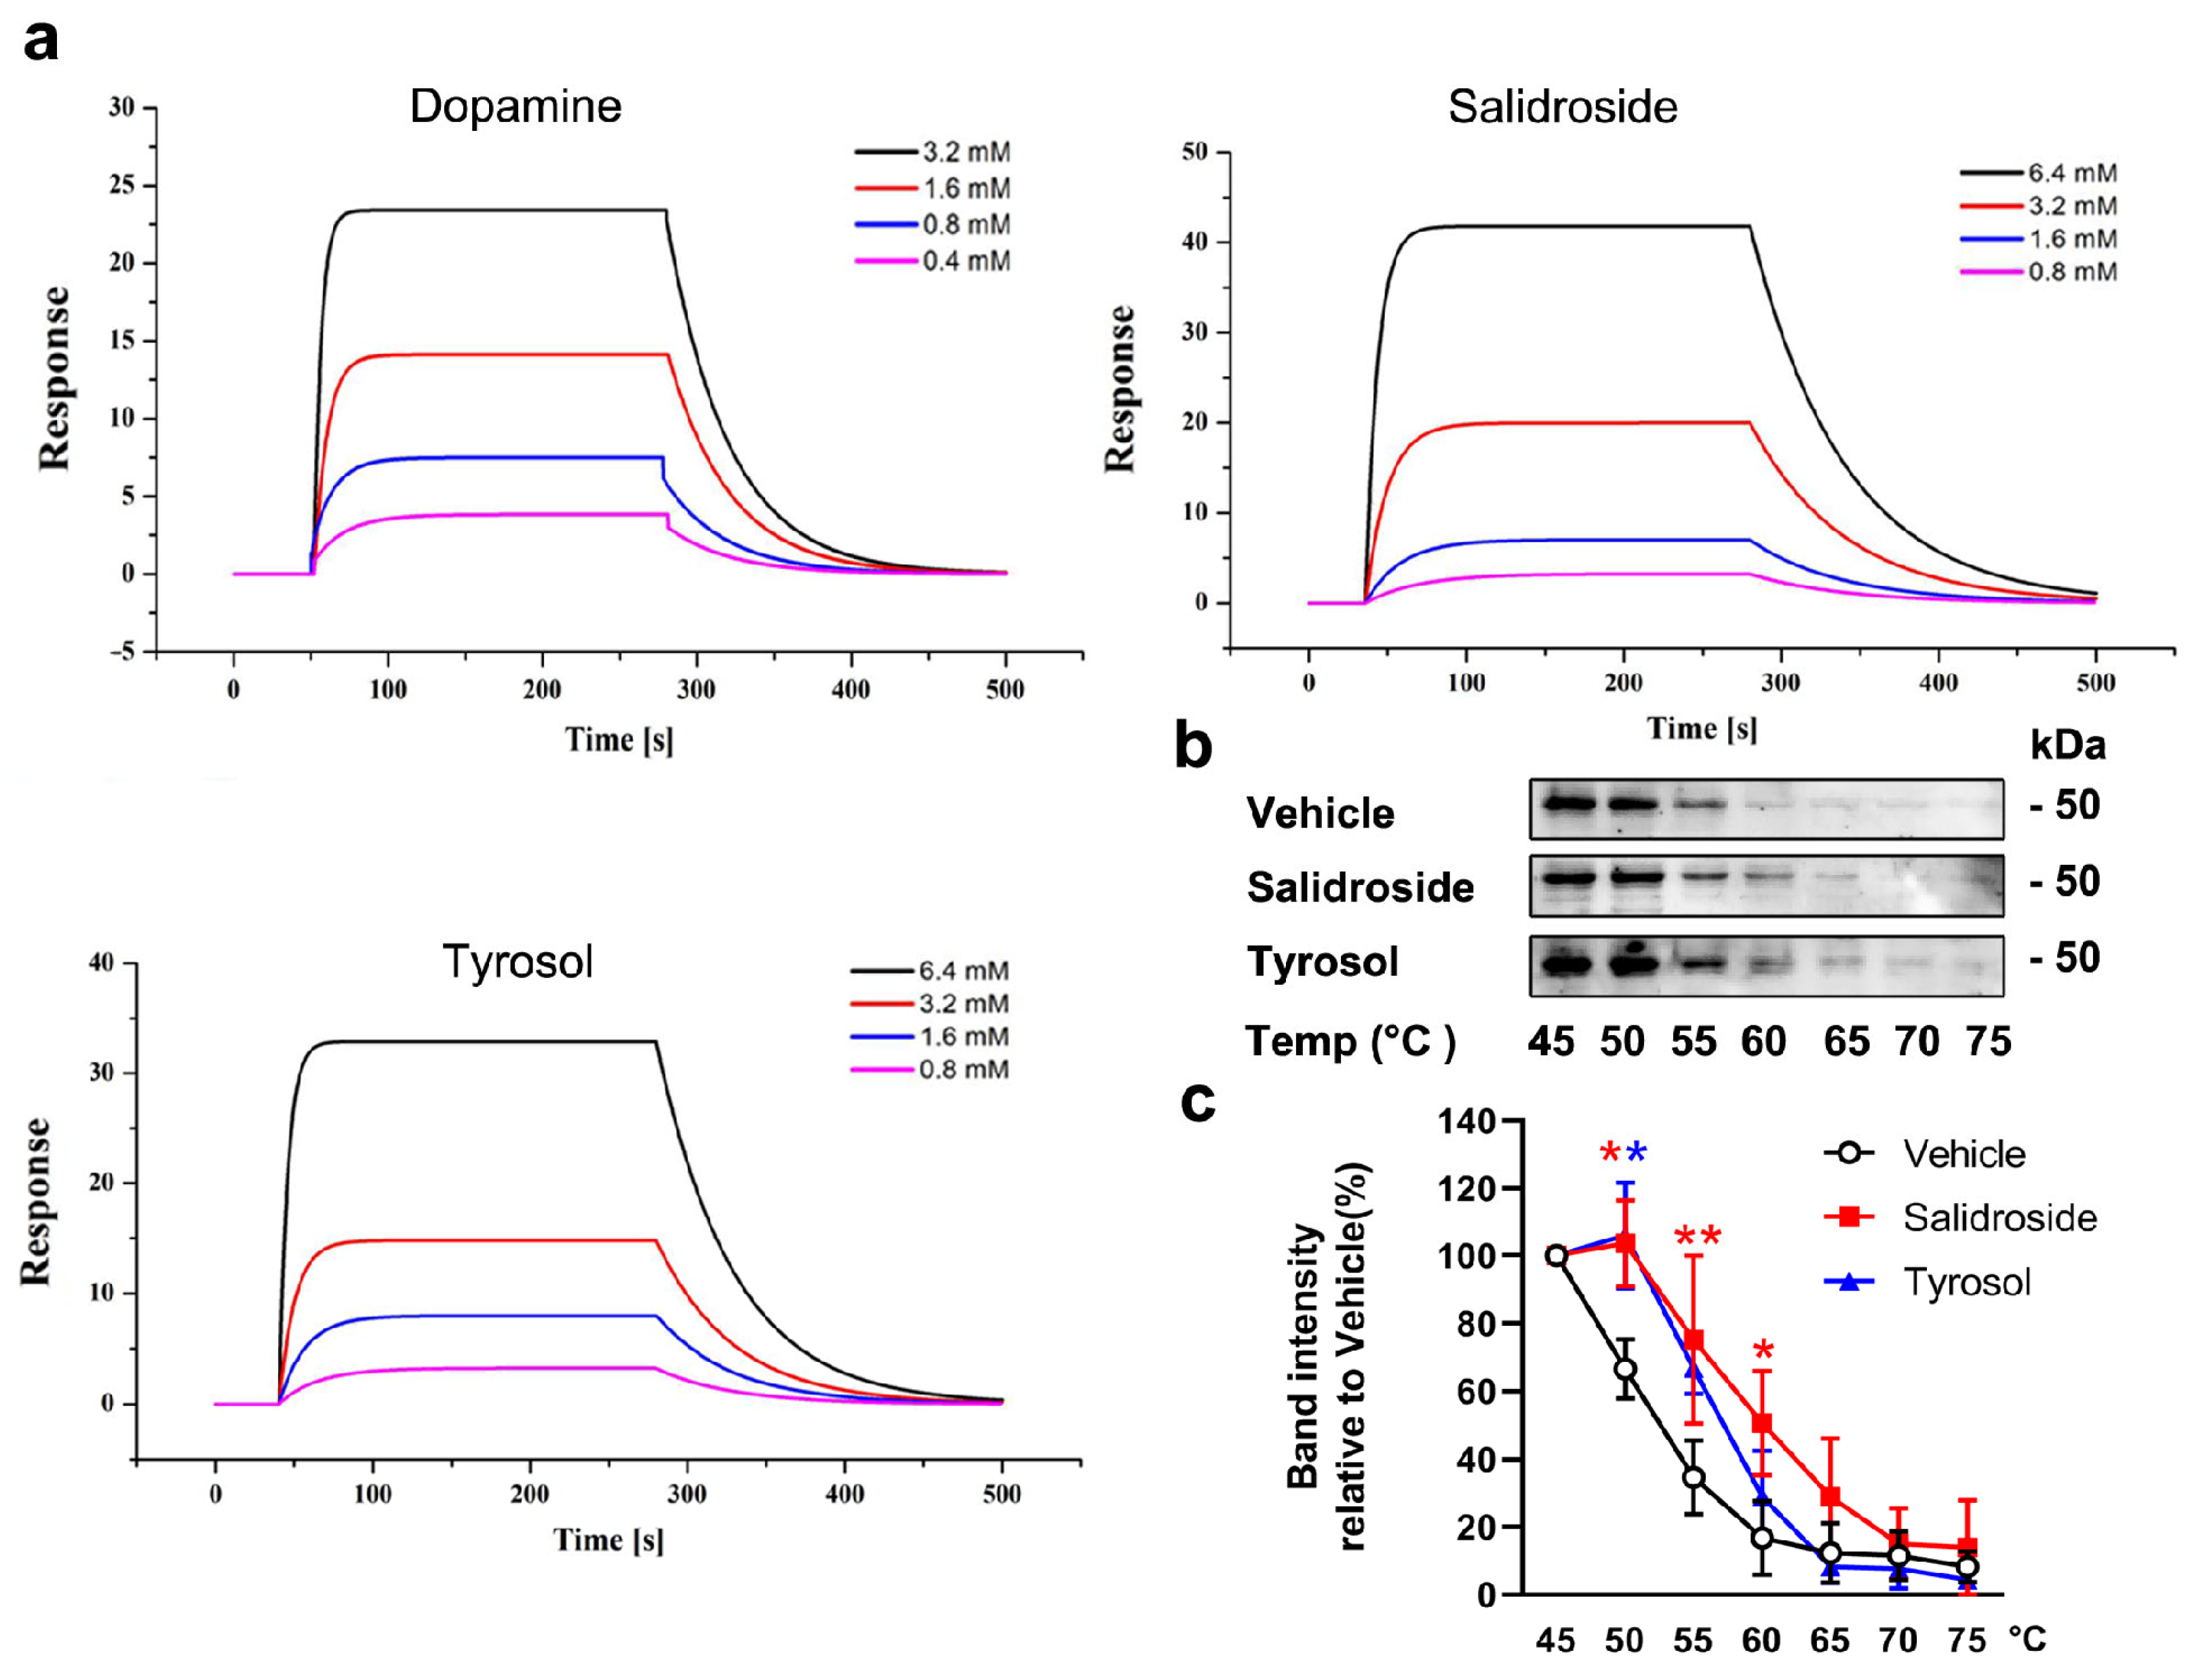
25]. Collectively, ligand engagement at these two conserved sites is a prerequisite for the biological activity and functional modulation of DRD2. SPR experiments further confirmed direct binding, demonstrating that salidroside and tyrosol interact with DRD2 with K
D values comparable to that of dopamine. Furthermore, CETSA analysis provided additional evidence, showing that both compounds increase the thermal stability of DRD2, indicating direct engagement with the receptor in a cellular context. These biophysical data provide strong evidence supporting DRD2 as a direct target of salidroside and tyrosol, rather than an indirect downstream effector.
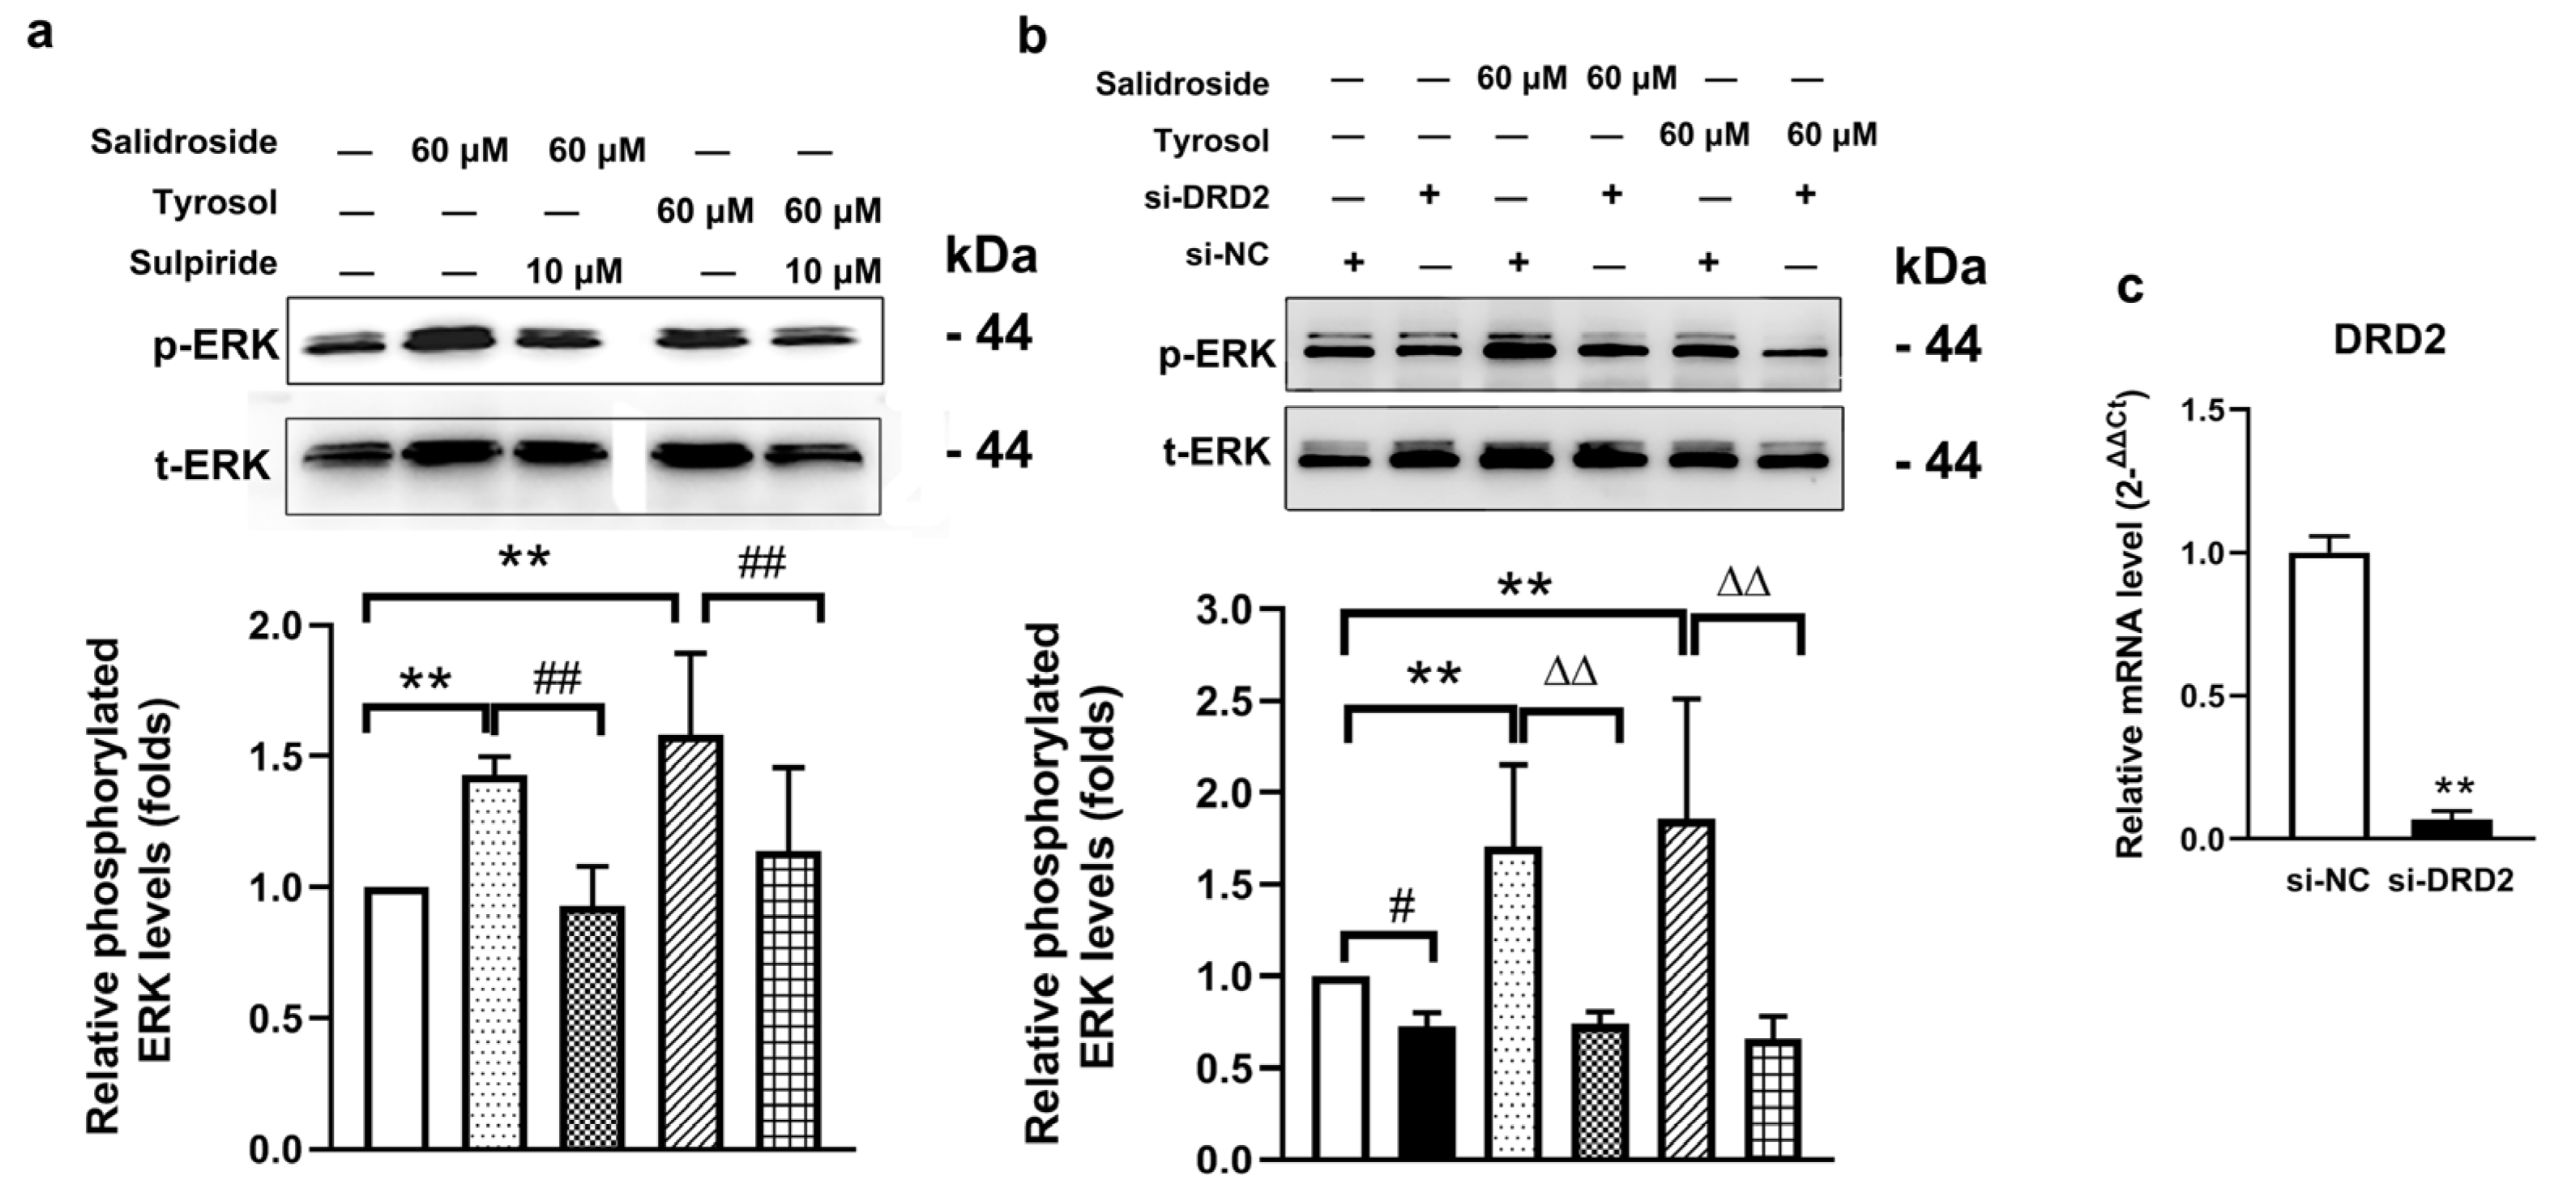
Importantly, receptor binding was accompanied by functional signaling consequences. In SH-SY5Y cells, treatment with salidroside or tyrosol induced a significant increase in ERK phosphorylation, a well-established downstream signaling event of DRD2 activation [
26,
27]. This effect was abolished by pharmacological blockade with a DRD2 antagonist and by siRNA-mediated knockdown of DRD2, demonstrating that ERK activation is receptor-dependent. These findings indicate that salidroside and tyrosol engage DRD2 in a functionally relevant manner and activate downstream signaling pathways. Although the present data support agonist-like activation of DRD2-dependent ERK signaling, further studies are required to determine whether these compounds act as full agonists, partial agonists, or biased ligands with preferential pathway engagement.
The selection of different cell models in this study was guided by both methodological and biological considerations. A549 cells were used for transcriptomic profiling and CETSAs because they represent one of the core reference cell lines in the CMap database. Using the same cellular context as the CMap reference ensured that the transcriptional signatures generated by salidroside and tyrosol could be directly and reliably compared with existing perturbational profiles, thereby minimizing potential bias introduced by cell type-specific transcriptional programs. Consistent target engagement observed in A549 cells therefore provides a robust validation of the CMap-guided target prediction. In contrast, SH-SY5Y cells were employed for downstream functional signaling analyses due to their neuronal characteristics and well-established dopaminergic signaling machinery [
28]. This complementary use of cell models allowed us to decouple target identification from functional consequence, while maintaining biological relevance for DRD2-mediated signaling.
It is noteworthy that the effect of salidroside on ERK signaling has been reported to differ across experimental systems. In several pathological models (e.g., inflammatory stimulation, hyperglycemic/oxidative stress conditions, and ischemia–reperfusion injury), salidroside has been reported to attenuate MAPK activation including reduced ERK1/2 phosphorylation [
29,
30]. In contrast, the ERK activation observed in the present study occurs rapidly and in a receptor-dependent manner, as evidenced by its sensitivity to DRD2 antagonism and gene silencing. This apparent discrepancy likely reflects context-dependent nature of ERK signaling [
31], in which salidroside may attenuate pathological ERK overactivation under stress conditions while permitting or inducing transient ERK activation downstream of receptor-mediated signaling under physiological conditions. Such context-dependent regulation of ERK signaling has been widely observed and may contribute to the pleiotropic biological effects of neuromodulatory compounds across different experimental settings [
32].
The identification of DRD2 as a target of salidroside and tyrosol provides a mechanistic framework for understanding their previously reported effects on the dopaminergic system [
13]. As a central regulator of dopaminergic neurotransmission, DRD2 functions as a key modulatory node integrating presynaptic and postsynaptic signaling, thereby fine-tuning dopamine release and downstream signal transduction [
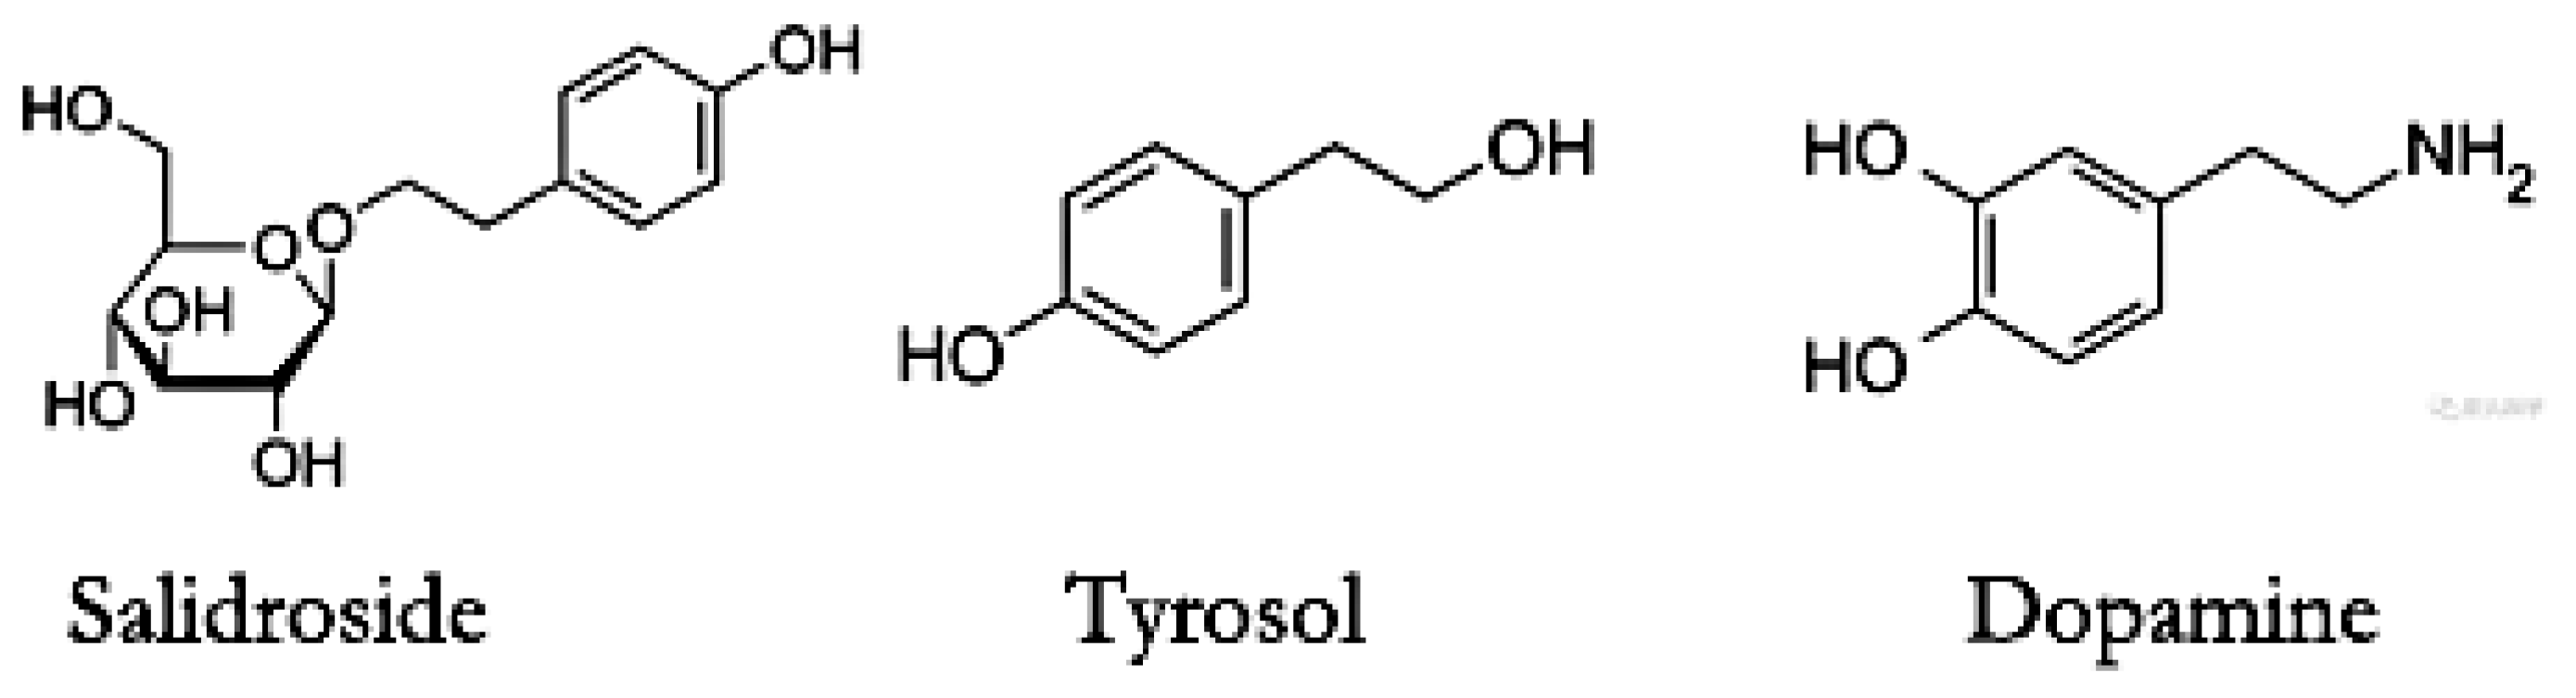
33]. Salidroside and tyrosol are phenylethanol derivatives, and tyrosol shares a phenethyl scaffold with dopamine and exhibits partial overlap in pharmacophoric features relevant to dopaminergic receptor recognition (as shown in
Figure 7). Moreover, tyrosol participates in metabolic pathways closely related to dopamine metabolism. Tyrosol is metabolized by monoamine oxidase to 3,4-dihydroxyphenylacetaldehyde, or by aldehyde dehydrogenase to 3,4-dihydroxyphenylacetic acid, and then metabolized by catechol-O-methyl transferase to homovanillic acid; similarly, tyramine can be metabolized to tyrosol by monoamine oxidase and aldehyde/aldose reductase [
34]. These biochemical relationships support the likelihood that tyrosol may interact with components of the dopaminergic system. In our previous studies, salidroside administration markedly increased dopamine levels and its metabolites in the striatum of cerebral ischemia–reperfusion model rats within a short time frame, suggesting a rapid regulatory effect on the dopaminergic system [
13]. Accumulating evidence from previous studies also demonstrates that salidroside and tyrosol exert neuroprotective effects by acting on the dopaminergic neuronal system [
4,
18,
19]. These observations provided an important rationale for prioritizing DRD2 as a candidate target following CMap screening. The present findings extend these observations by providing direct molecular evidence that DRD2 is a binding and signaling target of salidroside and tyrosol, thereby linking receptor-level engagement to system-level dopaminergic regulation.
Dopamine D2 receptor (DRD2) exerts a wide spectrum of physiological functions across multiple systems, including the regulation of neurotransmitter release, motor function modulation, affective and cognitive processing, endocrine homeostasis, and gastrointestinal function [
35]. Among these functions, the regulatory role of DRD2 in neuromotor function has attracted extensive attention [
36]. Reduced expression and functional dysregulation of DRD2 lead to motor symptoms including bradykinesia and tremor [
37], a pathological phenotype that occurs not only in patients with Parkinson’s disease (PD), but also secondary to cerebral ischemia [
38]. DRD2 agonists have been well documented to exert therapeutic effects on the aforementioned disorders [
39,
40]. G protein-coupled receptors (GPCRs) including DRD2 are promising future drug targets; a recent study characterizes the Gαₒ K46E mutation that locks G proteins in a pre-activated state, revealing the mechanism of related neurodevelopmental disorders and providing a novel tool for GPCR research and drug development [
41]. Accordingly, the findings of our study provide a theoretical and experimental basis for the development of salidroside and tyrosol as potential dopaminergic neuroprotective agents.
Despite the strengths of this study, several limitations should be acknowledged. First, while CMap analysis proved valuable for hypothesis generation, it captures similarities in global transcriptional responses rather than direct pharmacological modalities at individual receptors [
13,
42]. For GPCR targets such as DRD2, compounds with distinct functional properties—including agonists, partial agonists, and antagonists—may elicit overlapping transcriptional signatures depending on cellular context, signaling bias, and exposure duration [
43]. Therefore, the identification of both positively and negatively connected DRD2-modulating compounds in the CMap results is not contradictory, but instead highlights the complexity of downstream transcriptional regulation and underscores the necessity of complementary biochemical and functional assays to define the precise mode and directionality of receptor engagement.
A further limitation of our study relates to the SPR binding assays, in which we employed a commercially available recombinant human DRD2 protein (Abnova Corporation, Taipei City, Taiwan, Catalog No. H0001813-Q01). This protein comprises the partial open reading frame (ORF) of human DRD2 (AAH21195, amino acids 1-110), which encompasses the seven-transmembrane domains of the receptor. Critically, this recombinant protein presents in a low-affinity, G protein-uncoupled conformational state, which accounts for the discrepancy between the dopamine KD value obtained in our assays and the well-characterized nanomolar KD values reported in prior studies using membrane-based binding assays. In this context, it is important to clarify that the KD values measured via SPR in our study are intended solely for the relative comparison of binding affinities across different ligands within the same experimental system, and not for the absolute quantification of physiologically relevant binding affinities under native cellular conditions.
To further delineate the signaling mechanisms and broader biological relevance of these interactions, several additional aspects warrant future investigation. First, dose–response analyses for salidroside and tyrosol, including determination of half maximal effective concentration (EC50) values for ERK activation are needed. Second, although ERK phosphorylation was used as a functional readout, additional signaling endpoints such as cyclic adenosine monophosphate (cAMP) modulation, β-arrestin recruitment, or G protein bias were not assessed. Moreover, DRD2 may not represent the sole target of salidroside and tyrosol, given their broad biological activities and the likelihood of multi-target engagement. In addition, the present findings were derived predominantly from cell models, and further in vivo investigations are necessary to clarify the physiological and therapeutic relevance of DRD2 modulation by these compounds.
4. Materials and Methods
4.1. Cell Culture and Drug Treatment
The A549 (American Type Culture Collection (ATCC) CCL-185) and SH-SY5Y (ATCC CRL-2266) cell lines were purchased from Dobiotech, Co. Ltd. (Daegu, Republic of Korea). The A549 cells were incubated in Dulbecco’s Modified Eagle Medium (DMEM) medium, and the SH-SY5Y cells were incubated in DMEM/F12 medium, both with 10% fetal bovine serum. All cell culture incubations were performed in a humidified 37 °C incubator with 5% CO2.
The A549 and SH-SY5Y cells were seeded into six-well plates at a density of 1.5 × 10⁵ cells per well 24 h before treatment. The next day, the medium was removed, and the cells were treated in a final volume of 2 mL.
4.2. RNA Sequencing and Analysis
For RNA sequencing, the A549 cells were seeded on six-well plates at a density of 1.5 × 10⁵ cells per well and cultured for 24 h prior to treatment. Then the medium was removed, 60 μM salidroside or tyrosol were added in a final volume of 2 mL when cell confluence reached approximately 50%. And Control cells received an equal volume of drug-free medium. Three independent biological replicates were set up for each group. After 12 h of treatment, the cells were collected using TRIzol (Life Technologies, Waltham, MA, USA) for total RNA extraction. RNA sequencing and primary data processing were performed by Shanghai Biotree Biotech (Shanghai, China). Briefly, RNA integrity was assessed using the RNA Nano 6000 Assay Kit on a Bioanalyzer 2100 system (Agilent Technologies, Santa Clara, CA, USA). For library preparation, 1 μg of total RNA per sample was used as the starting material, where messenger RNA (mRNA) was first purified from total RNA using poly-T oligo-attached magnetic beads and then fragmented with divalent cations at elevated temperature in 5× First Strand Synthesis Reaction Buffer. First-strand complementary DNA (cDNA) synthesis was performed using random hexamer primers and M-MuLV Reverse Transcriptase (RNase H), followed by second-strand synthesis using DNA Polymerase I and RNase H. The resulting cDNA fragments were subjected to end repair, 3′adenylation, and ligation with hairpin loop-structured adaptors.
cDNA fragments of 370–420 bp were selected using the AMPure XP system (Beckman Coulter, Brea, CA, USA), amplified by polymerase chain reaction (PCR) with Phusion High-Fidelity DNA polymerase, Universal PCR primers, and Index (X) Primer, and then purified (AMPure XP) before library quality assessment on the Agilent Bioanalyzer 2100. For clustering and sequencing, index-coded samples were clustered on a cBot system using TruSeq PE Cluster Kit v3-cBot-HS (Illumina, San Diego, CA, USA) according to the manufacturer’s protocol, followed by sequencing on an Illumina Novaseq platform to generate 150 bp paired-end reads.
Raw sequencing data were subjected to quality control to obtain clean reads. Reference genome and gene annotation files were downloaded from the corresponding genome database. Genome indexing was constructed using Hisat2 v2.0.5, and paired-end clean reads were aligned to the reference genome with the same tool. Reads mapped to each gene were counted using featureCounts v1.5.0-p3, and gene expression levels were normalized as fragments per kilobase of transcript per million mapped reads (FPKM).
Differential expression analysis was conducted using DESeq2 R package (version 1.20.0), which employs a negative binomial distribution-based model. p values were adjusted using the Benjamini–Hochberg method to control the false discovery rate (FDR). Genes with an adjusted p value < 0.05 were considered differentially expressed.
4.3. GO Enrichment Analysis
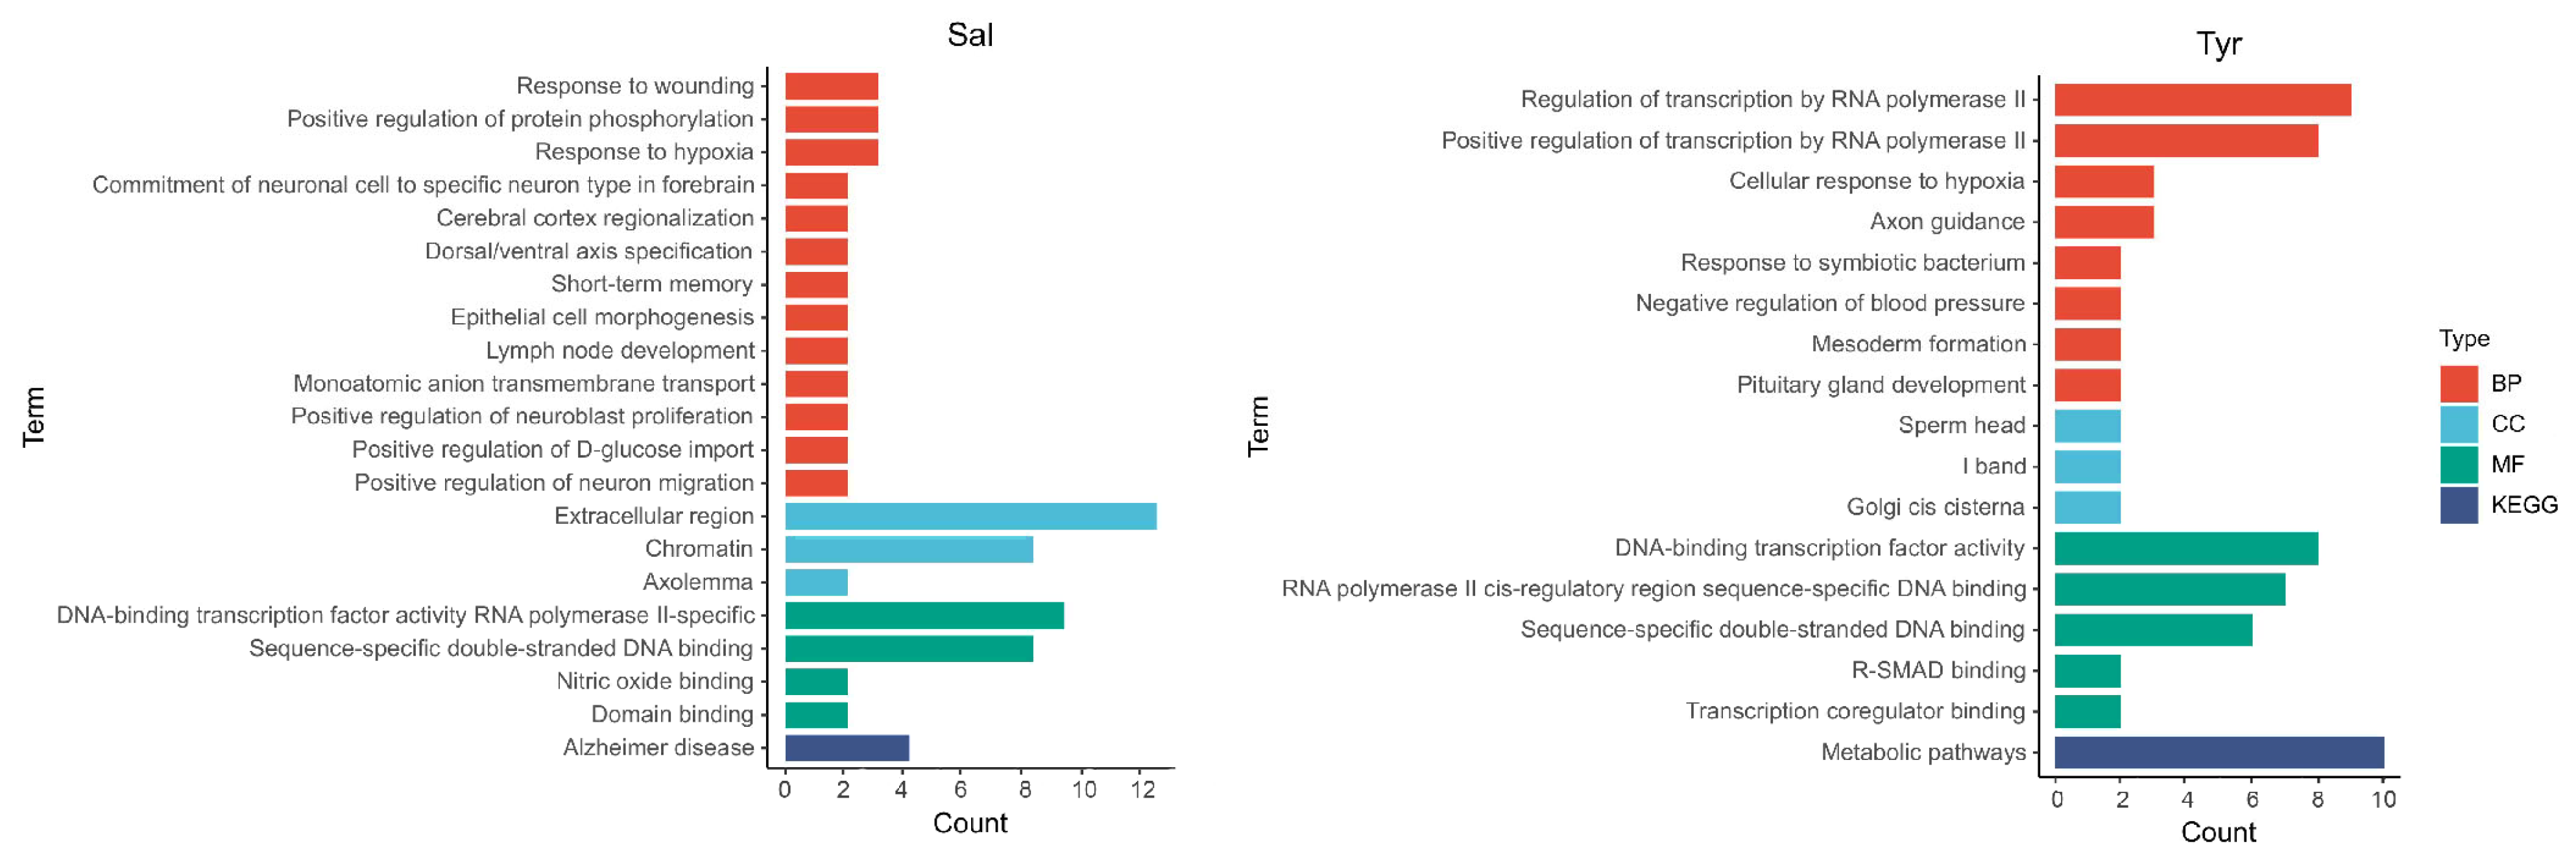
The DEG data identified from RNA sequencing analysis were submitted to the DAVID database for GO enrichment analysis (enriched terms were categorized into BP, CC, and MF), along with KEGG pathway analysis. Enrichment results were visualized using bar charts to display the number of DEGs associated with each functional category.
4.4. CMap Analysis
To identify potential molecular targets of salidroside and tyrosol, DEGs induced by each compound were queried against the CMap database(build 02) using the online platform provided by the Broad Institute (
https://www.broadinstitute.org/cmap/, accessed on 1 February 2021). Genes exhibiting a fold change ≥ 1.5 (up-regulated or down-regulated relative to control) were included in the query signature, in accordance with the requirements of the CMap 2.0 analysis pipeline.
The resulting gene expression signatures were used to compute connectivity scores, which quantify the similarity between the transcriptional responses elicited by salidroside or tyrosol and those induced by reference compounds in the CMap database. Positive connectivity scores indicate similar transcriptional perturbations, whereas negative scores indicate opposing signatures. Compounds with connectivity scores greater than 0.8 or less than −0.8 were considered to exhibit strong positive or negative connectivity and were selected for further analysis.
The known molecular targets of the selected compounds were retrieved from the DrugBank database (
https://go.drugbank.com) to facilitate target enrichment and mechanistic interpretation.
4.5. Molecular Docking
Molecular docking was performed using AutoDockTools (
https://autodock.scripps.edu/, accessed on 7 March 2026), in combination with AutoDock Vina to predict the binding modes of dopamine, salidroside, tyrosol, risperidone and sulpiride to DRD2. The three-dimensional structures of the ligands were obtained from the PubChem database (
https://pubchem.ncbi.nlm.nih.gov/). The crystal structure of DRD2 (PDB codes: 8TQZ) was retrieved from the Protein Data Bank (PDB).
Prior to docking, the receptor structure was prepared by removing non-essential molecules and adding appropriate hydrogen atoms. Redocking validation was performed with the co-crystallized dopamine ligand extracted from the DRD2 crystal structure, using preprocessing procedures and docking parameters identical to those applied to all other test ligands. A flexible docking approach was adopted, allowing the receptor and ligands to interact freely, and the corresponding grid energy map was generated. The docking results were evaluated based on the predicted binding poses and binding affinities (Vina scores). The best-ranked binding conformations were selected for visualization and analysis of ligand-receptor interactions.
4.6. SPR
SPR experiments were performed using a Nicoya OpenSPR™ instrument (Nicoya Lifesciences, Kitchener-Waterloo, ON, Canada) to quantitatively characterize the interactions between DRD2 and dopamine, salidroside, or tyrosol. A COOH sensor chip was activated according to the standard operating procedure provided by the OpenSPR™ system manufacturer. Recombinant DRD2 protein was immobilized onto the sensor surface at a concentration of 0.11 μg/μL by injecting 200 μL of protein solution into the sample loop over 4 min. Following immobilization, salidroside or tyrosol at serial concentrations (0.8, 1.6, 3.2, and 6.4 mM, prepared in phosphate-buffered saline (PBS)) was injected as analytes at a flow rate of 20 μL/min. Dopamine (0.4, 0.8, 1.6, and 3.2 mM) was included as a positive control. The association phase was set to 240 s, followed by a dissociation phase of 260 s under continuous buffer flow.
Sensorgrams obtained from concentration-dependent binding experiments were analyzed using TraceDrawer software V1.6.1 (Ridgeview Instruments AB, Uppsala, Sweden). Kinetic analysis was performed using a 1:1 Langmuir binding model. ka, kd, and KD were calculated from the fitted curves.
4.7. Cellular Thermal Shift Assay (CETSA)
A549 cells were seeded in six-well plates and treated with salidroside or tyrosol (60 μM) for 0.5 h at 37 °C. To terminate the reaction, cells were washed with 300 μL of ice-cold PBS and harvested by scraping. The resulting cell suspensions were collected and subjected to a temperature gradient (45, 50, 55, 60, 65, 70, and 75 °C) for 3 min using a PCR thermal cycler (LongGene T10S, LongGene, Hangzhou, China). After heating, samples were immediately subjected to five freeze–thaw cycles between liquid nitrogen and room temperature to induce cell lysis. The lysates were then centrifuged at 12,000×
g for 15 min at 4 °C to remove insoluble, thermally denatured proteins. The resulting supernatants, containing soluble protein fractions, were mixed with 5 × loading buffer and prepared for subsequent Western blot analysis as described in
Section 4.10. Protein band intensities were quantified by densitometric analysis, and relative protein levels were normalized and plotted as temperature-dependent thermal stability curves.
4.8. Effects of DRD2 Receptor Antagonism on the Actions of Salidroside or Tyrosol
To examine whether the effects of salidroside and tyrosol on downstream signaling are mediated through DRD2, a pharmacological antagonism approach was employed. The human neuroblastoma cell line SH-SY5Y was used for these experiments. Phosphorylation of ERK, a downstream signaling molecule of DRD2, was assessed as a readout of receptor-mediated signaling activity.
SH-SY5Y cells were seeded into six-well plates at a density of 1.5 × 10⁵ cells per well and cultured for 24 h prior to treatment. Cells were pretreated with the DRD2 antagonist sulpiride (10 μM) for 30 min, followed by stimulation with salidroside or tyrosol (60 μM) for an additional 30 min. Control cells received vehicle treatment. After treatment, cells were washed with ice-cold PBS to terminate the reaction and lysed using protein lysis buffer. The lysates were centrifuged at 14,000× g for 10 min at 4 °C, and the supernatants were collected. Protein concentrations were determined using a BCA protein assay kit (Epizyme Biotech Co., Ltd., Shanghai, China) according to the manufacturer’s instructions. Loading buffer was added to the supernatants, and samples were denatured by heating at 95 °C for 5 min. The prepared samples were subsequently subjected to Western blot analysis.
4.9. Effects of DRD2 Receptor Gene Silencing on the Actions of Salidroside and Tyrosol
RNA interference (RNAi)-mediated knockdown of DRD2 was performed to further confirm the receptor dependence of salidroside- and tyrosol-induced signaling. SH-SY5Y cells were seeded into six-well plates at a density of 1.0 × 10⁵ cells per well and cultured for 24 h before transfection. Cells were transfected with DRD2-specific siRNA (DRD2-Homo-1113; Shanghai GenePharma Co., Ltd., Shanghai, China). The siRNA sequences were as follows: sense (5′-3′), CCGUUAUCAUGAAGUCUAATT; antisense (3′-5′), UUAGACUUCAUGAUAACGGTT. For transfection, 1 nM siRNA and 5 μL of Entraster™-R4000 transfection reagent (Engreen Biosystem, Ltd., Auckland, New Zealand) were mixed with 250 μL of serum-free DMEM/F12 medium and incubated for 15 min at room temperature. The transfection mixture was then added to each well and incubated with the cells for 24 h.
Following transfection, cells were treated with salidroside or tyrosol (60 μM) for 30 min. Cells were subsequently harvested, and total protein was extracted for Western blot analysis as described in
Section 4.10. In parallel, a separate set of cells was collected for total RNA extraction using TRIzol reagent, and the efficiency of DRD2 knockdown was evaluated by quantitative real-time PCR.
4.10. Western Blot Analysis
Western blot analysis was performed according to standard procedures. For CETSA experiments, 50 μL of each sample was loaded per lane, whereas for receptor antagonism experiments, 30 μg of total protein was loaded per lane. Proteins were separated by sodium dodecyl sulfate-polyacrylamide gel electrophoresis (SDS-PAGE) and subsequently transferred onto the 0.45 μm polyvinylidene fluoride (PVDF) membrane. Membranes were blocked with 5% bovine serum albumin (BSA) in Tris-buffered saline with Tween 20 (TBST) for 2 h in room temperature, followed by incubation with the primary antibodies overnight at 4 °C. The primary antibodies used were as follows: a goat anti-DRD2 antibody (1:1000, ab30743, Abcam, Cambridge, UK) and a rabbit anti-phospho-ERK antibody (1:1000, CST #4370, Cell Signaling Technology, Danvers, MA, USA). After washing three times in 1×TBST, membranes were incubated with horseradish peroxidase (HRP)-conjugated rabbit anti-goat secondary antibody (1:2000, BA1006, Boster, Wuhan, China) at room temperature for 2 h. Protein bands were visualized using enhanced chemiluminescence (ECL) reagents after appropriate washing steps. For total ERK blotting, the membranes were stripped using stripping buffer and re-incubated overnight at 4 °C with ERK primary antibody (1:2000, Abclonal A4782, Abclonal Technology, Wuhan, China) overnight at 4 °C, followed by incubation with the corresponding secondary antibody and ECL detection. Finally, images were acquired using a FluorChem M System (ProteinSimple, Santa Clara, CA, USA). Band intensities were quantified using ImageJ software 1.54 (LOCI, University of Wisconsin, Madison, WI, USA).
4.11. Real-Time PCR Assay
Total RNA was extracted using TRIzol reagent according to the manufacturer’s instructions. RNA concentration and purity were determined in an ultra-micro-spectrophotometer (Nanodrop2000, Thermo, Waltham, MA, USA). Afterwards, reverse transcription was performed using a First Strand cDNA Synthesis Kit (F. Hoffmann-La Roche Ltd., South San Francisco, CA, USA). Quantitative real-time PCR was carried out using an ABI StepOne plus real-time PCR system (Applied Biosystems, Carlsbad, CA, USA) with the FastStart Universal SYBR Green Master Mix (With ROX) (F. Hoffmann-La Roche Ltd., CA, USA). The amplification procedure was as follows: predenaturation at 95 °C for 10 min (95 °C, 15 s→60 °C, 60 s) × 40 cycles. The melting curve was measured at 60 °C→95 °C with a temperature increment of 0.3 °C per 15 s. The relative target gene expression was calculated using the 2−ΔΔCT method. Glyceraldehyde-3-phosphate dehydrogenase (GAPDH) was used as the internal reference gene. All primers were synthesized by Servicebio (Wuhan, China). The primer used were as follows: HOMO-DRD2 forward primer (5′-3′): GGTAATGCCGTGGGTTGTCT; HOMO-DRD2 reverse primer (5′-3′): TTGTTGAGTCCGAAGAGCAGT; HOMO-GAPDH forward primer (5′-3′): GGAAGCTTGTCATCAATGGAAATC; HOMO-GAPDH reverse primer (5′-3′): TGATGACCCTTTTGGCTCCC.
4.12. Statistical Analysis
All data are presented as mean ± standard error of the mean (SEM). For normally distributed data, statistical analyses were performed using one-way analysis of variance (ANOVA). Post hoc intergroup comparisons were conducted using the least significant difference (LSD) test when variances were homogeneous, or the Games–Howell test when variances were unequal. A two-tailed p-value < 0.05 was considered statistically significant. All analyses were performed using GraphPad Prism 8 software.



 ,
,