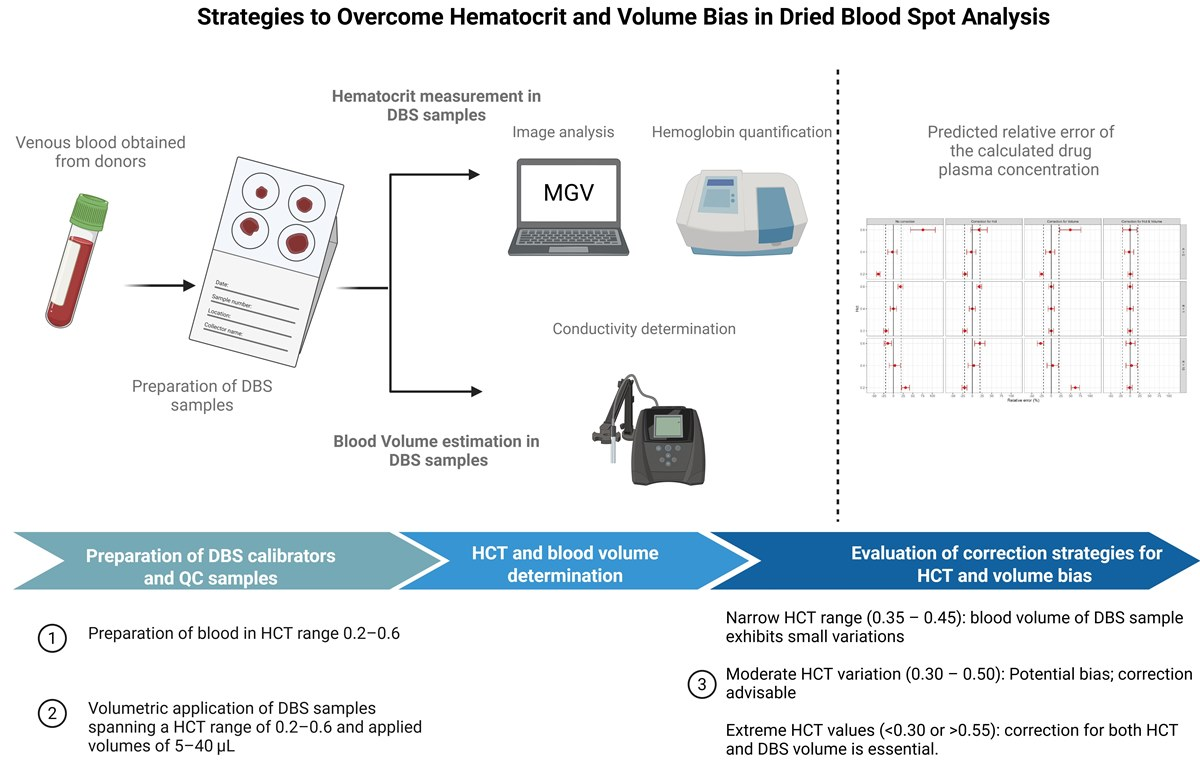
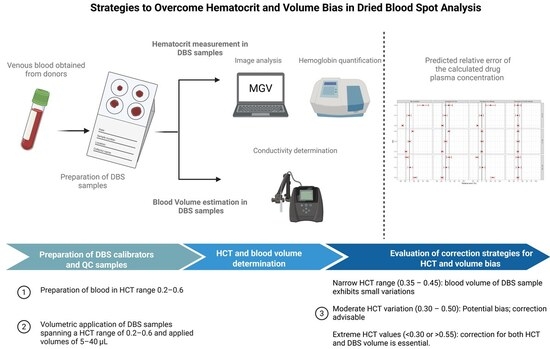
Strategies to Overcome Hematocrit and Volume Bias in Dried Blood Spot Analysis
 , , and
Abstract
1. Introduction
2. Results
2.1. Hematocrit Determination in DBS Samples
2.1.1. Hematocrit and Surface Area Measurements Using Image Analysis
2.1.2. Determination of HCT by Measuring Hemoglobin
2.2. Blood Volume Estimation in DBS Samples
Determination of Blood Volume in DBS Conductivity Method
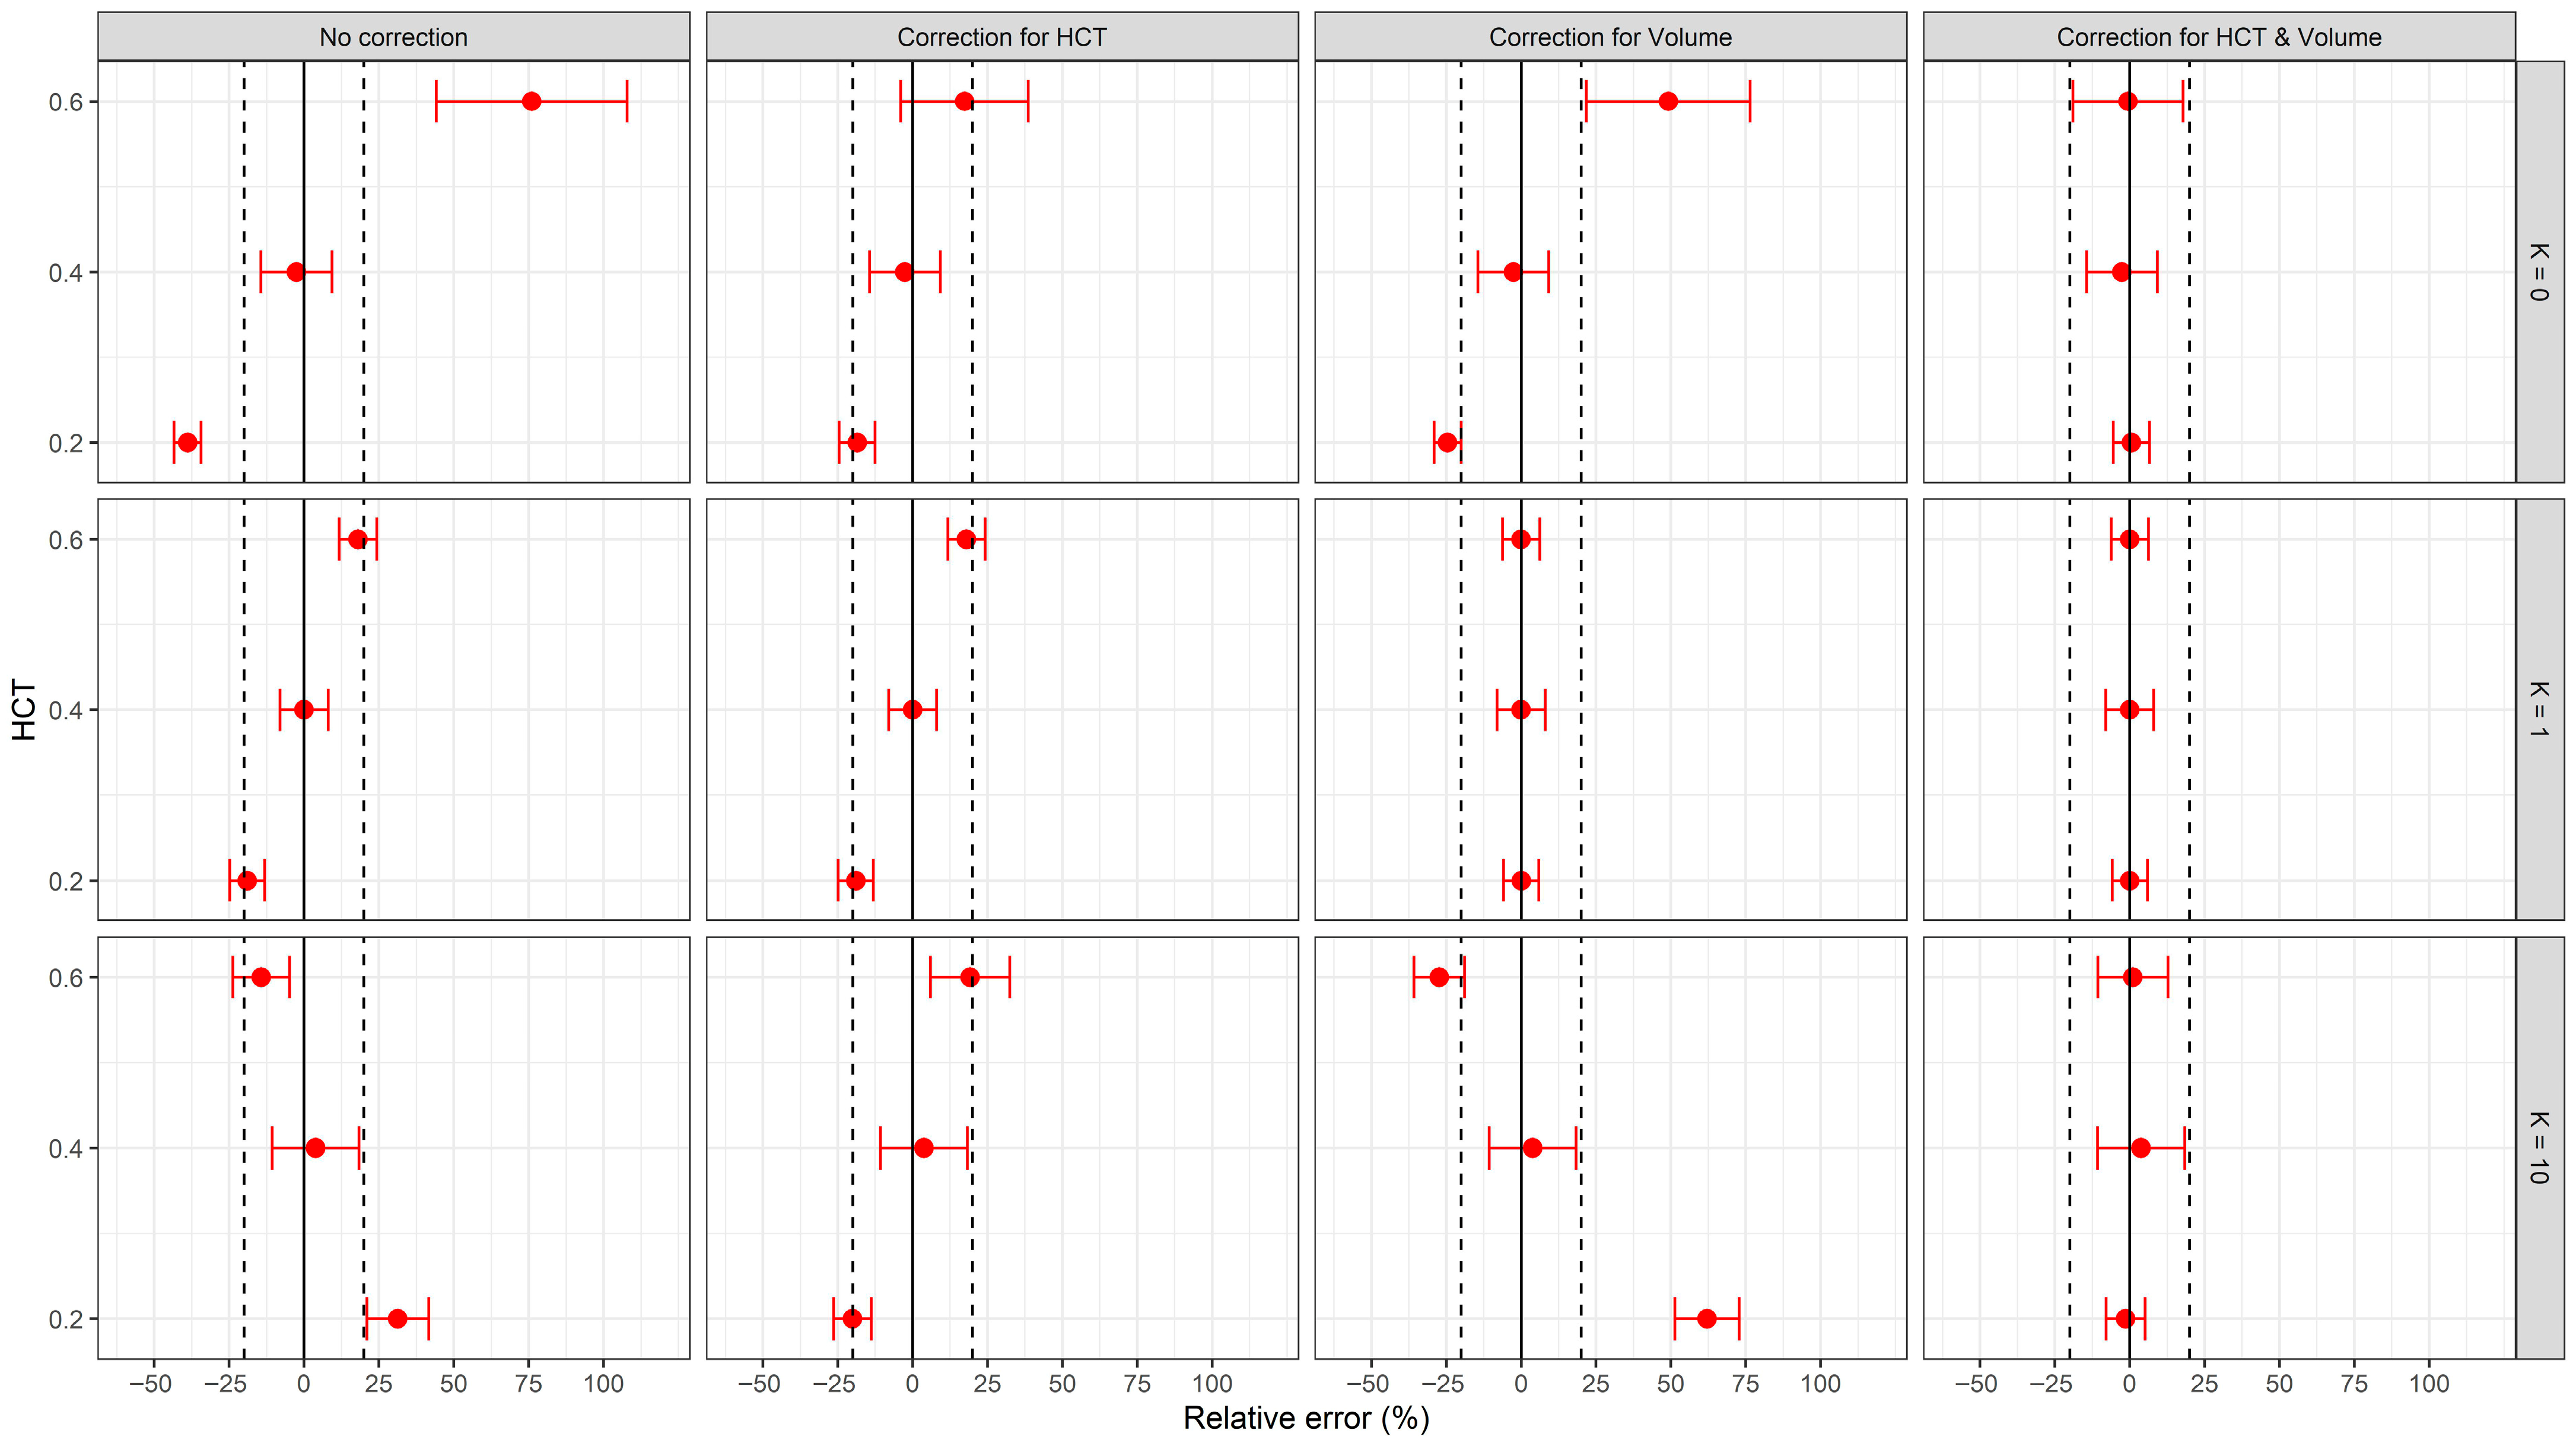
2.3. Evaluation of Correction Strategies for HCT and Volume Bias in DBS Analyte Quantification
3. Discussion
4. Materials and Methods
4.1. Chemicals and Materials
4.2. Preparation of DBS Calibrators and QC Samples
4.3. Hematocrit Measurement in DBS Samples
4.3.1. Hematocrit Measurement in DBS Samples Using Image Analysis
4.3.2. Hematocrit Determination Using Hemoglobin Measurement by UV-VIS Spectrometry
4.4. Blood Volume Determination Using the Conductivity Method
4.5. Validation
4.6. Patient DBS Samples
4.7. Data Analysis
5. Conclusions
Author Contributions
Funding
Institutional Review Board Statement
Informed Consent Statement
Data Availability Statement
Conflicts of Interest
Abbreviations
| ANCOVA | Analysis of covariance |
| 95% CI | 95% Confidence Interval |
| Cb | Drug concentration in blood |
| Cp | Drug concentration in blood plasma |
| DBS | Dried blood spots |
| Hb | Hemoglobin |
| HCT | Hematocrit |
| IBD | Inflammatory bowel disease |
| K | Drug blood cell-to-plasma partition coefficient |
| K2-EDTA | Ethylenediaminetetraacetic acid |
| Li-heparin | Lithium heparin |
| LLOQ | Lower limit of quantification |
| LoA | Limits of agreement |
| MAPE | Mean absolute percentage error |
| MGV | Mean gray value |
| MPPE | Mean predictive percent error |
| QC | Quality control |
| QCH | Quality control high concentration |
| QCL | Quality control low concentration |
| QCM | Quality control medium concentration |
| RSD | Relative standard deviation |
| SLS | Sodium lauryl sulphate |
| TDM | Therapeutic drug monitoring |
| TIFF | Tagged image file format |
| UST | Ustekinumab |
| UV-VIS | Ultraviolet–visible spectrophotometry |
| Vpred | Predicted volume of blood sample |
| Vnom | Nominal volume of blood sample |
References
- Catlett, B.; Hajarizadeh, B.; Cunningham, E.; Wolfson-Stofko, B.; Wheeler, A.; Khandaker-Hussain, B.; Feld, J.J.; Martró, E.; Chevaliez, S.; Pawlotsky, J.M.; et al. Diagnostic Accuracy of Assays Using Point-of-Care Testing or Dried Blood Spot Samples for the Determination of Hepatitis C Virus RNA: A Systematic Review. J. Infect. Dis. 2022, 226, 1005–1021. [Google Scholar] [CrossRef] [Scilit]
- Chhoung, C.; Ouoba, S.; Lingani, M.; Ko, K.; Phyo, Z.; Mirzaev, U.K.; Yoshinaga, Y.; Akuffo, G.A.; Sugiyama, A.; Akita, T.; et al. Weighted prevalence and associated risk factors of hepatitis E virus antibodies among pregnant women in rural Burkina Faso using dried blood spot samples. Hepatol. Res. 2025, 55, 795–806. [Google Scholar] [CrossRef] [Scilit] [PubMed]
- Affan, E.T.; Praveen, D.; Chow, C.K.; Neal, B.C. Comparability of HbA1c and lipids measured with dried blood spot versus venous samples: A systematic review and meta-analysis. BMC Clin. Pathol. 2014, 14, 21. [Google Scholar] [CrossRef] [Scilit] [PubMed]
- Alquero, J.N.M.; Estanislao, P.M.S.; Hermino, S.M.M.; Manding, R.D.M.; Robles, J.E.D.; Canillo, C.M.A.; Tantengco, O.A.G. Use of dried blood spots in the detection of coronavirus disease 2019 (COVID-19): A systematic review. Indian J. Med. Microbiol. 2024, 51, 100700. [Google Scholar] [CrossRef] [Scilit] [PubMed]
- Milosheska, D.; Roškar, R.; Vovk, T.; Lorber, B.; Grabnar, I.; Trontelj, J. An LC-MS/MS Method for Quantification of Lamotrigine and Its Main Metabolite in Dried Blood Spots. Pharmaceuticals 2024, 17, 449. [Google Scholar] [CrossRef] [Scilit]
- Martial, L.C.; Aarnoutse, R.E.; Schreuder, M.F.; Henriet, S.S.; Brüggemann, R.J.M.; Joore, M.A. Cost Evaluation of Dried Blood Spot Home Sampling as Compared to Conventional Sampling for Therapeutic Drug Monitoring in Children. PLoS ONE 2016, 11, e0167433. [Google Scholar] [CrossRef] [Scilit]
- De Kesel, P.M.M.; Sadones, N.; Capiau, S.; Lambert, W.E.; Stove, C.P. Hemato-critical issues in quantitative analysis of dried blood spots: Challenges and solutions. Bioanalysis 2013, 5, 2023–2041. [Google Scholar] [CrossRef] [Scilit]
- Londhe, V.; Rajadhyaksha, M. Opportunities and obstacles for microsampling techniques in bioanalysis: Special focus on DBS and VAMS. J. Pharm. Biomed. Anal. 2020, 182, 113102. [Google Scholar] [CrossRef] [Scilit]
- Timmerman, P.; White, S.; Cobb, Z.; De Vries, R.; Thomas, E.; Van Baar, B. Update of the EBF recommendation for the use of DBS in regulated bioanalysis integrating the conclusions from the EBF DBS-microsampling consortium. Bioanalysis 2013, 5, 2129–2136. [Google Scholar] [CrossRef] [Scilit]
- Velghe, S.; Delahaye, L.; Stove, C.P. Is the hematocrit still an issue in quantitative dried blood spot analysis? J. Pharm. Biomed. Anal. 2019, 163, 188–196. [Google Scholar] [CrossRef] [Scilit]
- Alsous, M.M.; Hawwa, A.F.; McElnay, J.C. Hematocrit, blood volume, and surface area of dried blood spots—A quantitative model. Drug Test Anal. 2020, 12, 555–560. [Google Scholar] [CrossRef] [Scilit] [PubMed]
- Wilhelm, A.J.; den Burger, J.C.G.; Swart, E.L. Therapeutic drug monitoring by dried blood spot: Progress to date and future directions. Clin. Pharmacokinet. 2014, 53, 961–973. [Google Scholar] [CrossRef] [Scilit]
- De Kesel, P.M.M.; Capiau, S.; Lambert, W.E.; Stove, C.P. Current strategies for coping with the hematocrit problem in dried blood spot analysis. Bioanalysis 2014, 6, 1871–1874. [Google Scholar] [CrossRef] [Scilit]
- Del Ben, F.; Biasizzo, J.; Curcio, F. A fast, nondestructive, low-cost method for the determination of hematocrit of dried blood spots using image analysis. Clin. Chem. Lab. Med. 2019, 57, e81–e82. [Google Scholar] [CrossRef] [Scilit]
- Liao, H.W.; Lin, S.W.; Lin, Y.T.; Lee, C.H.; Kuo, C.H. Identification of potential sphingomyelin markers for the estimation of hematocrit in dried blood spots via a lipidomic strategy. Anal. Chim. Acta. 2018, 1003, 34–41. [Google Scholar] [CrossRef] [Scilit]
- Oostendorp, M.; El Amrani, M.; Diemel, E.C.; Hekman, D.; van Maarseveen, E.M. Measurement of Hematocrit in Dried Blood Spots Using Near-Infrared Spectroscopy: Robust, Fast, and Nondestructive. Clin. Chem. 2016, 62, 1534–1536. [Google Scholar] [CrossRef] [Scilit]
- Capiau, S.; Wilk, L.S.; De Kesel, P.M.M.M.; Aalders, M.C.G.G.; Stove, C.P. Correction for the Hematocrit Bias in Dried Blood Spot Analysis Using a Nondestructive, Single-Wavelength Reflectance-Based Hematocrit Prediction Method. Anal. Chem. 2018, 90, 1795–1804. [Google Scholar] [CrossRef] [Scilit] [PubMed]
- De Kesel, P.M.M.; Capiau, S.; Stove, V.V.; Lambert, W.E.; Stove, C.P. Potassium-based algorithm allows correction for the hematocrit bias in quantitative analysis of caffeine and its major metabolite in dried blood spots. Anal. Bioanal. Chem. 2014, 406, 6749–6755. [Google Scholar] [CrossRef] [Scilit]
- Richardson, G.; Marshall, D.; Keevil, B.G. Prediction of haematocrit in dried blood spots from the measurement of haemoglobin using commercially available sodium lauryl sulphate. Ann. Clin. Biochem. 2018, 55, 363–367. [Google Scholar] [CrossRef] [Scilit] [PubMed]
- Karsan, A.; Maclaren, I.; Conn, D.; Wadsworth, L. An evaluation of hemoglobin determination using sodium lauryl sulfate. Am. J. Clin. Pathol. 1993, 100, 123–126. [Google Scholar] [CrossRef] [Scilit]
- Kadjo, A.F.; Stamos, B.N.; Shelor, C.P.; Berg, J.M.; Blount, B.C.; Dasgupta, P.K. Evaluation of Amount of Blood in Dry Blood Spots: Ring-Disk Electrode Conductometry. Anal. Chem. 2016, 88, 6531–6537. [Google Scholar] [CrossRef] [Scilit]
- Howanitz, J.H.; Howanitz, P.J. Evaluation of Serum and Whole Blood Sodium Critical Values. Am. J. Clin. Pathol. 2007, 127, 56–59. [Google Scholar] [CrossRef]
- Lima-Oliveira, G.; Salvagno, G.L.; Danese, E.; Brocco, G.; Guidi, G.C.; Lippi, G. Contamination of lithium heparin blood by K2-Ethylenediaminetetraacetic acid (EDTA): An experimental evaluation. Biochem. Medica. 2014, 24, 359–367. [Google Scholar] [CrossRef] [Scilit] [PubMed]
- Mingas, P.D.; Aguiar Zdovc, J.; Grabnar, I.; Drobne, D.; Vovk, T. Development, Validation and Application of the Dried Blood Spot Analysis Method for the Determination of Ustekinumab in Patients with Inflammatory Bowel Disease. Pharmaceuticals 2025, 18, 1253. [Google Scholar] [CrossRef] [Scilit] [PubMed]
- Sloop, G.D.; De Mast, Q.; Pop, G.; Weidman, J.J.; Cyr, J.A.S. The Role of Blood Viscosity in Infectious Diseases. Cureus 2020, 12, e7090. [Google Scholar] [CrossRef] [Scilit]
- Koster, R.A.; Alffenaar, J.W.C.; Botma, R.; Greijdanus, B.; Touw, D.J.; Uges, D.R.A.; Kosterink, J.G. What is the right blood hematocrit preparation procedure for standards and quality control samples for dried blood spot analysis? Bioanalysis 2015, 7, 345–351. [Google Scholar] [CrossRef] [Scilit] [PubMed]
- Schindelin, J.; Arganda-Carreras, I.; Frise, E.; Kaynig, V.; Longair, M.; Pietzsch, T.; Preibisch, S.; Rueden, C.; Saalfeld, S.; Schmid, B.; et al. Fiji: An open-source platform for biological-image analysis. Nat. Methods 2012, 9, 676–682. [Google Scholar] [CrossRef] [Scilit]



| Method Range | Calibration Curve (n = 10) | r2 | Level (n = 5) | Nominal | Accuracy (%) | Precision (%) |
|---|---|---|---|---|---|---|
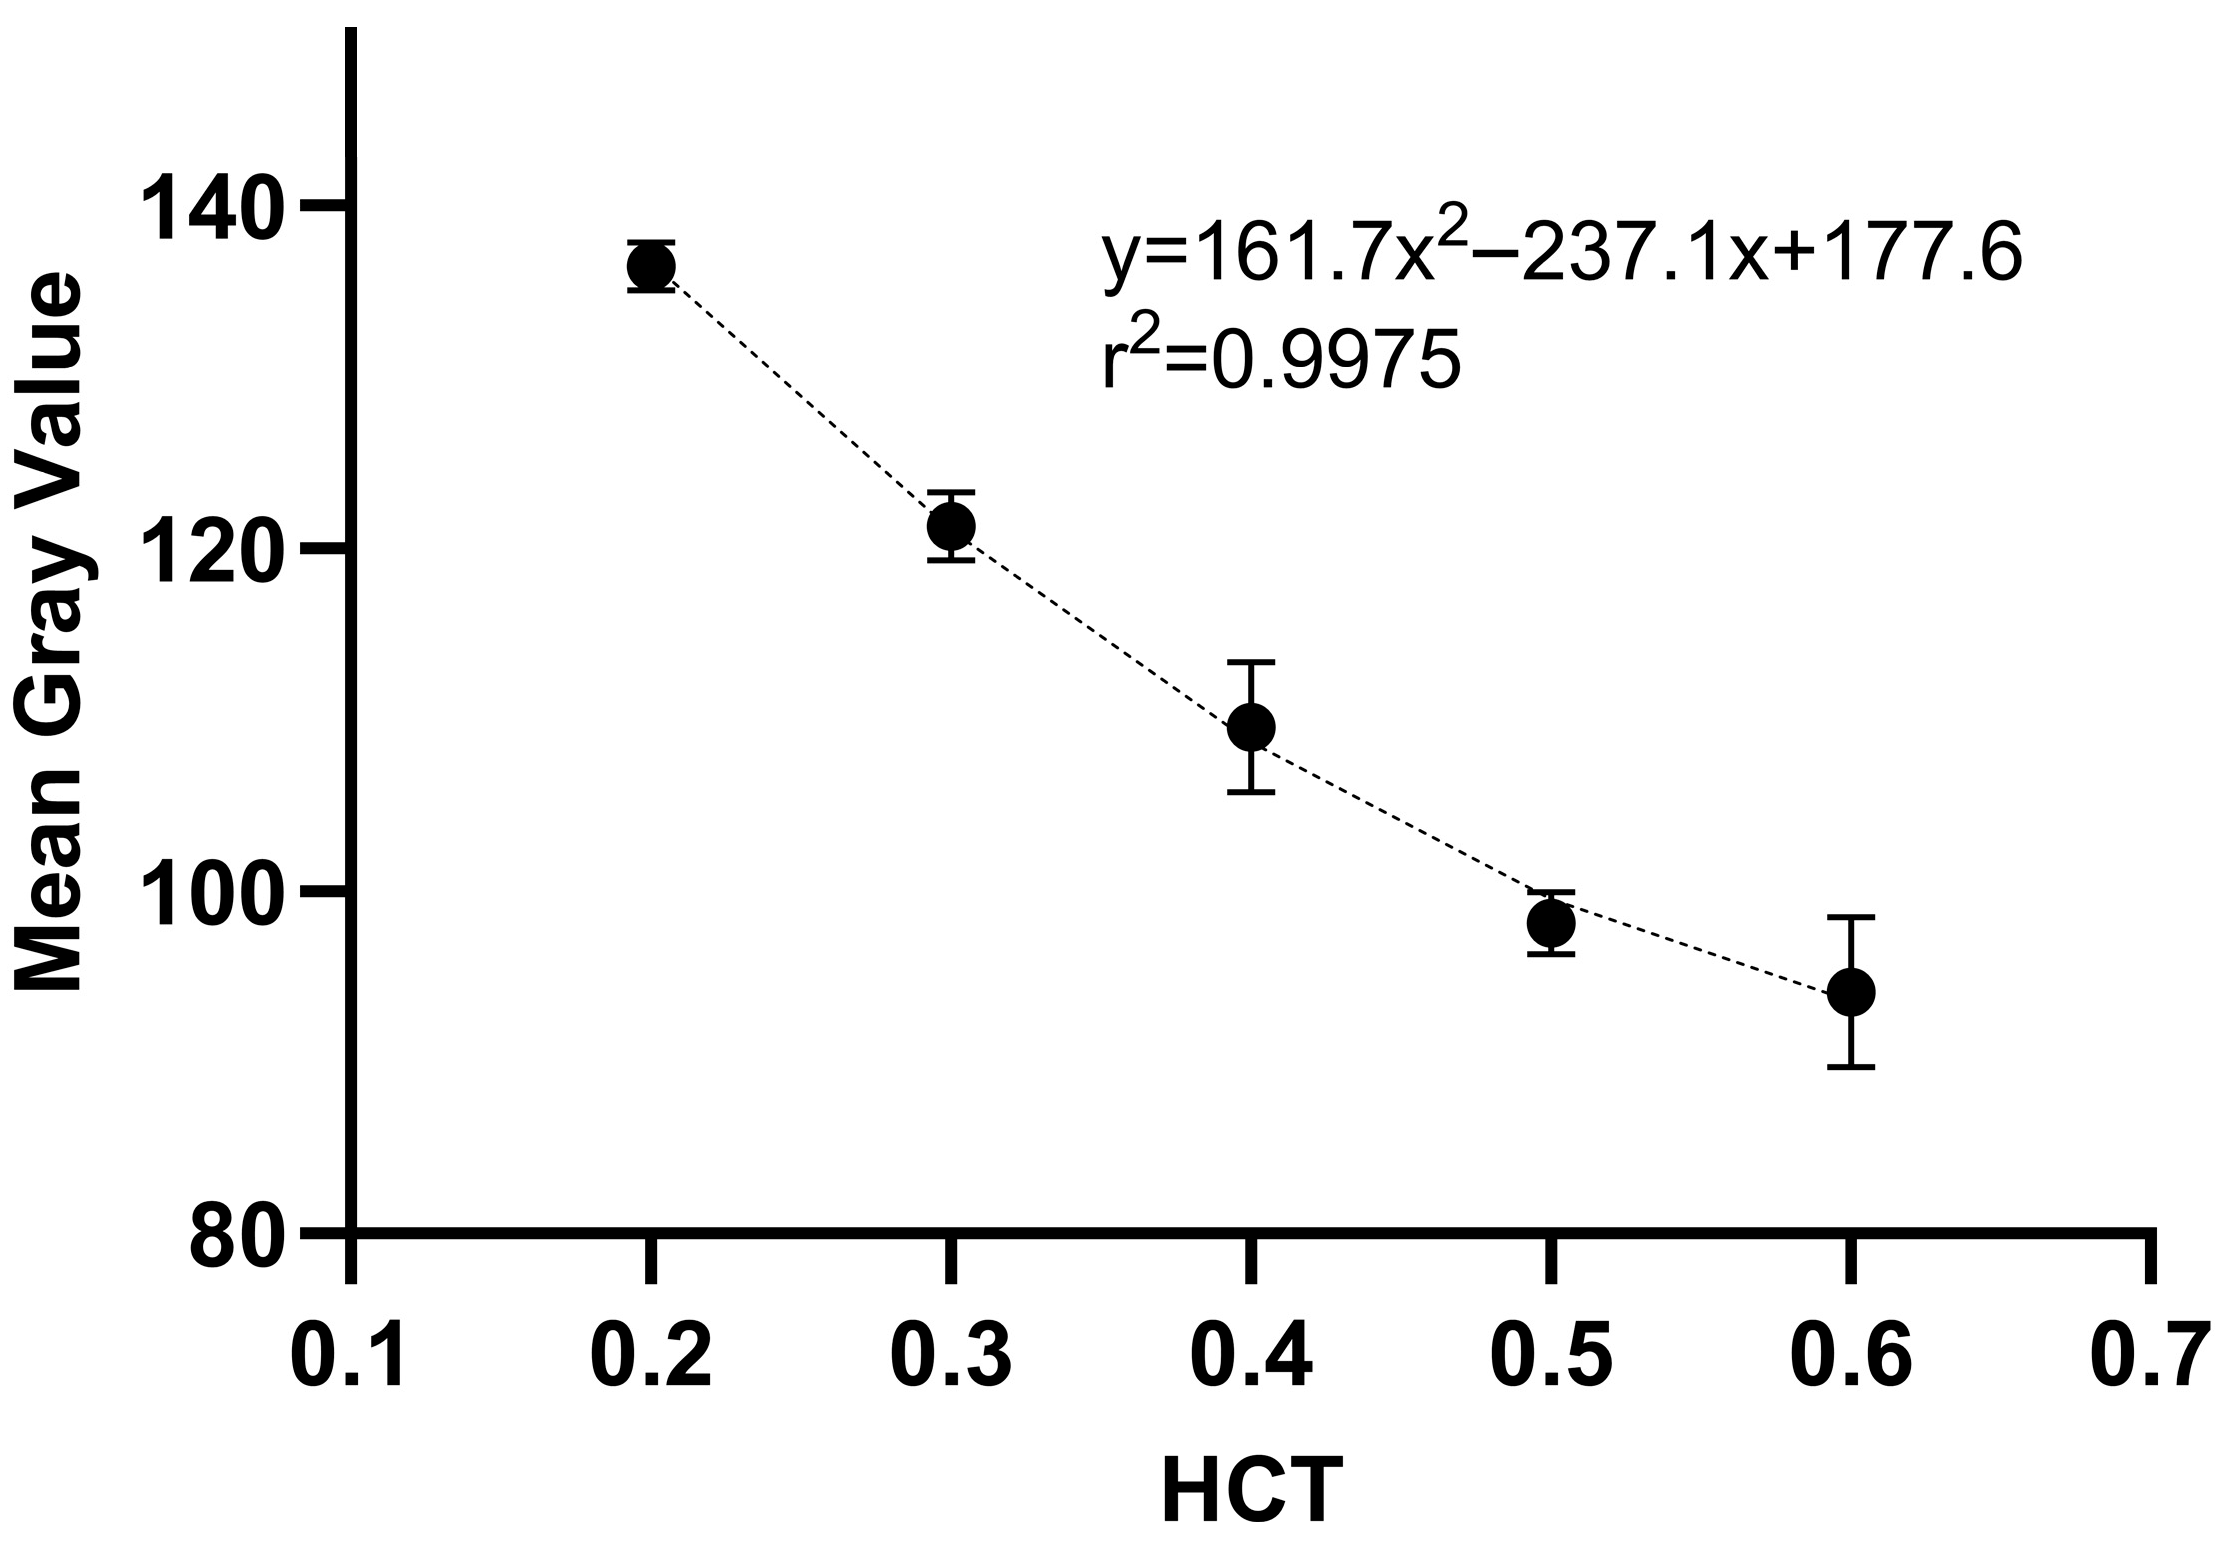
| 0.20–0.60 | MGV = 161.67 × HCT2 − 237.12 × HCT + 177.64 | 0.998 | QCL | 0.20 | 90.3 | 0.87 |
| QCM | 0.40 | 93.2 | 2.71 | |||
| QCH | 0.60 | 98.8 | 4.77 |
| Method Range | Calibration Curve (n = 10) | r2 | Level | Nominal (n = 5) | Accuracy (%) | Precision (%) |
|---|---|---|---|---|---|---|
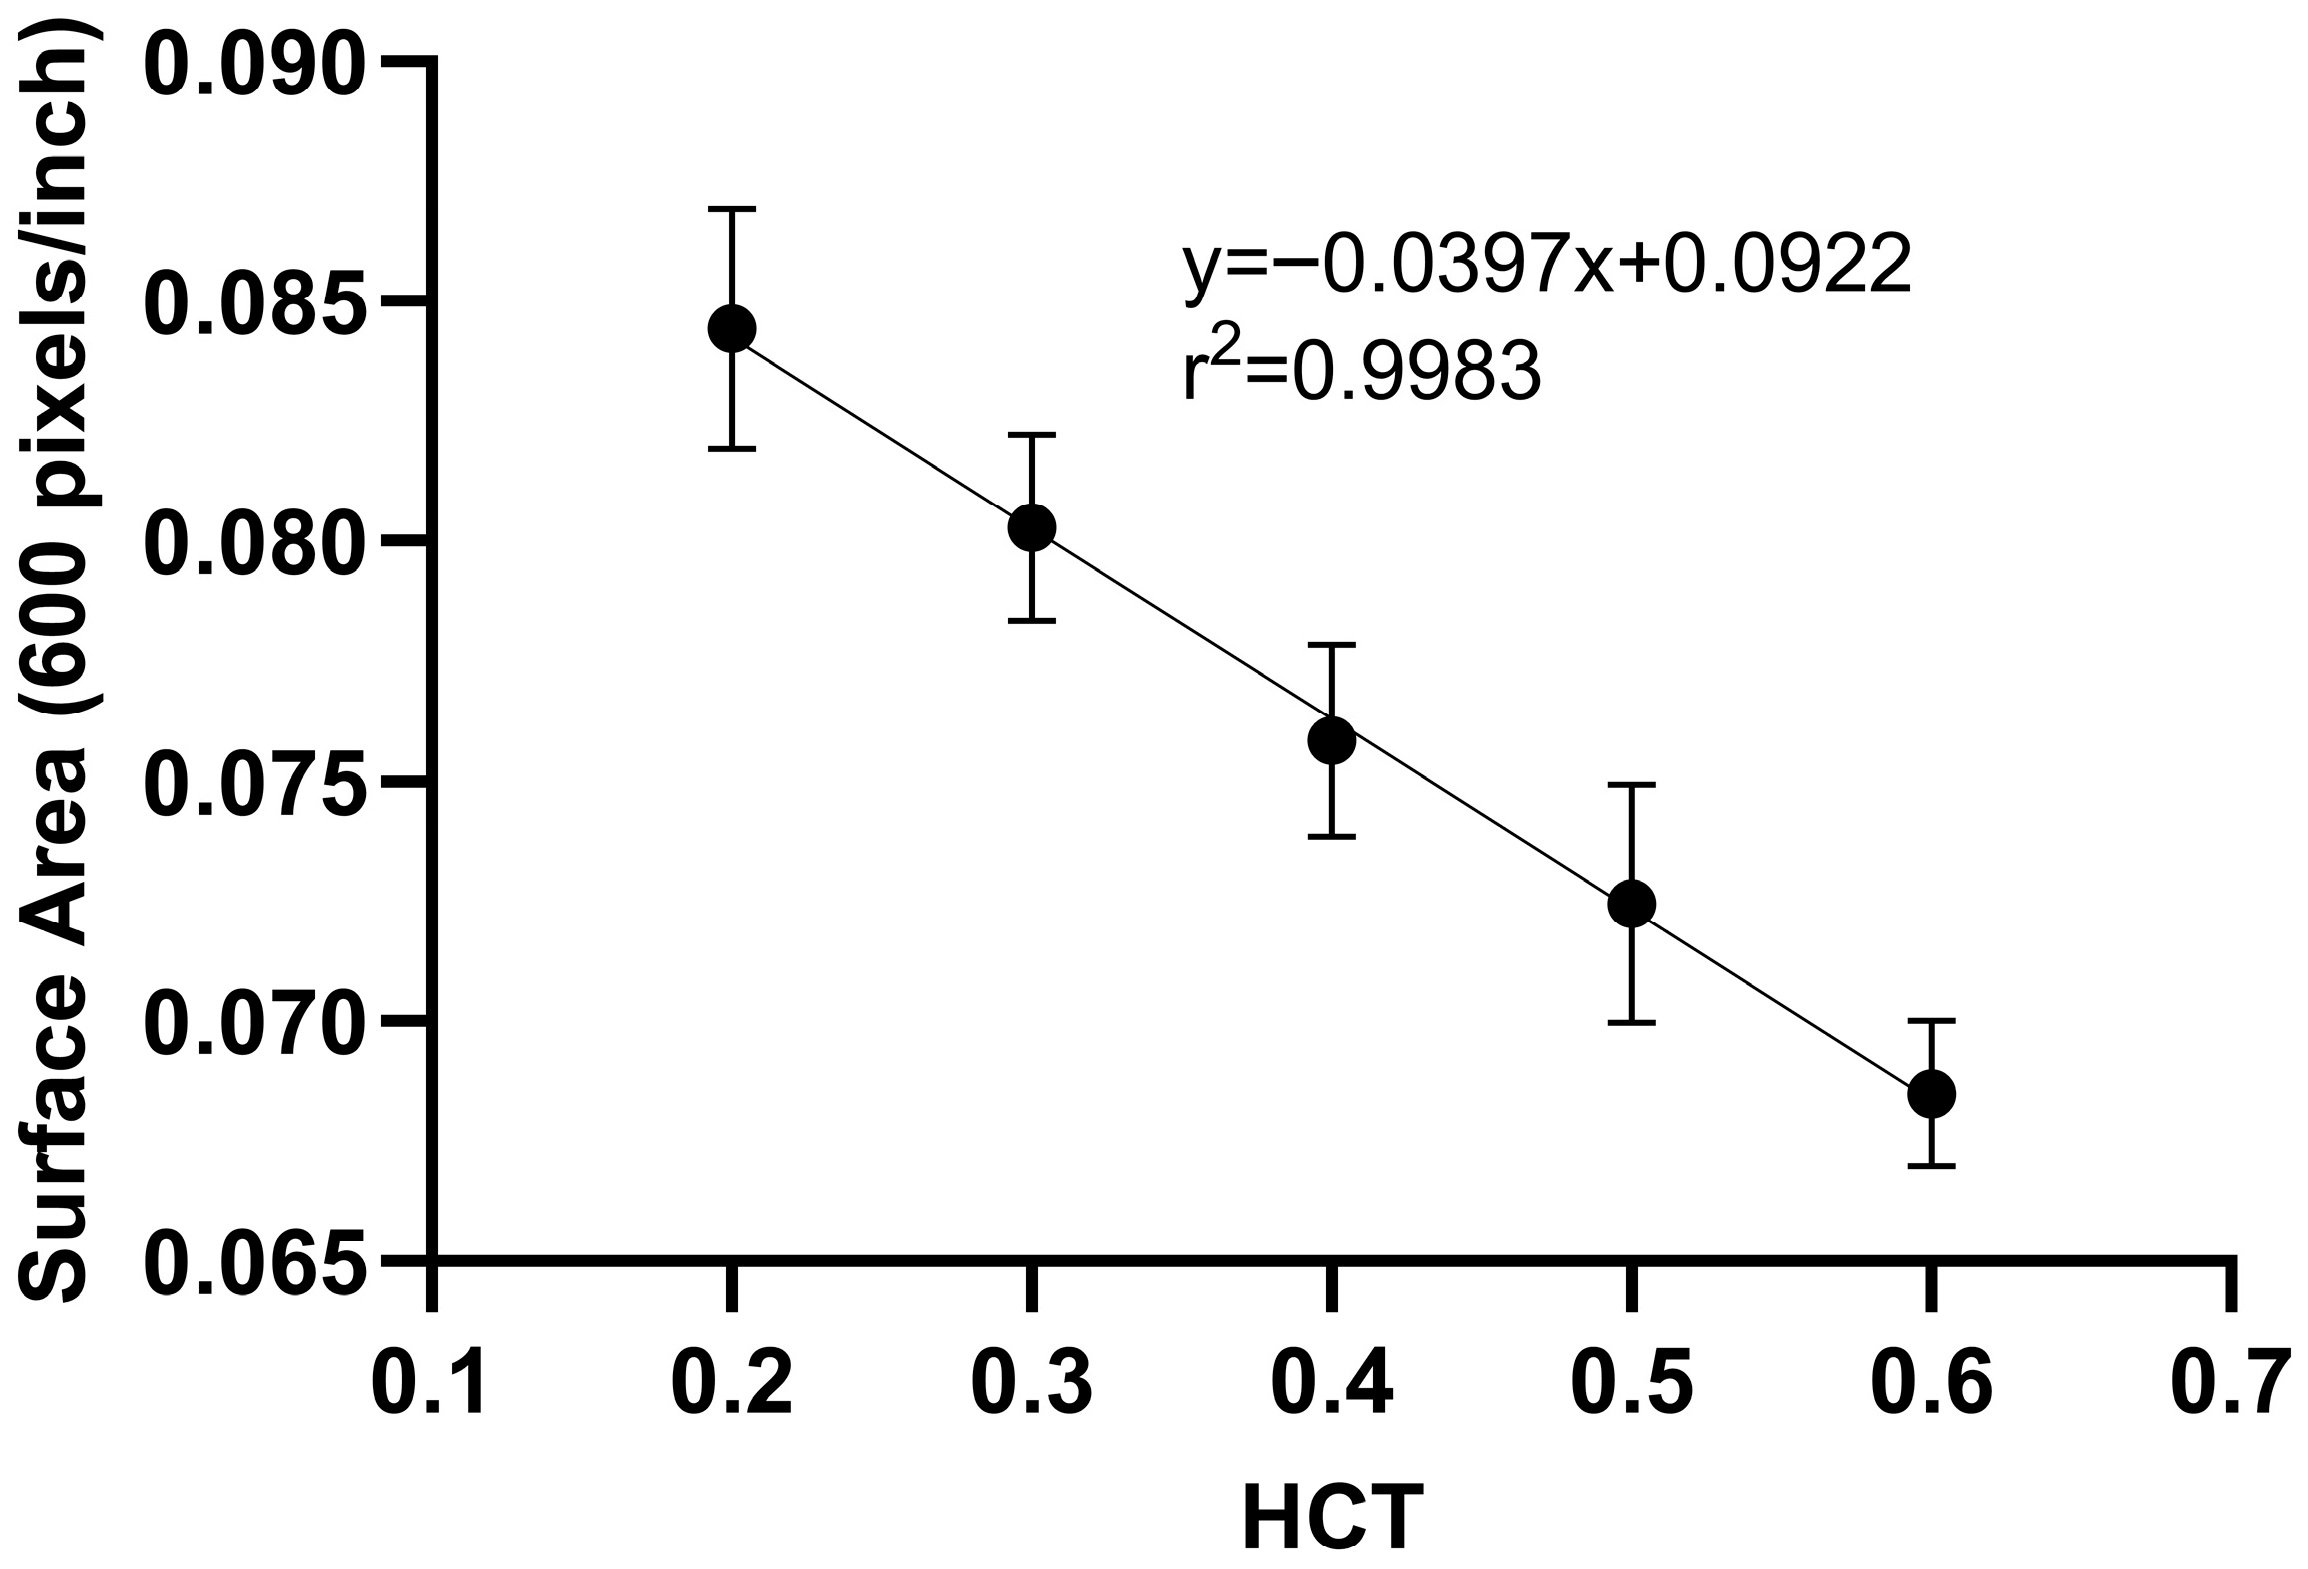
| 0.20–0.60 | SA = −0.0397 × HCT + 0.0922 | 0.998 | QCL | 0.20 | 103 | 11.3 |
| QCM | 0.40 | 103 | 5.73 | |||
| QCH | 0.60 | 99.6 | 5.63 |
| Method Range | Calibration Curve (n = 5) | r2 | Level (n = 5) | Nominal | Accuracy (%) | Precision (%) |
|---|---|---|---|---|---|---|
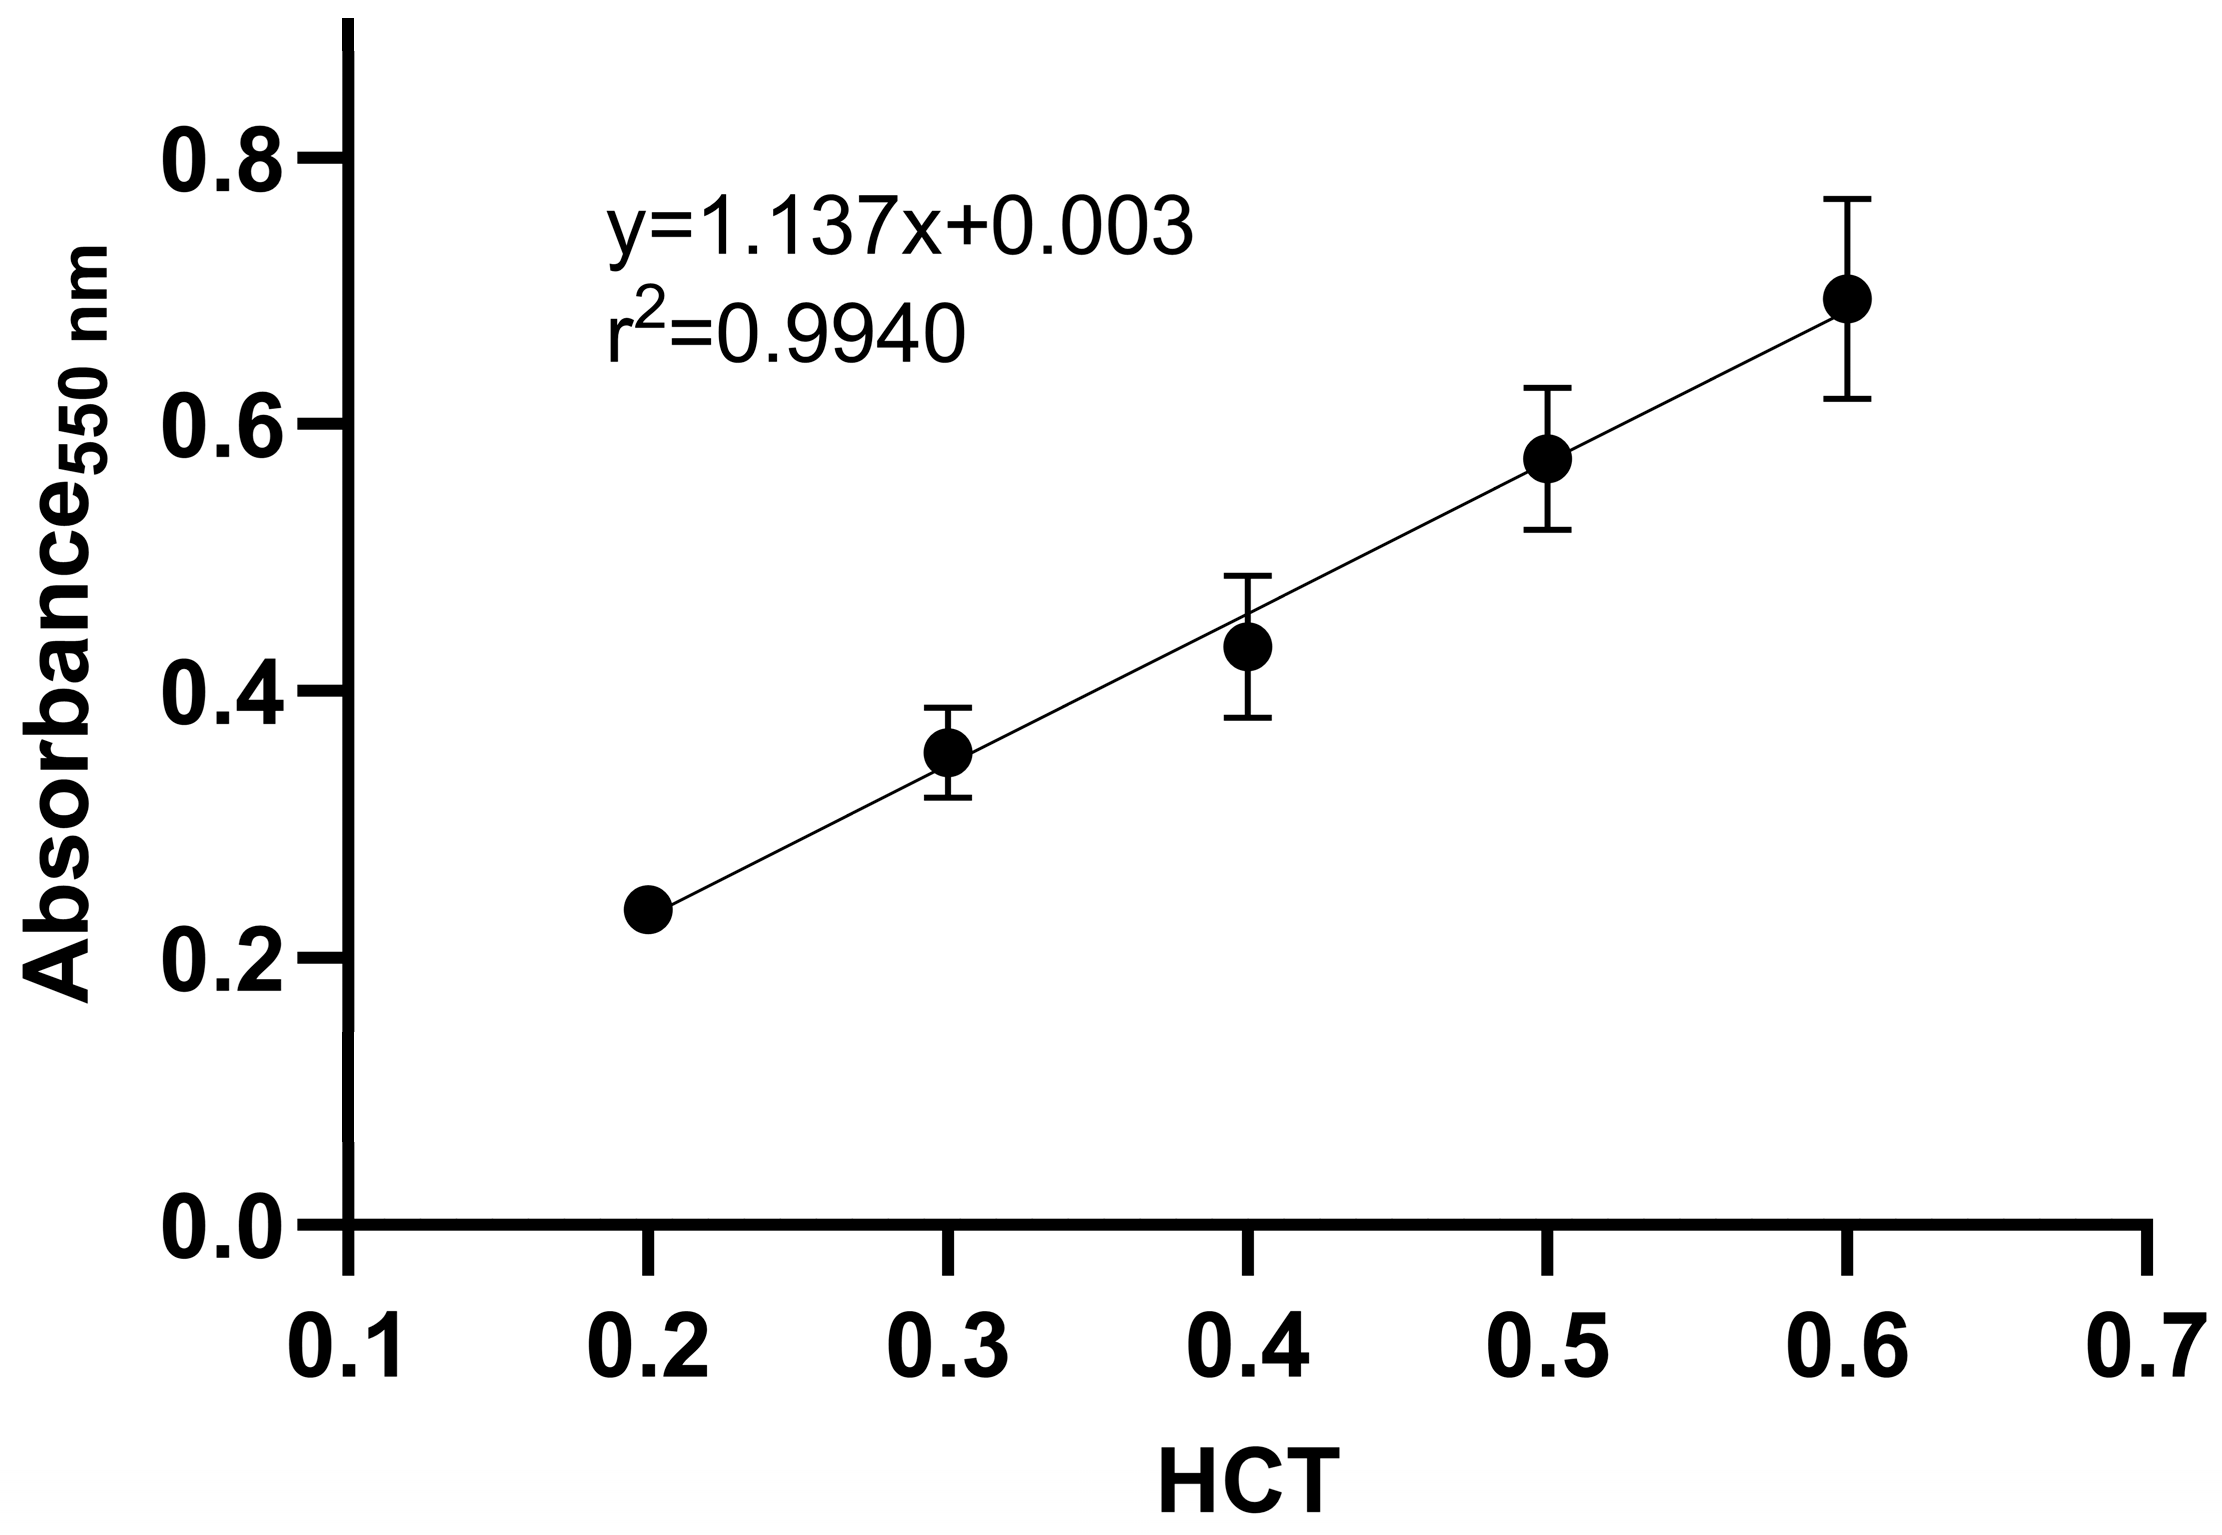
| 0.20–0.60 | ABS = 1.137 × HCT + 0.003 | 0.9939 | QCL | 0.20 | 102.2 | 2.45 |
| QCM | 0.40 | 95.7 | 7.44 | |||
| QCH | 0.60 | 99.1 | 5.87 |
| Method Range | Calibration Curve (n = 5) | r2 | Level (n = 5) | Nominal | Accuracy (%) | Precision (%) |
|---|---|---|---|---|---|---|
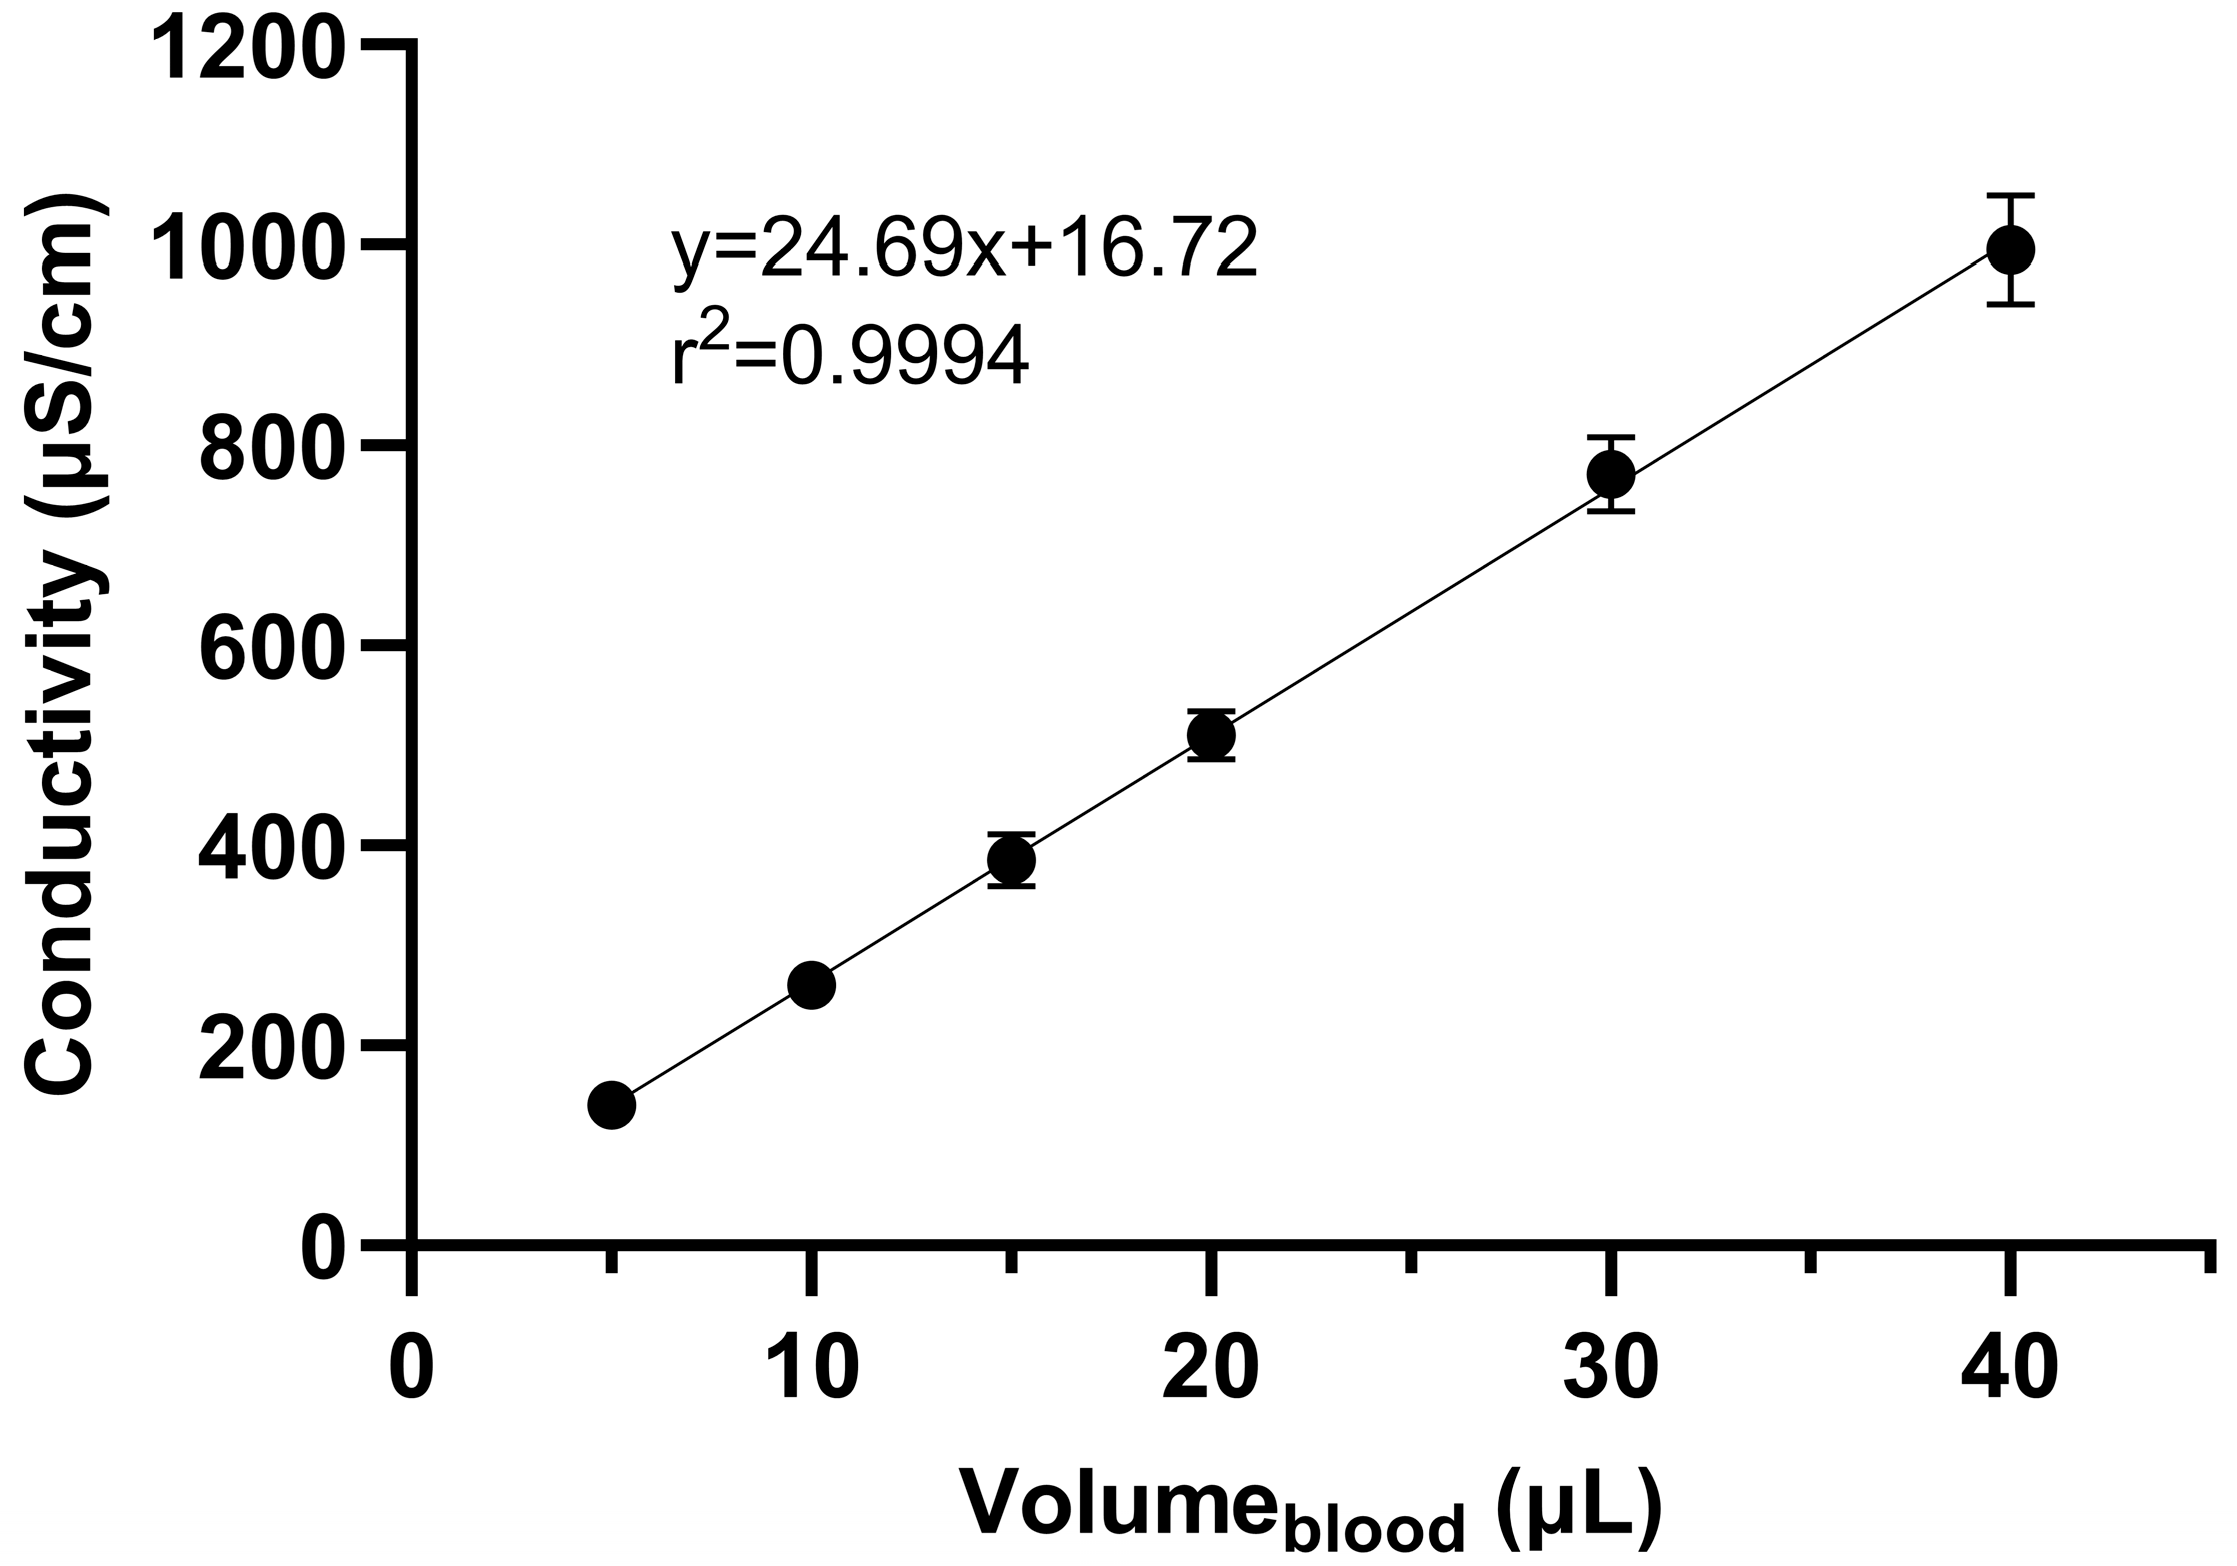
| 5.0–40.0 | Vol = 24.7 × Cond + 16.7 | 0.999 | QCL | 0.20 | 96.8 | 13.6 |
| QCM | 0.40 | 100 | 5.57 | |||
| QCH | 0.60 | 99.6 | 5.14 |
| Parameter | HCT 0.2 | HCT 0.3 | HCT 0.4 | HCT 0.5 * | HCT 0.6 * | HCT 0.2–0.6 |
|---|---|---|---|---|---|---|
| Calibration Curve | ||||||
| Slope | 25.97 | 26.06 | 25.18 | 23.01 | 23.22 | 24.69 |
| Intercept | 10.19 | 13.15 | −0.01 | 29.78 | 27.60 | 16.72 |
| r2 | 0.997 | 0.999 | 0.999 | 0.996 | 0.997 | 0.999 |
| Blood volume (μL) | ||||||
| HCT-specific calibration curve 1 | 8.1 ± 0.29 | 9.1 ± 0.27 | 10.1 ± 0.38 | 11.0 ± 0.32 | 11.7 ± 0.32 | – |
| HCT 0.2–0.6 calibration curve 2 | 8.4 ± 0.31 | 9.5 ± 0.29 | 9.6 ± 0.39 | 10.5 ± 0.32 | 11.4 ± 0.30 | – |
| Method | Target | Advantages | Disadvantages | When to Use |
|---|---|---|---|---|
| Image analysis method | Hematocrit determination |
|
|
|
| Hemoglobin method | Hematocrit determination |
|
|
|
| Conductivity method | DBS volume estimation |
|
|
|
Disclaimer/Publisher’s Note: The statements, opinions and data contained in all publications are solely those of the individual author(s) and contributor(s) and not of MDPI and/or the editor(s). MDPI and/or the editor(s) disclaim responsibility for any injury to people or property resulting from any ideas, methods, instructions or products referred to in the content. |
© 2026 by the authors. Licensee MDPI, Basel, Switzerland. This article is an open access article distributed under the terms and conditions of the Creative Commons Attribution (CC BY) license.
Share and Cite
Mingas, P.-D.; Cirar, M.; Grabnar, I.; Drobne, D.; Vovk, T. Strategies to Overcome Hematocrit and Volume Bias in Dried Blood Spot Analysis. Pharmaceuticals 2026, 19, 403. https://doi.org/10.3390/ph19030403
Mingas P-D, Cirar M, Grabnar I, Drobne D, Vovk T. Strategies to Overcome Hematocrit and Volume Bias in Dried Blood Spot Analysis. Pharmaceuticals. 2026; 19(3):403. https://doi.org/10.3390/ph19030403
Chicago/Turabian StyleMingas, Panagiotis-Dimitrios, Matjaž Cirar, Iztok Grabnar, David Drobne, and Tomaž Vovk. 2026. "Strategies to Overcome Hematocrit and Volume Bias in Dried Blood Spot Analysis" Pharmaceuticals 19, no. 3: 403. https://doi.org/10.3390/ph19030403
APA StyleMingas, P.-D., Cirar, M., Grabnar, I., Drobne, D., & Vovk, T. (2026). Strategies to Overcome Hematocrit and Volume Bias in Dried Blood Spot Analysis. Pharmaceuticals, 19(3), 403. https://doi.org/10.3390/ph19030403