


Development of Analytical Method for the Quantitation of Monoclonal Antibodies Solutions via Raman Spectroscopy: The Case of Bevacizumab

 ,
,  and
and
Abstract
1. Introduction
2. Results
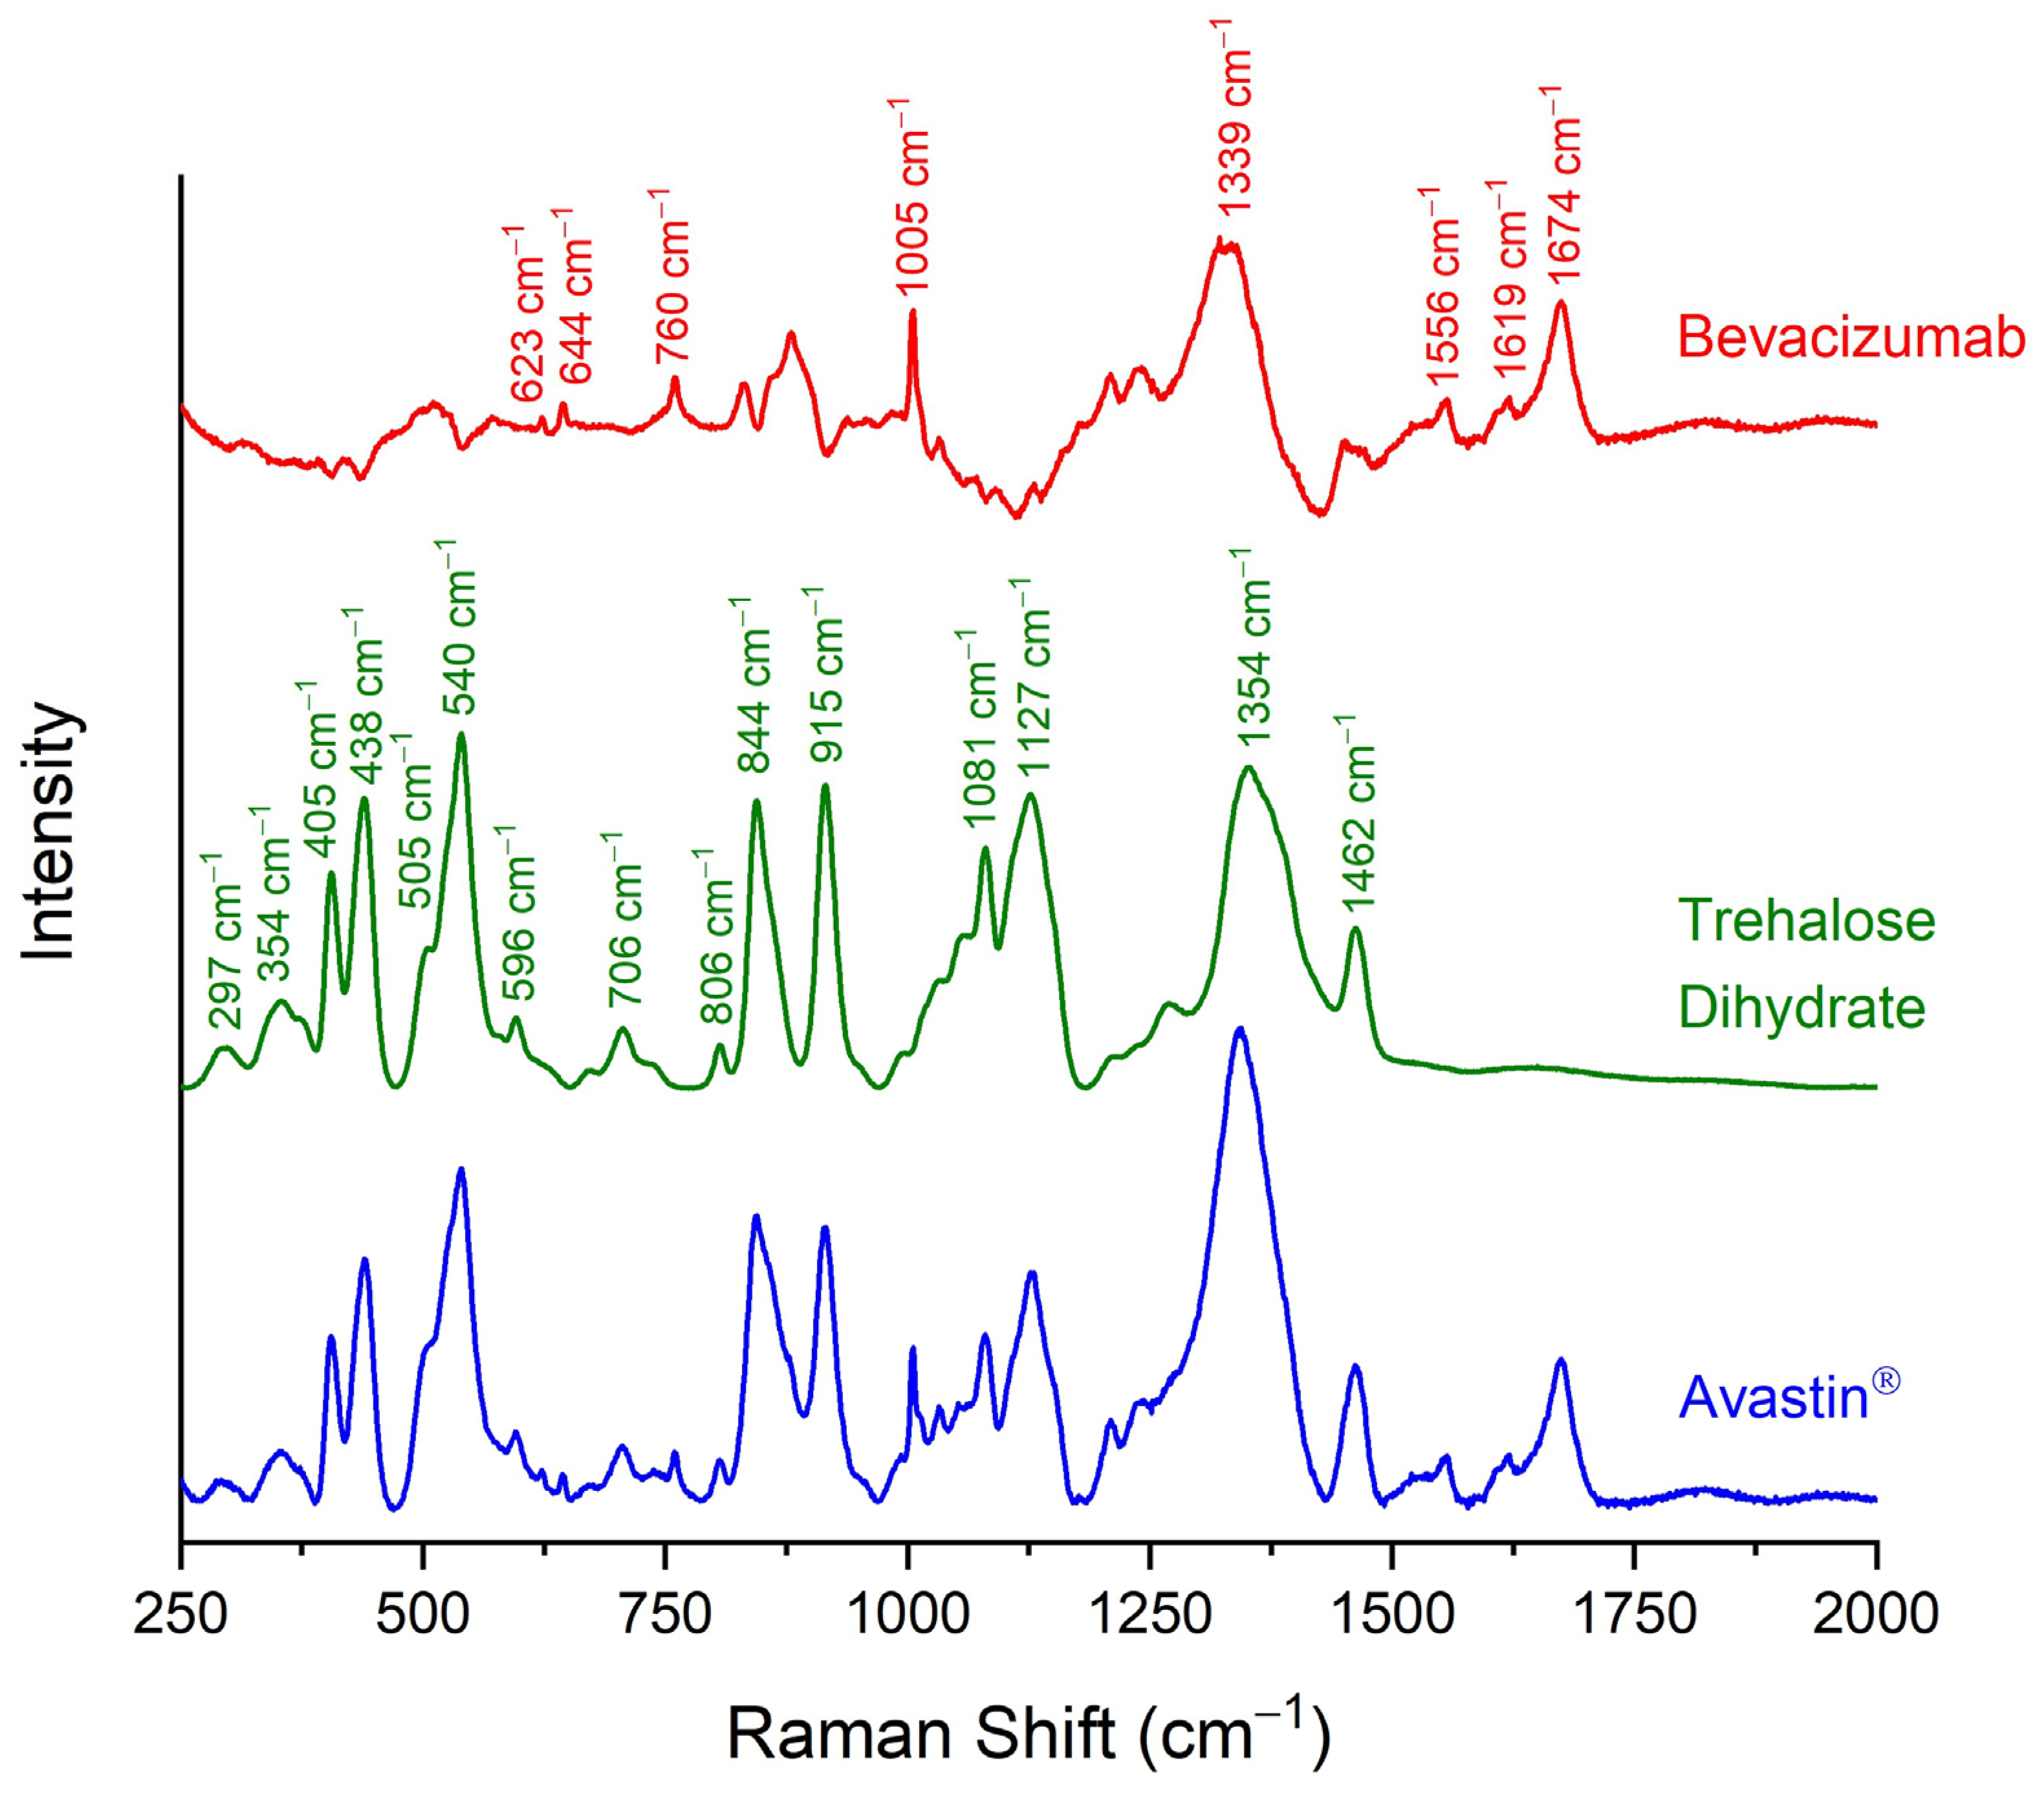
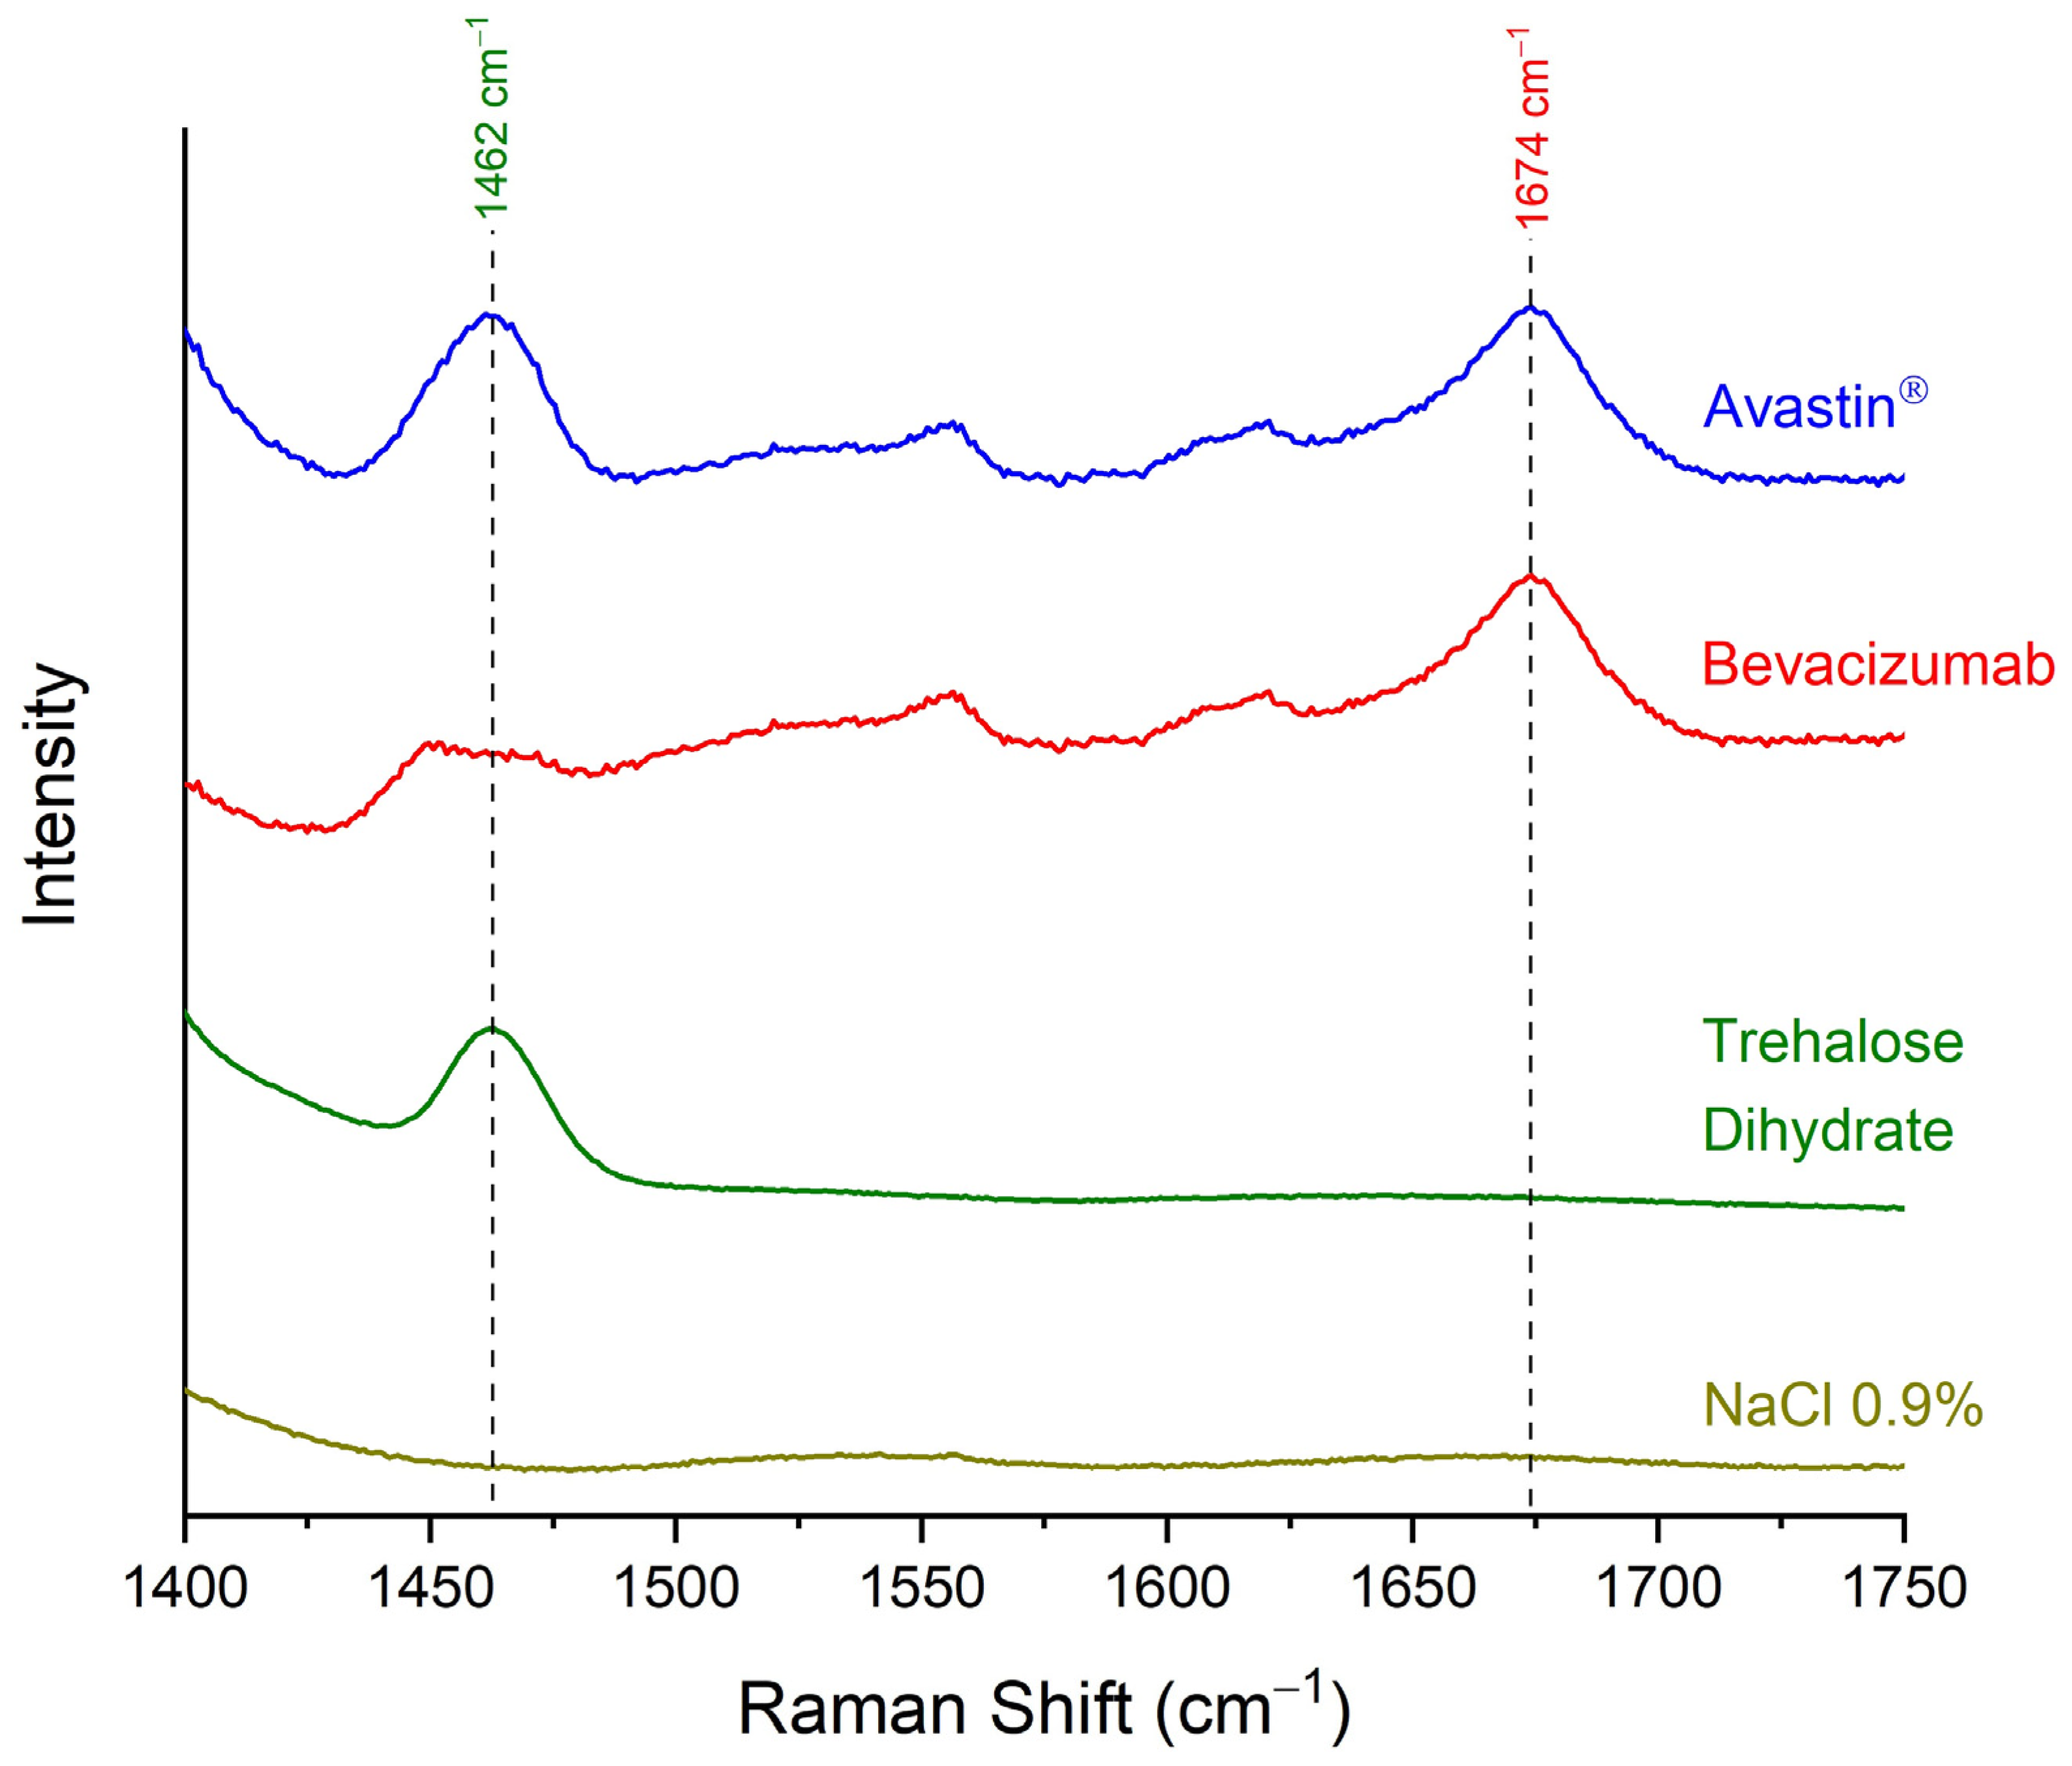
2.1. Identification of Bevacizumab in Avastin® Formulation via Raman Spectroscopy
2.2. Quantification of Bevacizumab in Avastin® Formulation via Raman Spectroscopy
2.3. Validation of Developed Quantification Method
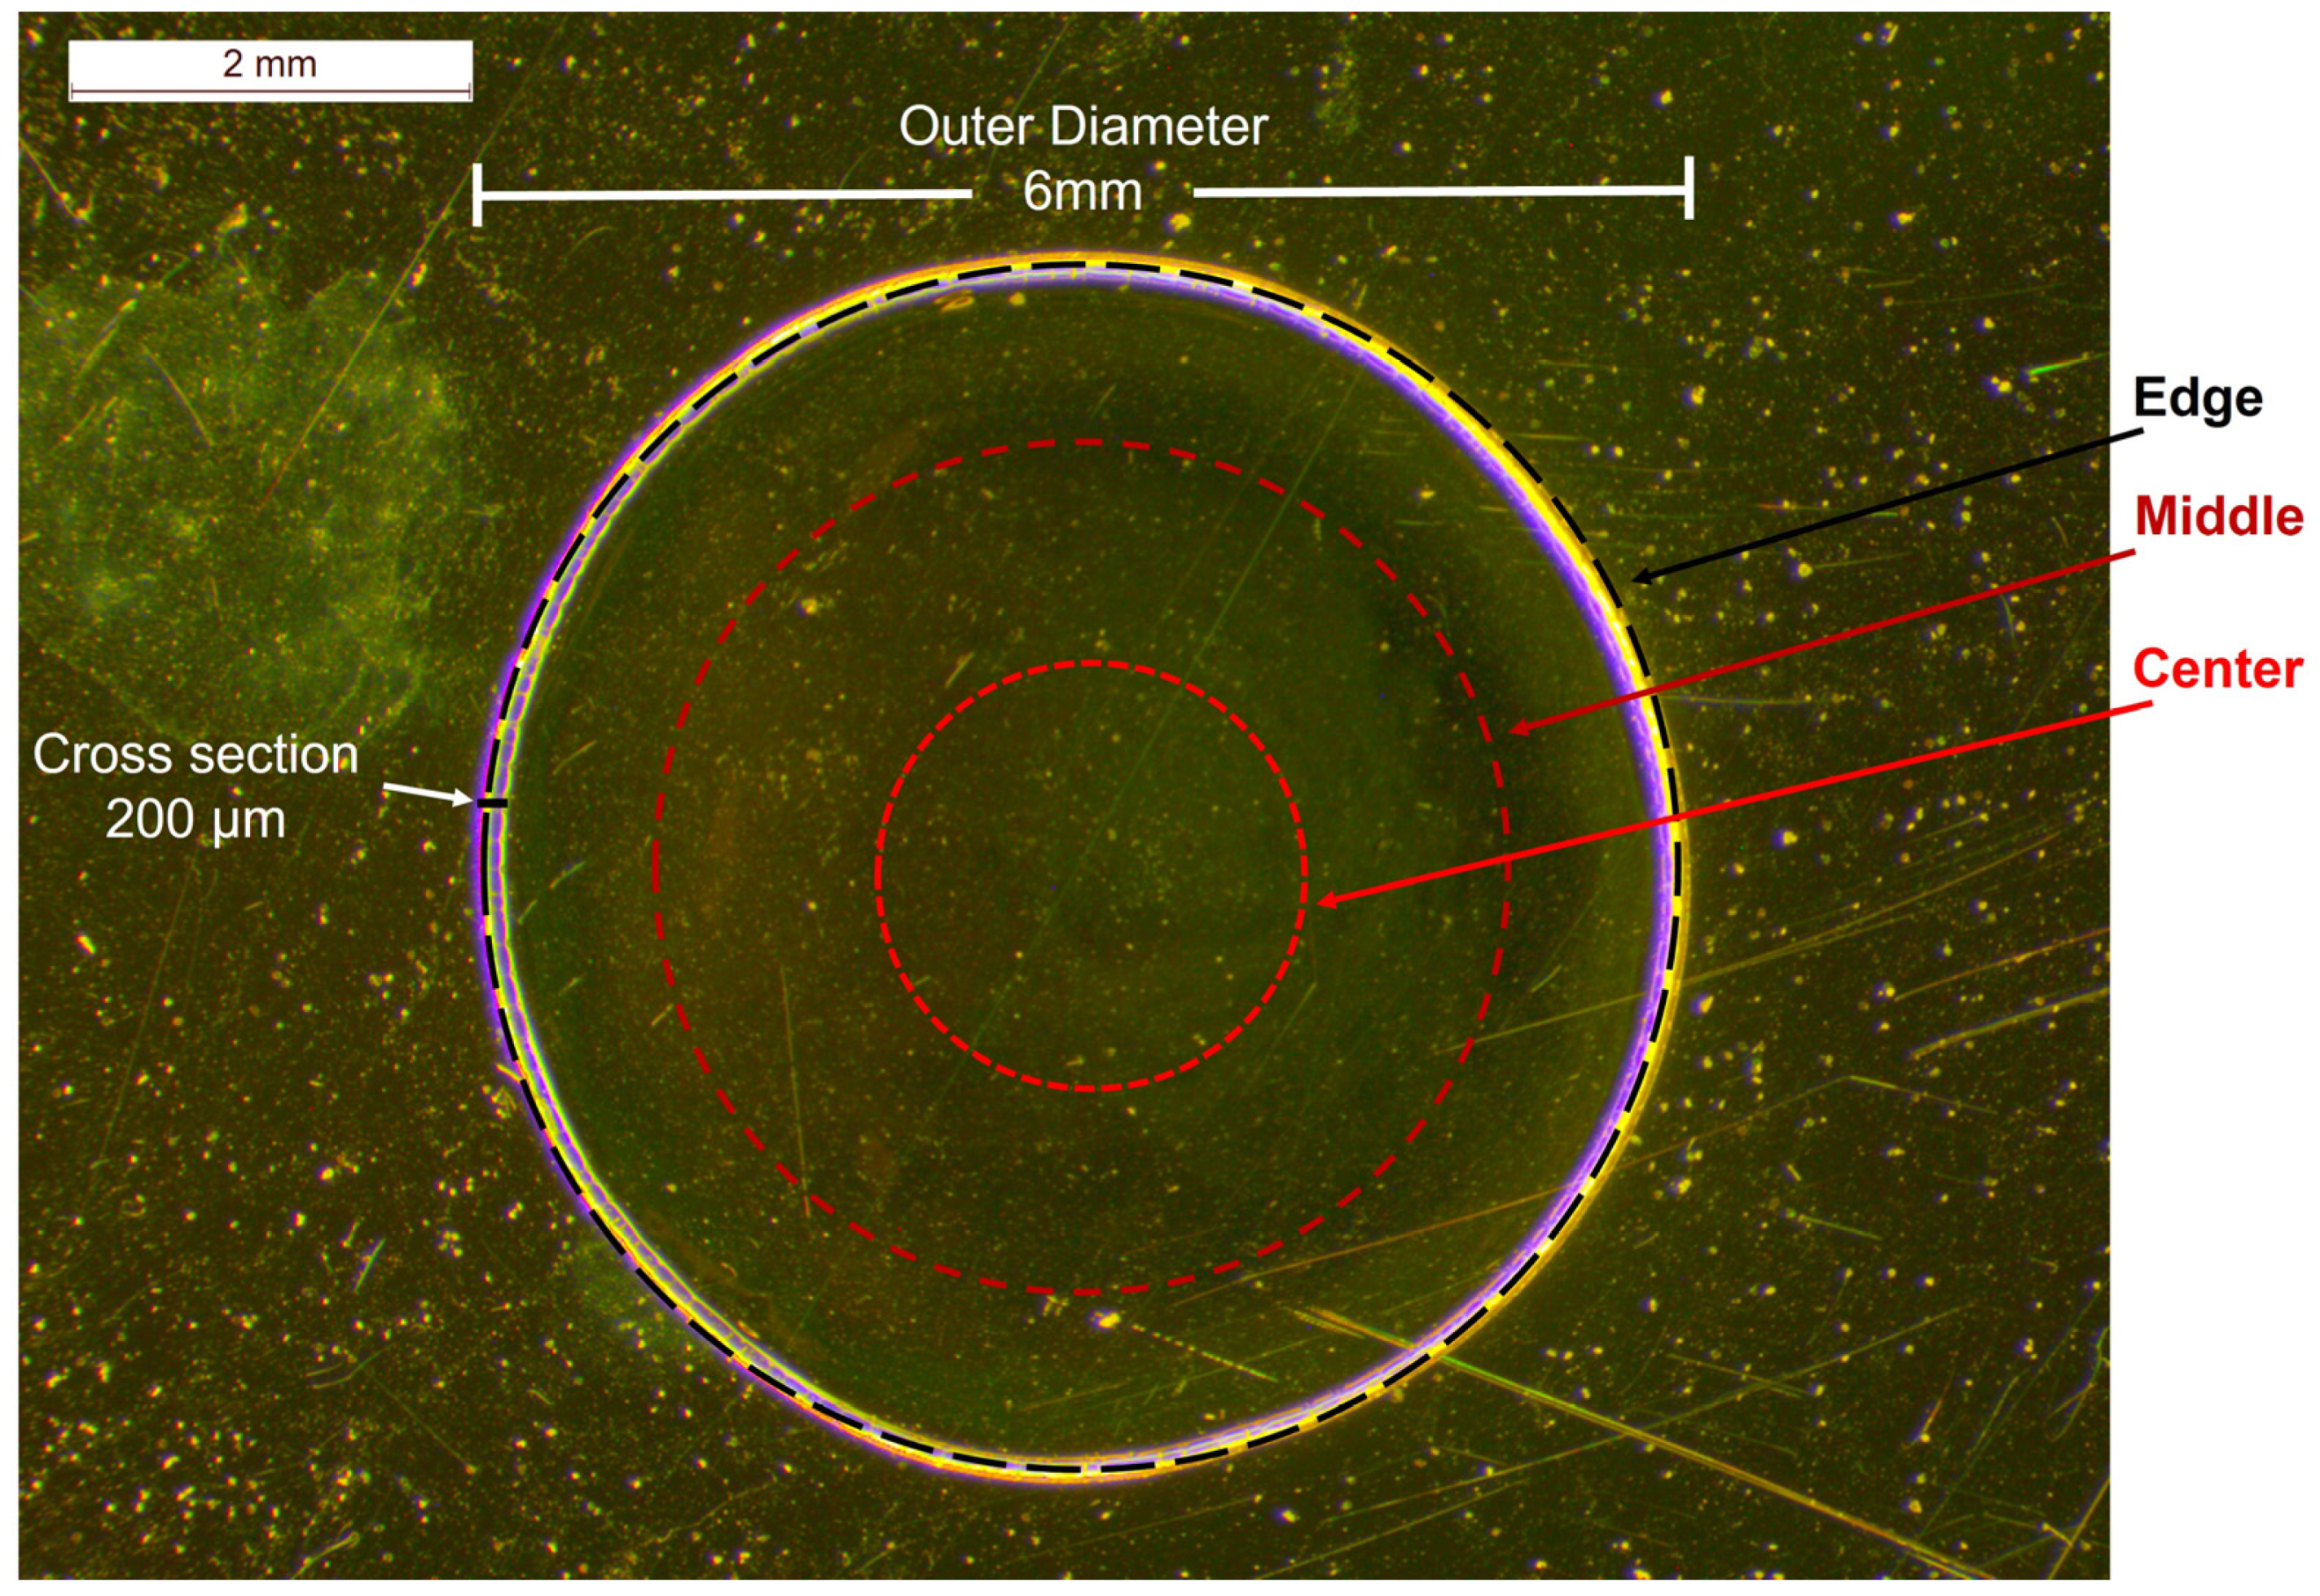
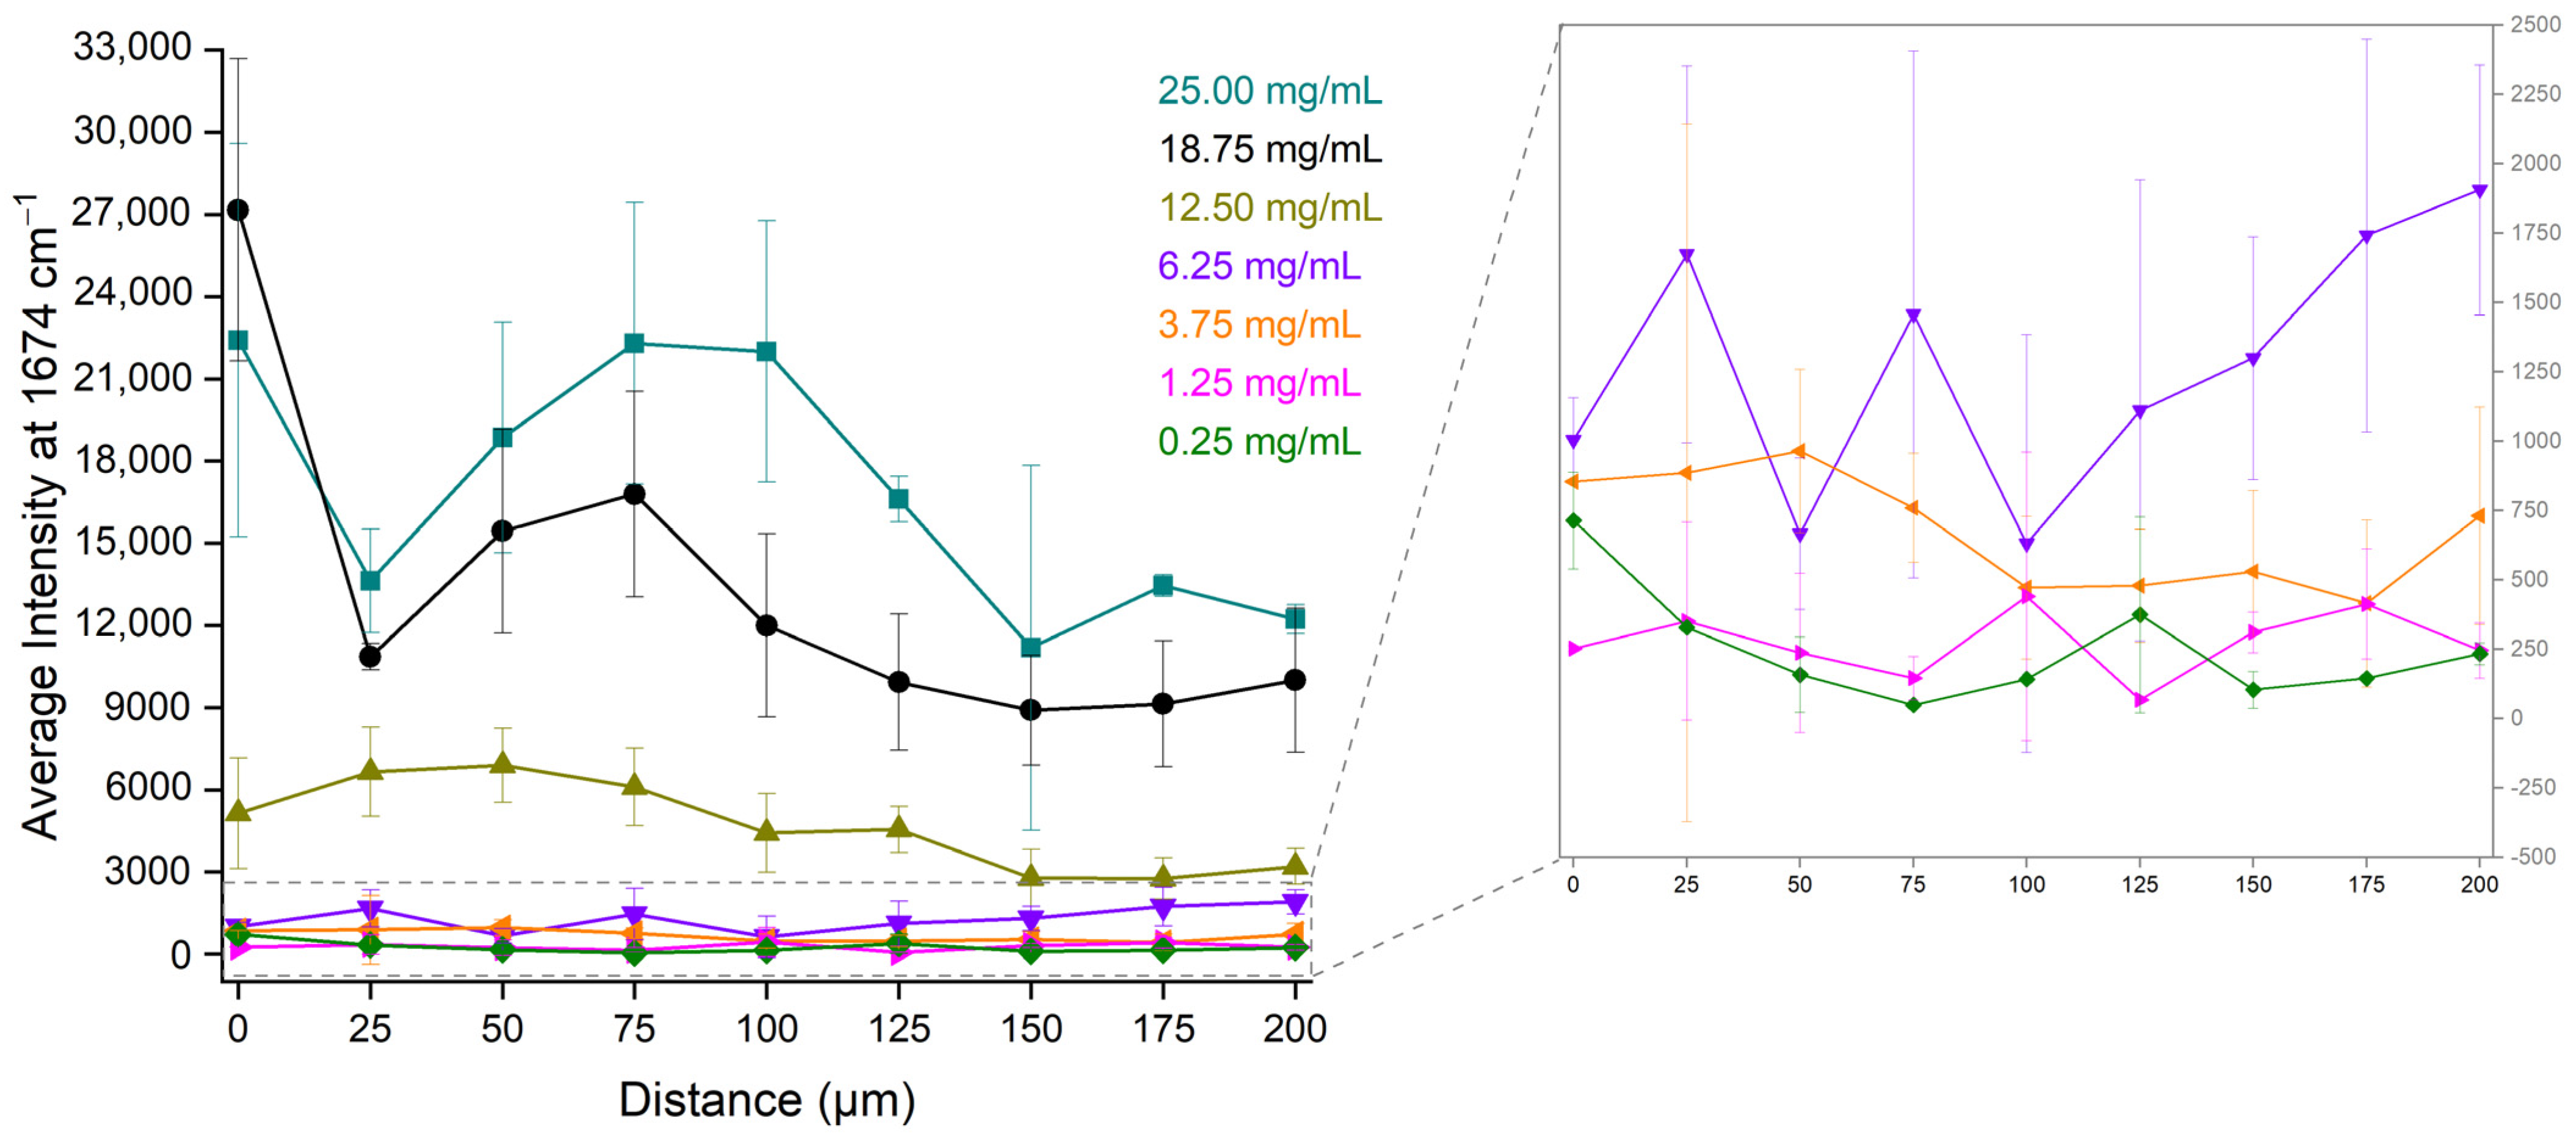
2.4. Investigation of the Optimal Position at the Dried Droplet for Bevacizumab Determination
3. Discussion
4. Materials and Methods
4.1. Samples
4.2. Stereoscope
4.3. Raman Spectroscopy
4.4. Calibration Curves
4.5. Validation of the Developed Quantitative Analytical Method
5. Conclusions
Supplementary Materials
Author Contributions
Funding
Institutional Review Board Statement
Informed Consent Statement
Data Availability Statement
Acknowledgments
Conflicts of Interest
References
- Quinteros, D.A.; Bermúdez, J.M.; Ravetti, S.; Cid, A.; Allemandi, D.A.; Palma, S.D. Chapter 25: Therapeutic Use of Monoclonal Antibodies: General Aspects and Challenges for Drug Delivery. In Nanostructures for Drug Delivery; Andronescu, E., Grumezescu, A.M., Eds.; Elsevier: Amsterdam, The Netherlands, 2017; pp. 807–833. [Google Scholar]
- Yamada, T. Therapeutic monoclonal antibodies. Keio J. Med. 2011, 60, 37–46. [Google Scholar] [CrossRef] [PubMed]
- Berger, M.; Shankar, V.; Vafai, A. Therapeutic Applications of Monoclonal Antibodies. Am. J. Med. Sci. 2002, 324, 14–30. [Google Scholar] [CrossRef] [PubMed]
- Mukherji, S.K. Bevacizumab (Avastin). AJNR Am. J. Neuroradiol. 2010, 31, 235–236. [Google Scholar] [CrossRef] [PubMed]
- Mahfouz, N.; Tahtouh, R.; Alaaeddine, N.; El Hajj, J.; Sarkis, R.; Hachem, R.; Raad, I.; Hilal, G. Gastrointestinal cancer cells treatment with bevacizumab activates a VEGF autoregulatory mechanism involving telomerase catalytic subunit hTERT via PI3K-AKT, HIF-1α and VEGF receptors. PLoS ONE 2017, 12, e0179202. [Google Scholar] [CrossRef] [PubMed]
- Garcia, J.; Hurwitz, H.I.; Sandler, A.B.; Miles, D.; Coleman, R.L.; Deurloo, R.; Chinot, O.L. Bevacizumab (Avastin®) in cancer treatment: A review of 15 years of clinical experience and future outlook. Cancer Treat. Rev. 2020, 86, 102017. [Google Scholar] [CrossRef] [PubMed]
- EMA. Avastin, INN-Bevacizumab. Summary of Product Characteristics. Available online: https://www.ema.europa.eu/en/documents/product-information/avastin-epar-product-information_en.pdf (accessed on 14 September 2023).
- García-Romero, N.; Palacín-Aliana, I.; Madurga, R.; Carrión-Navarro, J.; Esteban-Rubio, S.; Jiménez, B.; Collazo, A.; Pérez-Rodríguez, F.; Ortiz de Mendivil, A.; Fernández-Carballal, C.; et al. Bevacizumab dose adjustment to improve clinical outcomes of glioblastoma. BMC Med. 2020, 18, 142. [Google Scholar] [CrossRef]
- Brandes, A.A.; Bartolotti, M.; Tosoni, A.; Poggi, R.; Franceschi, E. Practical management of bevacizumab-related toxicities in glioblastoma. Oncologist 2015, 20, 166–175. [Google Scholar] [CrossRef]
- Delmas, A.; Gordien, J.B.; Bernadou, J.M.; Roudaut, M.; Gresser, A.; Malki, L.; Saux, M.C.; Breilh, D. Quantitative and qualitative control of cytotoxic preparations by HPLC-UV in a centralized parenteral preparations unit. J. Pharm. Biomed. Anal. 2009, 49, 1213–1220. [Google Scholar] [CrossRef]
- Badea, I.; Lazăr, L.; Moja, D.; Nicolescu, D.; Tudose, A. A HPLC method for the simultaneous determination of seven anthracyclines. J. Pharm. Biomed. Anal. 2005, 39, 305–309. [Google Scholar] [CrossRef]
- Legeron, R.; Xuereb, F.; Breilh, D.; Gadeau, A.; Boiron, J.M.; Schmitter, J.M.; Dupuy, J.W.; Chaignpain, S. A Method for Quantifying Bevacizumab. International Patent 2017/050825 A1, 30 March 2017. [Google Scholar]
- Zhou, A.; Yu, J.; Wu, Y.; Xue, H.; Zhong, D.; Diao, X. A validated LC-MS/MS method for the quantification of bevacizumab in rat, cynomolgus monkey, and human serum. J. Pharm. Biomed. Anal. 2023, 235, 115590. [Google Scholar] [CrossRef]
- Orlando, A.; Franceschini, F.; Muscas, C.; Pidkova, S.; Bartoli, M.; Rovere, M.; Tagliaferro, A. A Comprehensive Review on Raman Spectroscopy Applications. Chemosensors 2021, 9, 262. [Google Scholar] [CrossRef]
- Gala, U.; Chauhan, H. Principles and applications of Raman spectroscopy in pharmaceutical drug discovery and development. Expert Opin. Drug Discov. 2014, 10, 187–206. [Google Scholar] [CrossRef] [PubMed]
- Bourget, P.; Amin, A.; Vidal, F.; Merlette, C.; Lagarce, F. Comparison of Raman spectroscopy vs. high performance liquid chromatography for quality control of complex therapeutic objects: Model of elastomeric portable pumps filled with a fluorouracil solution. J. Pharm. Biomed. Anal. 2014, 91, 176–184. [Google Scholar] [CrossRef] [PubMed]
- Rayyad, A.; Makki, A.A.; Chourpa, I.; Massot, V.; Bonnier, F. Quantification of clinical mAb solutions using Raman spectroscopy: Macroscopic vs microscopic analysis. Talanta 2022, 250, 123692. [Google Scholar] [CrossRef] [PubMed]
- Farquharson, S. Pharmaceutical Applications of Raman Spectroscopy. American Pharmaceutical Review. Available online: https://www.americanpharmaceuticalreview.com/Featured-Articles/158839-Pharmaceutical-Applications-of-Raman-Spectroscopy/ (accessed on 16 September 2023).
- Vankeirsbilck, T.; Vercauteren, A.; Baeyens, W.; Van der Weken, G.; Verpoort, F.; Vergote, G.; Remon, J.P. Applications of Raman spectroscopy in pharmaceutical analysis. TrAC Trends Anal. Chem. 2002, 21, 869–877. [Google Scholar] [CrossRef]
- Mhlanga, N.; Tetyana, P.; Nyembe, S.; Sikhwivhilu, L. Application of Raman Spectroscopy in Biomedical Diagnostics. In Recent Developments in Atomic Force Microscopy and Raman Spectroscopy for Materials Characterization; Pathak, C.S., Kumar, S., Eds.; IntechOpen: London, UK, 2022. [Google Scholar]
- Choo-Smith, L.P.; Edwards, H.G.M.; Endtz, H.P.; Kros, J.M.; Heule, F.; Barr, H.; Robinson, J.S., Jr.; Bruining, H.A.; Puppels, G.J. Medical Applications of Raman Spectroscopy: From Proof of Principle to Clinical Implementation. Biopolymers 2002, 67, 1–9. [Google Scholar] [CrossRef] [PubMed]
- Sato, H.; Maeda, Y.; Ishigaki, M.; Andriana, B.B. Biomedical Applications of Raman Spectroscopy. In Encyclopedia of Analytical Chemistry; Meyers, R.A., Ed.; Wiley Online Library: Hoboken, NJ, USA, 2014. [Google Scholar]
- Shukla, M.K.; Wilkes, P.; Bargary, N.; Meagher, K.; Khamar, D.; Bailey, D.; Hudson, S.P. Identification of monoclonal antibody drug substances using non-destructive Raman spectroscopy. Spectrochim. Acta Part A Mol. Biomol. Spectrosc. 2023, 299, 122872. [Google Scholar] [CrossRef] [PubMed]
- Sato, Y.; Nagatoishi, S.; Noguchi, S.; Tsumoto, K. Raman Spectroscopic Analysis of Highly-Concentrated Antibodies under the Acid-Treated Conditions. Pharm. Res. 2023, 40, 1853–1864. [Google Scholar] [CrossRef] [PubMed]
- Makki, A.A.; Massot, V.; Byrne, H.J.; Respaud, R.; Bertrand, D.; Mohammed, E.; Chourpa, I.; Bonnier, F. Understanding the discrimination and quantification of monoclonal antibodies preparations using Raman spectroscopy. J. Pharm. Biomed. Anal. 2021, 194, 113734. [Google Scholar] [CrossRef]
- Ettah, I.; Ashton, L. Engaging with Raman Spectroscopy to Investigate Antibody Aggregation. Antibodies 2018, 7, 24. [Google Scholar] [CrossRef]
- Soto, R.J.; Meriage, D.S.; Wagner, R.L.; Wang, T.; Semin, D.J. Enabling rapid identification of biotherapeutic protein products using handheld Raman spectrometers and principal component analysis. J. Raman Spectrosc. 2021, 52, 1281–1293. [Google Scholar] [CrossRef]
- Baker, A.E.; Mantz, A.R.; Chiu, M.L. Raman spectroscopy characterization of antibody phases in serum. mAbs 2014, 6, 1509–1517. [Google Scholar] [CrossRef]
- Le, L.M.M.; Kégl, B.; Gramfort, A.; Marini, C.; Nguyen, D.; Cherti, M.; Tfaili, S.; Tfayli, A.; Baillet-Guffroy, A.; Prognon, P.; et al. Optimization of classification and regression analysis of four monoclonal antibodies from Raman spectra using collaborative machine learning approach. Talanta 2018, 184, 260–265. [Google Scholar] [CrossRef]
- Ingram, R.L.; Weiser, S.E. Development of the Drug Product Formulation of the Bevacizumab Biosimilar PF-06439535 (Bevacizumab-bvzr). Drugs R D 2023, 23, 55–64. [Google Scholar] [CrossRef]
- Márquez, M.J.; Romani, D.; Díaz, S.B.; Brandán, S.A. Structural and vibrational characterization of anhydrous and dihydrated species of trehalose based on the FTIR and FTRaman spectra and DFT calculations. J. King Saud Univ. Sci. 2018, 30, 229–249. [Google Scholar] [CrossRef]
- Hernández, B.; Pflüger, F.; Kruglik, S.G.; Ghomi, M. Characteristic Raman lines of phenylalanine analyzed by a multiconformational approach. J. Raman Spectrosc. 2013, 44, 827–833. [Google Scholar] [CrossRef]
- Hernández, B.; Coïc, Y.M.; Pflüger, F.; Kruglik, S.G.; Ghomi, M. All characteristic Raman markers of tyrosine and tyrosinate originate from phenol ring fundamental vibrations. J. Raman Spectrosc. 2016, 47, 210–220. [Google Scholar] [CrossRef]
- Hirakawa, A.Y.; Nishimura, Y.; Matsumoto, T.; Nakanishi, M.; Tsuboi, M. Characterization of a Few Raman Lines of Tryptophan. J. Raman Spectrosc. 1978, 7, 282–287. [Google Scholar] [CrossRef]
- Johansson, J.; Pettersson, S.; Folestad, S. Characterization of different laser irradiation methods for quantitative Raman tablet assessment. J. Pharm. Biomed. Anal. 2005, 39, 510–516. [Google Scholar] [CrossRef] [PubMed]
- Strachan, C.J.; Rades, T.; Gordon, K.C.; Rantanen, J. Raman spectroscopy for quantitative analysis of pharmaceutical solids. J. Pharm. Pharmacol. 2007, 59, 179–192. [Google Scholar] [CrossRef] [PubMed]
- European Medicines Agency. ICH Guideline Q2(R2) on Validation of Analytical Procedures. Available online: https://www.ema.europa.eu/en/documents/scientific-guideline/ich-guideline-q2r2-validation-analytical-procedures-step-2b_en.pdf (accessed on 22 October 2023).
- United Nations Office on Drugs and Crime. Guidance for the Validation of Analytical Methodology and Calibration of Equipment Used for Testing of Illicit Drugs in Seized Materials and Biological Specimens; United Nations: New York, NY, USA, 2009; Available online: https://www.unodc.org/documents/scientific/validation_E.pdf (accessed on 22 October 2023).
- International Council for Harmonisation of Technical Requirements for Pharmaceuticals for Human Use. ICH Harmonised Guideline. Bioanalytical Method Validation and Study Sample Analysis M10. Available online: https://database.ich.org/sites/default/files/M10_Guideline_Step4_2022_0524.pdf (accessed on 24 October 2023).
- Basu, S.; Basit, A.; Ravindran, S.; Patel, V.B.; Vangala, S.; Patel, H. Split calibration curve: An approach to avoid repeat analysis of the samples exceeding ULOQ. Bioanalysis 2012, 4, 2375–2389. [Google Scholar] [CrossRef] [PubMed]
- Alhazmi, H.A.; Albratty, M. Analytical Techniques for the Characterization and Quantification of Monoclonal Antibodies. Pharmaceuticals 2023, 16, 291. [Google Scholar] [CrossRef]
- Legrand, P.; Dembele, O.; Alamil, H.; Lamoureux, C.; Mignet, N.; Houzé, P.; Gahoual, R. Structural identification and absolute quantification of monoclonal antibodies in suspected counterfeits using capillary electrophoresis and liquid chromatography-tandem mass spectrometry. Anal. Bioanal. Chem. 2022, 414, 2699–2712. [Google Scholar] [CrossRef] [PubMed]
- Li, H.; Ortiz, R.; Tran, L.; Hall, M.; Spahr, C.; Walker, K.; Laudemann, J.; Miller, S.; Salimi-Moosavi, H.; Lee, J.W. General LC-MS/MS Method Approach to Quantify Therapeutic Monoclonal Antibodies Using a Common Whole Antibody Internal Standard with Application to Preclinical Studies. Anal. Chem. 2012, 84, 1267–1273. [Google Scholar] [CrossRef] [PubMed]
- Yang, M.; Chen, D.; Hu, J.; Zheng, X.; Lin, Z.J.; Zhu, H. The application of coffee-ring effect in analytical chemistry. Trends Anal. Chem. 2022, 157, 116752. [Google Scholar] [CrossRef]
- Wang, Z.; Orejon, D.; Takata, Y.; Sefiane, K. Wetting and evaporation of multicomponent droplets. Phys. Rep. 2022, 960, 1–37. [Google Scholar] [CrossRef]
- Deegan, R.D.; Bakajin, O.; Dupont, T.F.; Huber, G.; Nagel, S.R.; Witten, T.A. Contact line deposits in an evaporating drop. Phys. Rev. E 2000, 62, 756–765. [Google Scholar] [CrossRef]
- Deegan, R.D.; Bakajin, O.; Dupont, T.F.; Huber, G.; Nagel, S.R.; Witten, T.A. Capillary flow as the cause of ring stains from dried liquid drops. Nature 1997, 389, 827–829. [Google Scholar] [CrossRef]
- Xu, X.; Luo, J. Marangoni flow in an evaporating water droplet. Appl. Phys. Lett. 2007, 91, 124102. [Google Scholar] [CrossRef]
- Papaspyridakou, P.; Lykouras, M.; Kontoyannis, C.; Orkoula, M. Comparative Study of Sample Carriers for the Identification of Volatile Compounds in Biological Fluids Using Raman Spectroscopy. Molecules 2022, 27, 3279. [Google Scholar] [CrossRef]
- Romanowicz, G.E.; Terhune, A.H.; Bielajew, B.J.; Sexton, B.; Lynch, M.; Mandair, G.S.; McNerny, E.M.B.; Kohn, D.H. Collagen cross-link profiles and mineral are different between the mandible and femur with site specific response to perturbed collagen. Bone Rep. 2022, 17, 101629. [Google Scholar] [CrossRef] [PubMed]


| Ingredient | Function | Concentration (mg/mL) |
|---|---|---|
| Bevacizumab | Active Pharmaceutical Ingredient (Monoclonal Antibody) | 25.0 |
| Trehalose Dihydrate | Stabilizer | 60.0 |
| Monobasic Sodium Phosphate Monohydrate | Buffer | 5.8 |
| Dibasic Sodium Phosphate Anhydrous | Buffer | 1.2 |
| Polysorbate 20 | Surfactant | 0.4 |
| Raman Shift (cm−1) | Trehalose Dihydrate | Bevacizumab |
|---|---|---|
| 297 | O-C-C bending vibration | - |
| 354 | O-C-C bending vibration | - |
| 405 | deformation in the plane of glucopyranose ring | - |
| 438 | deformation in the plane of glucopyranose ring | - |
| 505 | CH2 rocking deformation and O-C-C bending mode | - |
| 540 | O-C-C bending vibration | - |
| 596 | C-C-O bending vibration | - |
| 623 | - | phenyl ring breathing modes of Phe |
| 644 | - | phenyl ring breathing vibrations of Tyr |
| 706 | deformation in the plane of glucopyranose ring | - |
| 760 | - | benzene and pyrrole rings breathing modes of Trp |
| 806 | CH2 twisting vibration | - |
| 844 | C-O-C skeletal mode and C-C stretching vibration | - |
| 915 | C-O stretching | - |
| 1005 | - | phenyl ring angular bending vibrations of Phe |
| 1081 | C-O stretching | - |
| 1127 | C-O, C-C stretching and deformation in the plane of glucopyranose ring | - |
| 1339 | - | amide III NH bending and Cα-N stretching vibrations |
| 1354 | CH2 rocking deformation | - |
| 1462 | CH2 scissoring mode | - |
| 1556 | - | C=C stretching vibration of the phenyl ring of Trp |
| 1619 | - | phenyl ring bond-stretching vibrations of Phe, Tyr and Trp |
| 1674 | - | amide I C=O stretching of carbonyl groups |
| Bevacizumab 25.00 mg/mL | Edge | Middle | Centre |
|---|---|---|---|
| 1st Set Intensities | 61,761.8 | 35,341.6 | 34,518.3 |
| 2nd Set Intensities | 59,013.1 | 50,575.5 | 34,889.5 |
| 3rd Set Intensities | 51,232.6 | 48,317.0 | 42,069.5 |
| Average Intensities | 57,335.9 | 44,744.7 | 37,159.1 |
| Expected Intensities | 52,959.4 | 44,812.5 | 37,486.4 |
| Er (%) | 8.26 | 0.15 | 0.87 |
| Circular Circumference of Rotation | Bevacizumab Concentration (mg/mL) | Intensities | RSD (%) | ||||
|---|---|---|---|---|---|---|---|
| 1st Set | 2nd Set | 3rd Set | Average | SD | |||
| Edge | 3.75 | 9409.4 | 9981.7 | 8976.1 | 9455.7 | 504.4 | 5.33 |
| 12.50 | 31,311.5 | 19,181.3 | 16,038.6 | 22,177.1 | 8065.1 | 36.37 | |
| 25.00 | 61,761.8 | 59,013.1 | 51,232.6 | 57,335.9 | 5461.3 | 9.53 | |
| Middle | 3.75 | 11,973.9 | 9632.9 | 5582.0 | 9062.9 | 3233.8 | 35.68 |
| 12.50 | 23,891.7 | 20,102.3 | 19,776.1 | 21,256.7 | 2287.8 | 10.76 | |
| 25.00 | 35,341.6 | 50,575.5 | 48,317.0 | 44,744.7 | 8221.2 | 18.37 | |
| Centre | 3.75 | 6113.6 | 8384.0 | 5186.1 | 6561.2 | 1645.3 | 25.08 |
| 12.50 | 22,914.2 | 18,608.8 | 16,439.3 | 19,320.8 | 3295.6 | 17.06 | |
| 25.00 | 34,518.3 | 34,889.5 | 42,069.5 | 37,159.1 | 4256.6 | 11.46 | |
| Circular Circumference of Rotation | Calibration Curve Method | Visual Evaluation Method | |
|---|---|---|---|
| DL (mg/mL) | QL (mg/mL) | DL (mg/mL) | |
| Edge | 5.82 | 17.64 | <3.75 |
| Middle | 2.48 | 7.52 | <3.75 |
| Centre | 1.06 | 3.22 | <3.75 |
| Circular Circumference of Rotation | Expected Bevacizumab Concentration (mg/mL) | Calculated Bevacizumab Concentration (mg/mL) | Er (%) |
|---|---|---|---|
| Edge | 3.75 | 5.125 | 36.67 |
| 12.50 | 10.937 | 12.50 | |
| 25.00 | 26.999 | 8.00 | |
| Middle | 3.75 | 4.225 | 12.66 |
| 12.50 | 11.311 | 9.51 | |
| 25.00 | 24.960 | 0.16 | |
| Centre | 3.75 | 3.965 | 5.74 |
| 12.50 | 12.644 | 1.15 | |
| 25.00 | 24.777 | 0.89 |
| Distance (μm) | Working Range (mg/mL) | Calibration Curve | R2 |
|---|---|---|---|
| 0 | 0.25–6.25 | y = 150.4 (±52.1)x + 140.4 (±222.4) | 0.89 |
| 6.25–25.00 | y = 1175.7 (±177.6)x − 7625.3 (±2937.4) | 0.98 | |
| 25 | 0.25–6.25 | y = 264.5 (±29.2)x − 21.3 (±124.6) | 0.99 |
| 6.25–25.00 | y = 641.1 (±56.3)x − 1814.5 (±963.8) | 0.98 | |
| 50 | 0.25–6.25 | y = 241.9 (±47.0)x + 30.3 (±107.5) | 0.96 |
| 6.25–25.00 | y = 1009.9 (±110.3)x − 5314.7 (±1887.9) | 0.98 | |
| 75 | 0.25–6.25 | y = 262.4 (±9.8)x − 196.0 (±41.8) | 0.999 |
| 6.25–25.00 | y = 1171.1 (±128.8)x − 6635.2 (±2204.2) | 0.98 | |
| 100 | 0.25–6.25 | y = 82.3 (±8.5)x + 134.5 (±35.9) | 0.99 |
| 6.25–25.00 | y = 1146.9 (±157.8)x − 8155.5 (±2700.6) | 0.96 | |
| 125 | 0.25–6.25 | y = 208.7 (±25.4)x − 229.9 (±108.5) | 0.99 |
| 6.25–25.00 | y = 829.8 (±82.3)x − 4917.0 (±1408.4) | 0.98 | |
| 150 | 0.25–6.25 | y = 187.8 (±35.1)x + 21.5 (±129.9) | 0.93 |
| 6.25–25.00 | y = 572.5 (±98.1)x − 2900.9 (±1679.0) | 0.94 | |
| 175 | 0.25–6.25 | y = 266.0 (±0.3)x + 79.9 (±1.1) | 1.0 |
| 6.25–25.00 | y = 664.0 (±118.3)x − 3603.5 (±2024.8) | 0.94 | |
| 200 | 0.25–6.25 | y = 332.2 (±79.6)x − 284.2 (±339.7) | 0.95 |
| 6.25–25.00 | y = 603.9 (±116.2)x − 2601.3 (±1988.9) | 0.93 |
| Distance (μm) | Calibration Curve Method | Visual Evaluation Method | |
|---|---|---|---|
| DL (mg/mL) | QL (mg/mL) | DL (mg/mL) | |
| 0 | 4.88 | 14.79 | 3.75 |
| 25 | 1.55 | 4.71 | 1.25 |
| 50 | 1.47 | 4.45 | 1.25 |
| 75 | 0.53 | 1.59 | 0.25 |
| 100 | 1.44 | 4.36 | 1.25 |
| 125 | 1.71 | 5.20 | 1.25 |
| 150 | 2.28 | 6.92 | 1.25 |
| 175 | 0.01 | 0.04 | 1.25 |
| 200 | 3.37 | 10.23 | 1.25 |
Disclaimer/Publisher’s Note: The statements, opinions and data contained in all publications are solely those of the individual author(s) and contributor(s) and not of MDPI and/or the editor(s). MDPI and/or the editor(s) disclaim responsibility for any injury to people or property resulting from any ideas, methods, instructions or products referred to in the content. |
© 2024 by the authors. Licensee MDPI, Basel, Switzerland. This article is an open access article distributed under the terms and conditions of the Creative Commons Attribution (CC BY) license (https://creativecommons.org/licenses/by/4.0/).
Share and Cite
Lykouras, M.; Papaspyridakou, P.; Makri, O.E.; Georgakopoulos, C.D.; Orkoula, M.G. Development of Analytical Method for the Quantitation of Monoclonal Antibodies Solutions via Raman Spectroscopy: The Case of Bevacizumab. Pharmaceuticals 2024, 17, 446. https://doi.org/10.3390/ph17040446
Lykouras M, Papaspyridakou P, Makri OE, Georgakopoulos CD, Orkoula MG. Development of Analytical Method for the Quantitation of Monoclonal Antibodies Solutions via Raman Spectroscopy: The Case of Bevacizumab. Pharmaceuticals. 2024; 17(4):446. https://doi.org/10.3390/ph17040446
Chicago/Turabian StyleLykouras, Michail, Panagiota Papaspyridakou, Olga E. Makri, Constantine D. Georgakopoulos, and Malvina G. Orkoula. 2024. "Development of Analytical Method for the Quantitation of Monoclonal Antibodies Solutions via Raman Spectroscopy: The Case of Bevacizumab" Pharmaceuticals 17, no. 4: 446. https://doi.org/10.3390/ph17040446
APA StyleLykouras, M., Papaspyridakou, P., Makri, O. E., Georgakopoulos, C. D., & Orkoula, M. G. (2024). Development of Analytical Method for the Quantitation of Monoclonal Antibodies Solutions via Raman Spectroscopy: The Case of Bevacizumab. Pharmaceuticals, 17(4), 446. https://doi.org/10.3390/ph17040446