

The Study on Timolol and Its Potential Phototoxicity Using Chemical, In Silico and In Vitro Methods


Abstract
1. Introduction
2. Results and Discussion
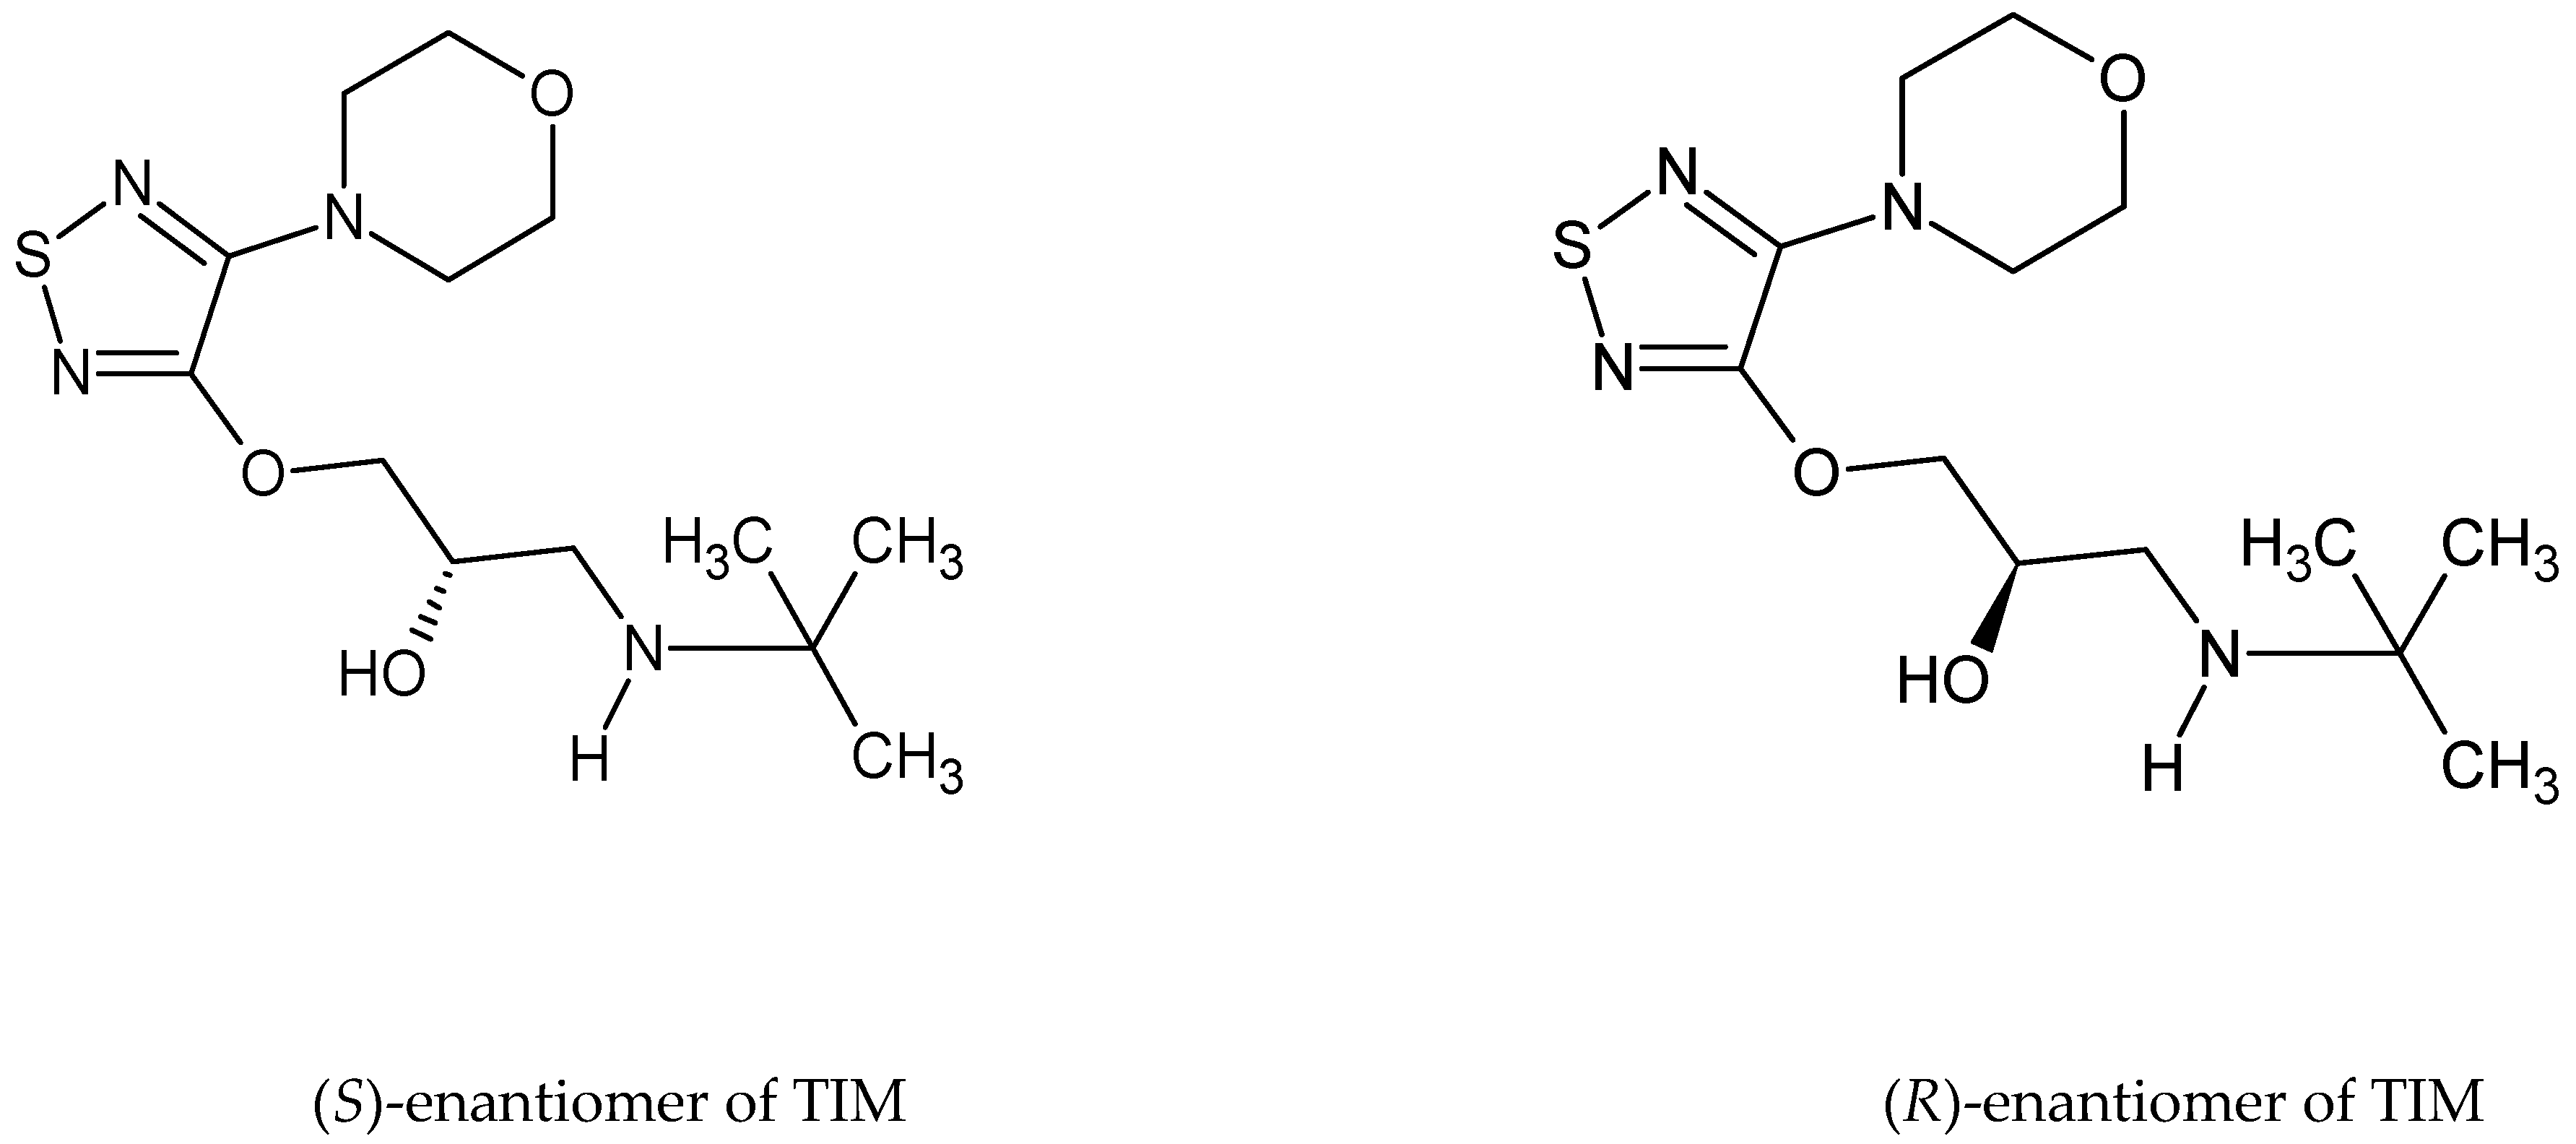
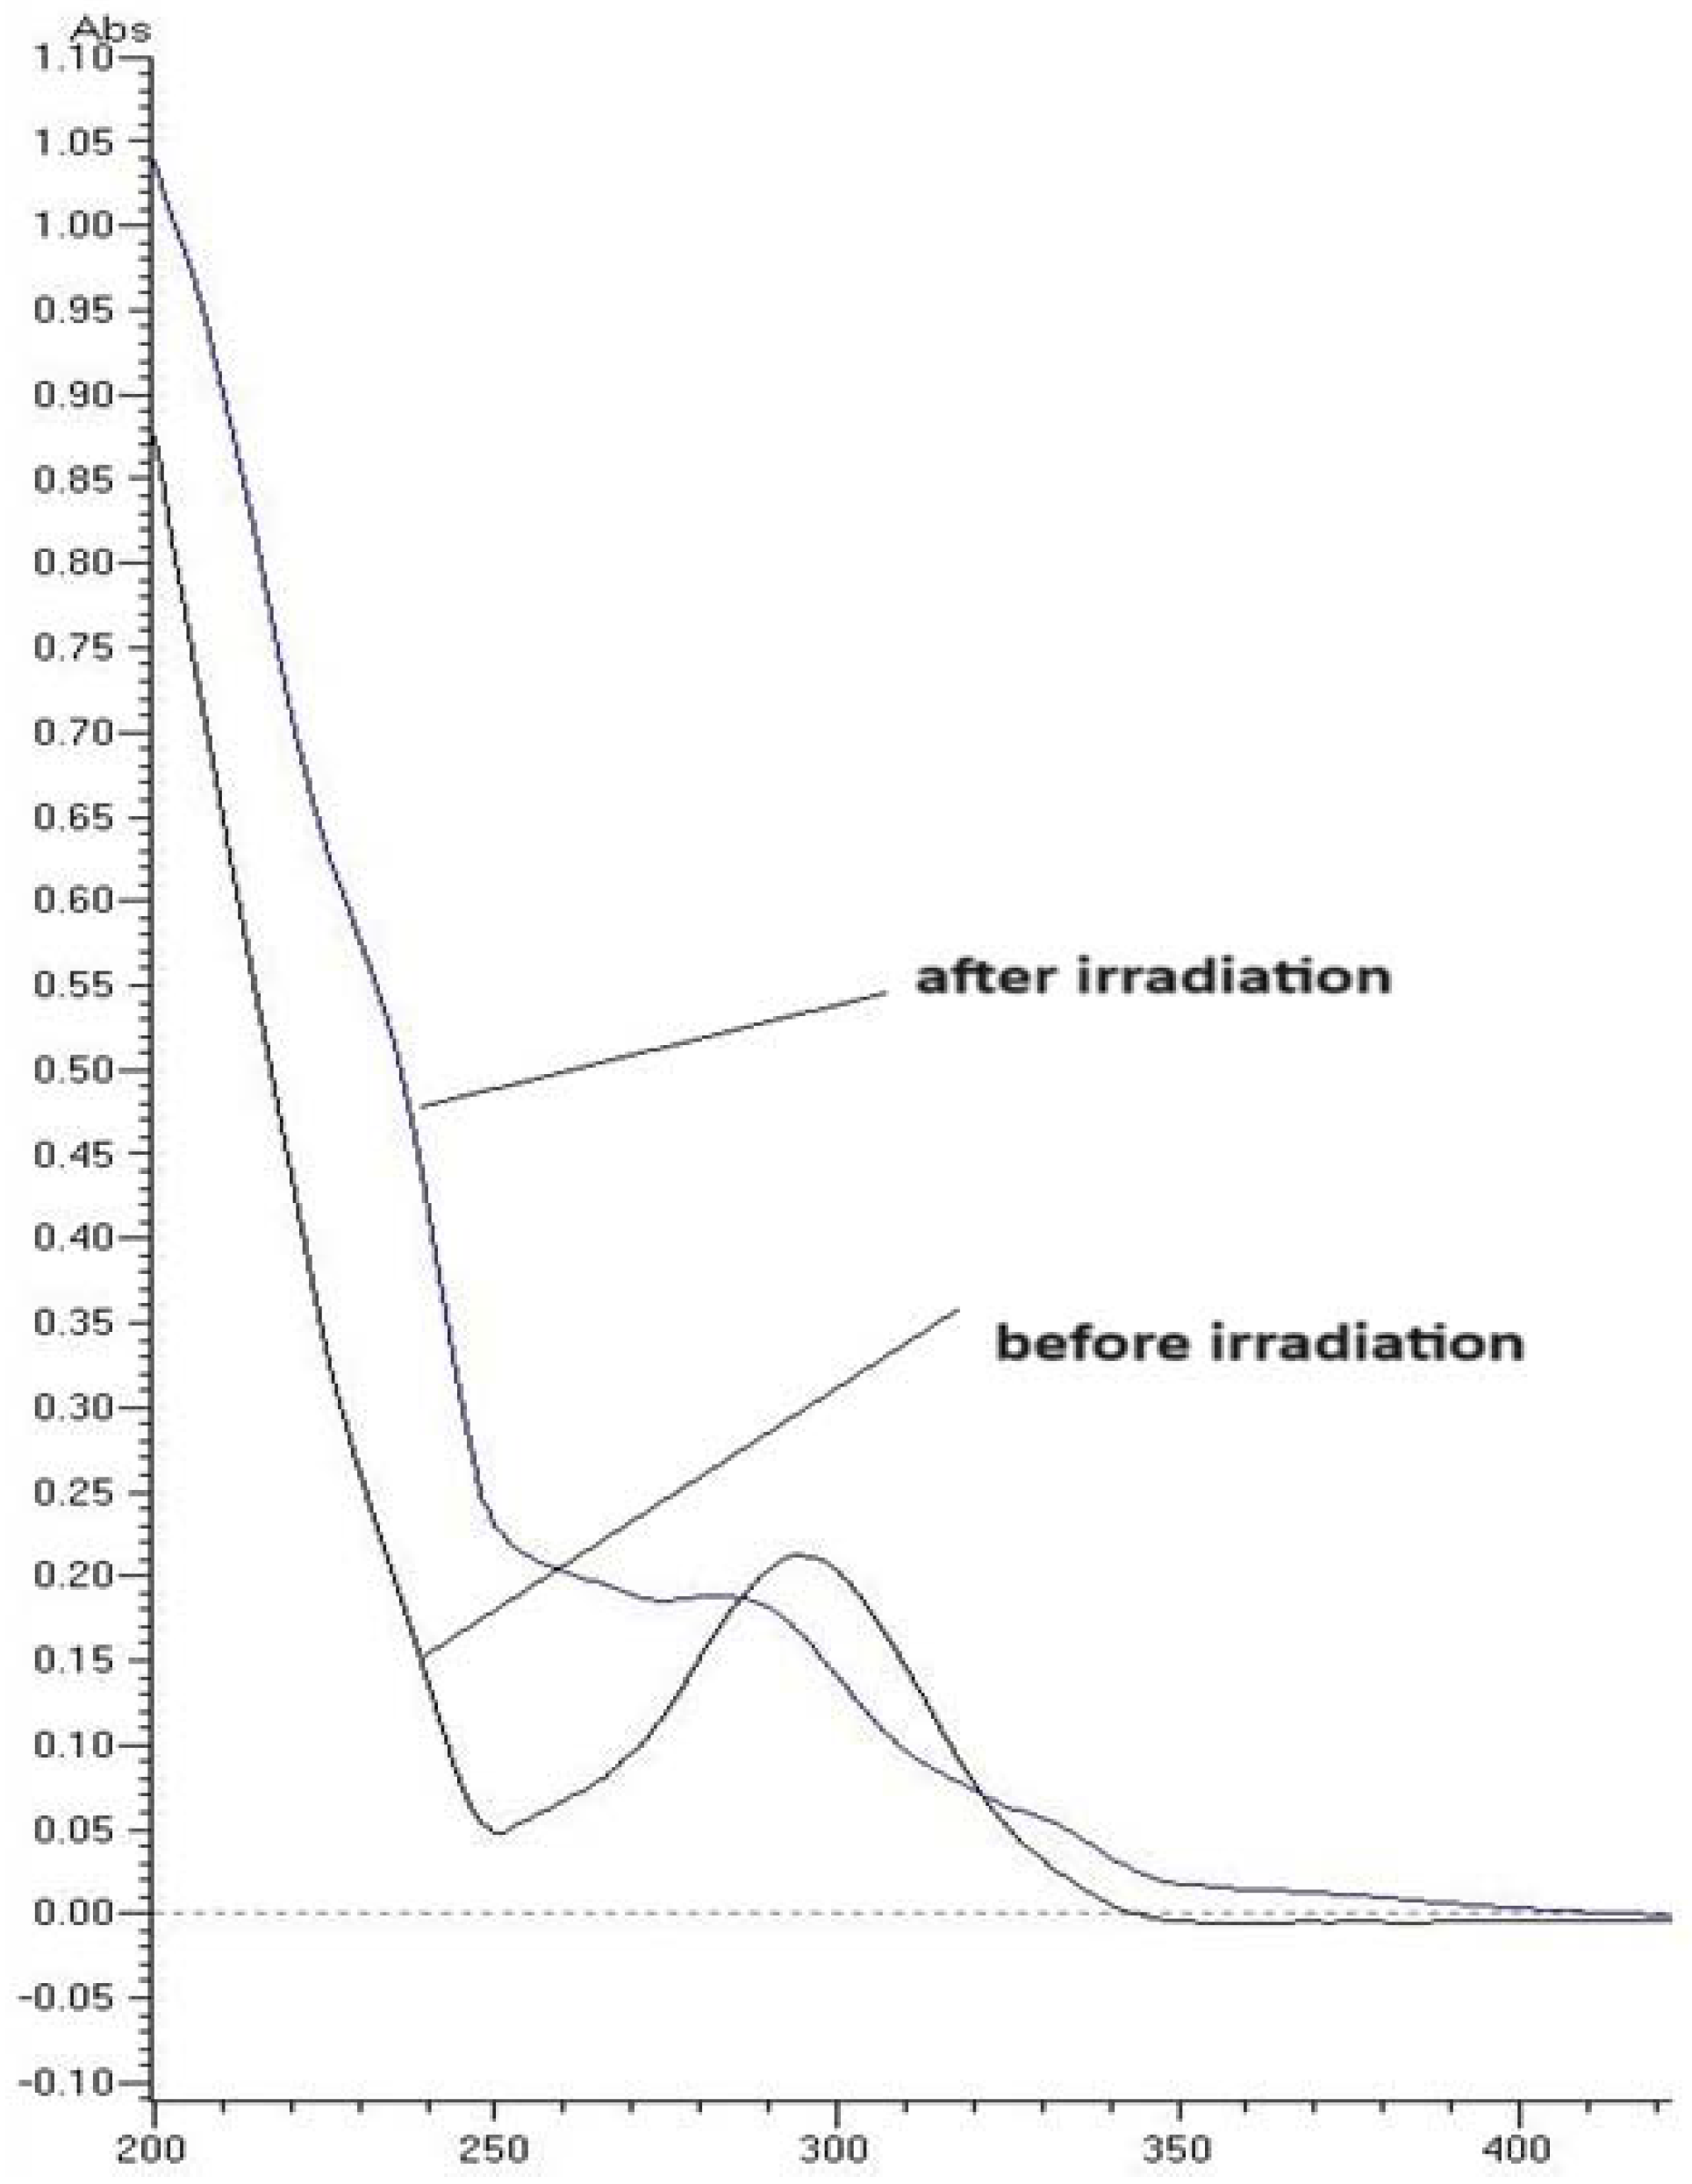
2.1. UV/VIS Measurements
2.2. Validation Parameters of LC-UV Method
2.3. Photodegradation of TIM and Kinetic Measurements
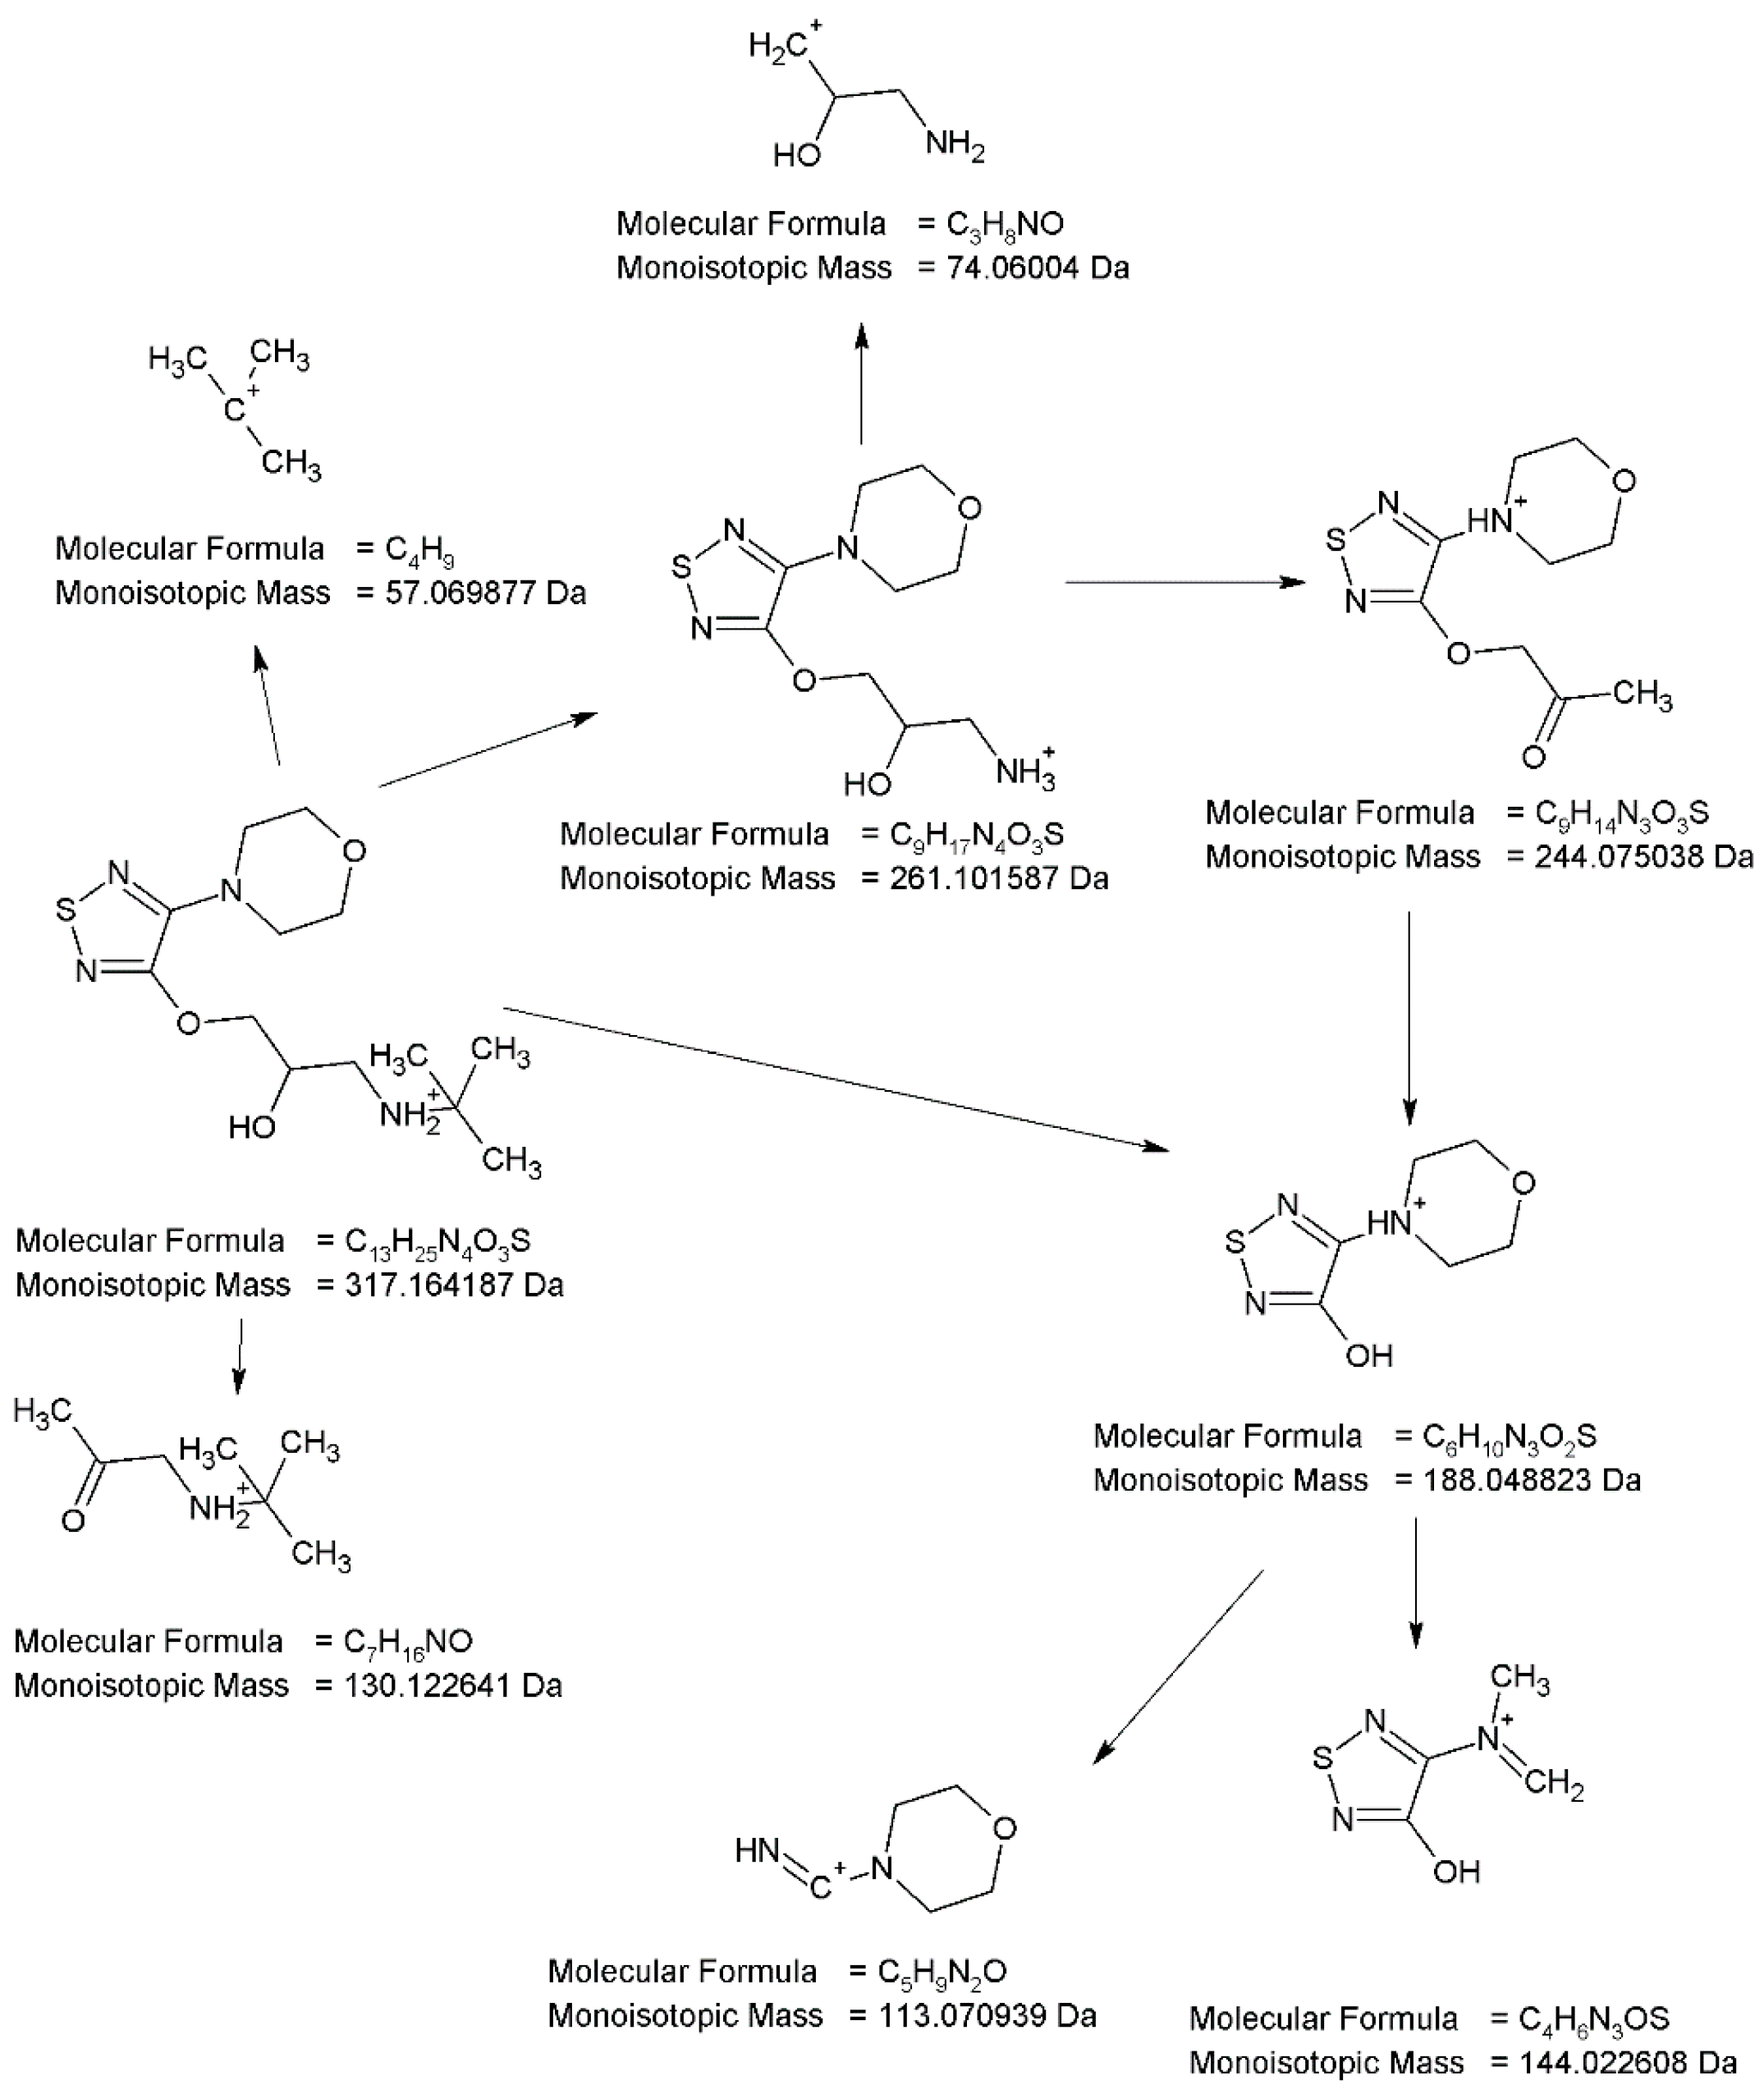
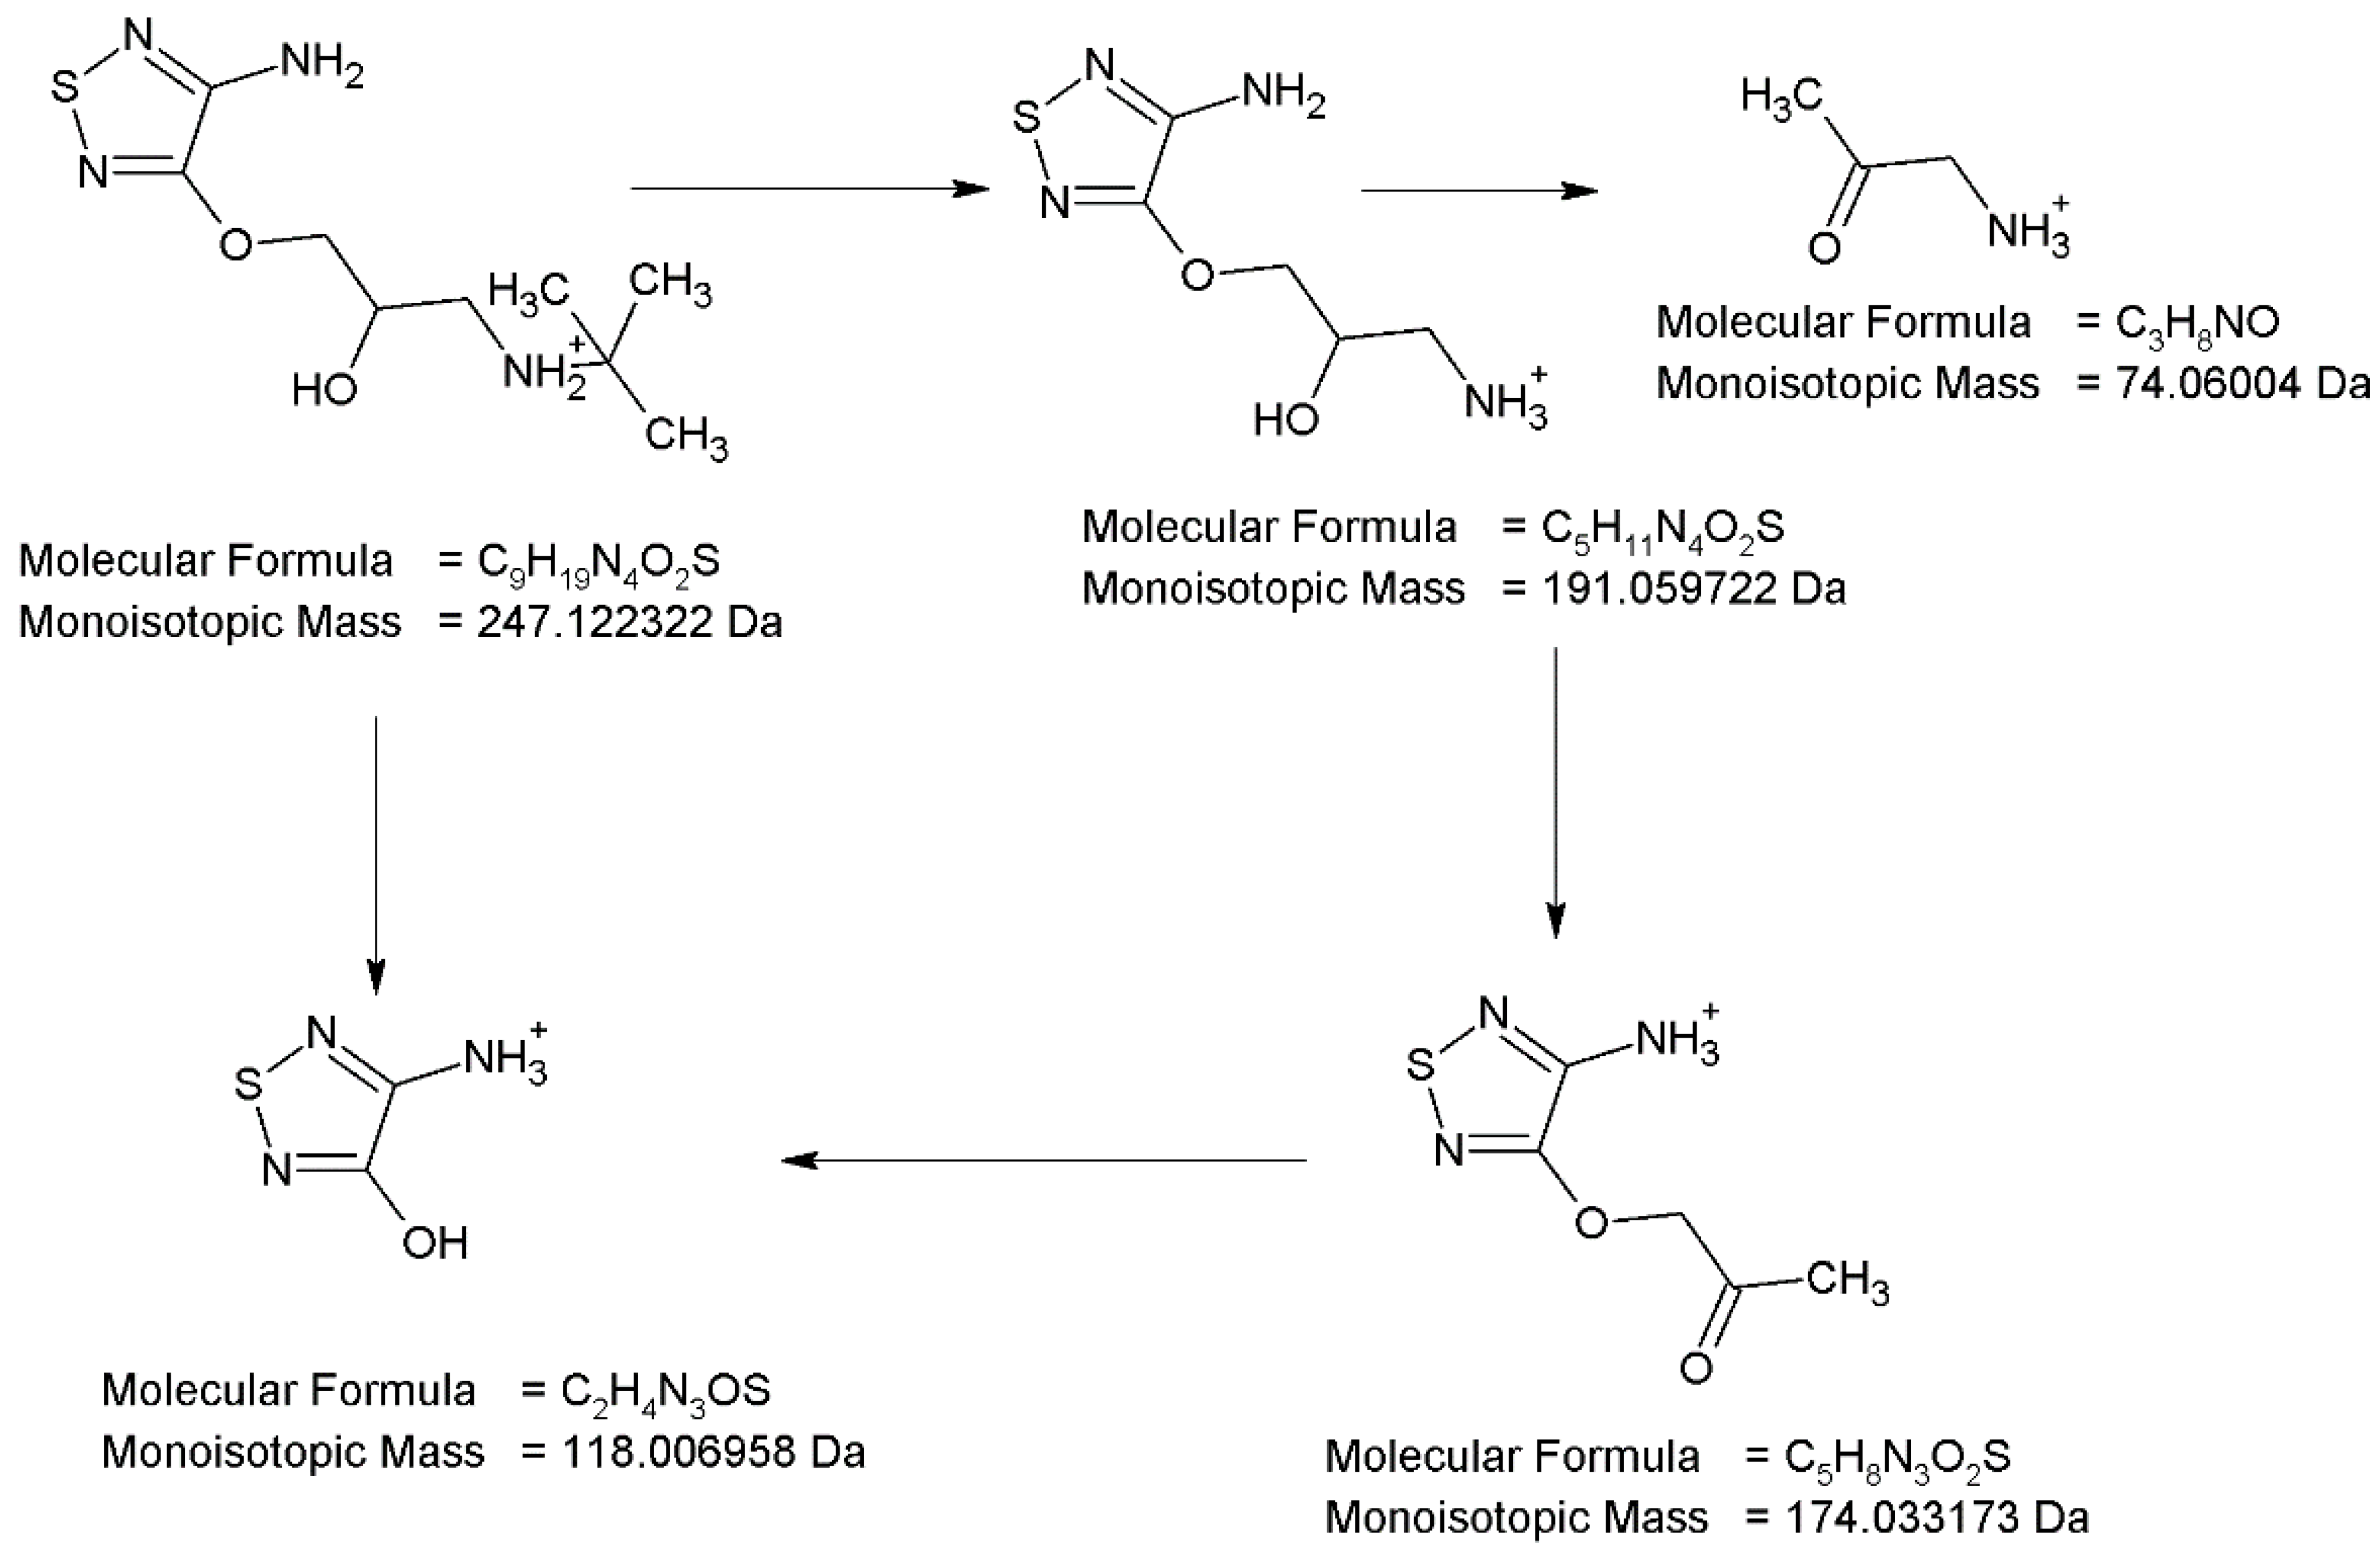
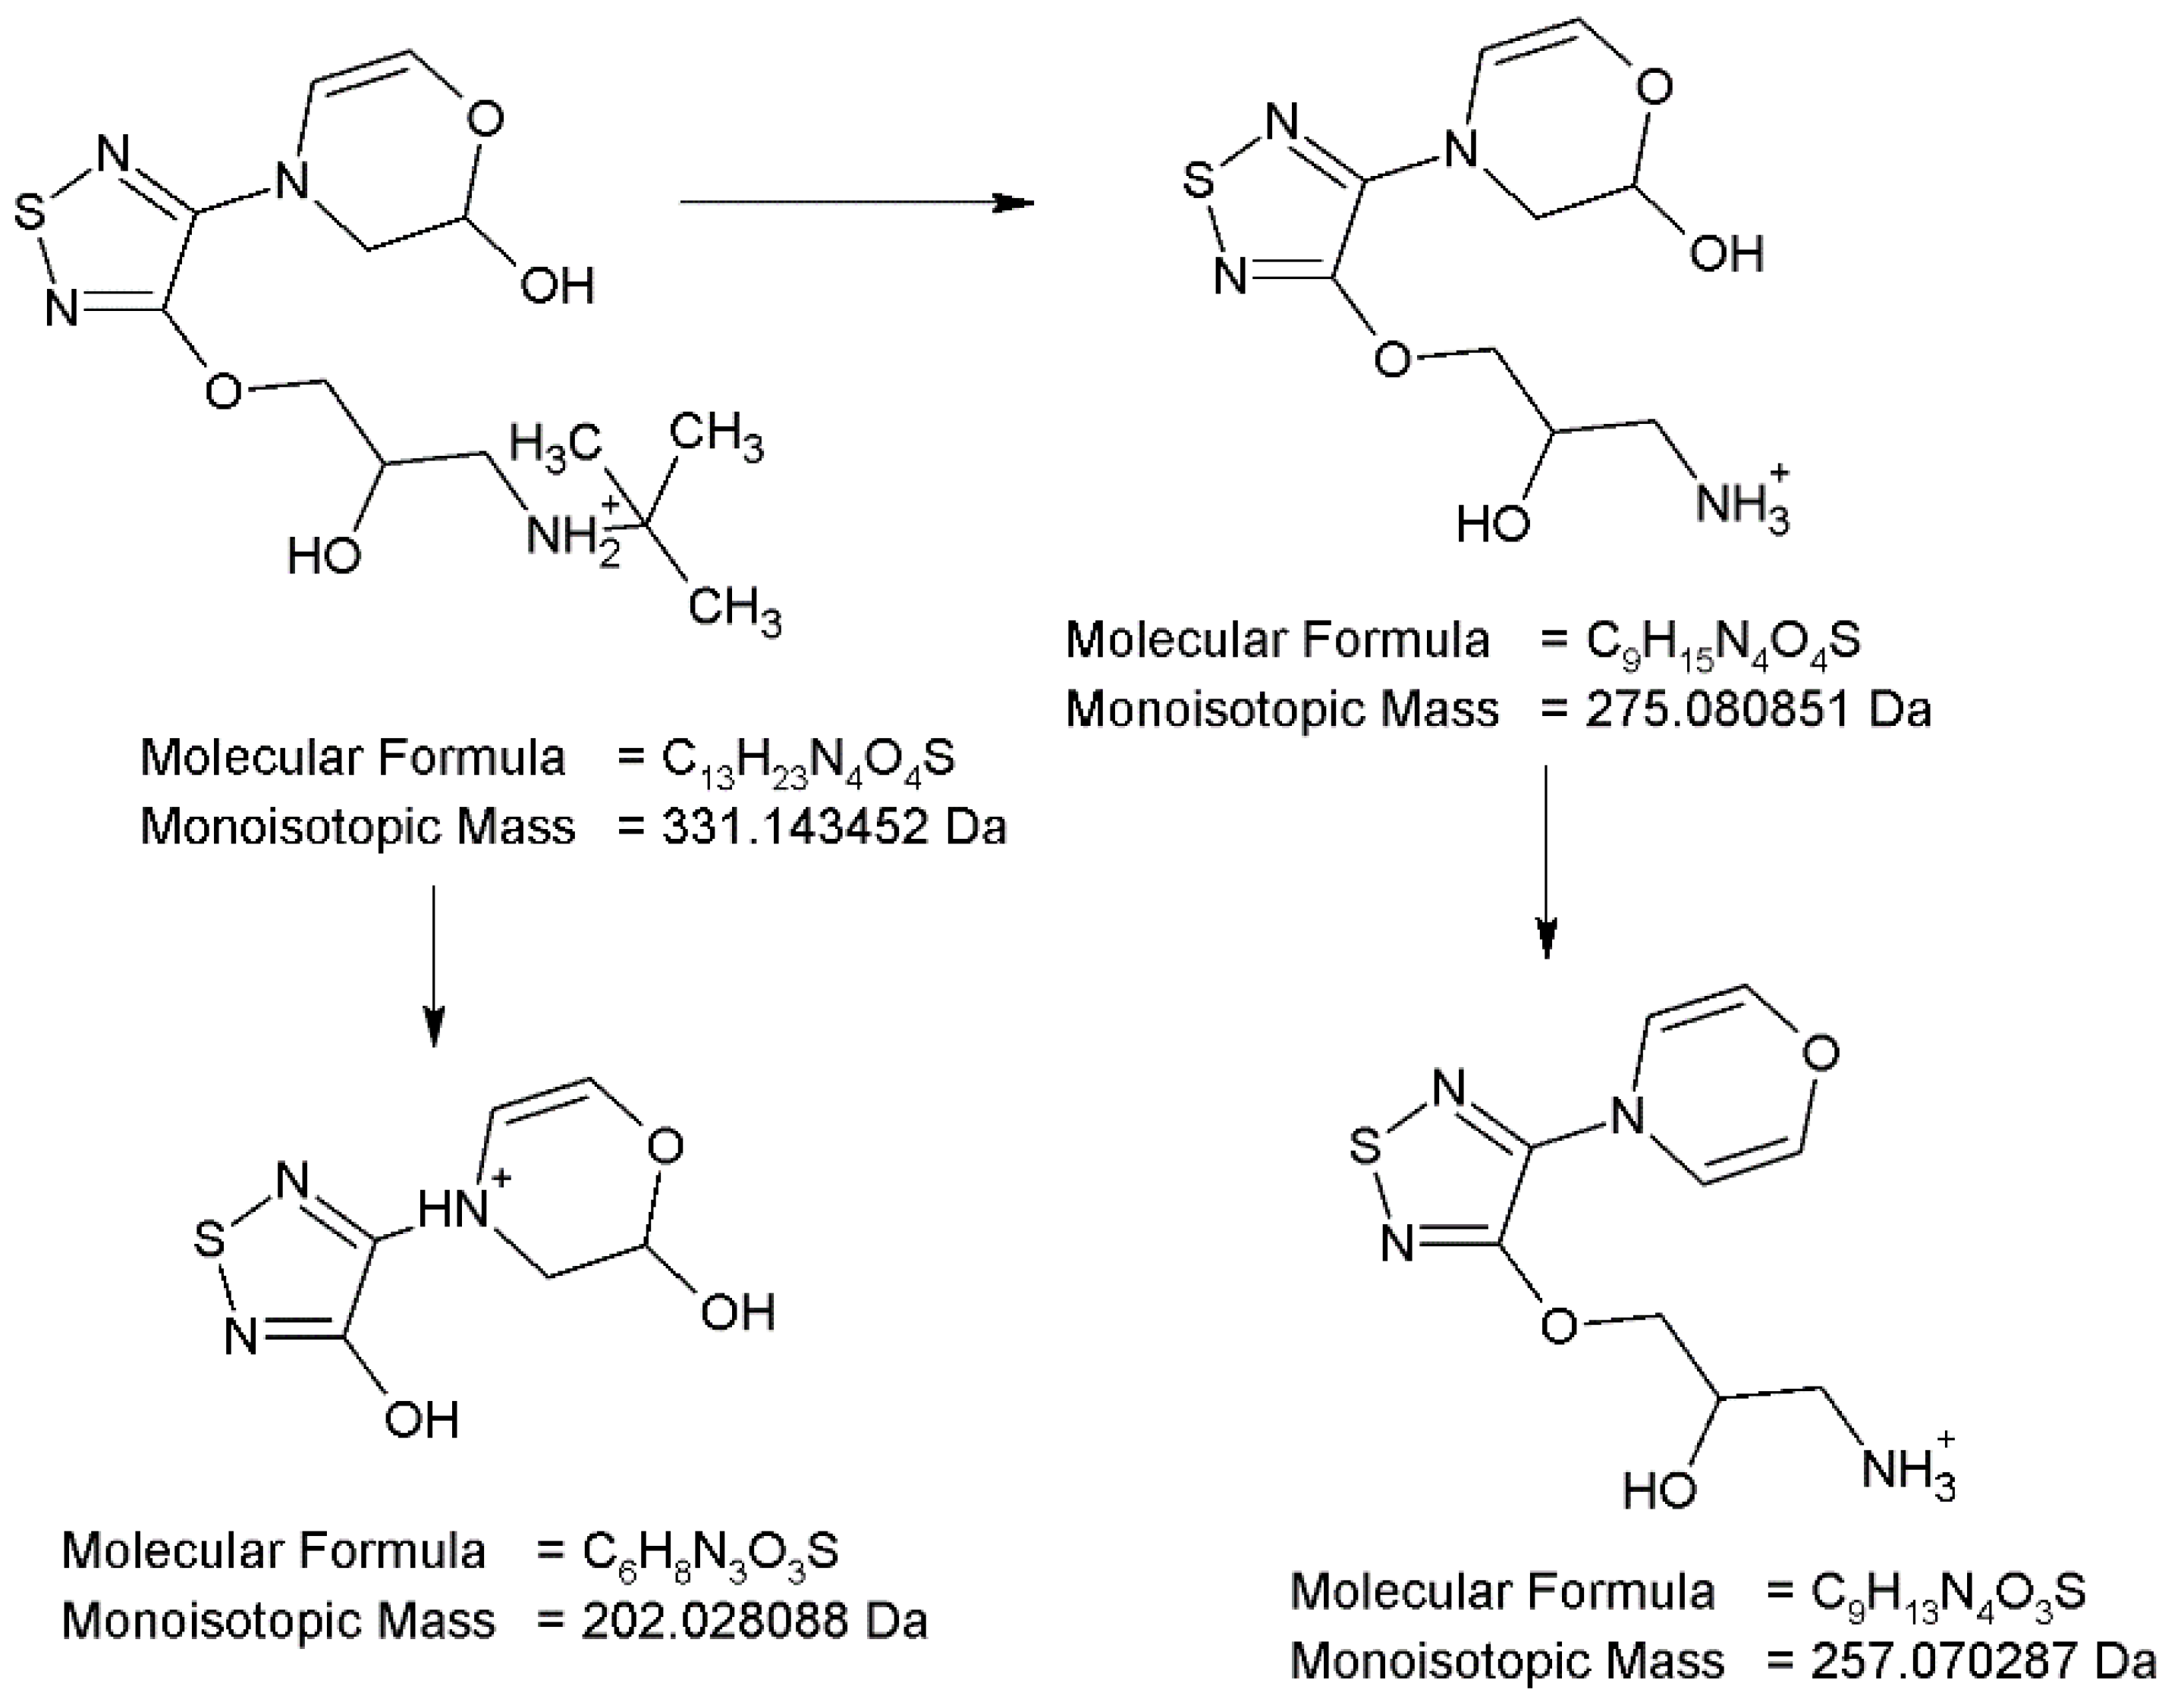
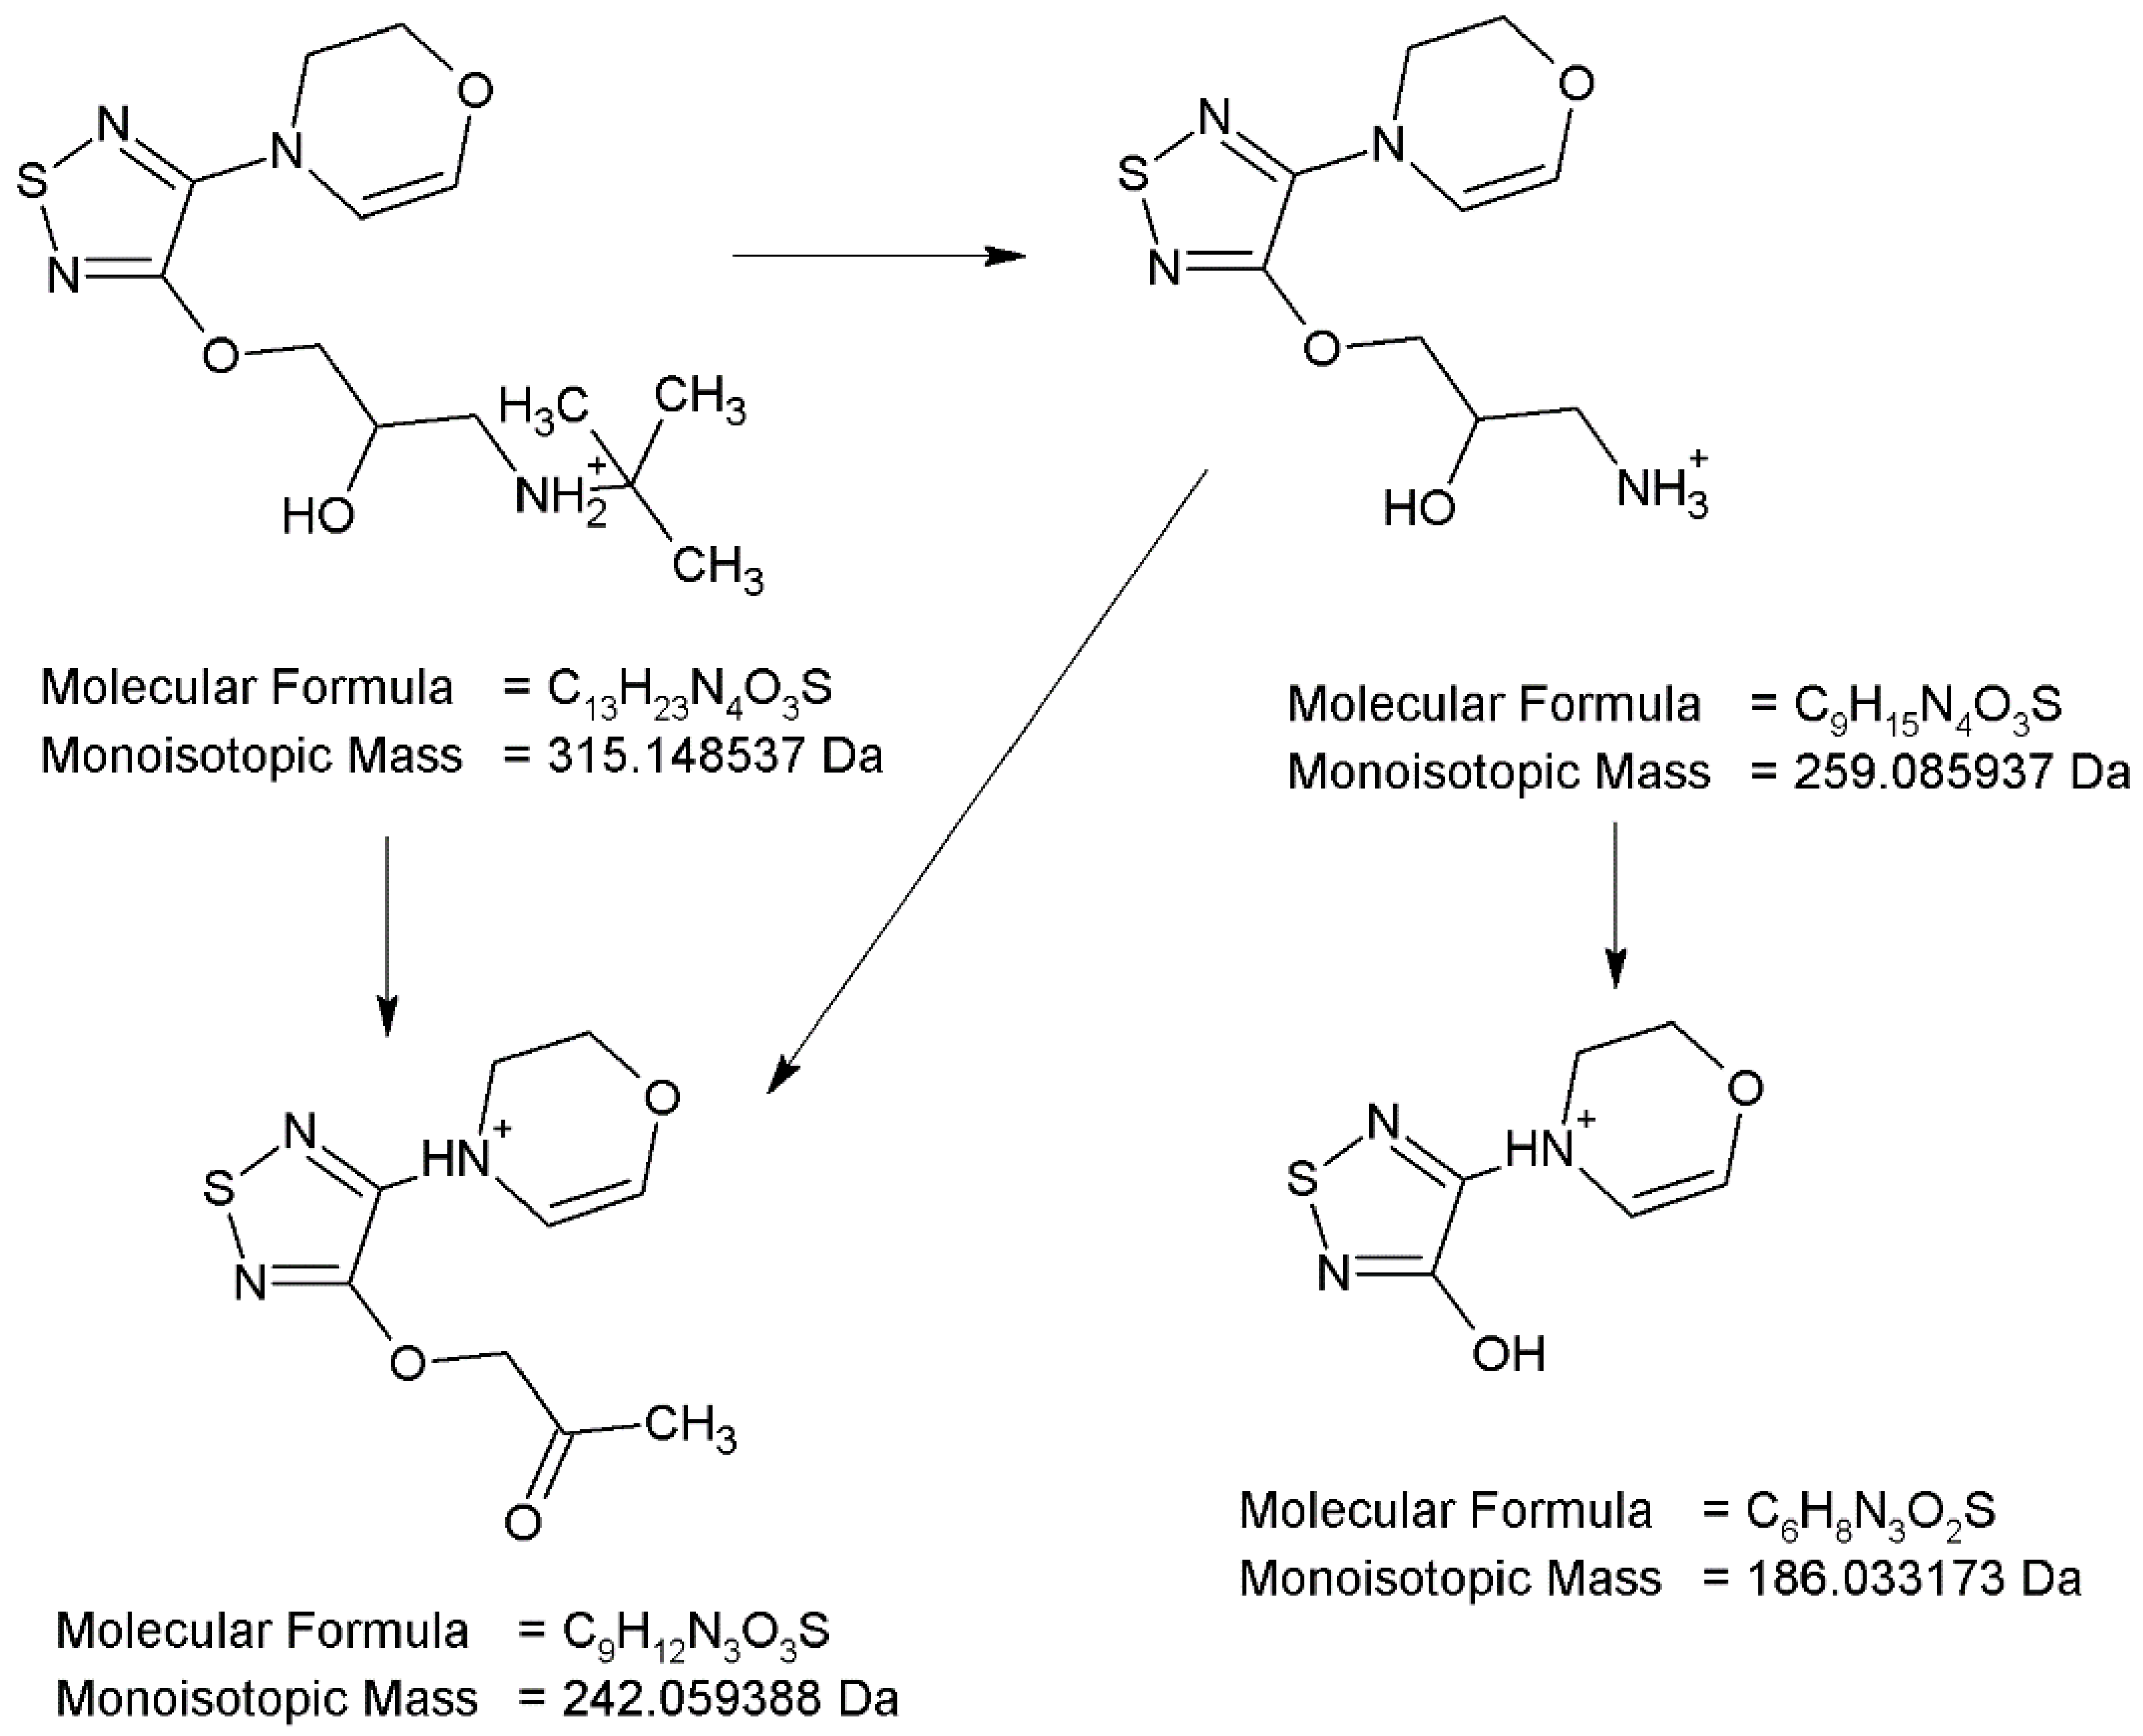
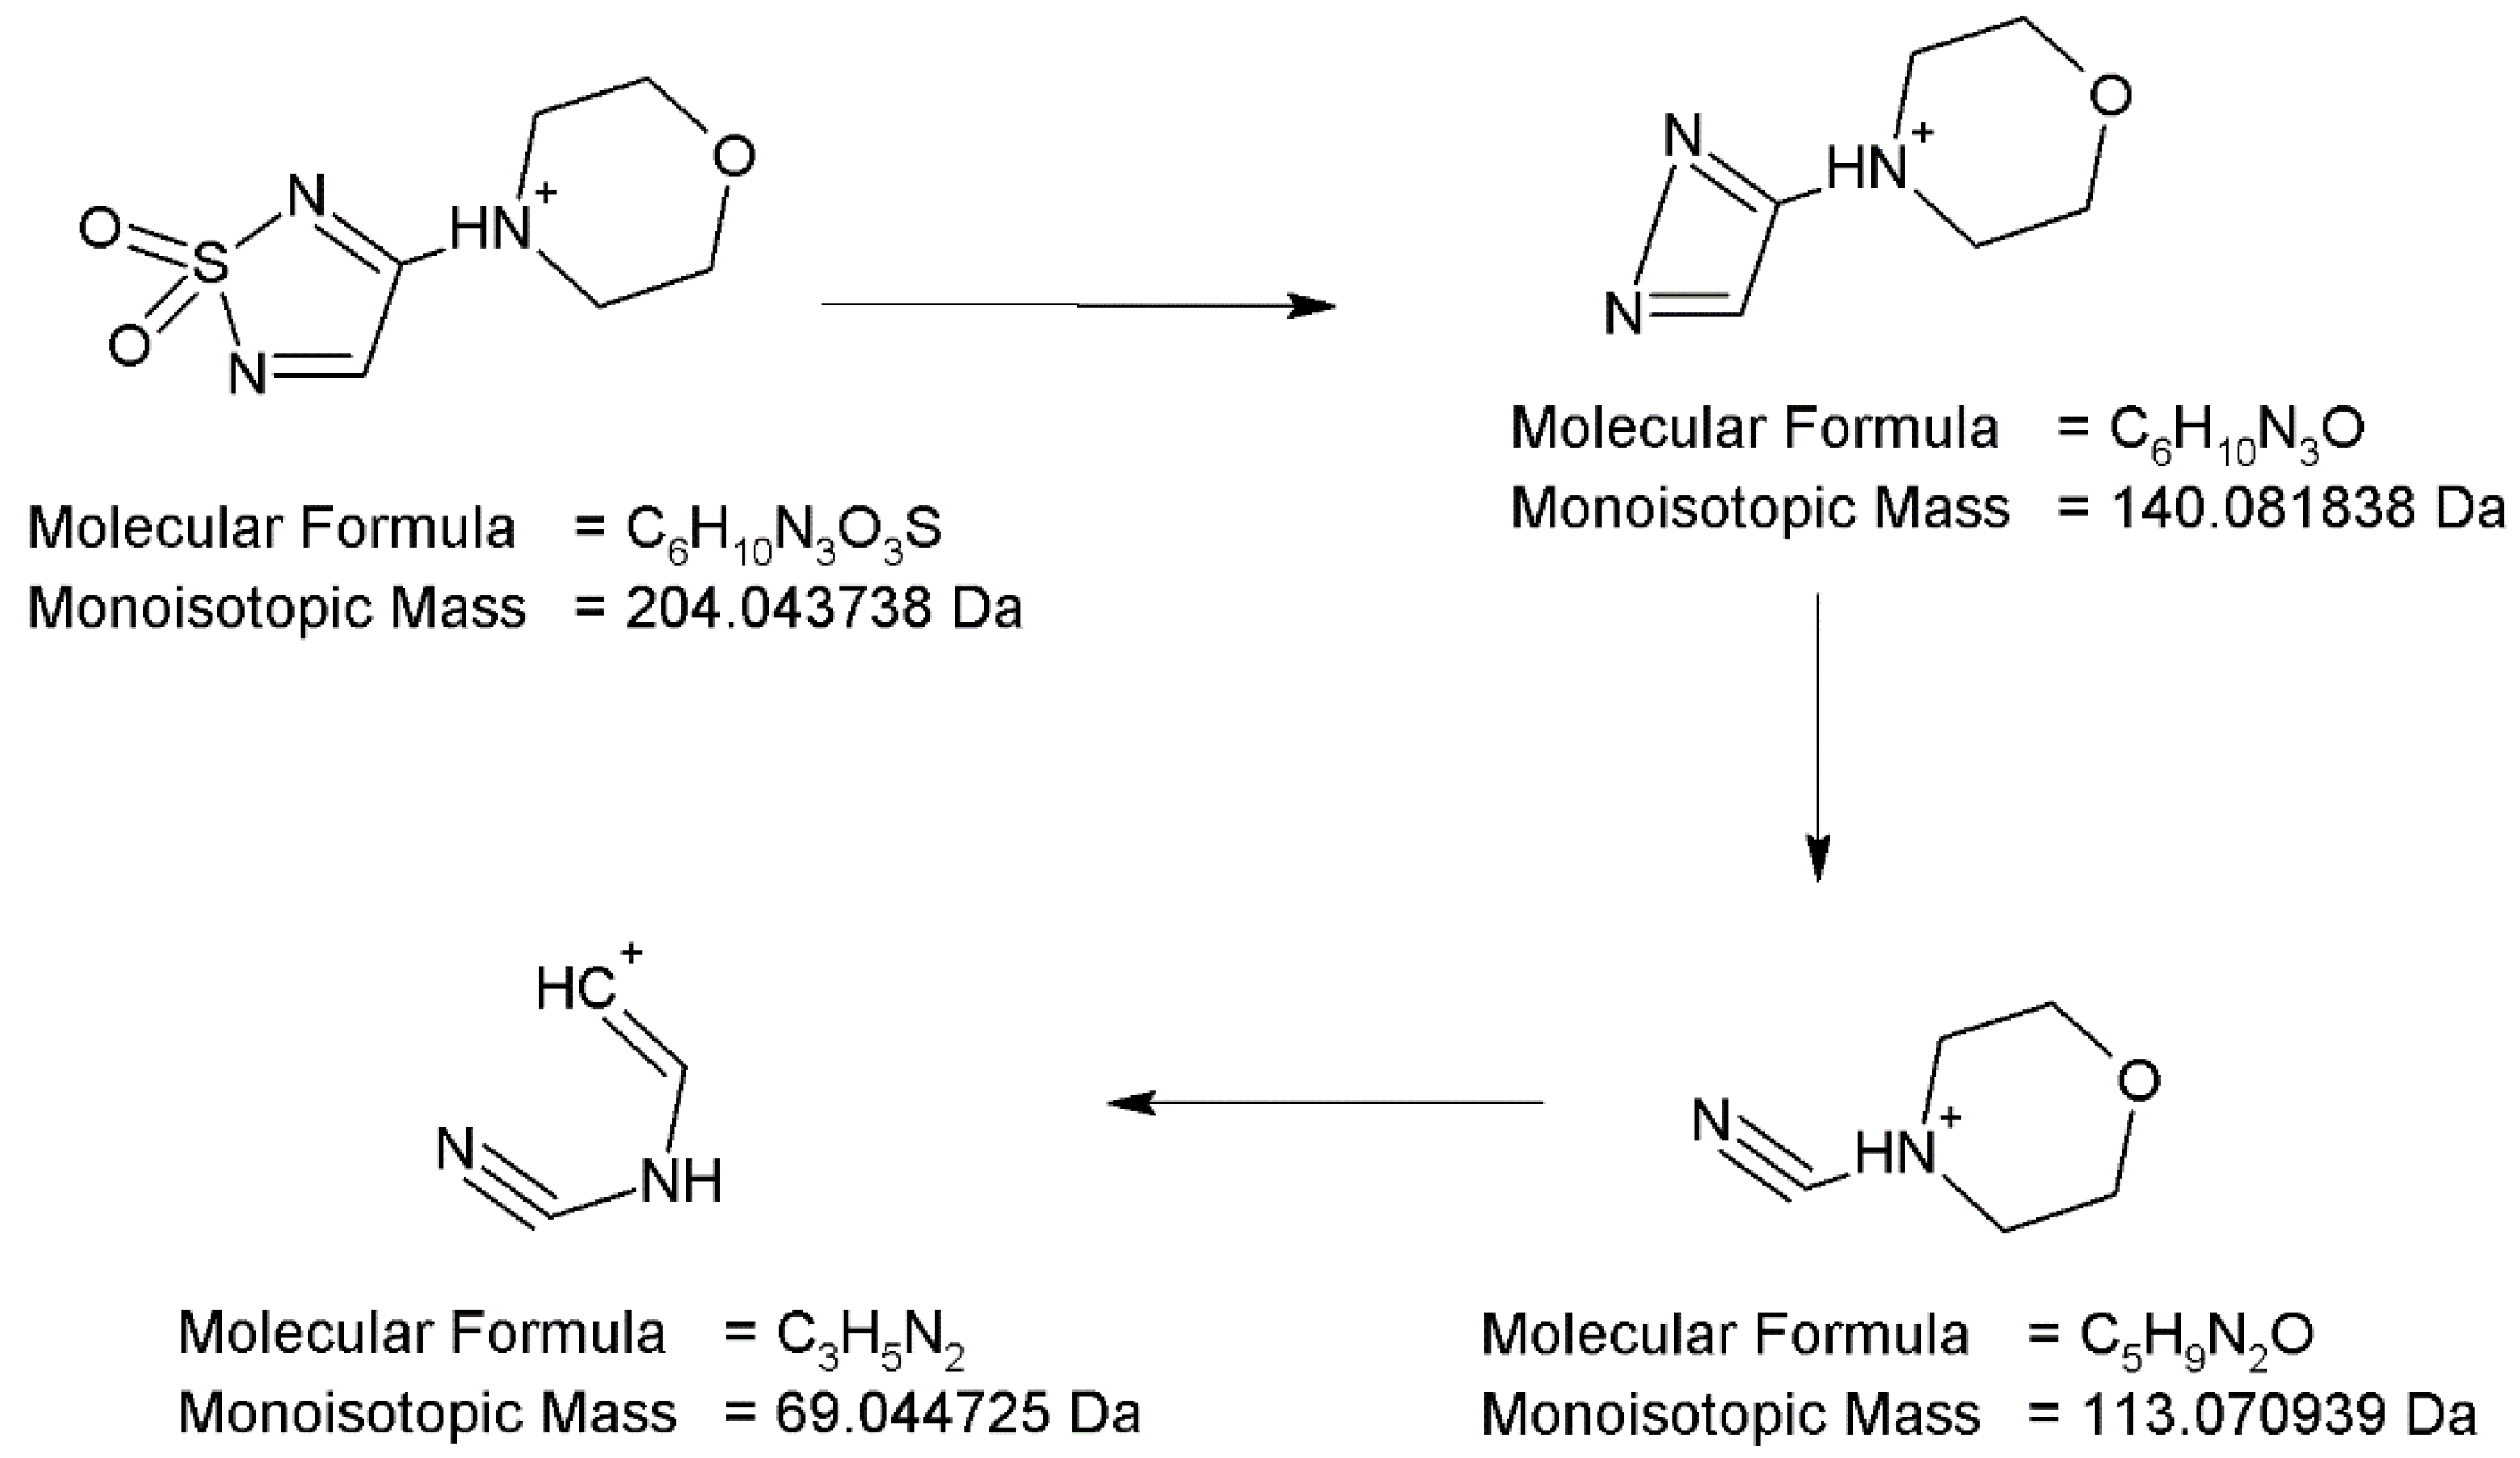
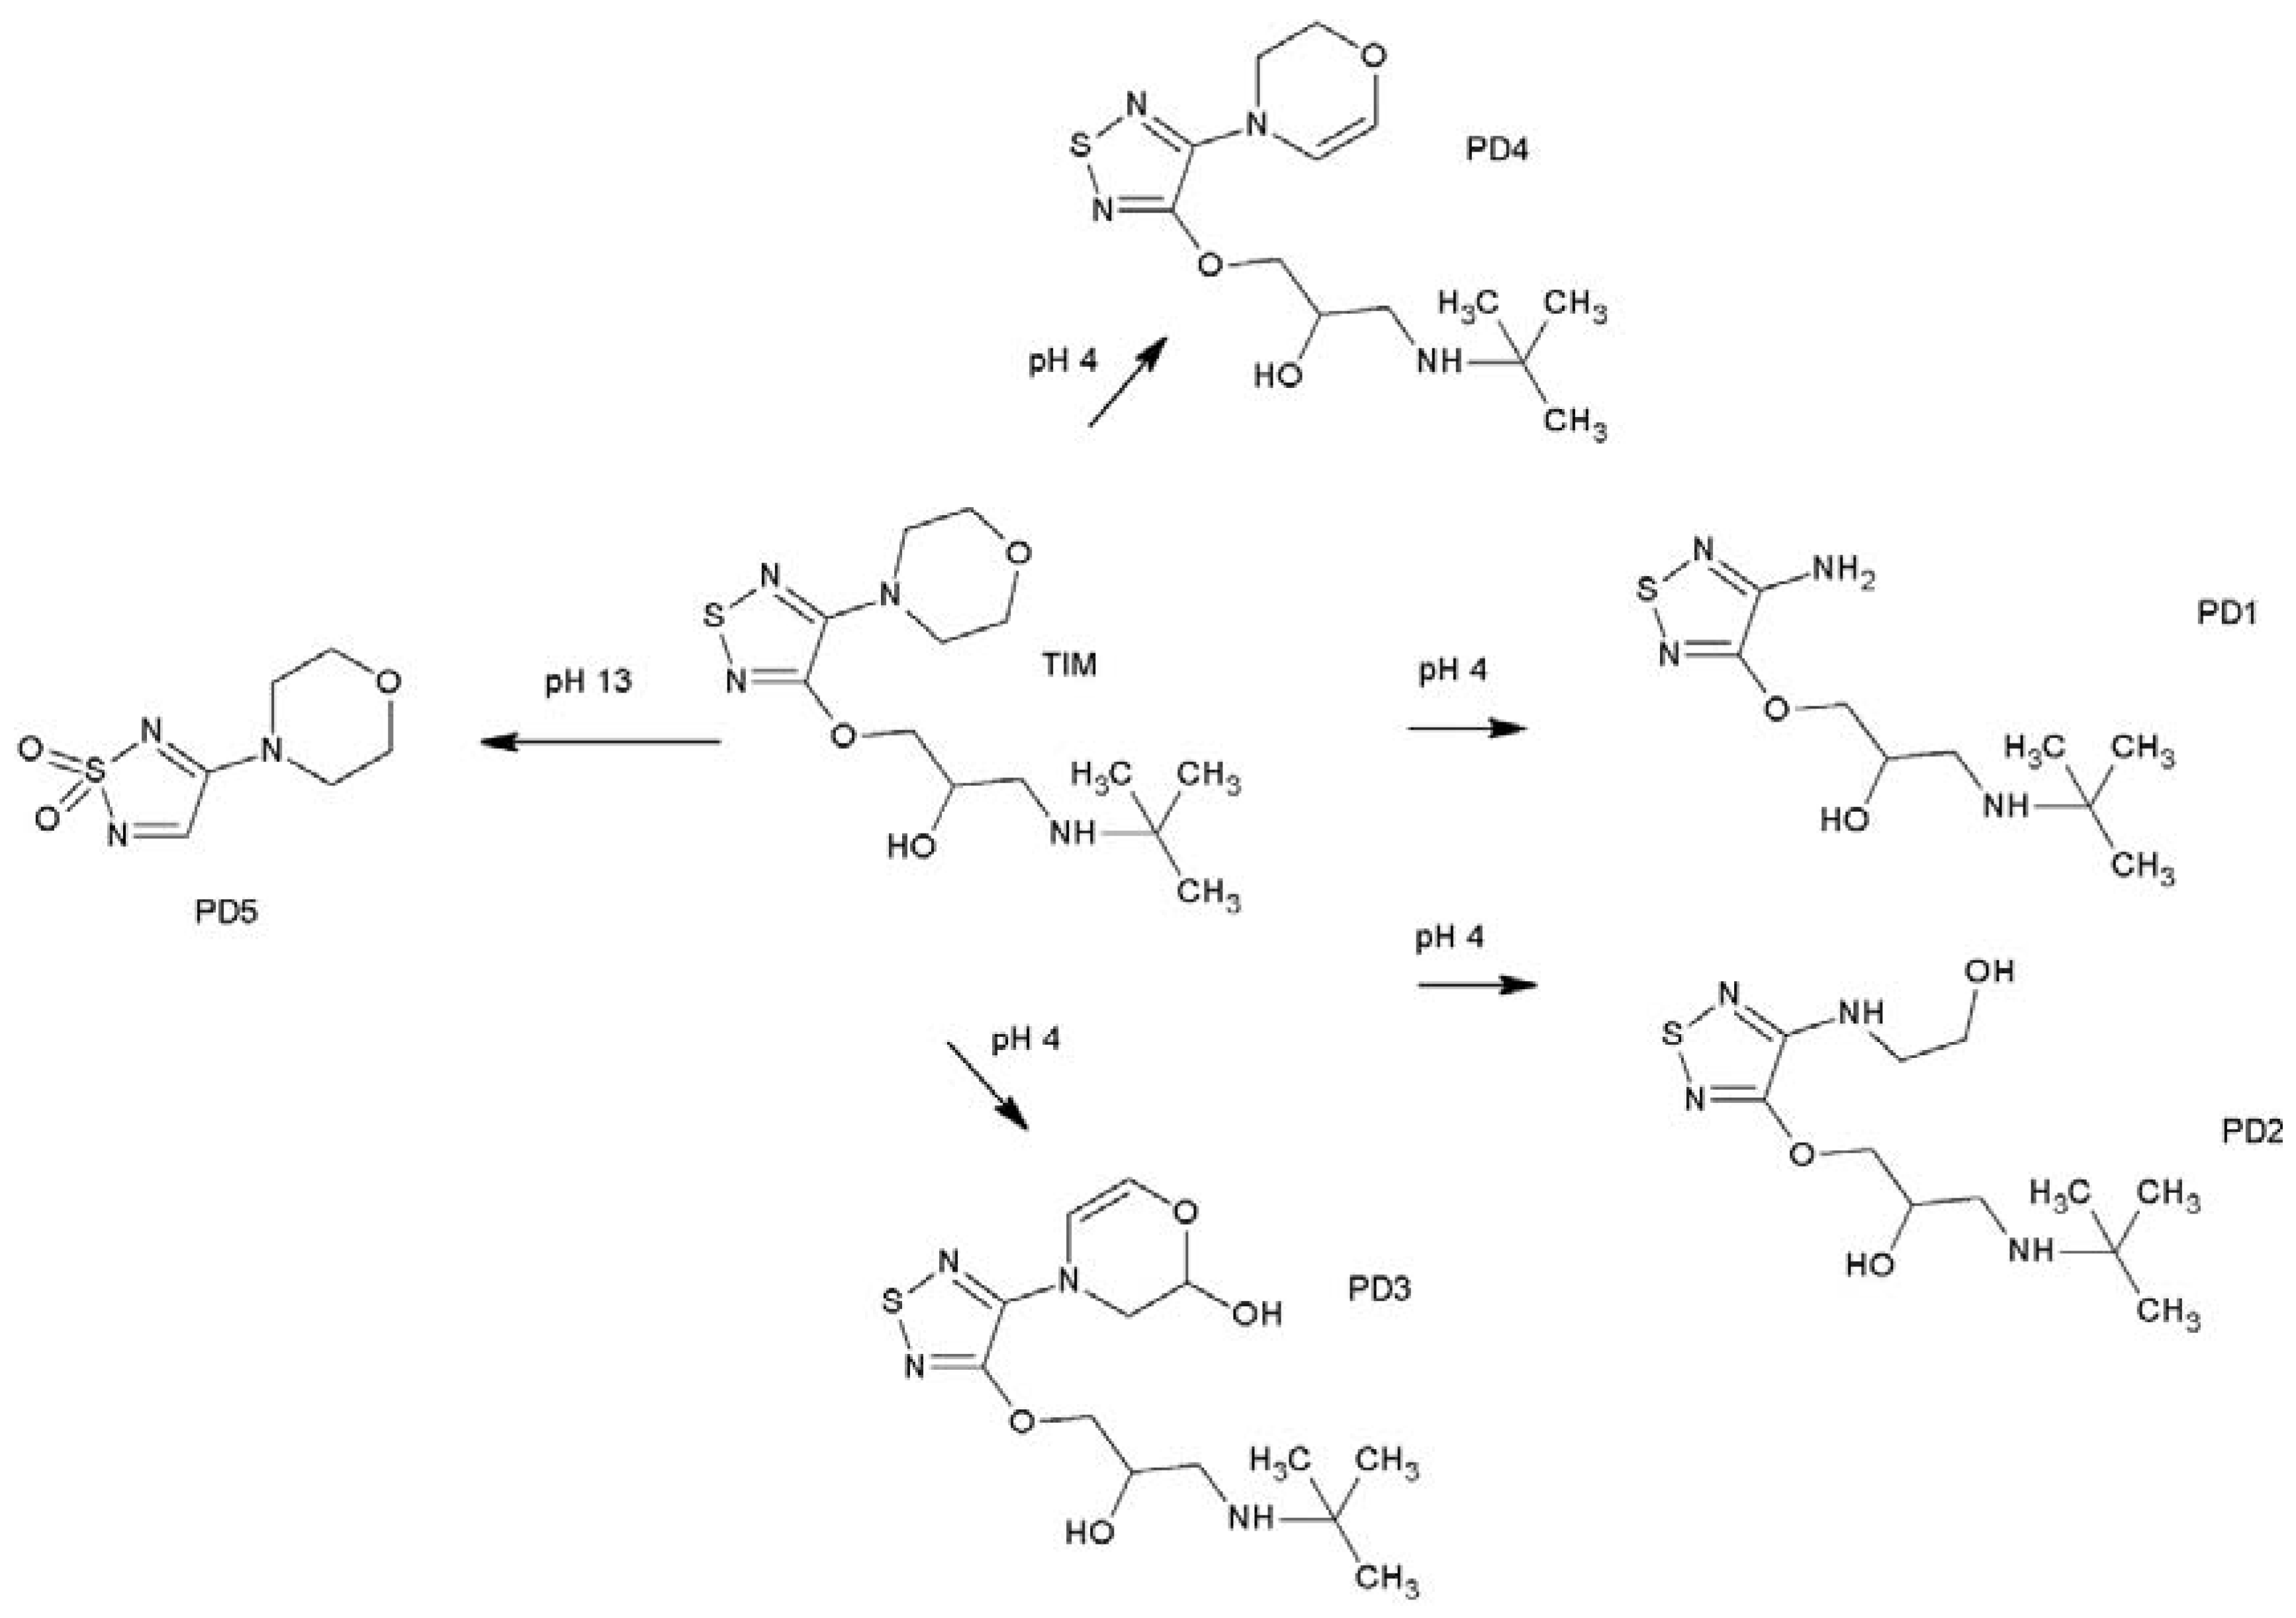
2.4. LC-MS Analyses Results
2.5. ROS Generation
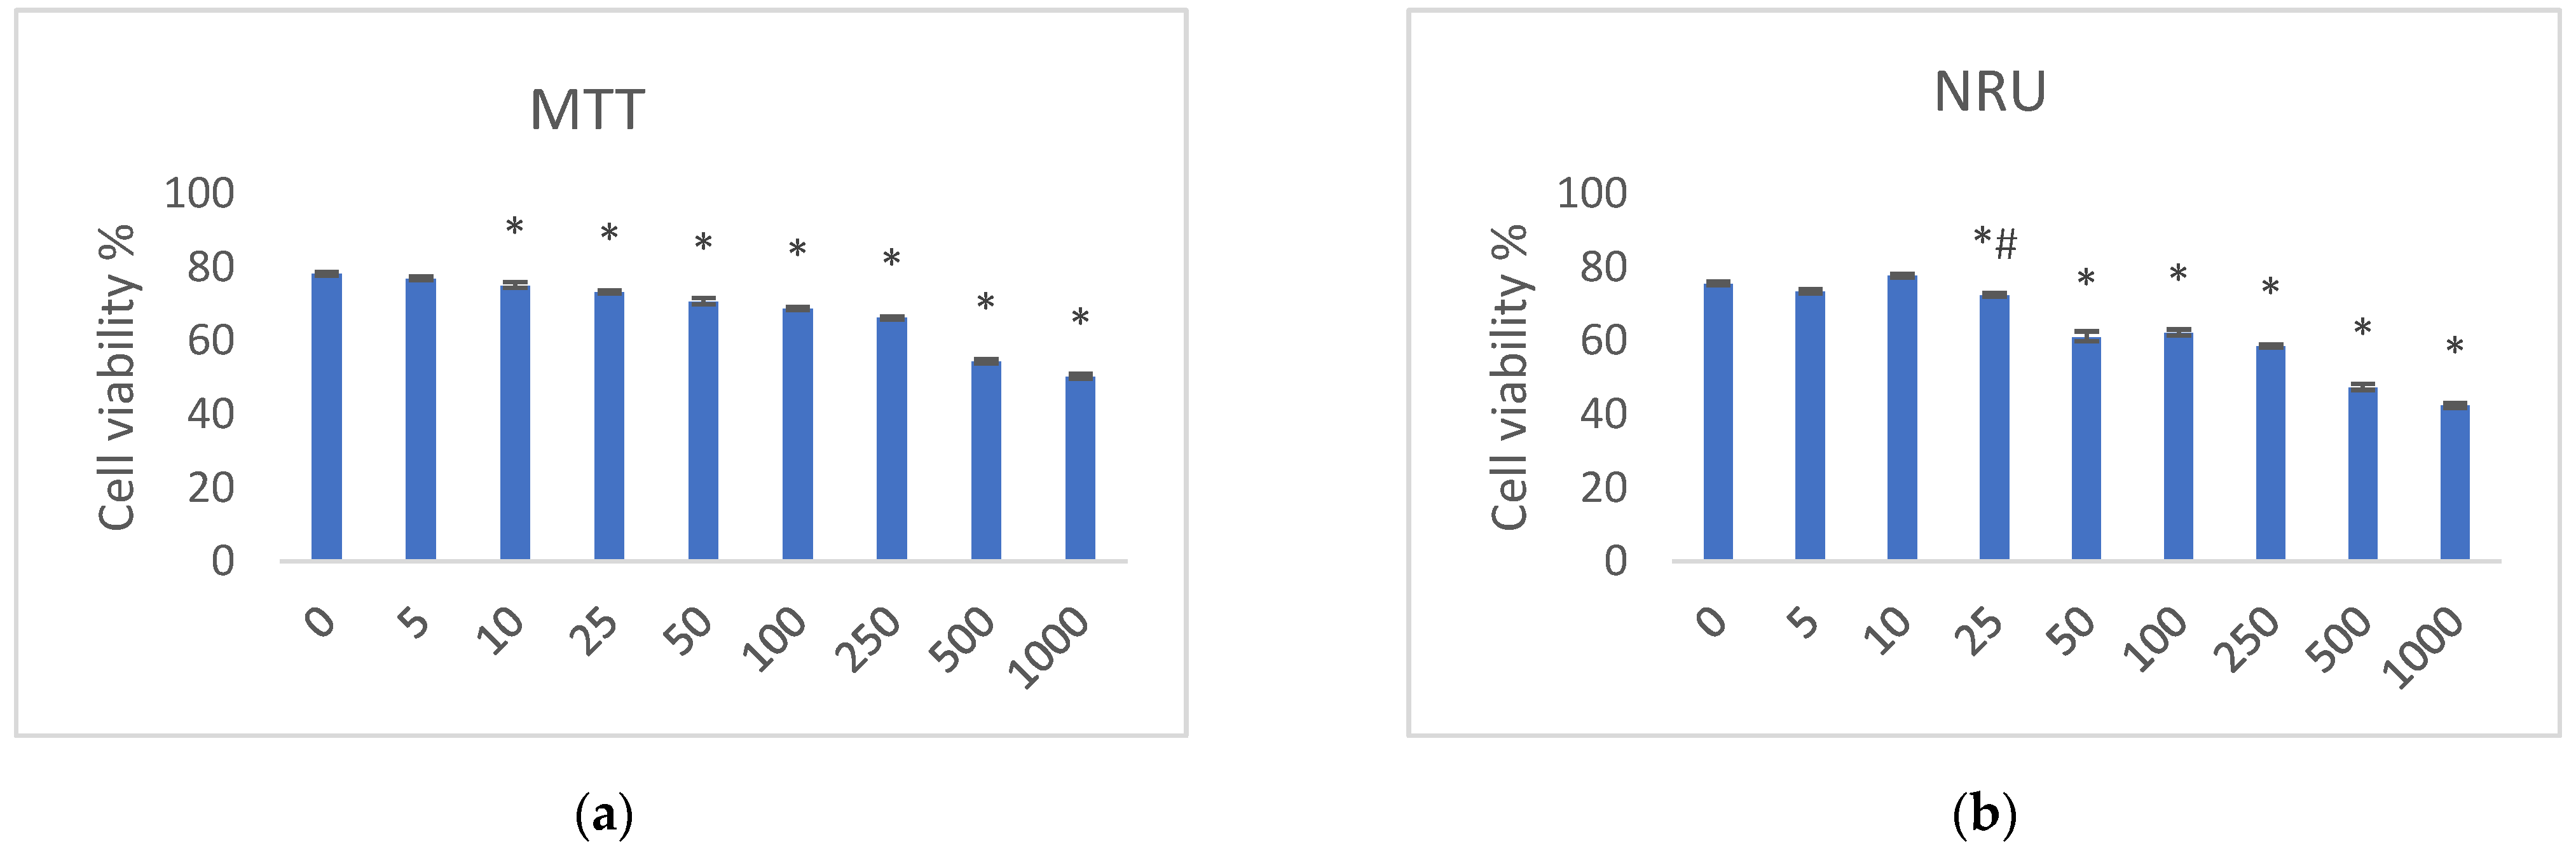
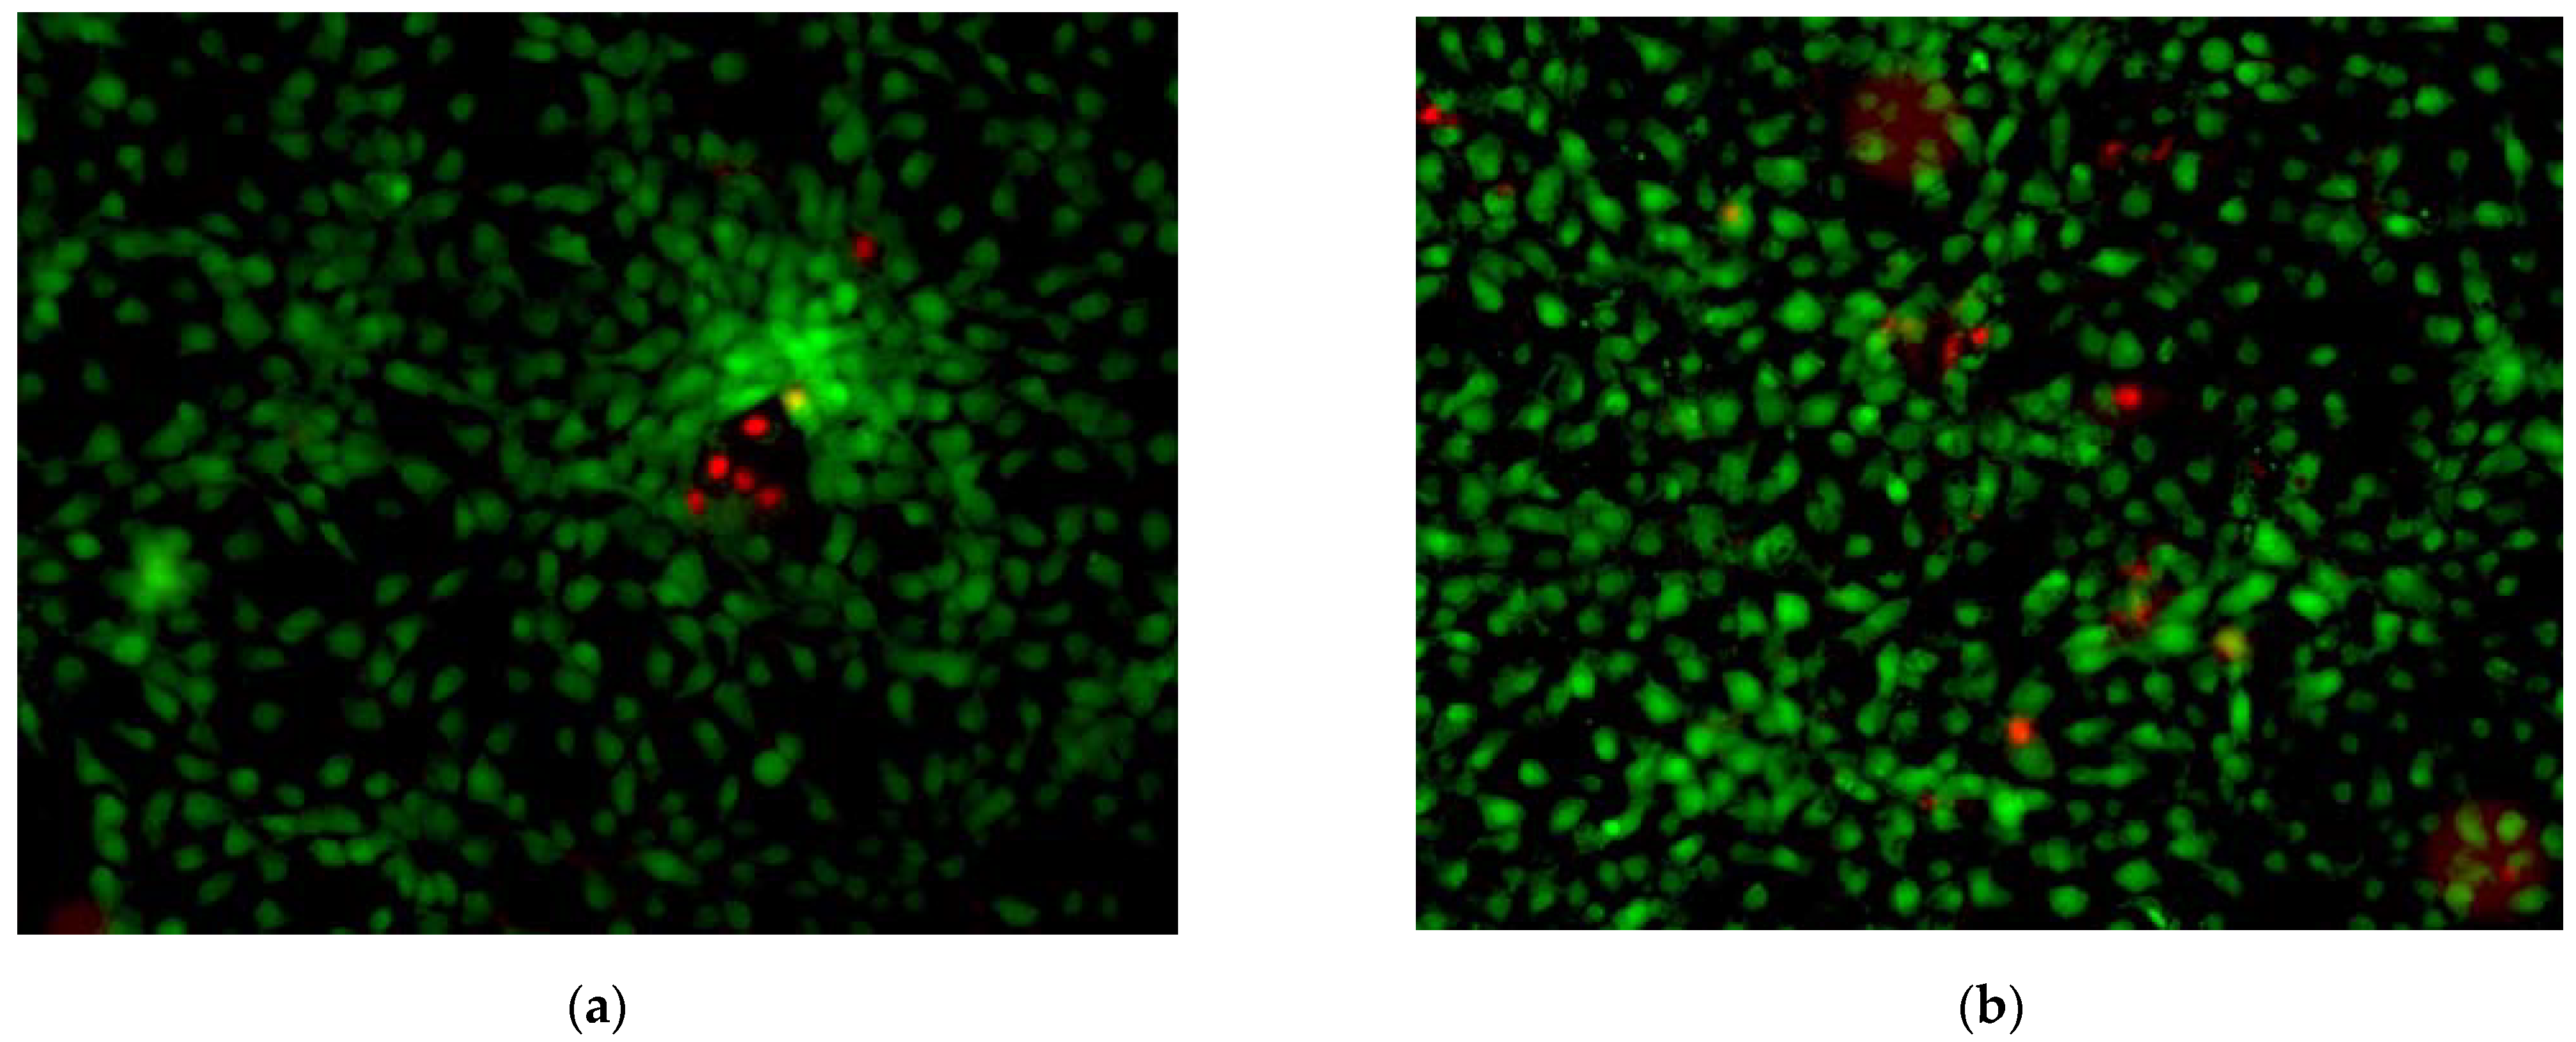
2.6. In Vitro Tests
3. Materials and Methods
3.1. Materials for Chemical Tests
3.2. LC-UV Method
3.3. UPLC-HRMS/MS Analysis
3.4. Preliminary UV/VIS Analysis
3.5. UV/VIS Light Simulator
3.6. Photodegradation of TIM in Solutions
3.7. Kinetics of Photodegradation
3.8. ROS Assays [17]
3.9. Cell Cultures
3.10. MTT Test [26]
3.11. NRU Test [27]
3.12. Live/Dead Test [24]
3.13. Statistical Analysis
4. Conclusions
Author Contributions
Funding
Institutional Review Board Statement
Informed Consent Statement
Data Availability Statement
Conflicts of Interest
References
- Blakely, K.M.; Drucker, A.M.; Rosen, C.F. Drug-induced photosensitivity—An update: Culprit drugs, prevention and management. Drug Safety 2019, 42, 827–847. [Google Scholar] [CrossRef] [PubMed]
- Kurian, A.; Reghunadhan, I.; Thilak, P.; Soman, I.; Nair, U. Short-term efficacy and safety of topical β-blockers (Timolol Maleate Ophthalmic Solution, 0.5%) in acute migraine. A randomized crossover trial. JAMA Ophthalmol. 2020, 138, 1160–1166. [Google Scholar] [CrossRef] [PubMed]
- Devrukhakar, P.S.; Shankar, M.S.; Shankar, G.; Srinivas, R. Proposal of degradation pathway with toxicity predicion for hydrolytic and photolytic degradation products of timolol. J. Pharm. Biomed. Anal. 2018, 154, 7–15. [Google Scholar] [CrossRef] [PubMed]
- Vashista, V.K.; Kuma, A. Stereochemical facets of clinical ß-blockers: An overview. Chirality 2020, 32, 722–735. [Google Scholar] [CrossRef] [PubMed]
- Cizmarikova, R.; Habala, L.; Valentova, J.; Markuliak, M. Survey of pharmacological activity and pharmacokinetics of selected ß-blockers in regard to their stereochemistry. Appl. Sci. 2019, 9, 625. [Google Scholar] [CrossRef]
- Lozzi, F.; Di Raimondo, C.; Lanna, C.; Diluvio, L.; Mazzilli, S.; Garofalo, V.; Dika, E.; Dellembra, E.; Coniglione, F.; Bianchi, L. Latest evidence regarding the effects of photosensitive drugs on the skin: Pathogenetic mechanisms and clinical manifestations. Pharmaceutics 2020, 12, 1104. [Google Scholar] [CrossRef] [PubMed]
- Nabi-Meybodi, M.; Sahebnasagh, A.; Hakimi, Z.; Shabani, M.; Asghar Shakeri, A.; Saghafi, F. Effects of topical timolol for the prevention of radiation-induced dermatitis in breast cancer: A pilot triple-blind, placebo-controlled trial. BMC Cancer 2022, 22, 1079. [Google Scholar] [CrossRef] [PubMed]
- The International Council for Harmonisation of Technical Requirements for Pharmaceuticals for Human Use. ICH Topic Q1B Photostability Testing of New Active Substances and Medicinal Products; ICH: Geneva, Switzerland, 1998. [Google Scholar]
- Kumar, D.K.; Sahu, A.; Wani, A.A.; Bharatam, P.V.; Chakraborti, A.K.; Giri, S.; Singh, S. Characterization of photodegradation products of bepotastine besilate and in silico evaluation of their physicochemical, absorption, distribution, metabolism, excretion and toxicity properties. J. Pharm. Sci. 2010, 109, 1883–1895. [Google Scholar]
- Yoon, D.J.; Kaur, R.; Gallegos, A.; West, K.; Yang, H.; Schaefer, S.; Tchanque-Fossuo, C.; Dahle, S.; Isseroff, R.R.; Kaur, R.; et al. Adverse effects of topical timolol: Safety concerns and implications for dermatologic use. JAAD 2021, 84, 199–200. [Google Scholar] [CrossRef] [PubMed]
- Available online: https://www.organic-chemistry.org/prog/peo/tox.html (accessed on 20 September 2023).
- Available online: https://toxtree.sourceforge.net/ (accessed on 20 September 2023).
- Piram, A.; Salvador, A.; Verne, C.; Herbreteau, B.; Faure, R. Photolysis of ß-blockers in environmental waters. Chemosphere 2008, 73, 1265–1271. [Google Scholar] [CrossRef] [PubMed]
- Piram, A.; Faure, R.; Chermette, H.; Bordes, C.; Herbreteau, B.; Salvador, A. Photochemical behaviour of propranolol in environmental waters: The hydroxylated photoproducts. Int. J. Environ. Anal. Chem. 2012, 92, 96–109. [Google Scholar] [CrossRef]
- Krishna, M.V.; Madhavi, G.; Idris, N.F.; Idris, S.M.; Chowdary, L.K. Photocatalysis of beta-blockers an overview. Arab. J. Chem. 2019, 12, 1290–1297. [Google Scholar]
- Chen, Y.; Liang, Q.; Zhou, D.; Wang, Z.; Tao, T.; Zuo, Y. Photodegradation kinetics, products and mechanism of timolol under simulated sunlight. J. Hazard. Mat. 2013, 252–253, 220–226. [Google Scholar] [CrossRef] [PubMed]
- Organization for Economic Co-Operation and Development. Guidelines for the Testing of Chemicals. In Test Guideline No 495: Reactive Oxygen Species (ROS) Assay for Photoreactivity; OECD Publishing: Paris, France, 2019. [Google Scholar] [CrossRef]
- Seto, Y.; Inoue, R.; Kato, M.; Yamada, S.; Onoue, S. Photosafety assessments on pirfenidone: Photochemical, photobiological and pharmacokinetic characterization. J. Photochem. Photobiol. B Biol. 2013, 120, 44–51. [Google Scholar] [CrossRef] [PubMed]
- Onoue, S.; Suzuki, G.; Kato, M.; Hirota, M.; Nishida, H.; Kitagaki, M.; Kouzuki, H.; Yamada, S. Non-animal photosafety assessment approaches for cosmetics based on the photochemical and photobiochemical properties. Toxicol. Vitr. 2013, 27, 2316–2324. [Google Scholar] [CrossRef] [PubMed]
- The International Council for Harmonisation of Technical Requirements for Pharmaceuticals for Human Use (ICH). Validation of Analytical Procedures: Text and Methodology Q2(R1); ICH: Geneva, Switzerland, 2005. [Google Scholar]
- Yoshioka, S.; Stella, V.J. pH and pH-rate profiles. In Stability of Drugs and Dosage Forms; Kluwer Academic Publications: New York, NY, USA, 2002; pp. 80–97. [Google Scholar]
- Available online: https://www.drugbank (accessed on 15 April 2023).
- Masson-Meyesr, D.; Bumah, V.V.; Enwemeka, C.S. A comparison of four methods for determining viability in human dermal fibroblasts irradiated with blue light. J. Pharm. Biomed. Anal. 2016, 79, 15–22. [Google Scholar]
- Available online: https://www.thermofisher.com/order/catalog/product/L3224 (accessed on 15 May 2023).
- Council of Europe. European Pharmacopoeia; Council of Europe: Strasbourg, France, 2016. [Google Scholar]
- Gaspar, L.R.; Tharmann, J.; Maia Campos, P.G.; Liebsch, M. Skin phototoxicity of cosmetic formulations containing photounstable and photostable UV-filters and vitamin A palmitate. Toxicol. Vitr. 2013, 27, 418–425. [Google Scholar] [CrossRef] [PubMed]
- Mateos-Pujante, A.; Jimenez, M.C.; Andreu, I. Evaluation of phototoxicity induced by the anticancer drug rucaparib. Sci. Rep. 2022, 12, 3434. [Google Scholar] [CrossRef] [PubMed]


| Parameter | Value |
|---|---|
| Linearity range | 10–100 µg/mL |
| Regression equation (mean ± SD, n = 5) | y = 0.02322 ± 0.00023x + 0.03935 ± 0.00849 |
| R2 (mean ± SD, n = 5) | 0.9979 ± 0.0031 |
| LOD | 1.21 µg/mL |
| LOQ | 3.66 µg/mL |
| Recovery (mean ± SD, n = 9) | 99.62 ± 1.14% |
| RSD for within-day precision (n = 3) | 1.07% |
| RSD for between-day precision (n = 9) | 2.27% |
| RSD for the peak areas (n = 5) | 1.17% |
| pH | Degradation [%] | y = ax + b | R2 | k [s−1] | t0.1 [h] | t0.5 [h] |
|---|---|---|---|---|---|---|
| 1 | 98.13 | - | - | - | - | - |
| 4 | 96.29 | - | - | - | - | - |
| 7 | 86.05 | y = −0.0416x + 4.0765 | 0.9663 | 2.7 × 10⁻⁵ | 1.08 | 7.13 |
| 10 | 73.85 | y = −0.0309x + 4.2203 | 0.9248 | 1.9 × 10⁻⁵ | 1.54 | 10.13 |
| 13 | 82.38 | y = −0.0389x + 4.2312 | 0.9663 | 2.5 × 10⁻⁵ | 1.17 | 7.70 |
| 49 kJ/m2 | 234 kJ/m2 | 675 kJ/m2 | 1350 kJ/m2 | 2025 kJ/m2 | 2700 kJ/m2 | |
|---|---|---|---|---|---|---|
| 1O2 | ||||||
| TIM | 11 | 30 | 52 | 77 | 130 | 201 |
| Quinine | 98 | 156 | 282 | 319 | 401 | 493 |
| Benzocaine | −13 | −10 | −9 | −8 | −3 | 10 |
| O2− | ||||||
| TIM | 7 | 53 | 92 | 101 | 124 | 170 |
| Quinine 1 | 81 | 127 | 133 | 148 | 179 | 221 |
| Benzocaine 2 | −13 | −13 | −11 | −8 | −6 | 2 |
Disclaimer/Publisher’s Note: The statements, opinions and data contained in all publications are solely those of the individual author(s) and contributor(s) and not of MDPI and/or the editor(s). MDPI and/or the editor(s) disclaim responsibility for any injury to people or property resulting from any ideas, methods, instructions or products referred to in the content. |
© 2024 by the authors. Licensee MDPI, Basel, Switzerland. This article is an open access article distributed under the terms and conditions of the Creative Commons Attribution (CC BY) license (https://creativecommons.org/licenses/by/4.0/).
Share and Cite
Lejwoda, K.; Gumieniczek, A.; Filip, A.; Naumczuk, B. The Study on Timolol and Its Potential Phototoxicity Using Chemical, In Silico and In Vitro Methods. Pharmaceuticals 2024, 17, 98. https://doi.org/10.3390/ph17010098
Lejwoda K, Gumieniczek A, Filip A, Naumczuk B. The Study on Timolol and Its Potential Phototoxicity Using Chemical, In Silico and In Vitro Methods. Pharmaceuticals. 2024; 17(1):98. https://doi.org/10.3390/ph17010098
Chicago/Turabian StyleLejwoda, Karolina, Anna Gumieniczek, Agata Filip, and Beata Naumczuk. 2024. "The Study on Timolol and Its Potential Phototoxicity Using Chemical, In Silico and In Vitro Methods" Pharmaceuticals 17, no. 1: 98. https://doi.org/10.3390/ph17010098
APA StyleLejwoda, K., Gumieniczek, A., Filip, A., & Naumczuk, B. (2024). The Study on Timolol and Its Potential Phototoxicity Using Chemical, In Silico and In Vitro Methods. Pharmaceuticals, 17(1), 98. https://doi.org/10.3390/ph17010098