


OMNI: Gas Chromatograph Captures Seven Common PET Radiotracer Analytes in under 5 Minutes


Abstract
:1. Introduction
1.1. PET Radiopharmaceuticals
1.2. Gas Chromatography and Flame Ionization Detector
1.3. Quality Control
2. Results
2.1. Residual Solvents from Carbon-11 and Fluorine-18 Radiotracer Syntheses
2.2. Calibration Curve
2.3. Validation Experiments
3. Discussion
4. Materials and Methods
4.1. Chemicals and Materials
4.2. OMNI Standard Preparation
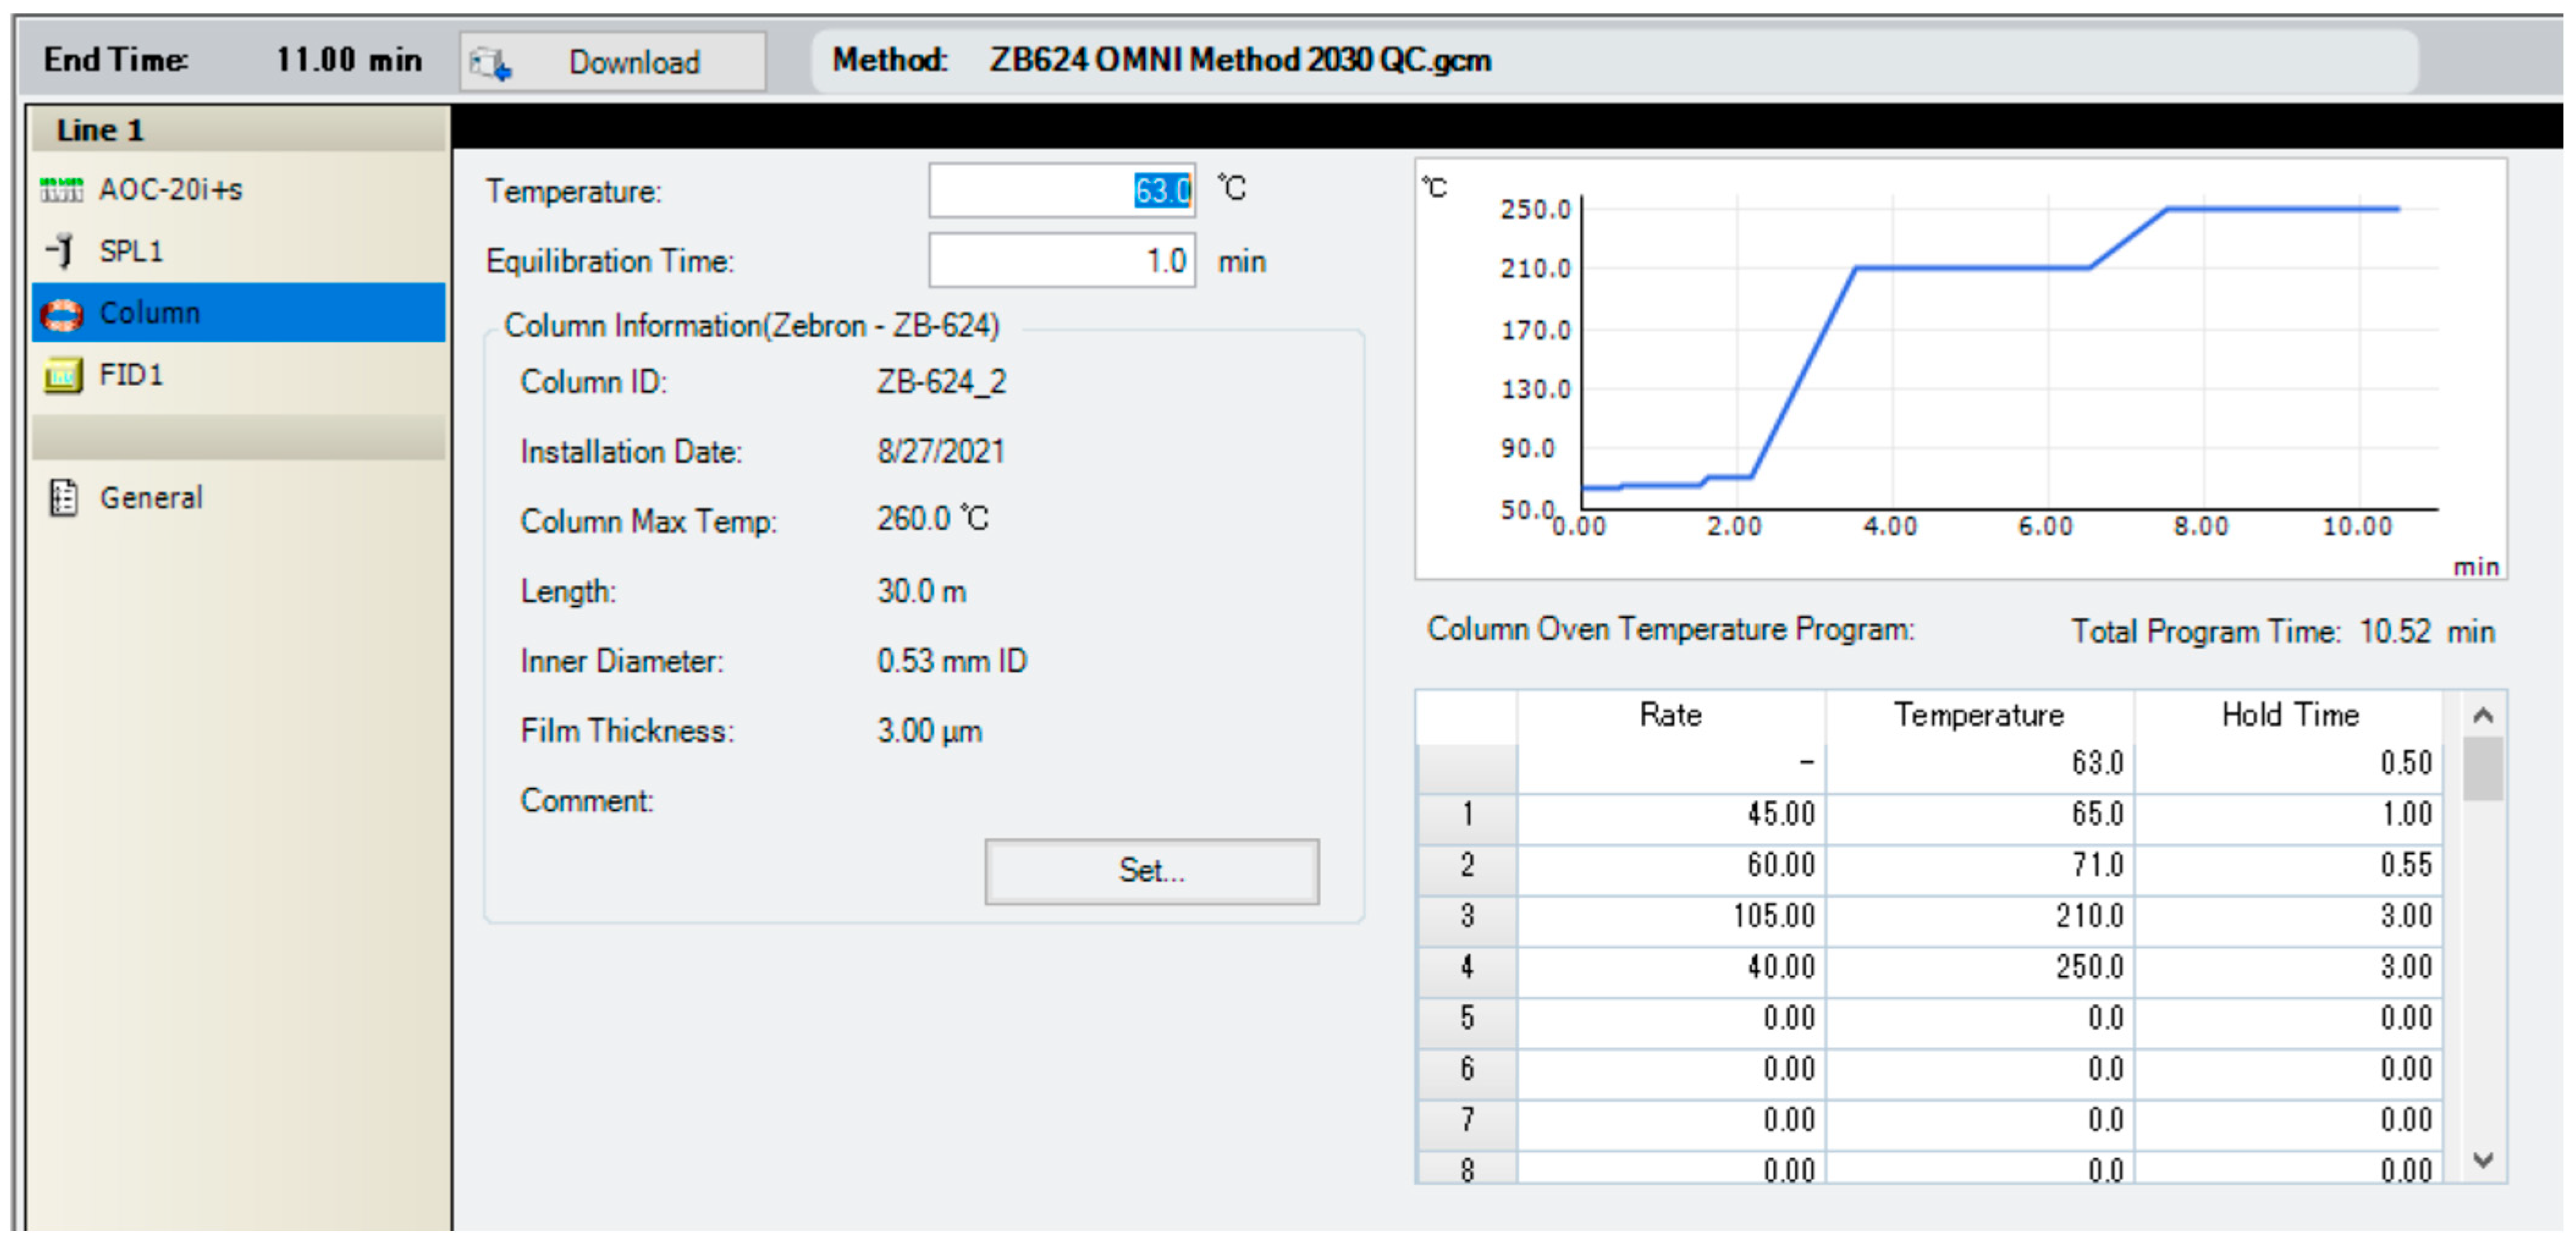
4.3. Instrumentation
5. Conclusions
Supplementary Materials
Author Contributions
Funding
Institutional Review Board Statement
Informed Consent Statement
Data Availability Statement
Conflicts of Interest
References
- Berger, A. How does it work? Positron emission tomography. BMJ 2003, 326, 1449. [Google Scholar] [CrossRef]
- Chen, Y.; Goldsmith, J.; Ogden, R.T. Functional Data Analysis of Dynamic PET Data. J. Am. Stat. Assoc. 2019, 114, 595–609. [Google Scholar] [CrossRef] [PubMed]
- Vaquero, J.J.; Kinahan, P. Positron Emission Tomography: Current Challenges and Opportunities for Technological Advances in Clinical and Preclinical Imaging Systems. Annu. Rev. Biomed. Eng. 2015, 17, 385–414. [Google Scholar] [CrossRef] [PubMed]
- Awan, M.J.; Siddiqui, F.; Schwartz, D.; Yuan, J.; Machtay, M.; Yao, M. Application of positron emission tomography/computed tomography in radiation treatment planning for head and neck cancers. World J. Radiol. 2015, 7, 382–393. [Google Scholar] [CrossRef] [PubMed]
- Hillman, E.M. Optical brain imaging in vivo: Techniques and applications from animal to man. J. Biomed. Opt. 2007, 12, 051402. [Google Scholar] [CrossRef]
- Honour, J.W. Gas chromatography-mass spectrometry. Methods Mol. Biol. 2006, 324, 53–74. [Google Scholar] [CrossRef]
- Buse, J.; Robinson, J.L.; Shyne, R.; Chi, Q.; Affleck, D.; Duce, D.; Seiden-Long, I. Rising above helium: A hydrogen carrier gas chromatography flame ionization detection (GC-FID) method for the simultaneous quantification of toxic alcohols and ethylene glycol in human plasma specimens. Clin. Biochem. 2019, 73, 98–104. [Google Scholar] [CrossRef]
- Keller, R.A. Gas chromatography. Sci. Am. 1961, 205, 58–67. [Google Scholar] [CrossRef]
- Graffius, G.C.; Jocher, B.M.; Zewge, D.; Halsey, H.M.; Lee, G.; Bernardoni, F.; Bu, X.; Hartman, R.; Regalado, E.L. Generic gas chromatography-flame ionization detection method for quantitation of volatile amines in pharmaceutical drugs and synthetic intermediates. J. Chromatogr. A 2017, 1518, 70–77. [Google Scholar] [CrossRef]
- Jain, D.; Basniwal, P.K. Forced degradation and impurity profiling: Recent trends in analytical perspectives. J. Pharm. Biomed. Anal. 2013, 86, 11–35. [Google Scholar] [CrossRef]
- Hinshaw, J.V. LC GC North America; Advanstar Communications MultiMedia Healthcare: Duluth, MN, USA; Cranbury, NJ, USA, 2005; Volume 23. [Google Scholar]
- Poole, C.F. Ionization-based detectors for gas chromatography. J. Chromatogr. A 2015, 1421, 137–153. [Google Scholar] [CrossRef] [PubMed]
- Houck, M.M.; Siegel, J.A. Fundamentals of Forensic Science, 2nd ed.; Academic Press: Burlington, MA, USA, 2010; p. xvii. 661p. [Google Scholar]
- Cramers, C.A.; Janssen, H.G.; van Deursen, M.M.; Leclercq, P.A. High-speed gas chromatography: An overview of various concepts. J. Chromatogr. A 1999, 856, 315–329. [Google Scholar] [CrossRef] [PubMed]
- ICH. International Council for Harmonisation of Technical Requirements for Pharmaceuticals for Human Use; ICH Guideline Q3C (R6) on Impurities: Guideline for Residual Solvents. 2017. Available online: https://www.ema.europa.eu/en/documents/scientific-guideline/ich-guideline-q2r2-validation-analytical-procedures-step-2b_en.pdf (accessed on 13 November 2023).
- Cole, E.L.; Stewart, M.N.; Littich, R.; Hoareau, R.; Scott, P.J. Radiosyntheses using fluorine-18: The art and science of late stage fluorination. Curr. Top. Med. Chem. 2014, 14, 875–900. [Google Scholar] [CrossRef]
- Hubner, K.F.; Andrews, G.A.; Washburn, L.; Wieland, B.W.; Gibbs, W.D.; Hayes, R.L.; Butler, T.A.; Winebrenner, J.D. Tumor location with 1-aminocyclopentane [11C] carboxylic acid: Preliminary clinical trials with single-photon detection. J. Nucl. Med. 1977, 18, 1215–1221. [Google Scholar]
- Dolle, F. Carbon-11 and fluorine-18 chemistry devoted to molecular probes for imaging the brain with positron emission tomography. J. Label. Comp. Radiopharm. 2013, 56, 65–67. [Google Scholar] [CrossRef] [PubMed]
- Joszai, I.; Vekei, N.; Bajnai, D.; Kertesz, I.; Trencsenyi, G. A generic gas chromatography method for determination of residual solvents in PET radiopharmaceuticals. J. Pharm. Biomed. Anal. 2022, 207, 114425. [Google Scholar] [CrossRef]
- Cheng, C.; Liu, S.; Mueller, B.J.; Yan, Z. A generic static headspace gas chromatography method for determination of residual solvents in drug substance. J. Chromatogr. A 2010, 1217, 6413–6421. [Google Scholar] [CrossRef] [PubMed]
- Shao, X.; Hoareau, R.; Hockley, B.G.; Tluczek, L.J.; Henderson, B.D.; Padgett, H.C.; Scott, P.J. Highlighting the Versatility of the Tracerlab Synthesis Modules. Part 1: Fully Automated Production of [F]Labelled Radiopharmaceuticals using a Tracerlab FX(FN). J. Label. Comp. Radiopharm. 2011, 54, 292–307. [Google Scholar] [CrossRef]
- Costa, C.L.S.; Santos, L.M.; Castro, A.C.F.; Nascimento, L.T.C.; Silva, J.B.; Silveira, M.B. Chromatographic method development using multivariate approaches for organic solvents optimized analysis in [(18)F]fluorocholine. Appl. Radiat. Isot. 2023, 195, 110736. [Google Scholar] [CrossRef]
- Wagner, K.A.; Huang, C.B.; Melvin, M.S.; Ballentine, R.; Meruva, N.K.; Flora, J.W. Gas Chromatography-Mass Spectrometry Method to Quantify Benzo[a]Pyrene in Tobacco Products. J. Chromatogr. Sci. 2017, 55, 677–682. [Google Scholar] [CrossRef]
- ICH. International Council for Harmonisation of Technical Requirements for Pharmaceuticals for Human Use; ICH Guideline Q2(R2) on Validation of Analytical Procedures. 2022, pp. 15–16. Available online: https://www.ema.europa.eu/en/documents/scientific-guideline/international-conference-harmonisation-technical-requirements-registration-pharmaceuticals-human-use_en-33.pdf (accessed on 13 November 2023).
- Takeuchi, A.; Yamamoto, S.; Narai, R.; Nishida, M.; Yashiki, M.; Sakui, N.; Namera, A. Determination of dimethyl sulfoxide and dimethyl sulfone in urine by gas chromatography-mass spectrometry after preparation using 2,2-dimethoxypropane. Biomed. Chromatogr. 2010, 24, 465–471. [Google Scholar] [CrossRef] [PubMed]
- Klok, R.P.; Windhorst, A.D. Residual solvent analysis by gas chromatography in radiopharmaceutical formulations containing up to 12% ethanol. Nucl. Med. Biol. 2006, 33, 935–938. [Google Scholar] [CrossRef] [PubMed]


| Analyte | ** PDE mg/day | Max ppm | Boling Point °C | ICH Class | Radiotracer |
|---|---|---|---|---|---|
| MeOH | 30.0 | 3000 | 64.7 | 2 | [18F]FEPPA |
| * EtOH | - | - | 78.4 | 3 | [11C]ER-176, [11C]MRB, [11C]mHED, [11C]PiB, [18F]FEPPA [18F]PEG-folate, [18F]fallypride |
| Acetone | 50.0 | 5000 | 56.1 | 3 | [11C]ER-176, [11C]MRB, [11C]mHED, [11C]PiB, [18F]FEPPA [18F]PEG-folate, [18F]fallypride |
| MeCN | 4.1 | 410 | 82.0 | 2 | [11C]ER-176, [11C]MRB, [11C]mHED, [11C]PiB, [18F]FEPPA [18F]PEG-folate, [18F]fallypride |
| Et3N | 50.0 | 5000 | 89.3 | 3 | [11C]PiB, [18F]fallypride |
| DMF | 8.8 | 880 | 153.0 | 2 | [11C]MRB |
| DMSO | 50.0 | 5000 | 189.0 | 3 | [11C]ER-176 |
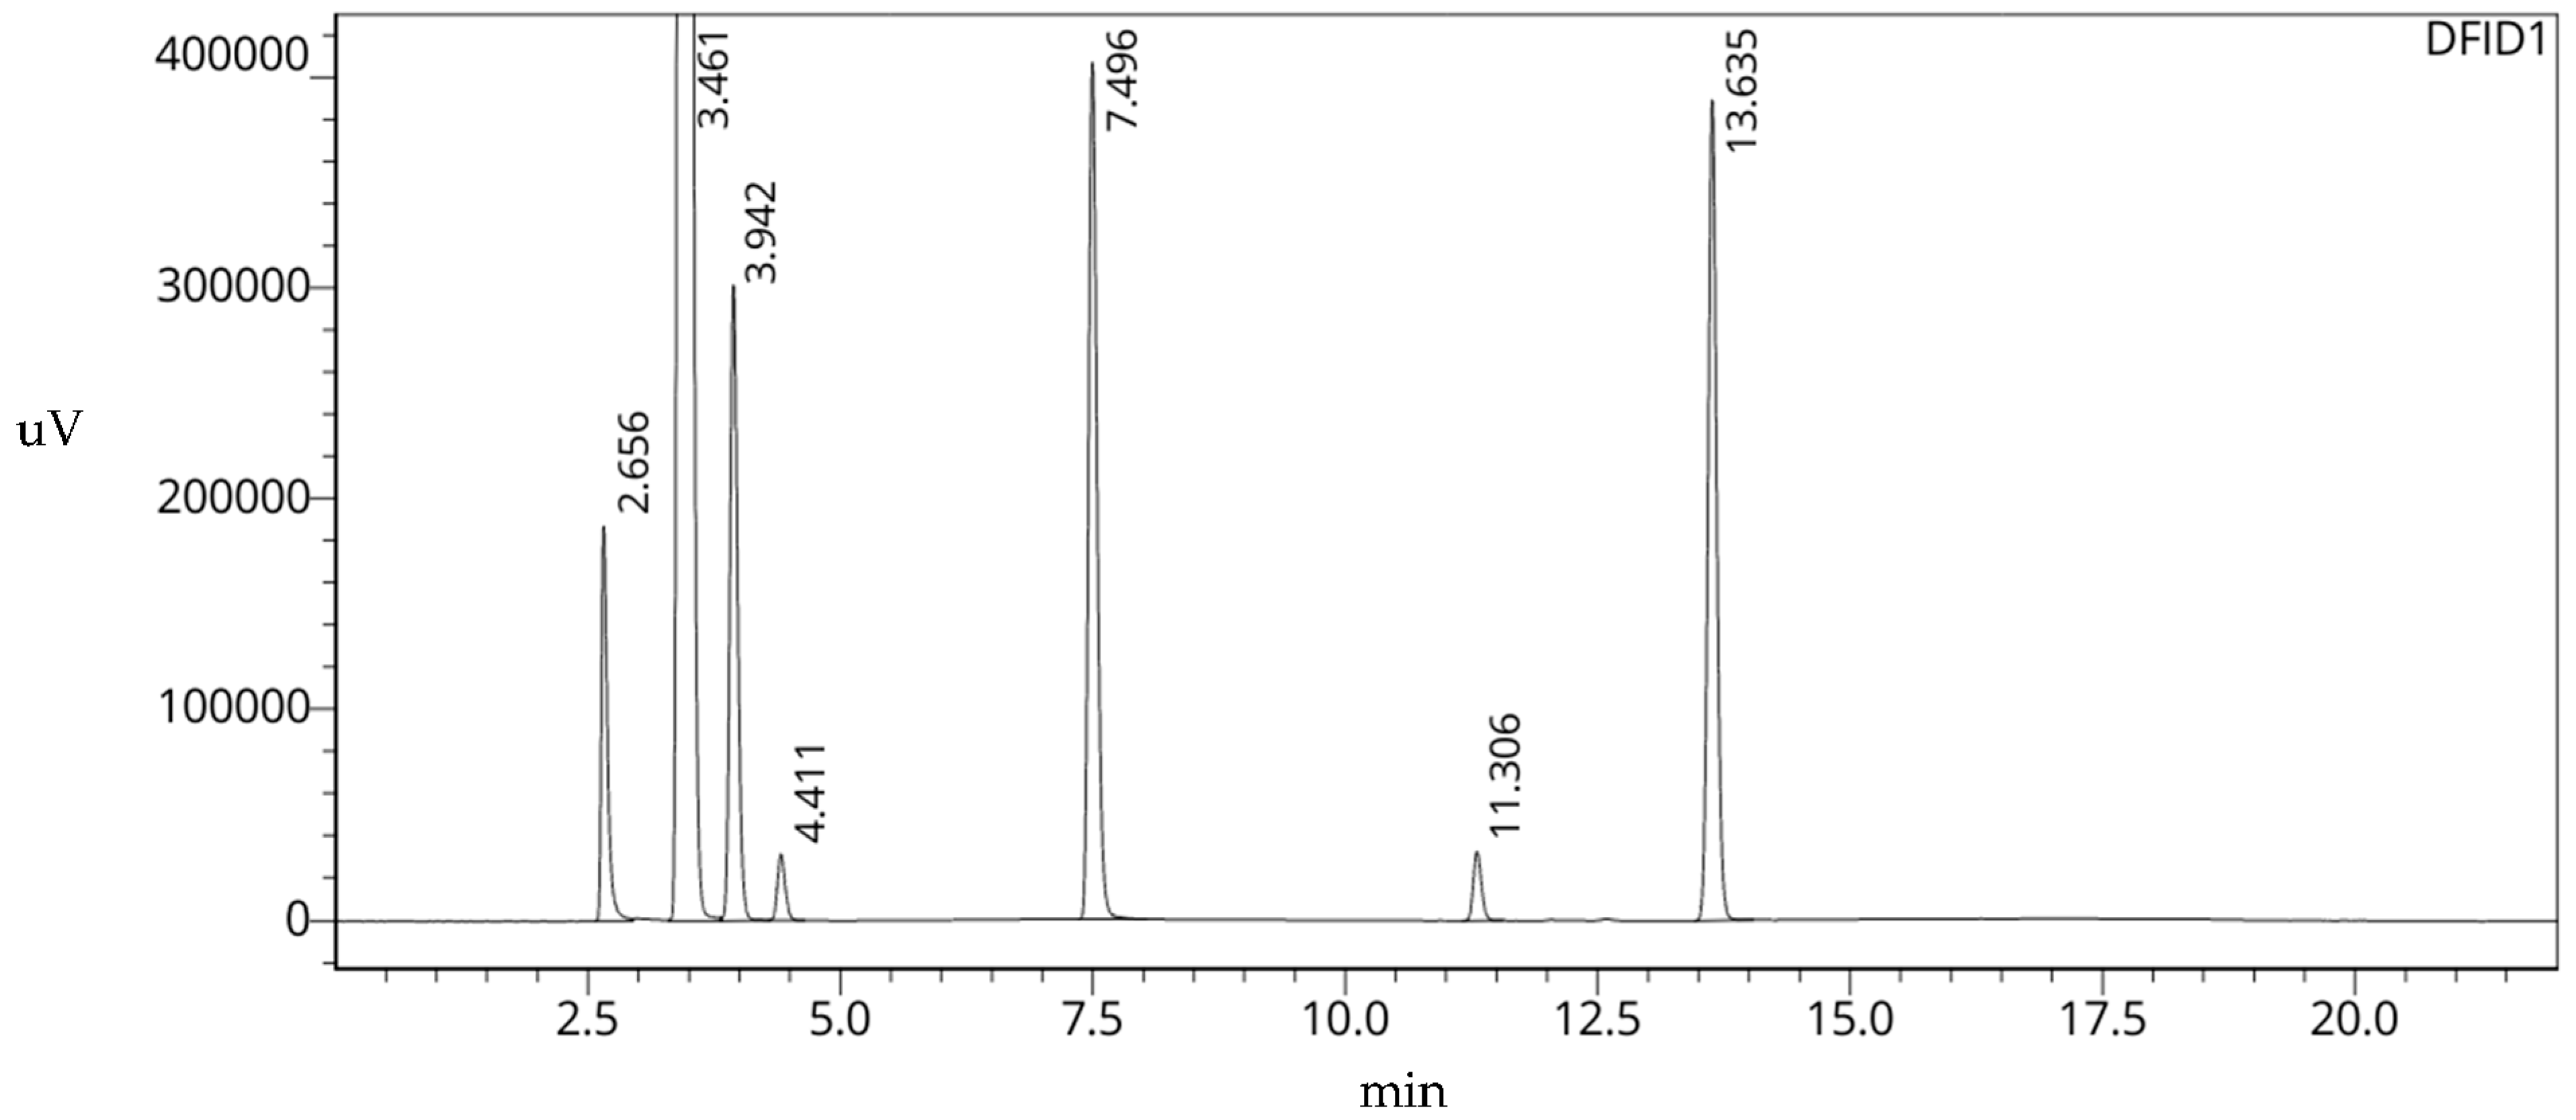
| Peak No. | Analyte | tR | Area Counts | No. of Theoretical Plates (USP) | Capacity Factor (k’) | Resolution (USP) |
|---|---|---|---|---|---|---|
| 1 | MeOH | 2.656 | 779,157 | 10,898 | -- | -- |
| 2 | EtOH | 3.461 | 38,475,947 | 11,352 | 0.303 | 6.942 |
| 3 | Acetone | 3.942 | 1,591,392 | 13,095 | 0.484 | 3.595 |
| 4 | MeCN | 4.411 | 162,192 | 16,464 | 0.661 | 3.412 |
| 5 | Et3N | 7.496 | 2,354,530 | 39,802 | 1.822 | 21.438 |
| 6 | DMF | 11.306 | 178,246 | 97,034 | 3.256 | 25.787 |
| 7 | DMSO | 13.635 | 2,284,000 | 125,475 | 4.133 | 15.567 |
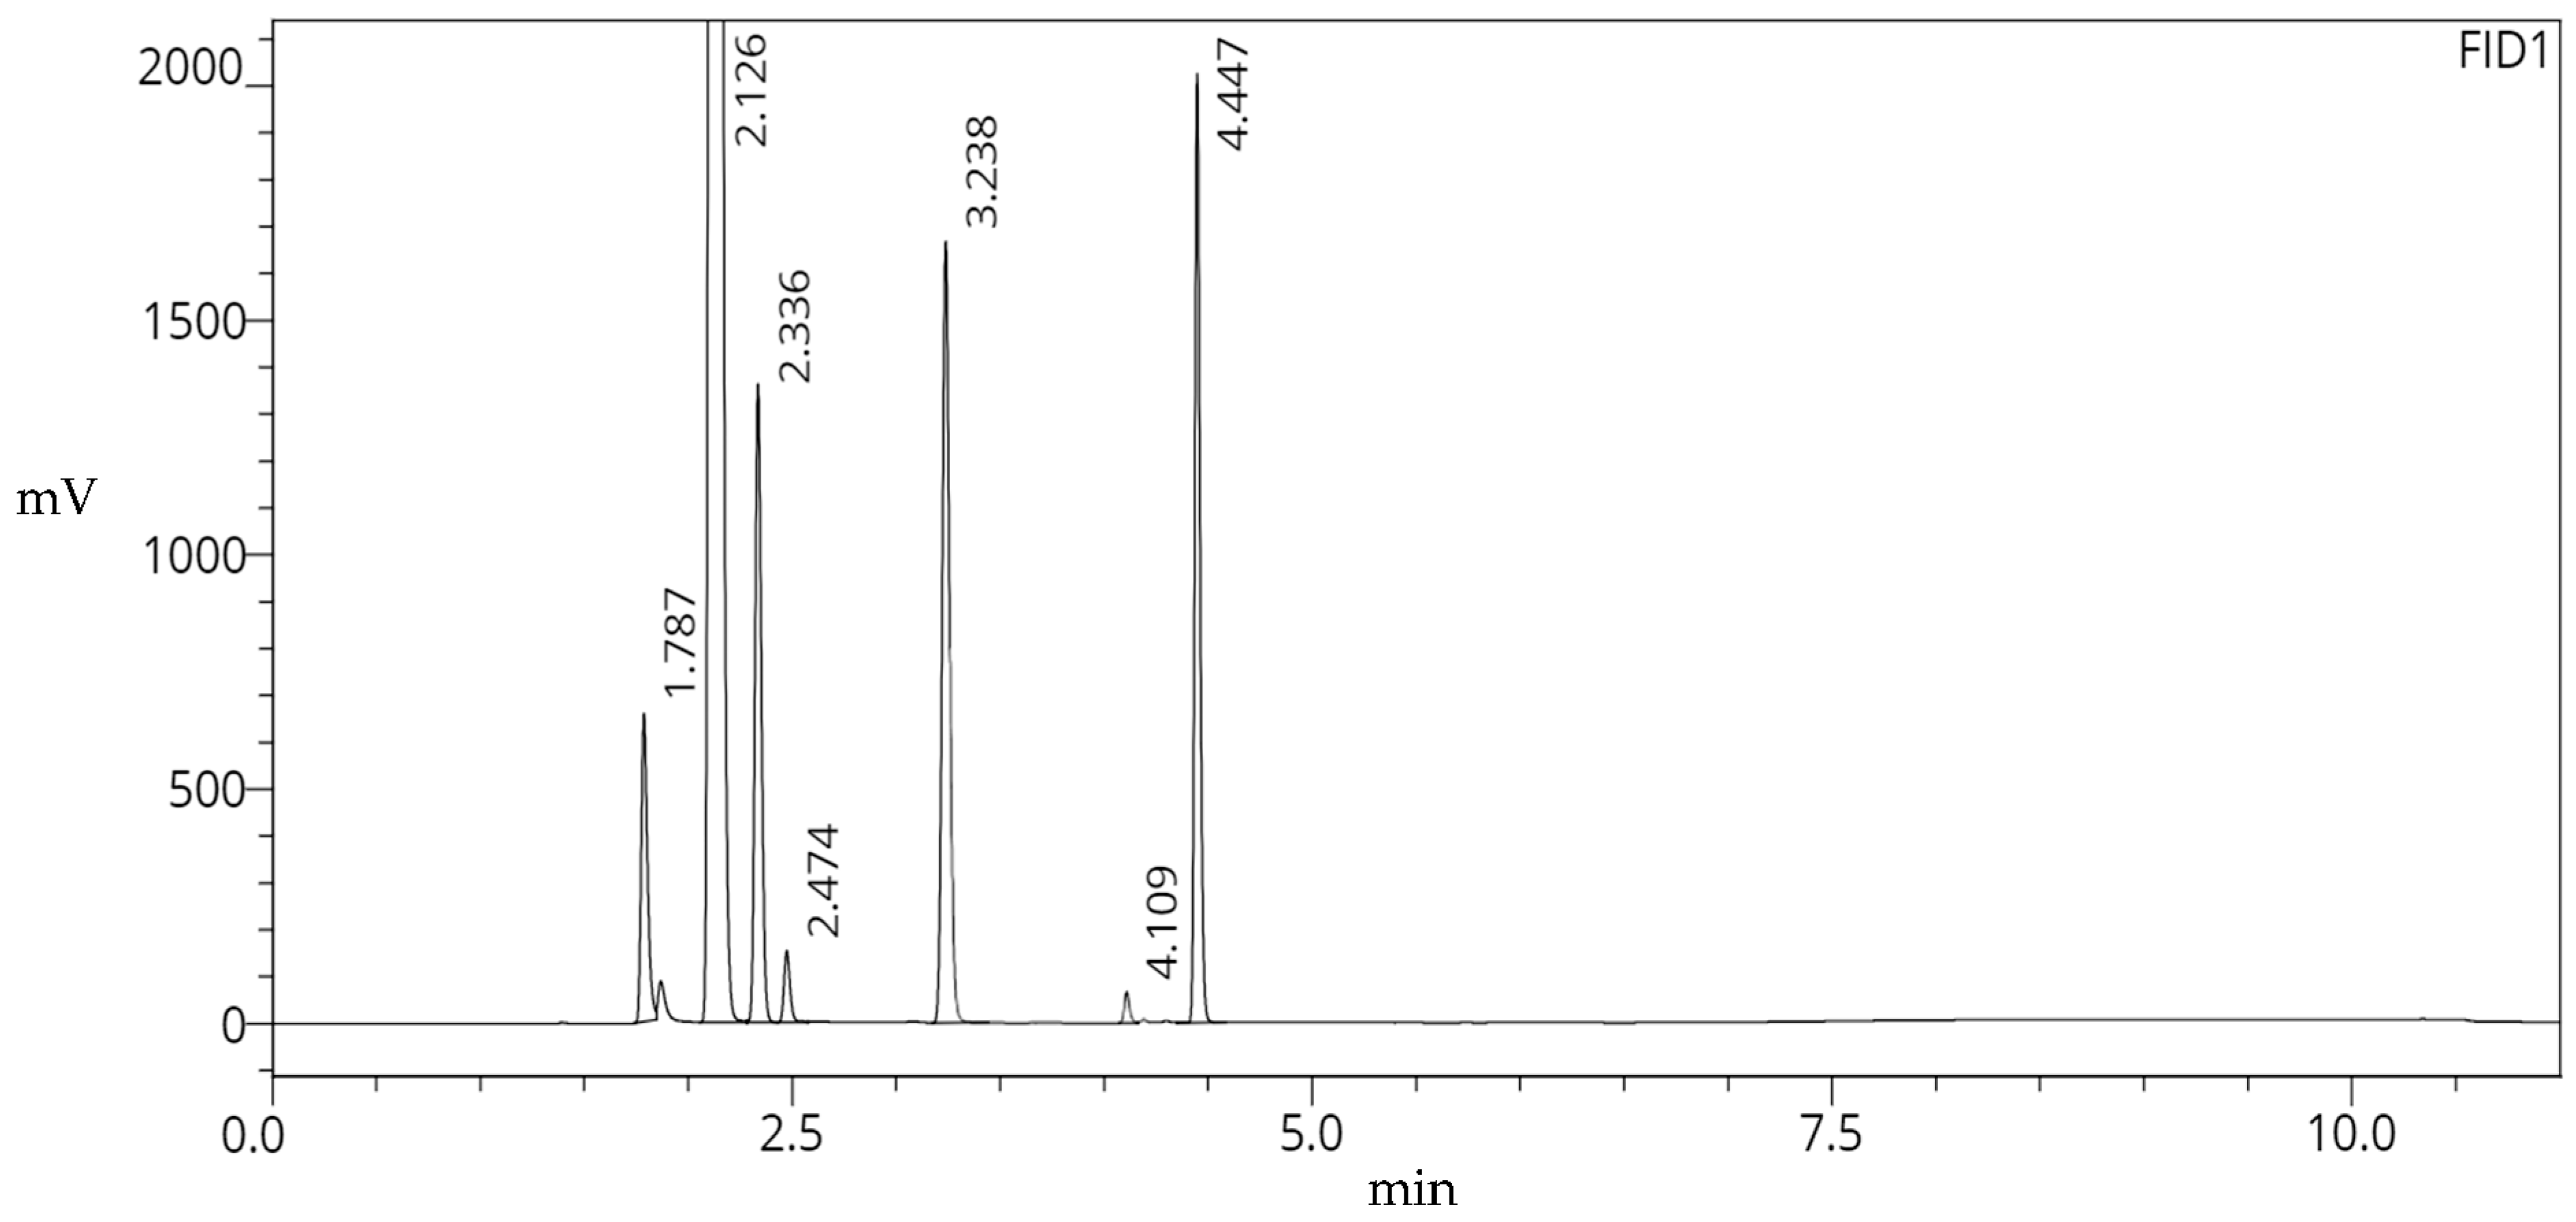
| Peak No. | Analyte | tR | Area Counts | No. of Theoretical Plates (USP) | Capacity Factor (k’) | Resolution (USP) |
|---|---|---|---|---|---|---|
| 1 | MeOH | 1.787 | 1,371,438 | 18,888 | -- | -- |
| 2 | EtOH | 2.126 | 74,289,866 | 18,323 | 0.190 | 5.915 |
| 3 | Acetone | 2.336 | 3,143,945 | 28,063 | 0.302 | 3.390 |
| 4 | MeCN | 2.474 | 356,109 | 37,694 | 0.378 | 2.554 |
| 5 | Et3N | 3.238 | 4,537,634 | 45,124 | 0.798 | 13.490 |
| 6 | DMF | 4.109 | 348,842 | 138,302 | 1.291 | 16.843 |
| 7 | DMSO | 4.447 | 3,502,774 | 150,775 | 1.486 | 7.749 |
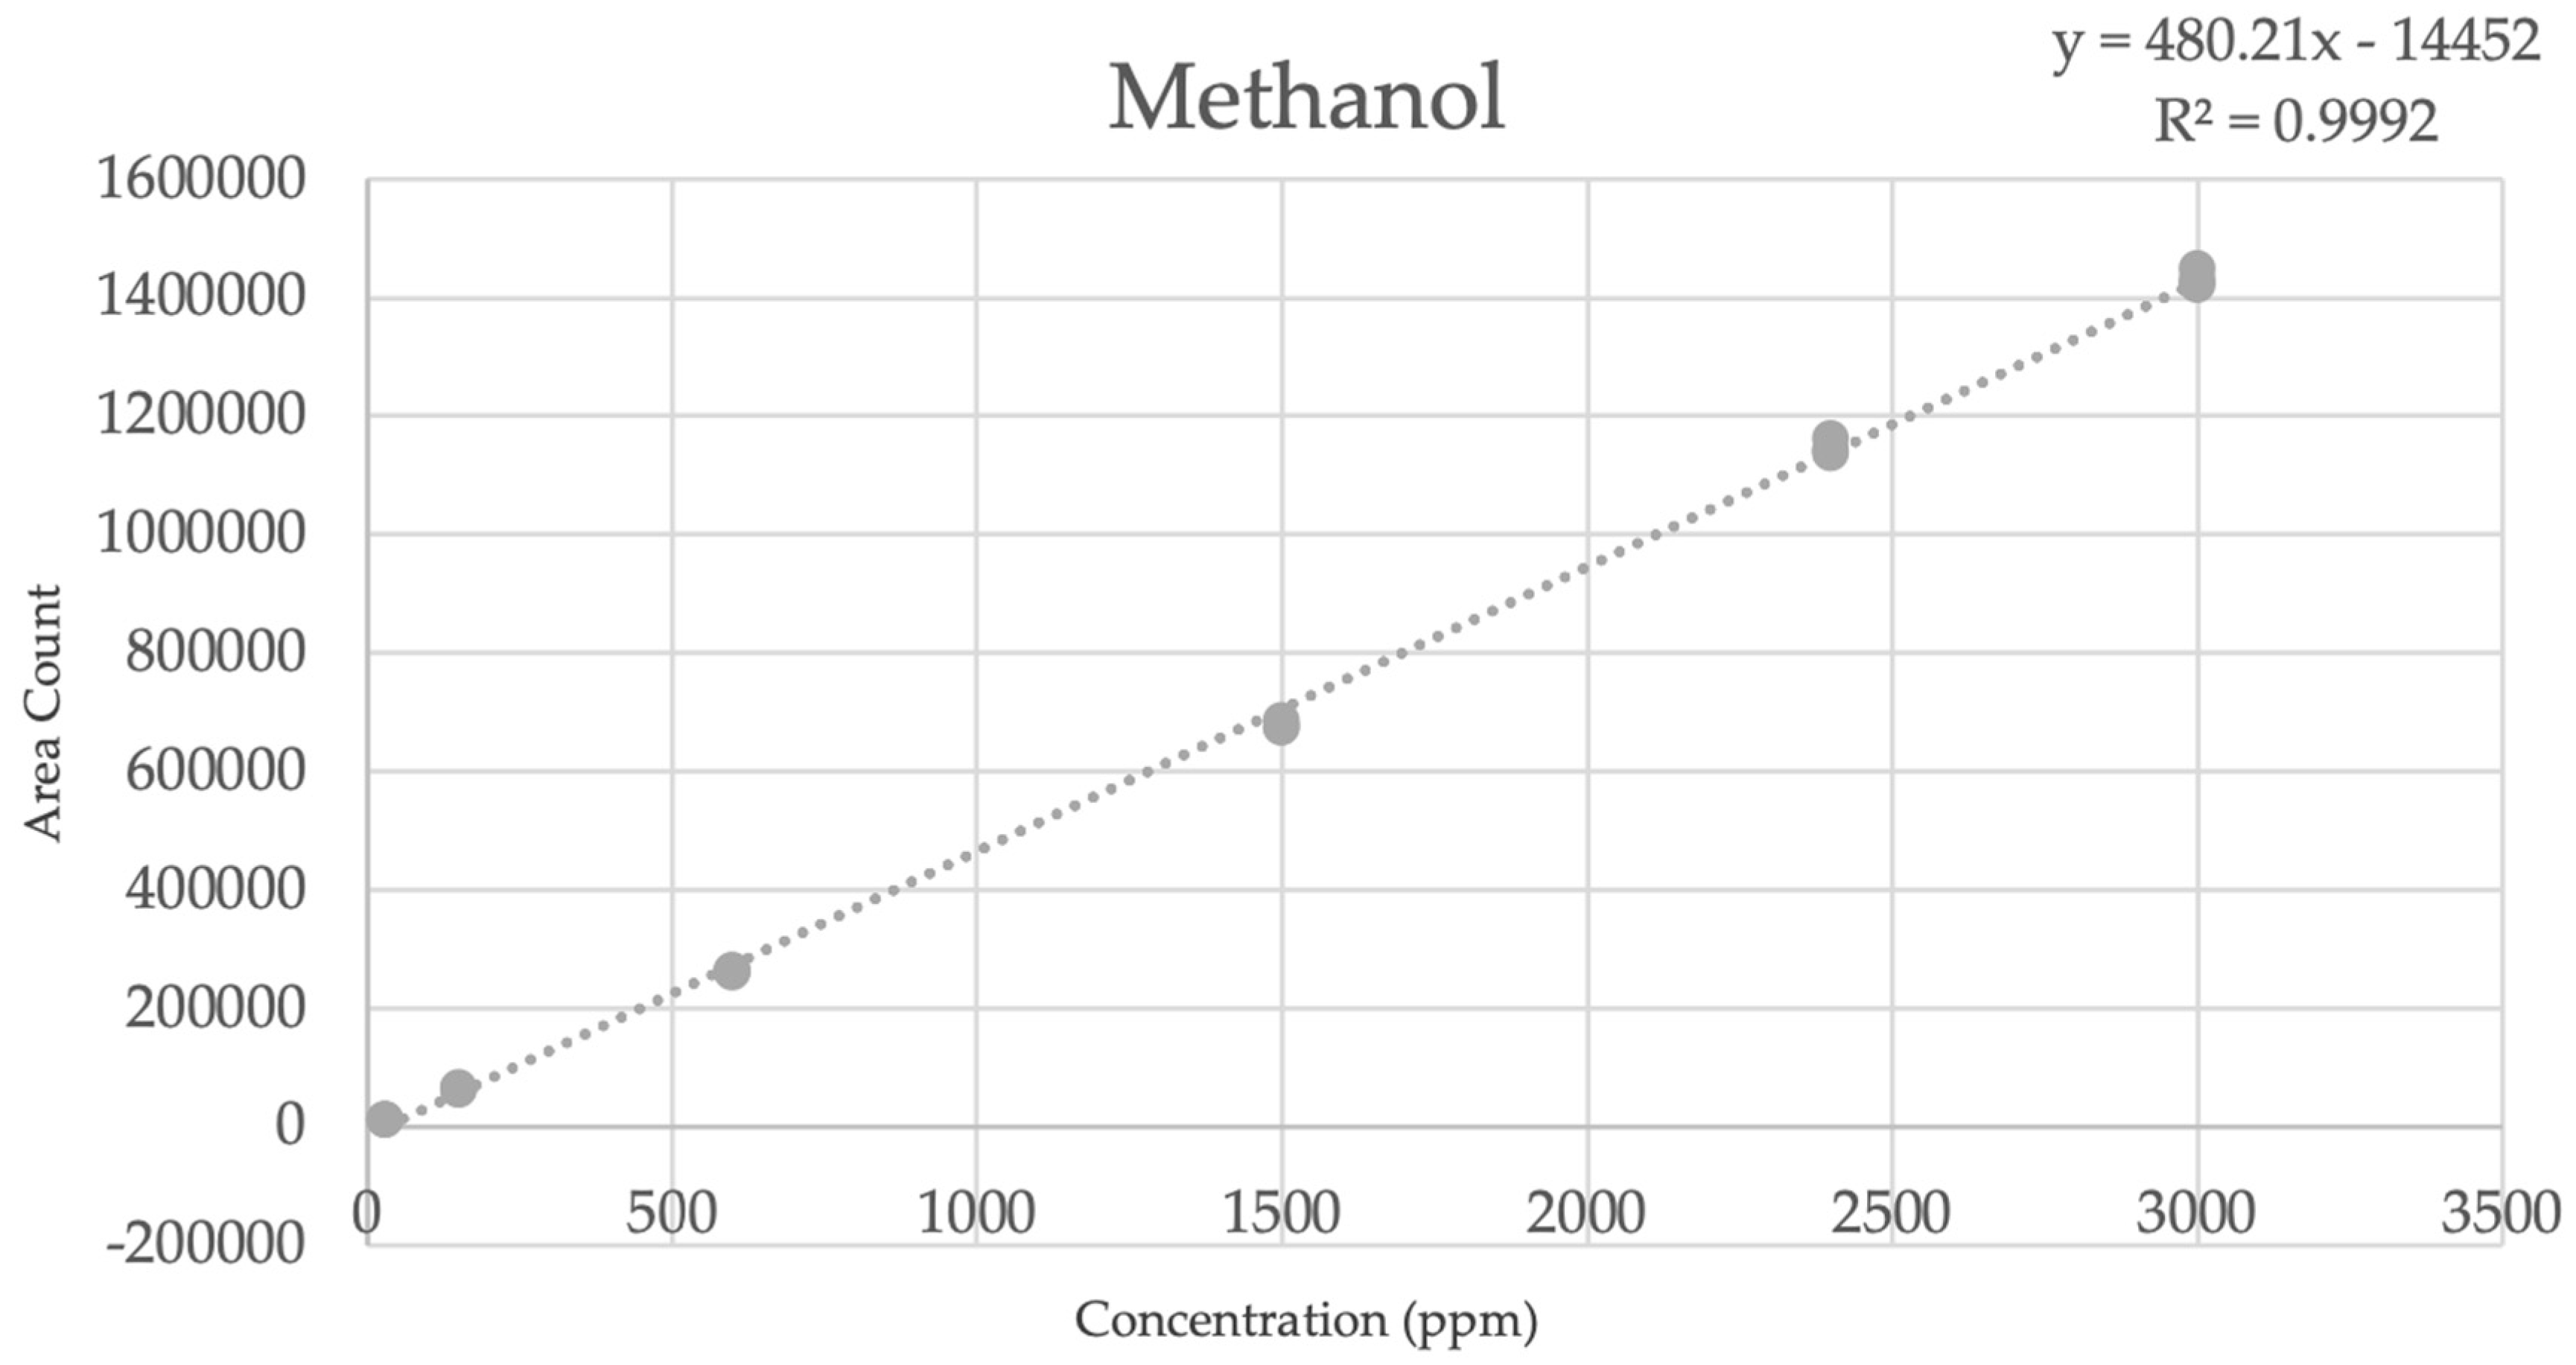
| Level | ppm | Area Count | Average Area | %RSD | tR |
|---|---|---|---|---|---|
| 1 | 30 30 30 | 12,924 12,935 13,012 | 12,957 | 0.37 | 1.841 1.841 1.841 |
| 2 | 150 150 150 | 65,946 63,773 65,116 | 64,945 | 1.69 | 1.840 1.841 1.841 |
| 3 | 600 600 600 | 264,117 263,127 262,302 | 263,182 | 0.35 | 1.841 1.841 1.841 |
| 4 | 1500 1500 1500 | 676,487 685,536 675,753 | 679,259 | 0.80 | 1.842 1.842 1.842 |
| 5 | 2400 2400 2400 | 1,136,693 1,143,912 1,160,962 | 1,147,189 | 1.09 | 1.843 1.843 1.843 |
| 6 | 3000 3000 3000 | 1,448,227 1,422,393 1,430,712 | 1,433,777 | 0.92 | 1.843 1.844 1.843 |
| Analyte | LOD | LOQ |
|---|---|---|
| MeOH | 0.053 | 0.094 |
| EtOH | 0.056 | 5.791 × 10⁻⁶ |
| Acetone | 0.067 | 0.088 |
| MeCN | 0.163 | 0.156 |
| Et3N | 0.080 | 0.081 |
| DMF | 0.117 | 0.520 |
| DMSO | 0.110 | 0.137 |
Disclaimer/Publisher’s Note: The statements, opinions and data contained in all publications are solely those of the individual author(s) and contributor(s) and not of MDPI and/or the editor(s). MDPI and/or the editor(s) disclaim responsibility for any injury to people or property resulting from any ideas, methods, instructions or products referred to in the content. |
© 2023 by the authors. Licensee MDPI, Basel, Switzerland. This article is an open access article distributed under the terms and conditions of the Creative Commons Attribution (CC BY) license (https://creativecommons.org/licenses/by/4.0/).
Share and Cite
A’Keen, C.V.; Mroz, J.; Joseph, S.K.; Baquero, J.; Cantorias, M.V.; Carberry, P. OMNI: Gas Chromatograph Captures Seven Common PET Radiotracer Analytes in under 5 Minutes. Pharmaceuticals 2023, 16, 1623. https://doi.org/10.3390/ph16111623
A’Keen CV, Mroz J, Joseph SK, Baquero J, Cantorias MV, Carberry P. OMNI: Gas Chromatograph Captures Seven Common PET Radiotracer Analytes in under 5 Minutes. Pharmaceuticals. 2023; 16(11):1623. https://doi.org/10.3390/ph16111623
Chicago/Turabian StyleA’Keen, Camry Vonyae’, Jakub Mroz, Simon Kunta Joseph, Jairo Baquero, Melchor V. Cantorias, and Patrick Carberry. 2023. "OMNI: Gas Chromatograph Captures Seven Common PET Radiotracer Analytes in under 5 Minutes" Pharmaceuticals 16, no. 11: 1623. https://doi.org/10.3390/ph16111623
APA StyleA’Keen, C. V., Mroz, J., Joseph, S. K., Baquero, J., Cantorias, M. V., & Carberry, P. (2023). OMNI: Gas Chromatograph Captures Seven Common PET Radiotracer Analytes in under 5 Minutes. Pharmaceuticals, 16(11), 1623. https://doi.org/10.3390/ph16111623