Synthesis and Biological Evaluation of Some New 3-Aryl-2-thioxo-2,3-dihydroquinazolin-4(1H)-ones and 3-Aryl-2-(benzylthio)quinazolin-4(3H)-ones as Antioxidants; COX-2, LDHA, α-Glucosidase and α-Amylase Inhibitors; and Anti-Colon Carcinoma and Apoptosis-Inducing Agents


 , , ,
, , , 
Abstract
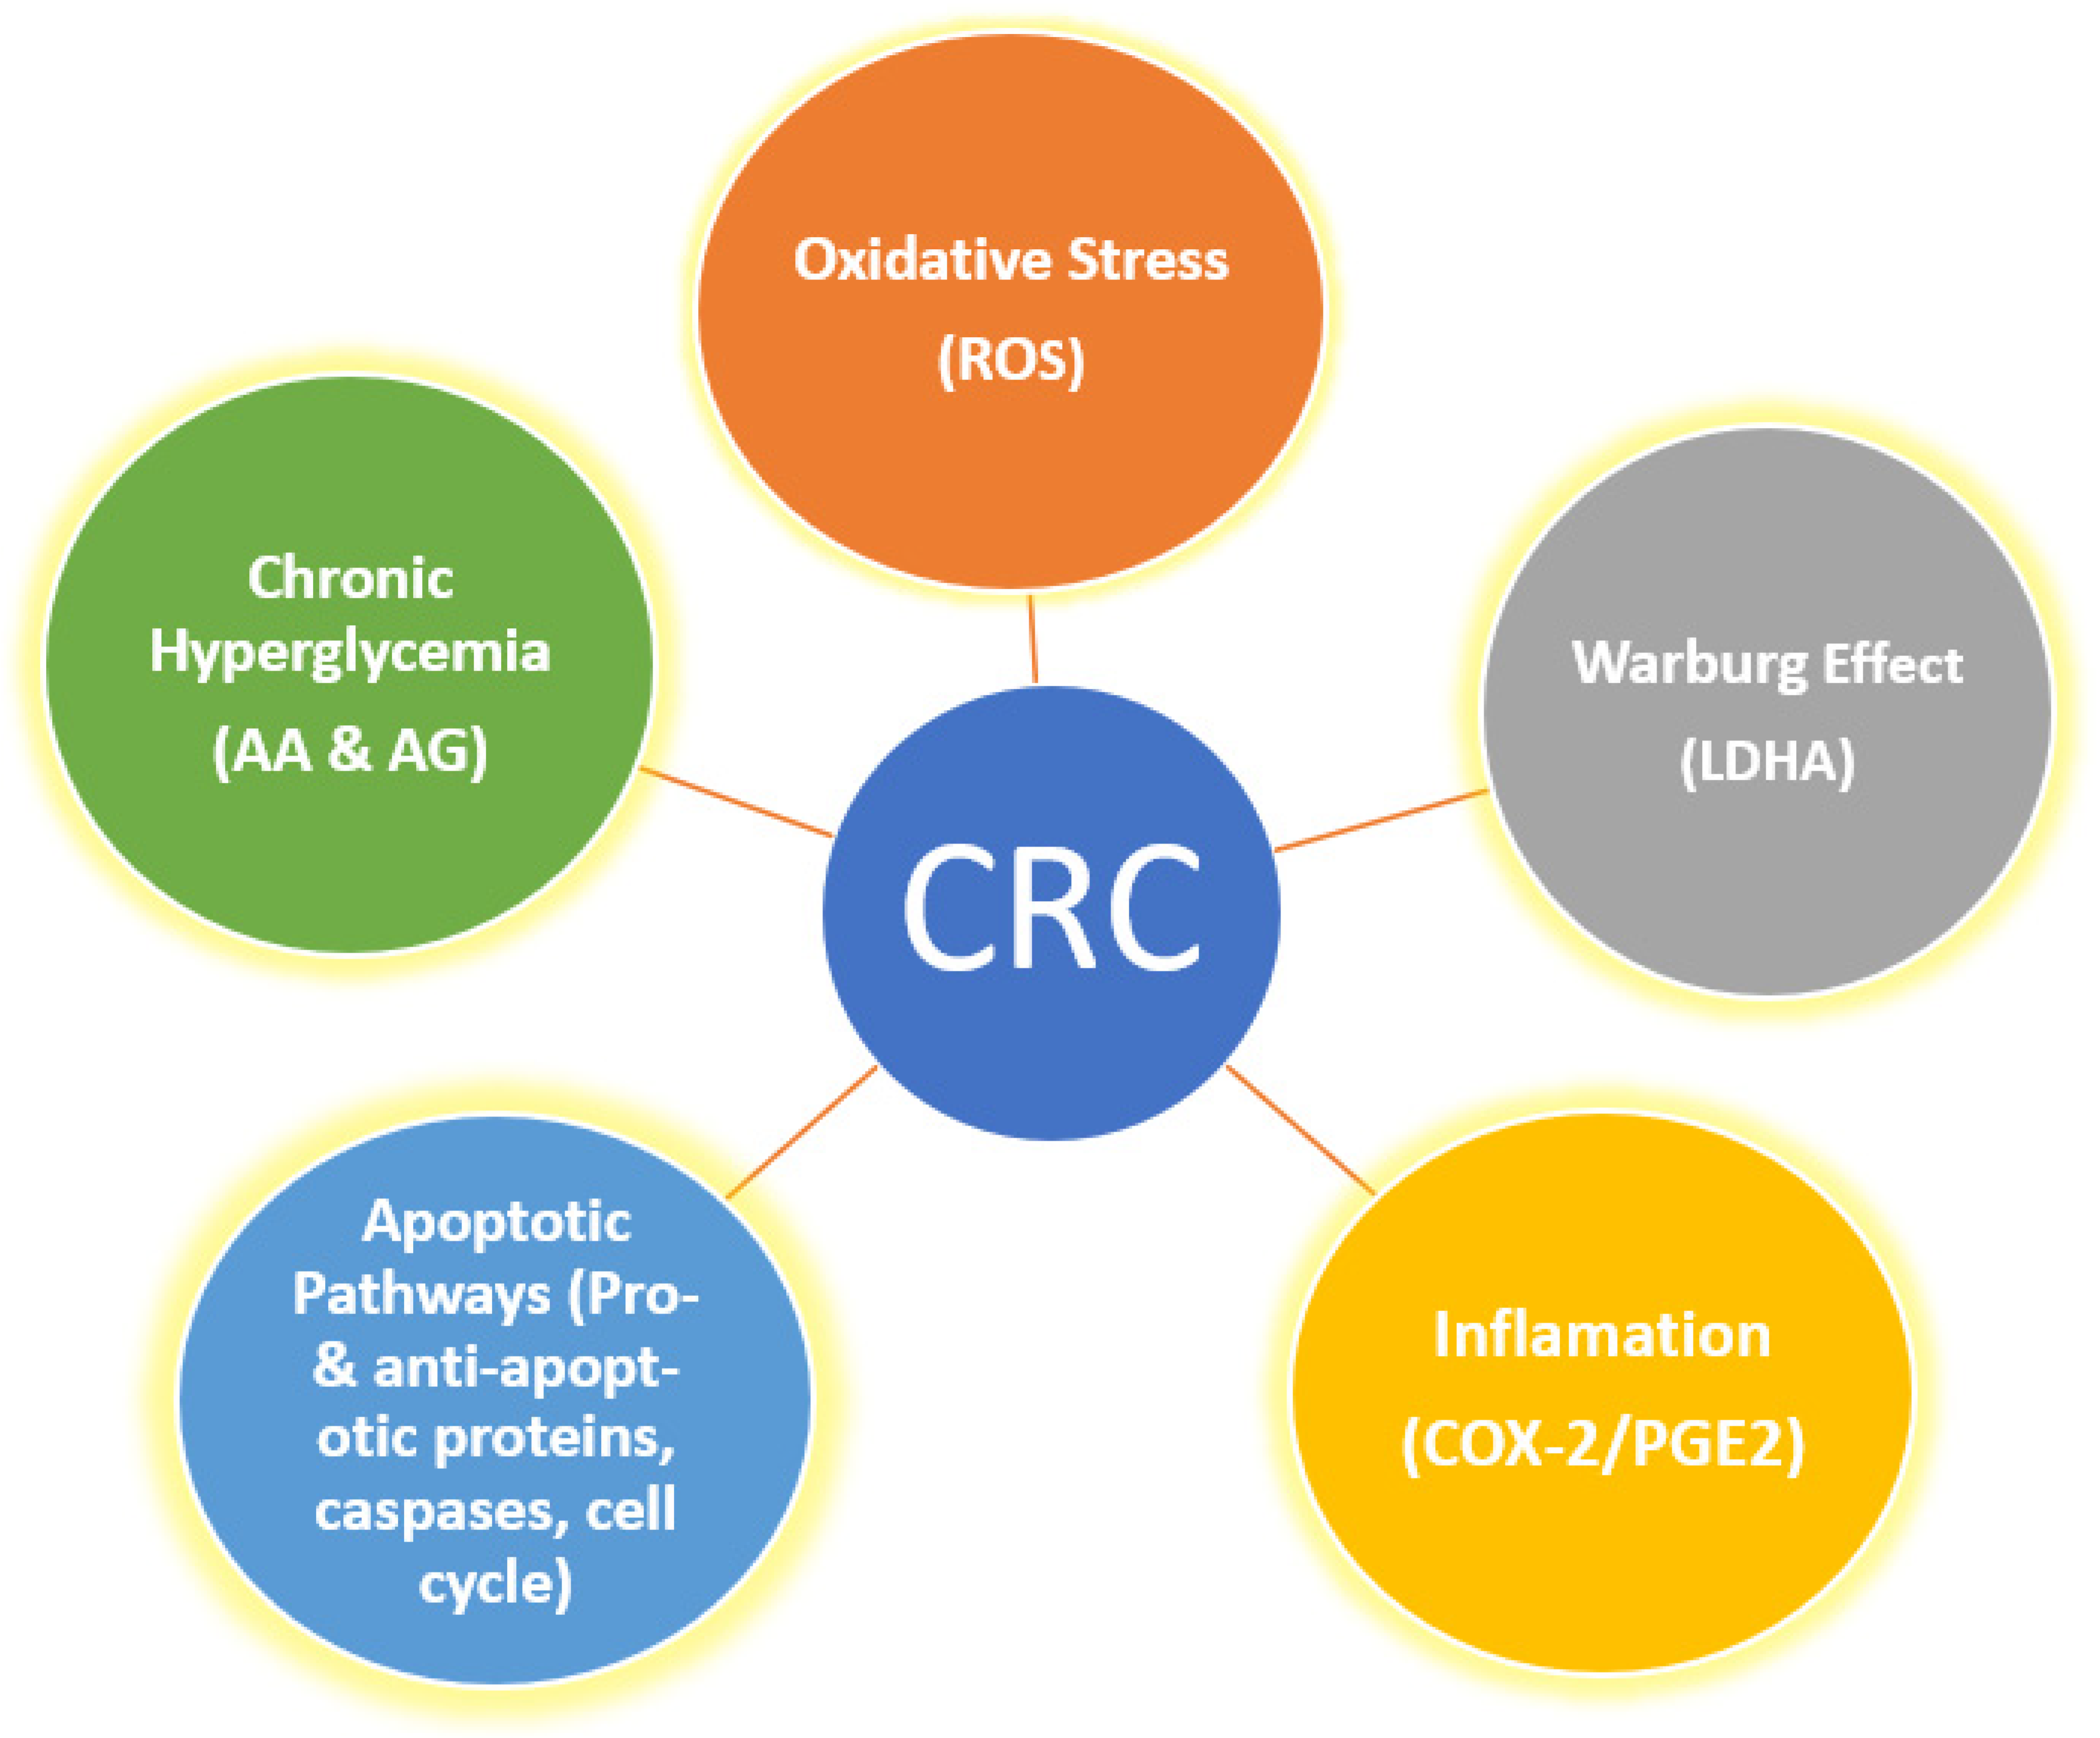
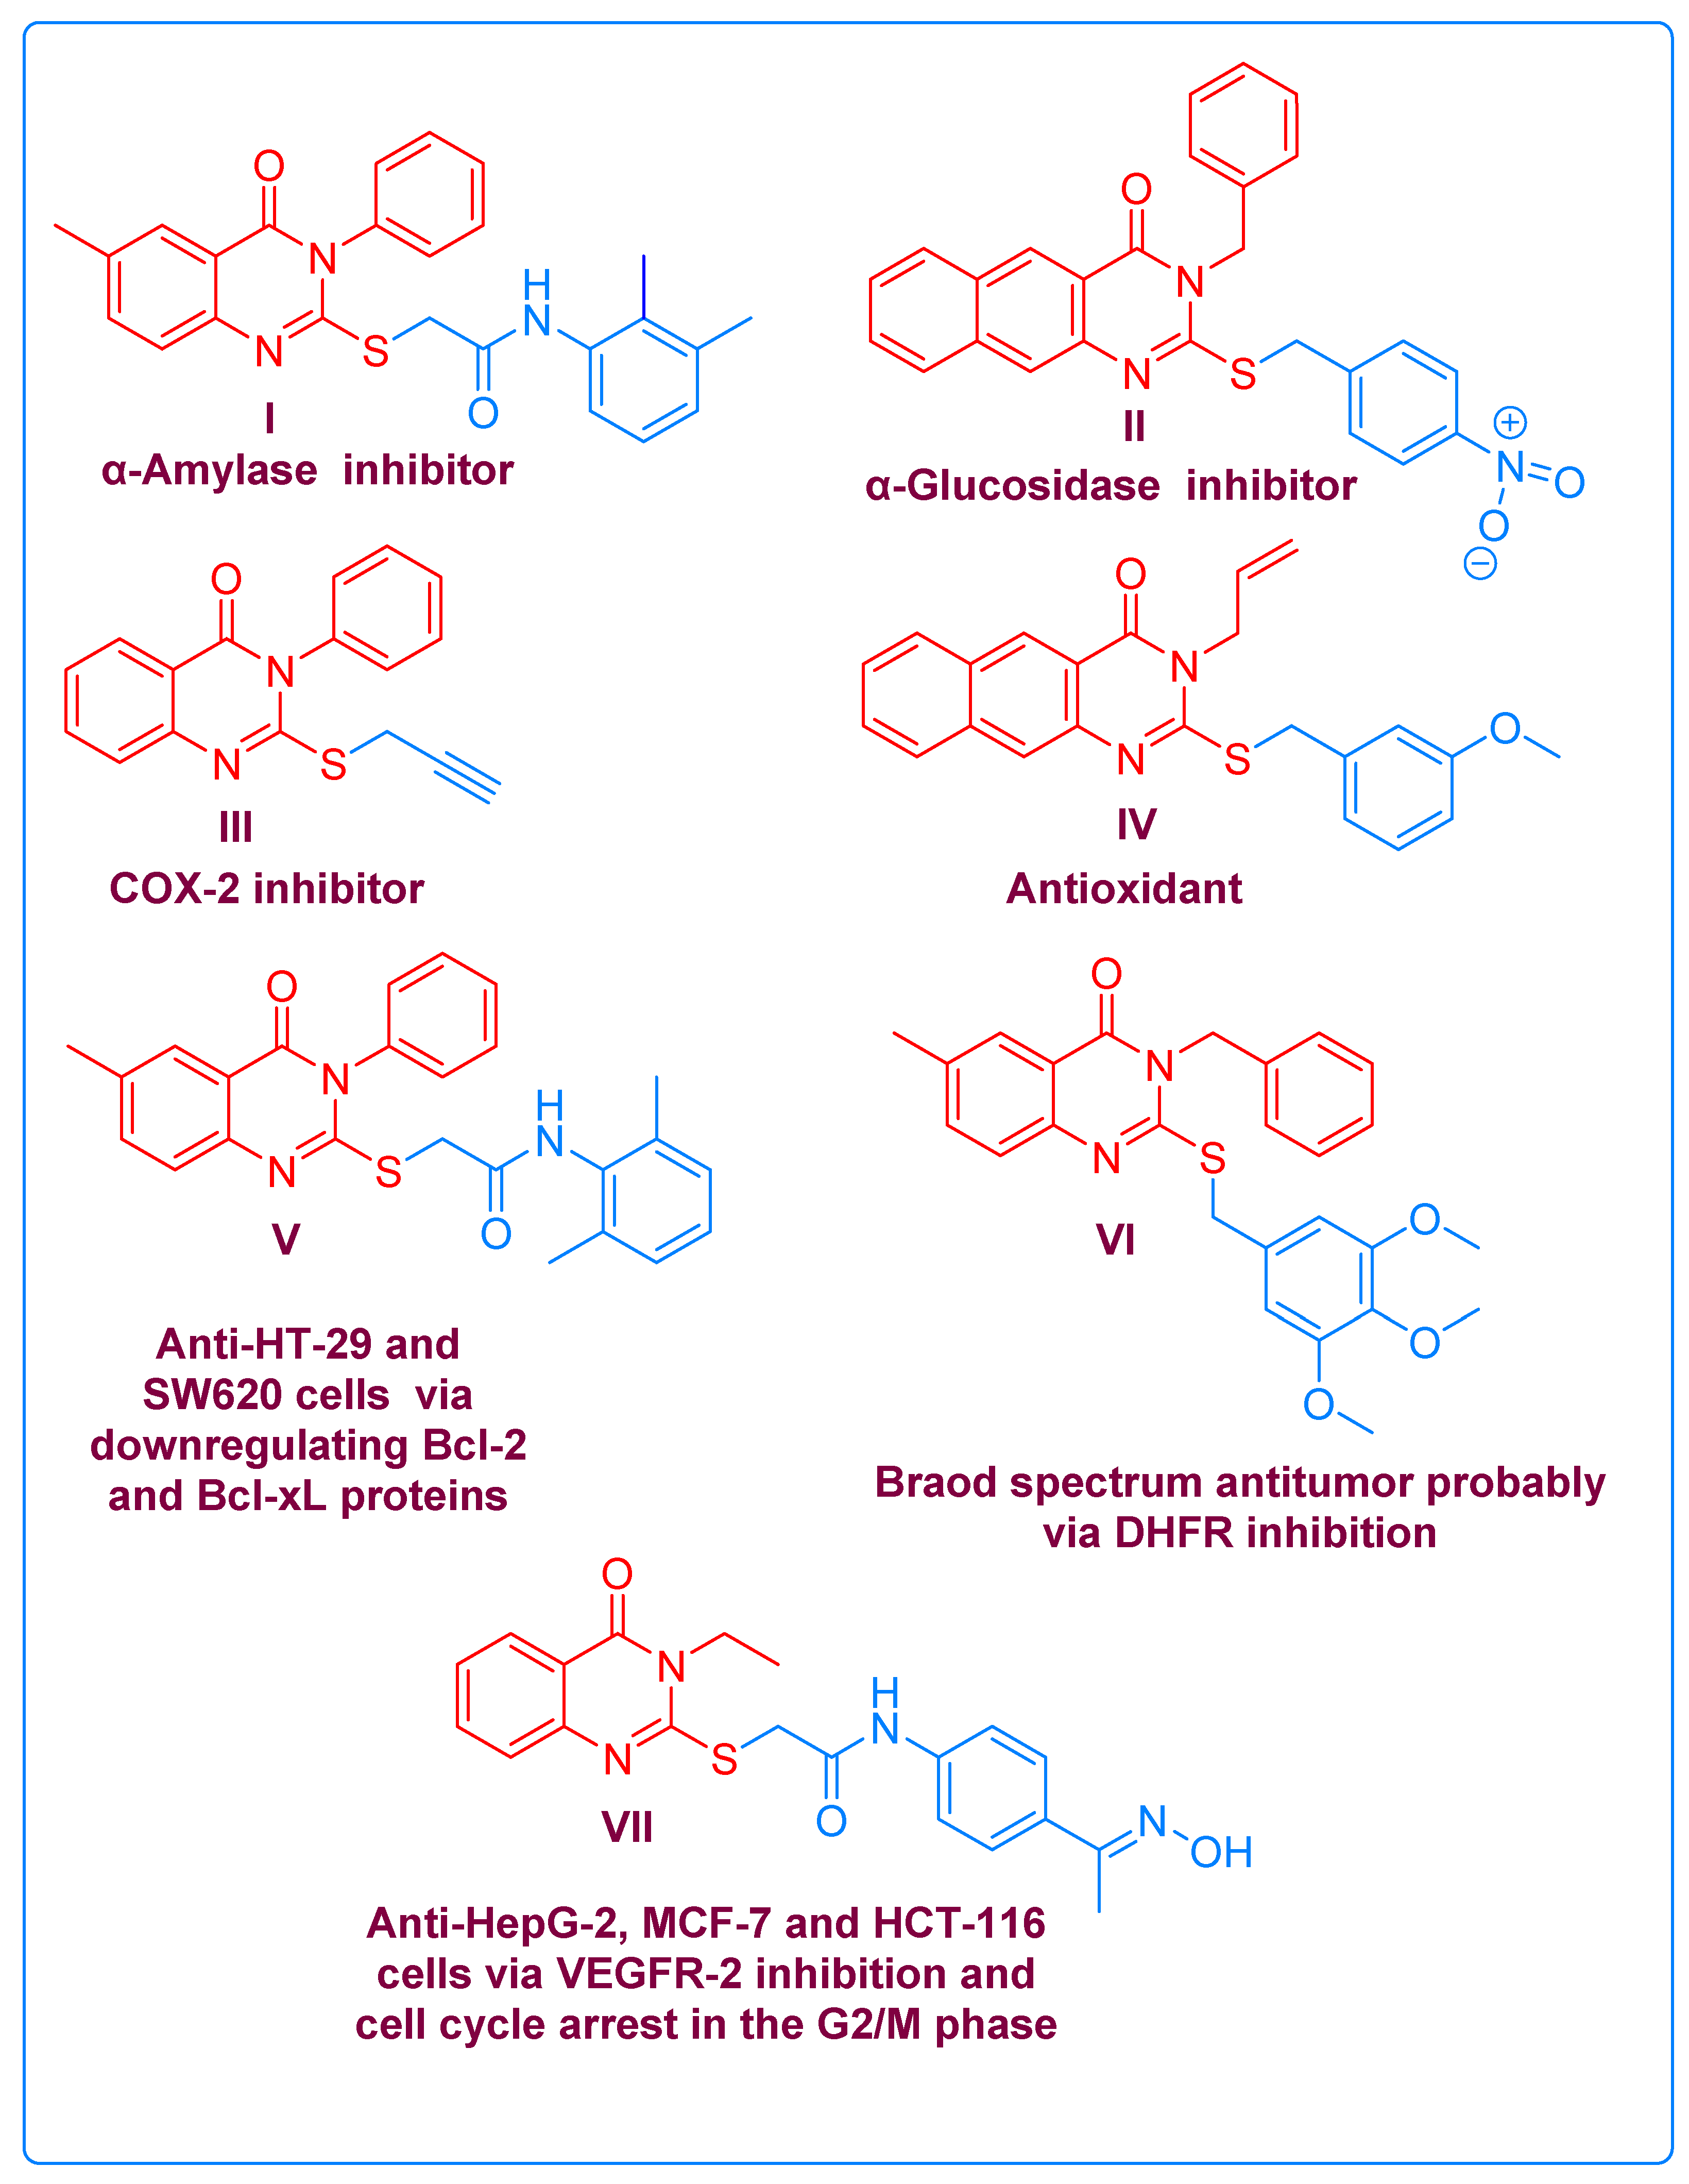
1. Introduction
2. Results and Discussion
2.1. Chemistry
2.2. Biological Evaluation
2.2.1. Antioxidant Evaluation via 2,2-Diphenyl-1-picryl-hydrazyl-hydrate (DPPH) Assay
2.2.2. In Vitro Enzyme Inhibition Assays
Cyclooxygenase-2 (COX-2) Assay
Lactate Dehydrogenase A (LDHA) Assay
Alpha-Glucosidase (AG) and Alpha-Amylase (AA) Assays
2.2.3. Cytotoxic Activity
2.2.4. Investigation of the Apoptosis-Inducing Properties as a Potential Molecular Basis for the Observed Cytotoxicity for Derivatives 3a and 3f
Effects of 3a and 3f on the Expressional Levels of Bcl-2 and Bax, Regulators of the Intrinsic Pathway
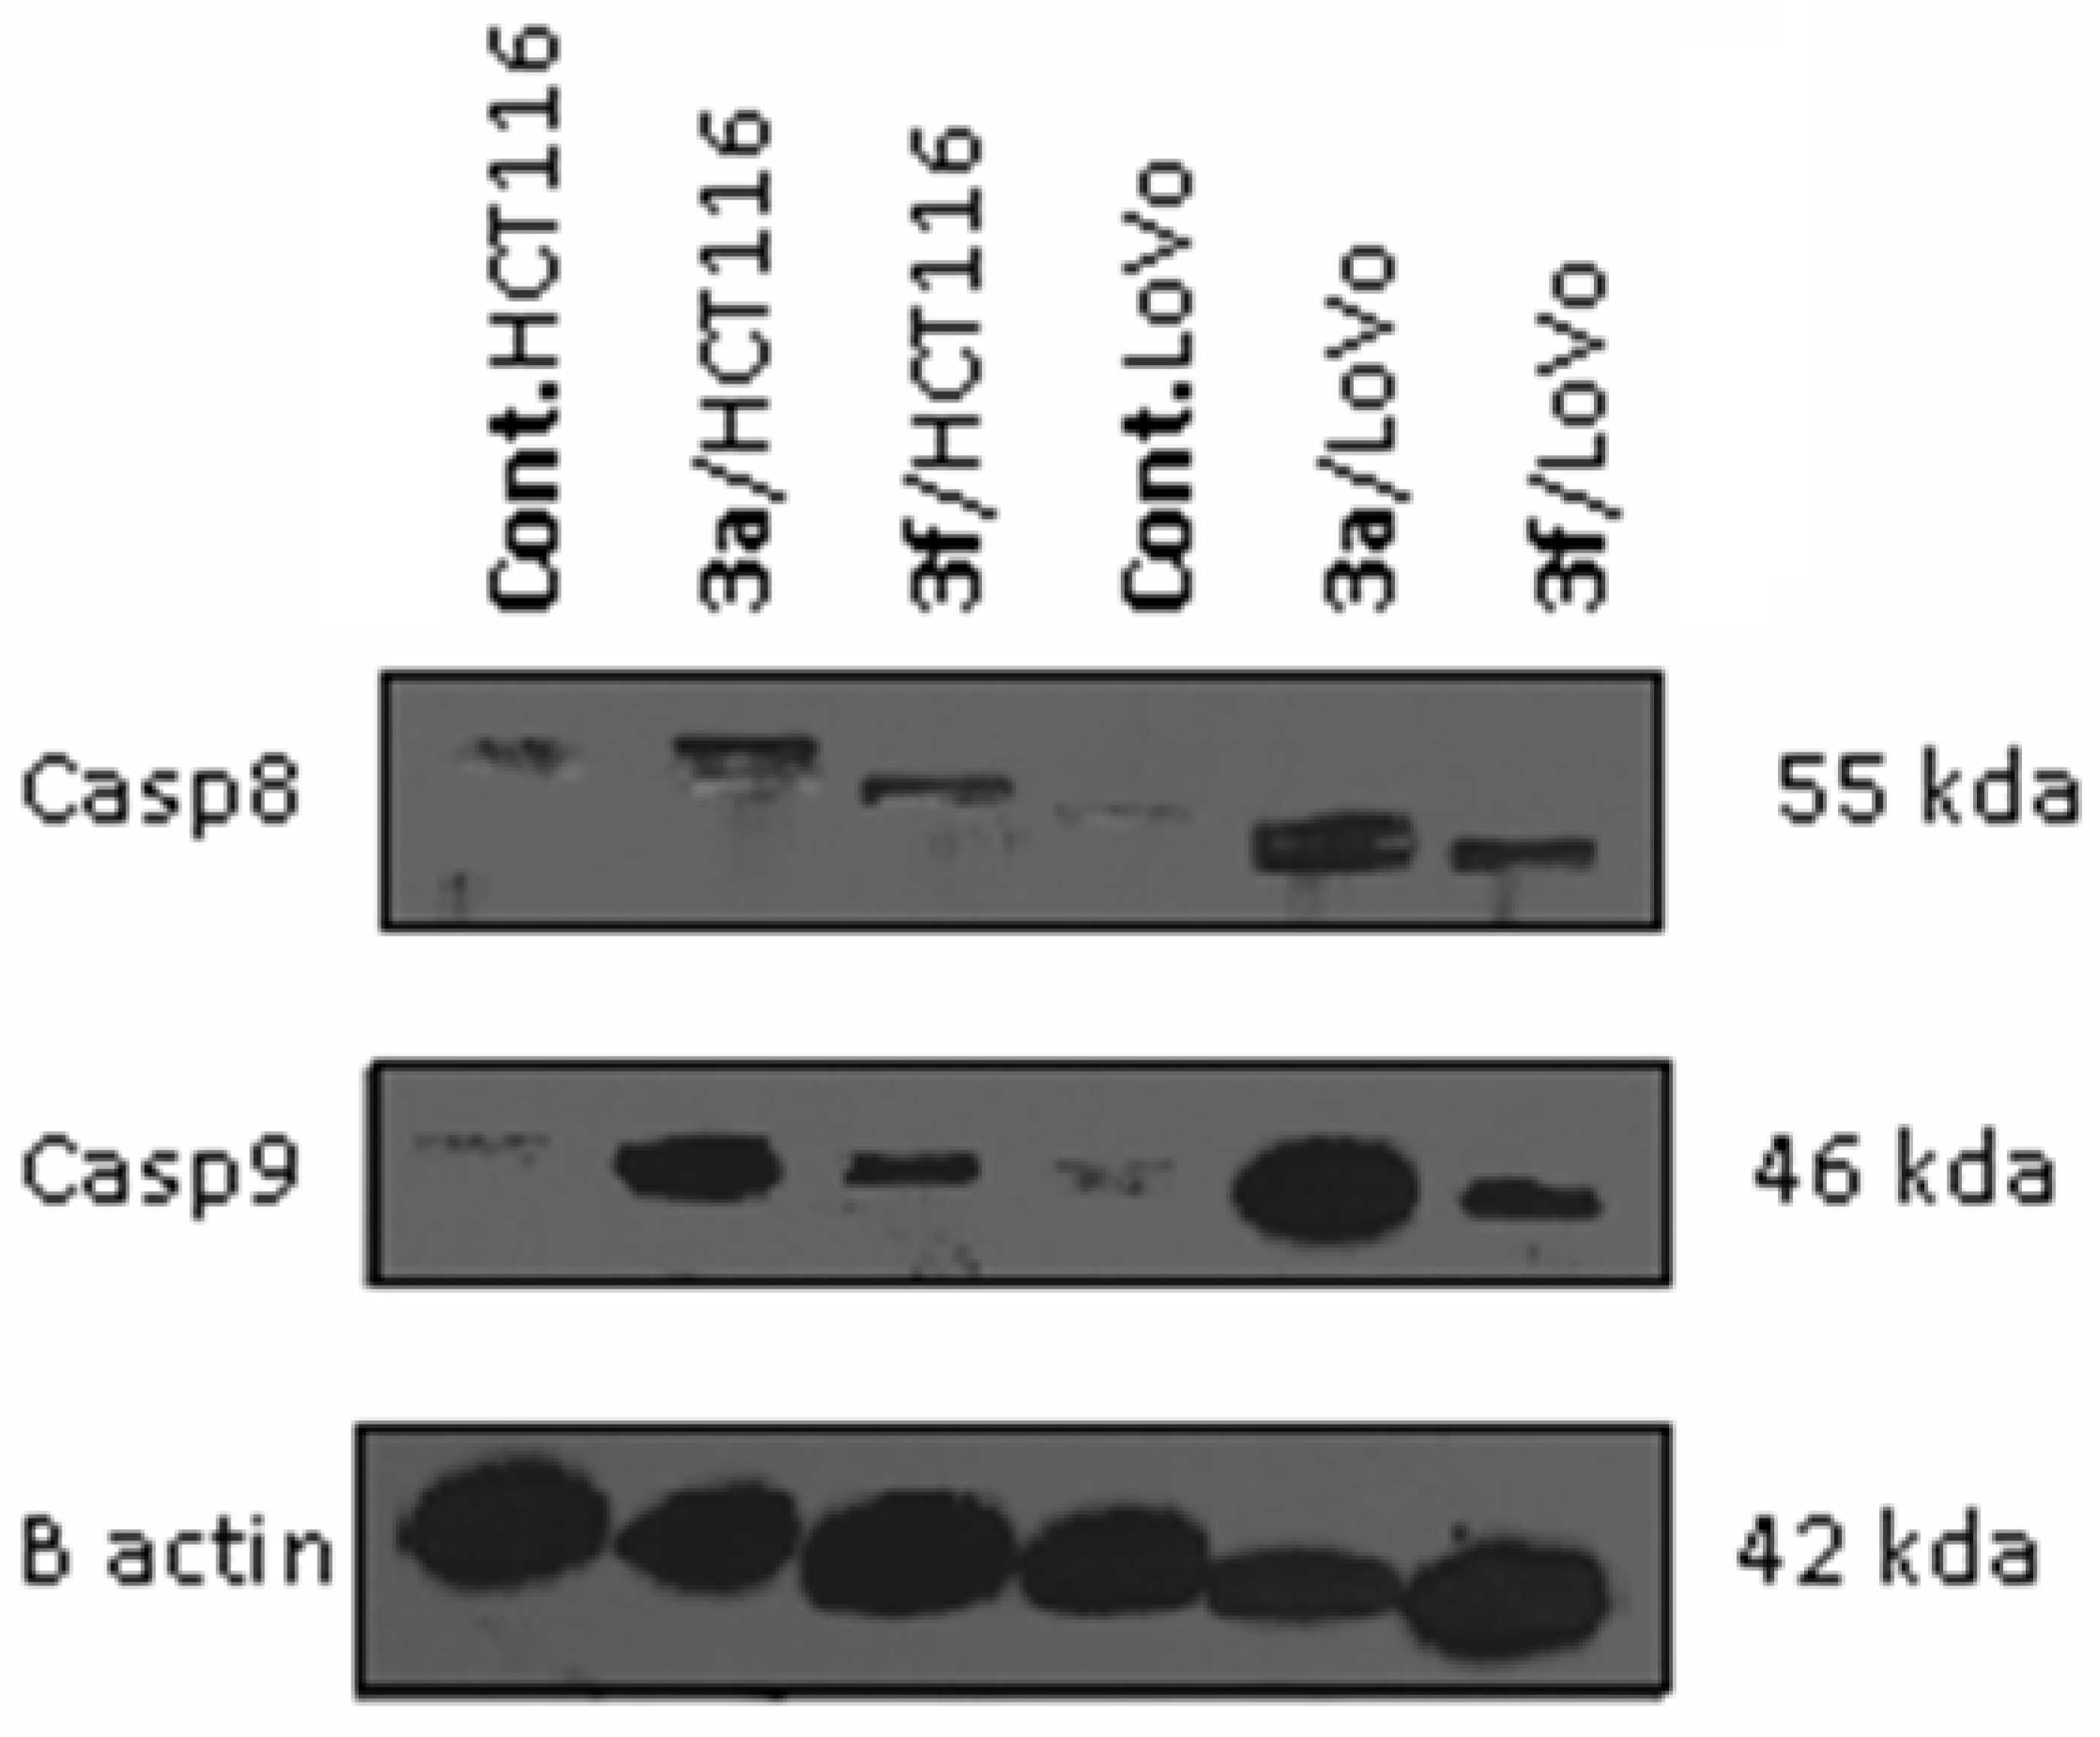
Caspases Activation Induced by Derivatives 3a and 3f
Annexin-V Externalization Induced by Compounds 3a and 3f
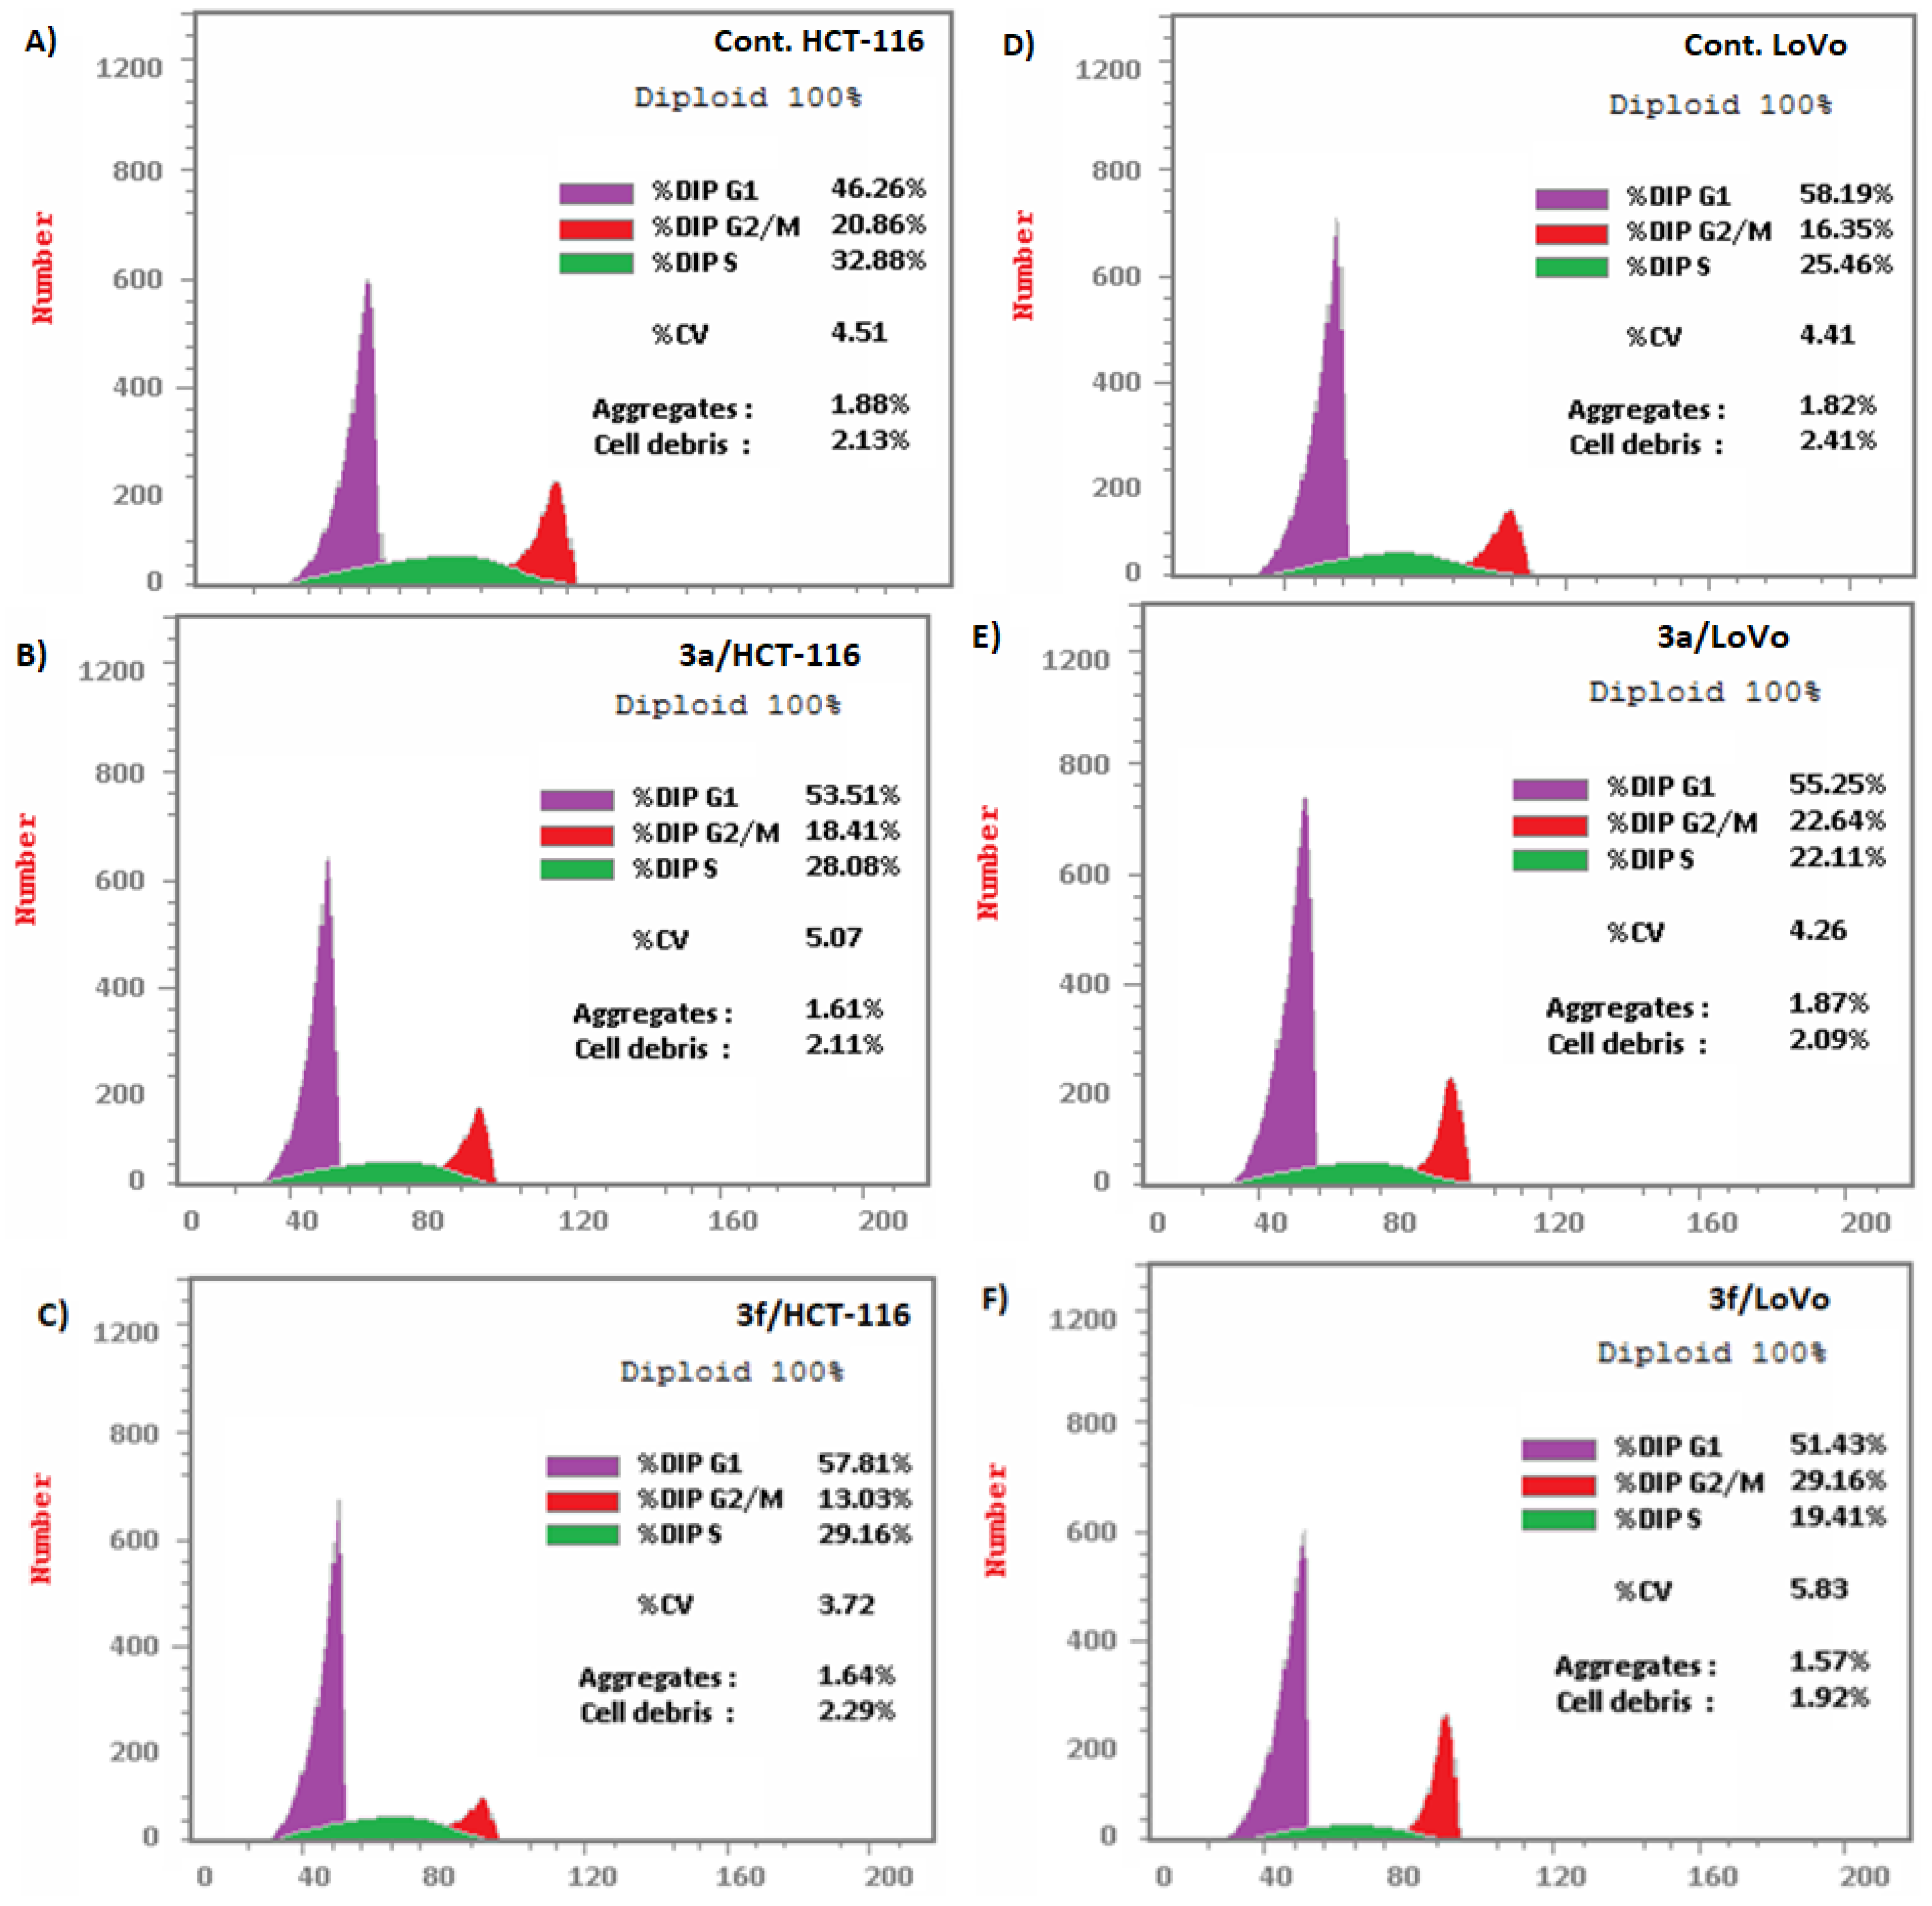
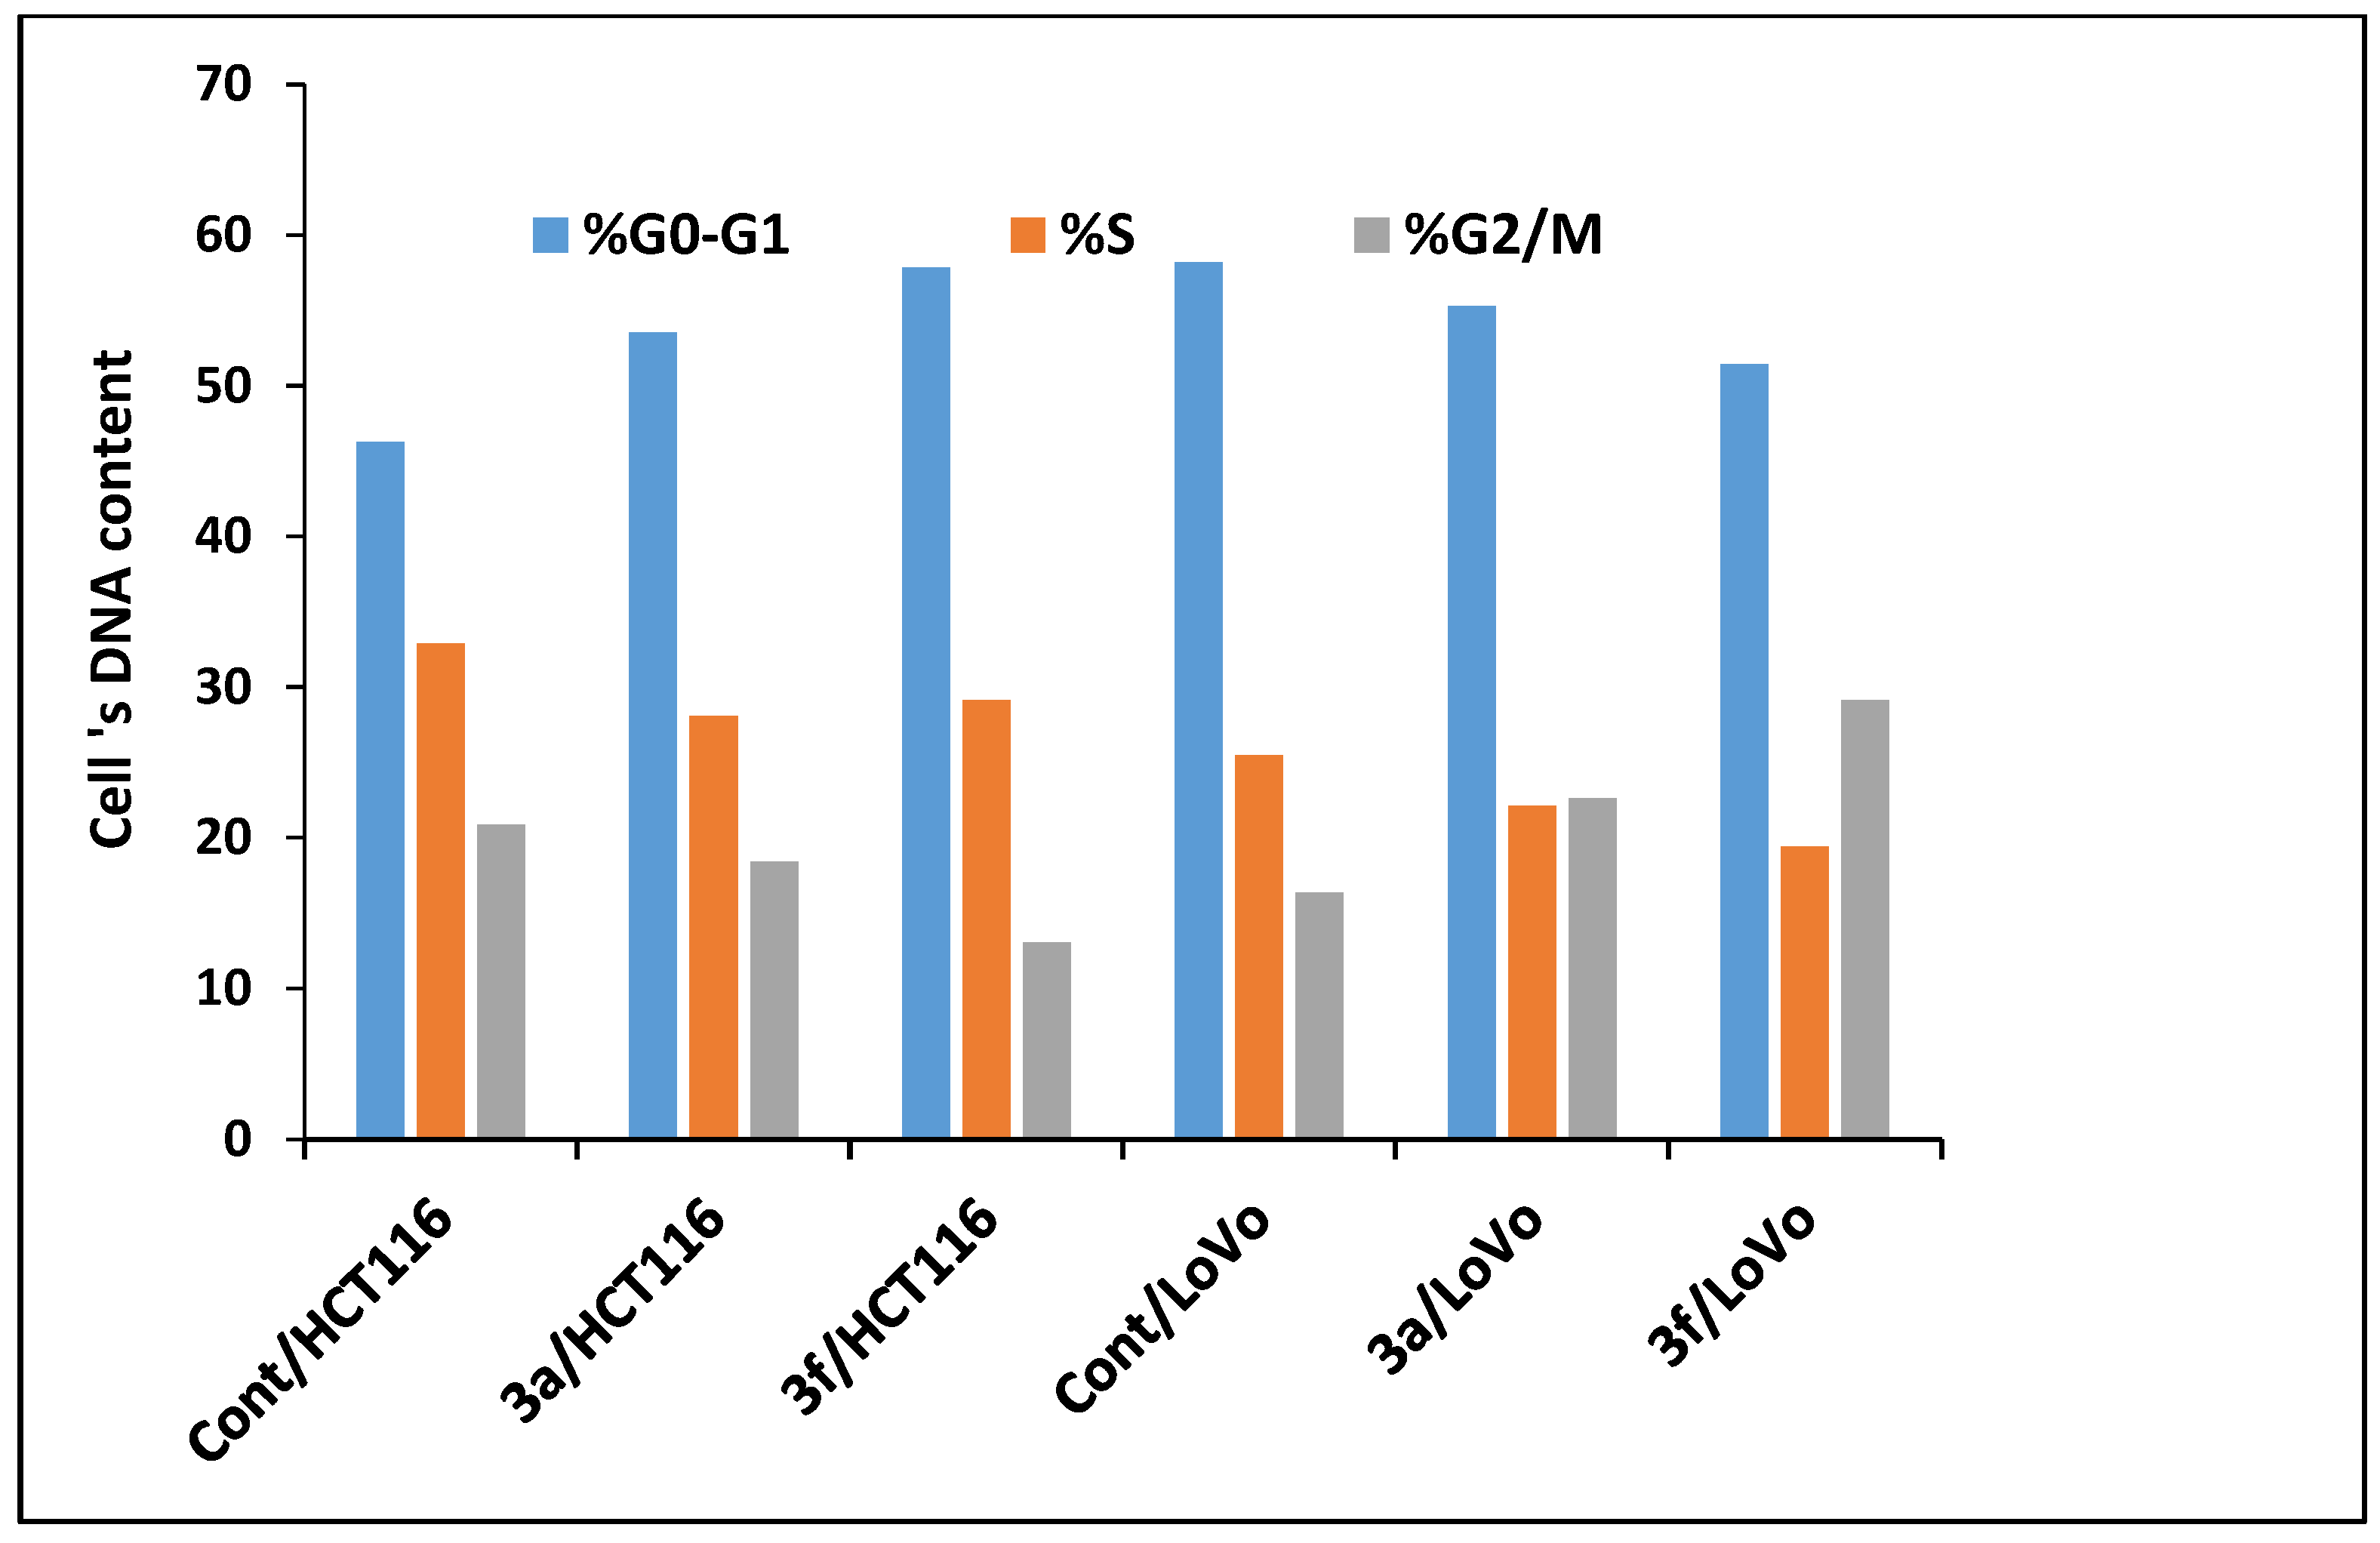
Compounds 3a and 3f Induced Apoptosis in HCT-116 and LoVo Carcinoma Cells Associated with Cell Cycle Arrest
2.3. Molecular Docking Simulations
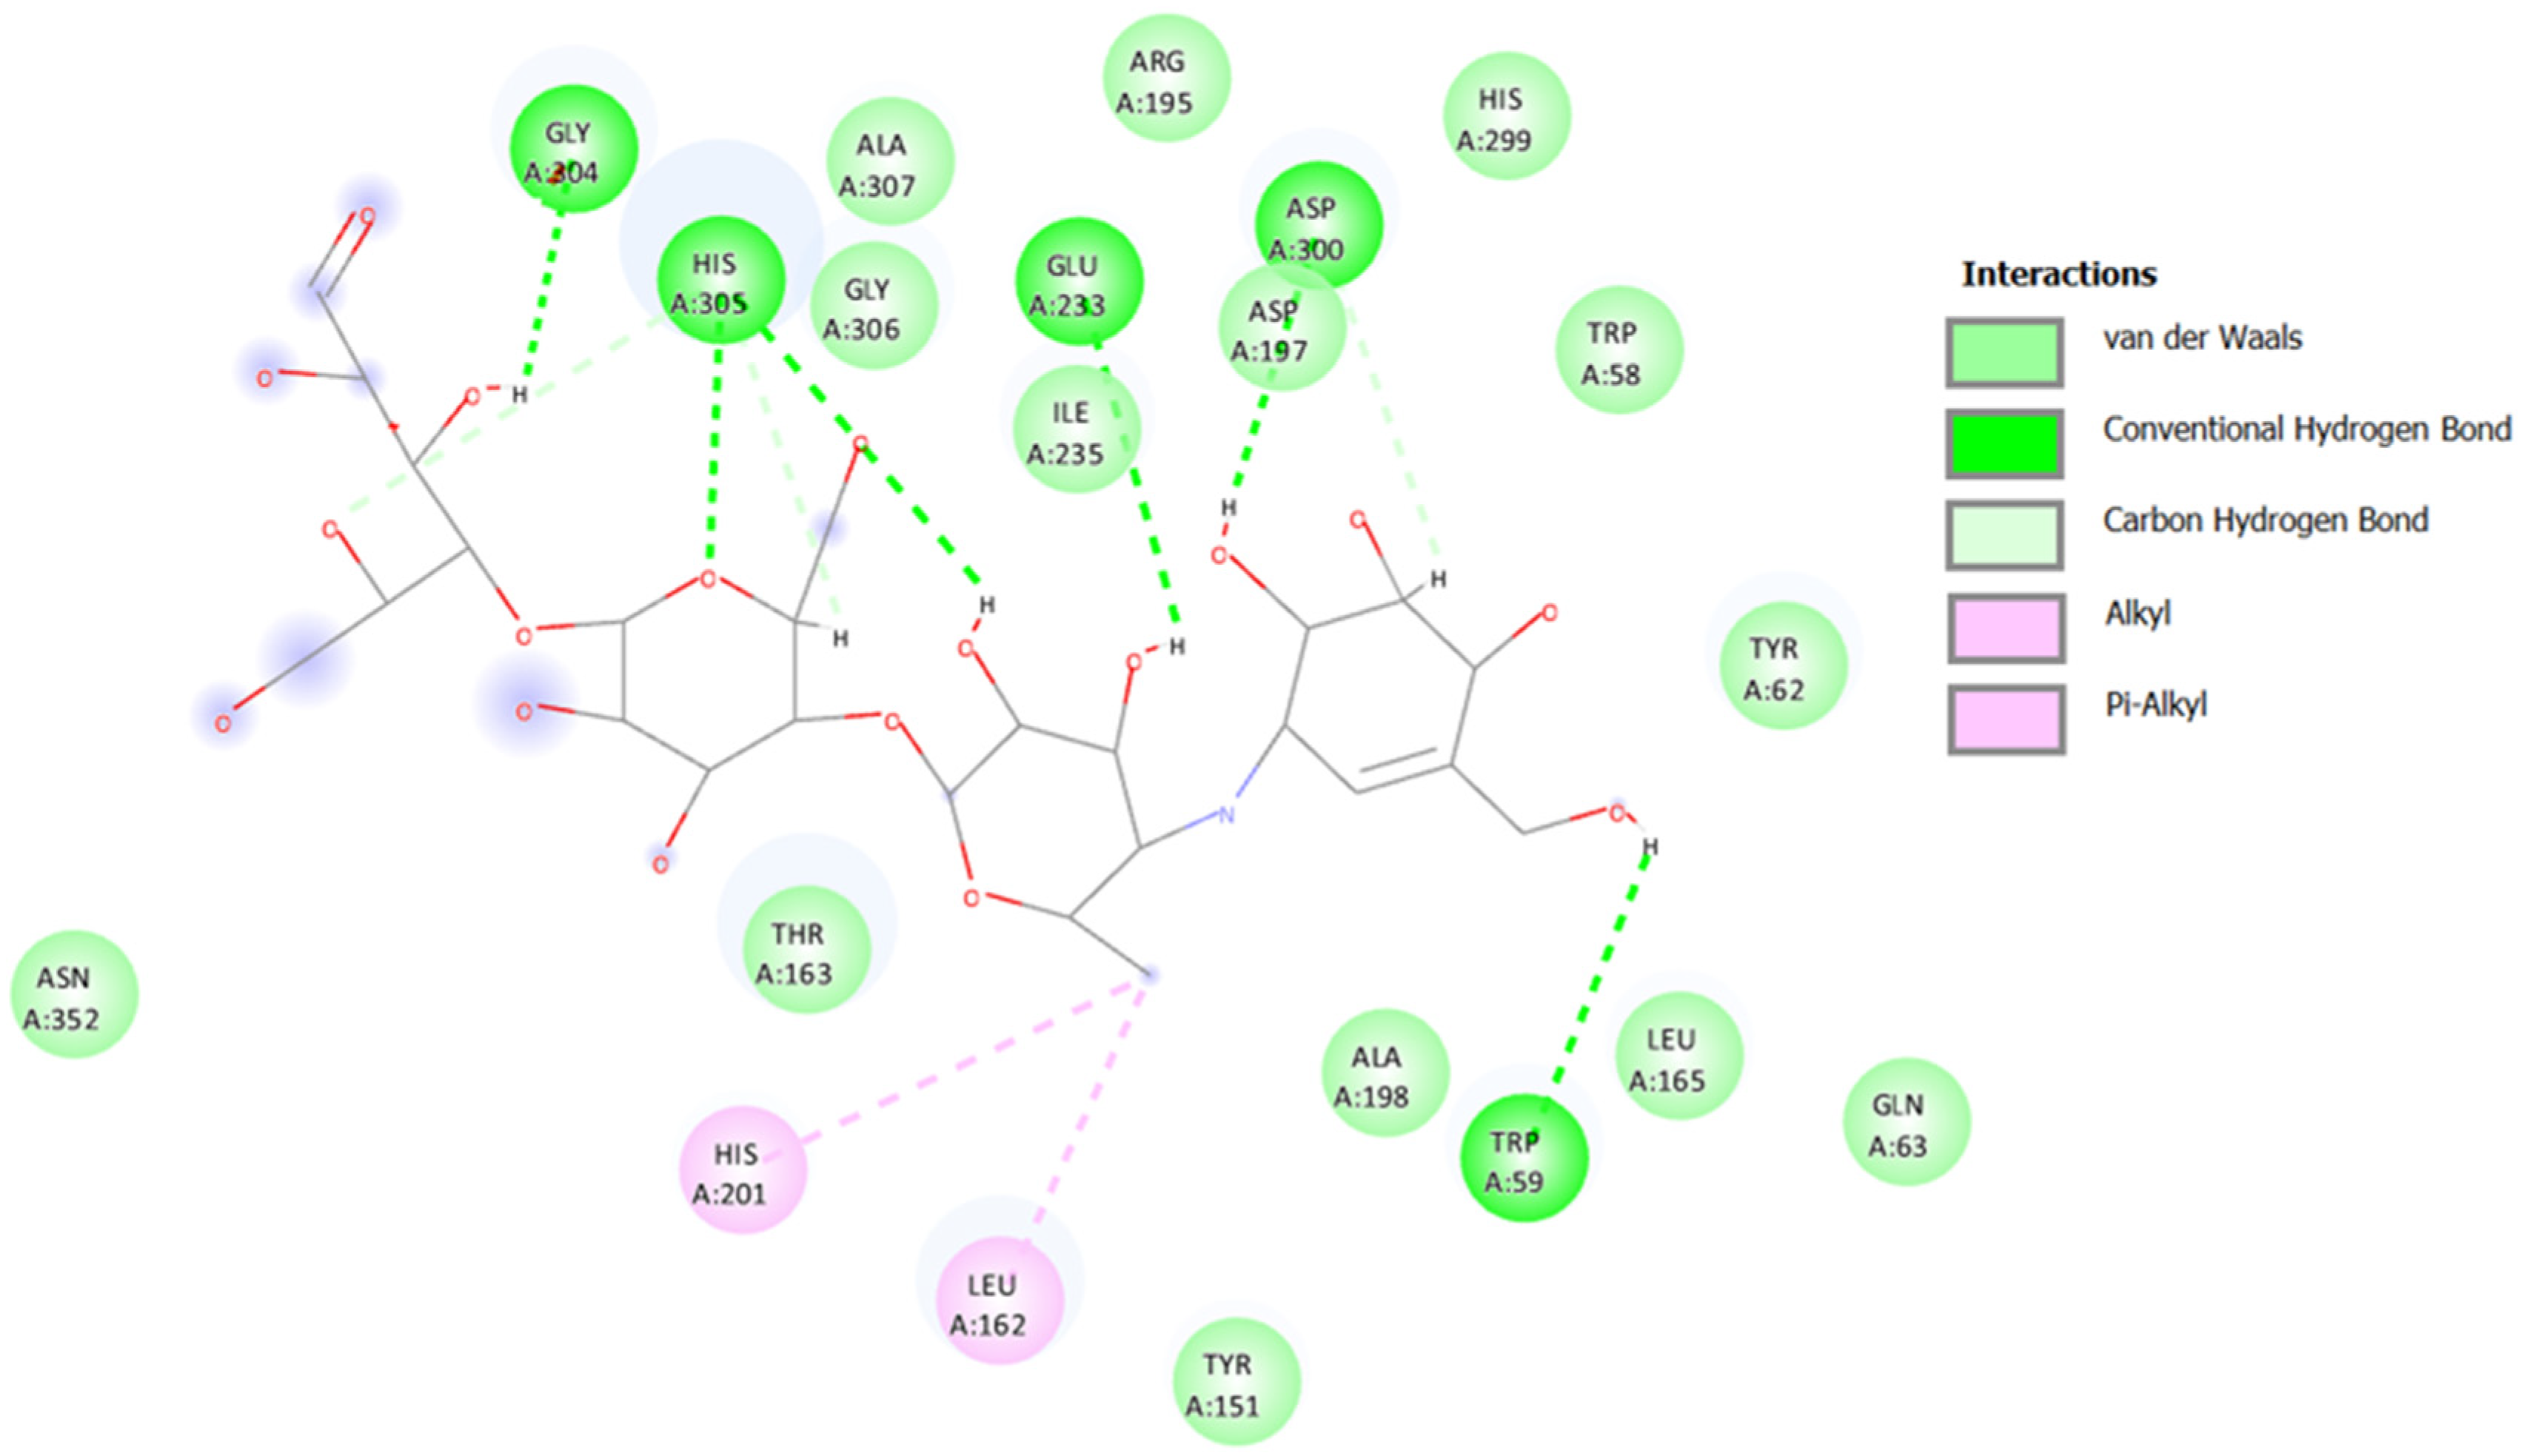
2.3.1. Docking against Human Pancreatic Alpha-Amylase (HPA; PDB ID: 3BAJ)
2.3.2. Docking against Recombinant Human Lysosomal Acid-Alpha-Glucosidase (rhGAA, PDB ID: 5NN5)
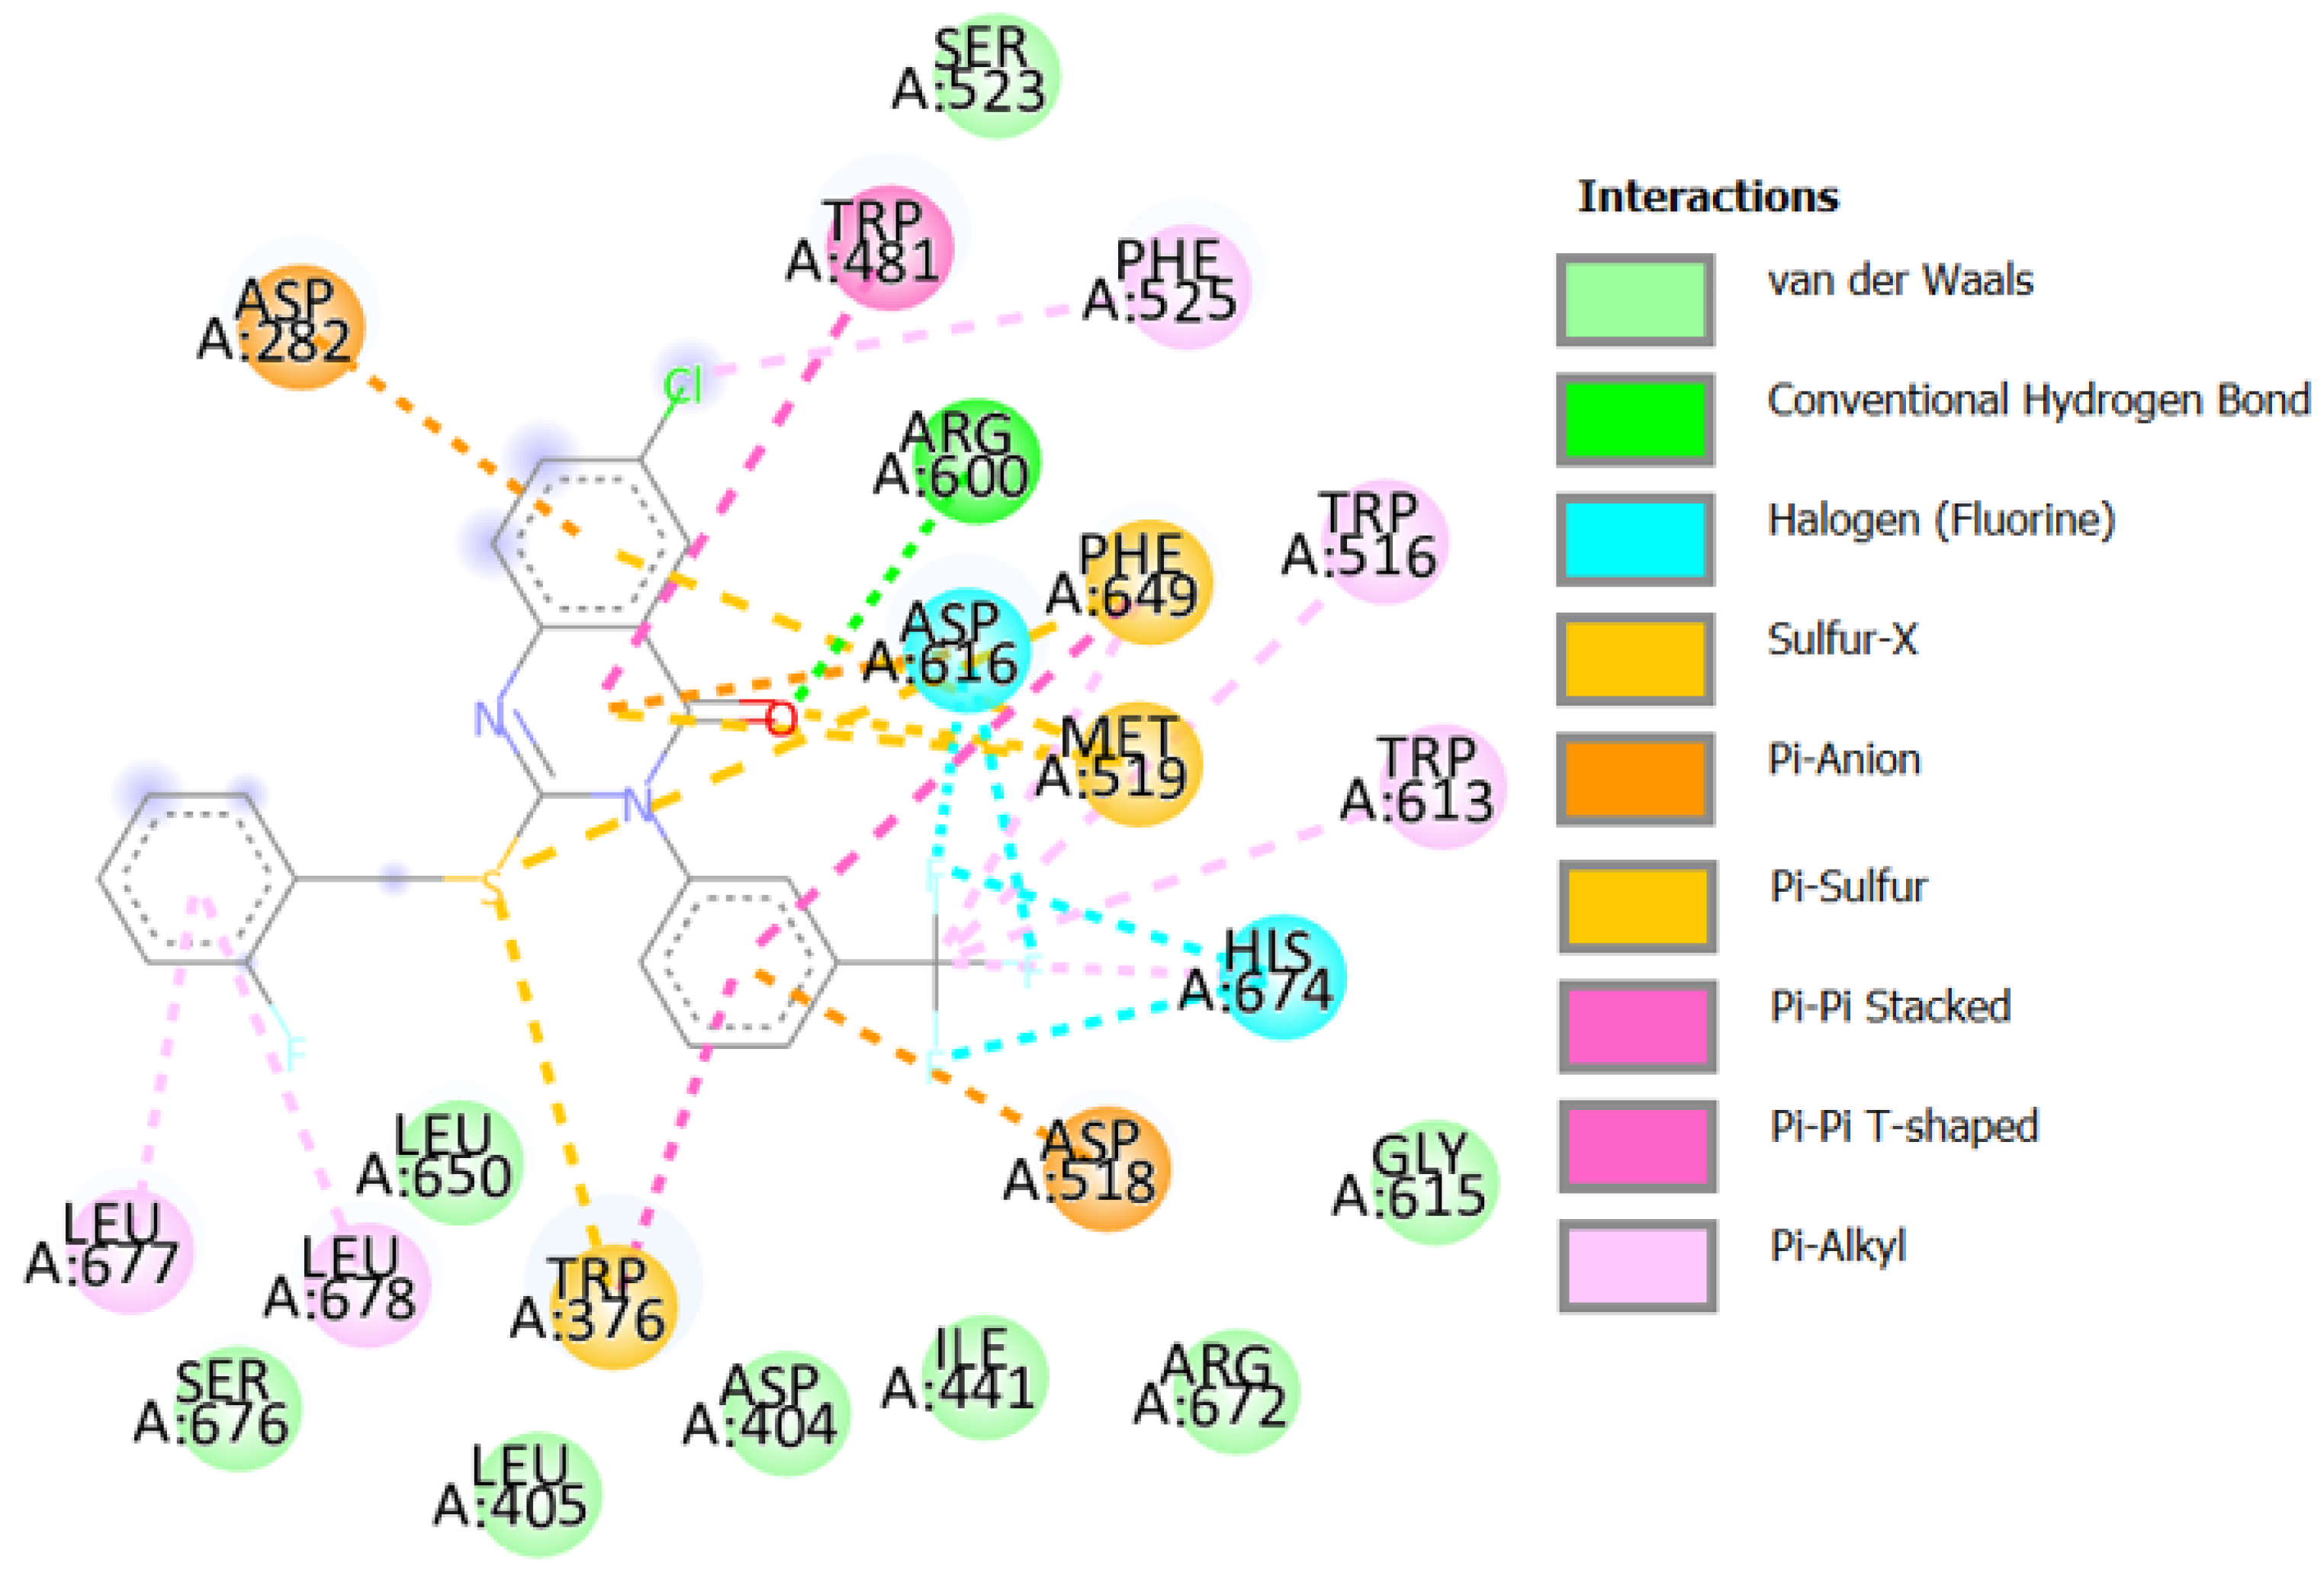
2.3.3. Docking against Lactate Dehydrogenase A (LDHA, PDB code: 1I10)
2.3.4. Docking against COX-2 (PDB ID: 3LN1)
2.4. In Silico Physicochemical, Medicinal and ADMET Predictions
2.4.1. Physicochemical Properties of the Most Biologically Active Candidates
2.4.2. Medicinal Chemistry of the Most Biologically Active Candidates
The Quantitative Estimate of Drug-likeness (QED) Score
Lipinski’s Rule of Five Filter
Pfizer Rule
GlaxoSmithKline (GSK) Rule
Golden Triangle
Pan-Assay Interference Compounds (PAINS) Filter
2.4.3. Drug Metabolism and Pharmacokinetic (DMPK) Analysis for the AA and AG Dual Inhibitors: 3h, 5a and 5h
Absorption Prediction
- Solubility (LogS)
- Human Intestinal Absorption (HIA)
- The Human Oral Bioavailability (HOB)
- The Human Oral Bioavailability Factors 20% (F20%) and 30% (F30%)
- Permeability
- P-glycoprotein (P-gp) Efflux
Distribution
- The Degree of Plasma Protein Binding (PPB)
- The Fraction Unbound in Plasma (Fu)
- Volume of Distribution (VD)
- Penetration of Blood–Brain Barrier (BBB)
Metabolism
Excretion
Toxicity
- The human ether-a-go-go-related gene (hERG) blockers
- The human hepatotoxicity (H-HT)
- Drug-induced liver injury (DILI)
- AMES Toxicity for mutagenicity
- Rat oral acute toxicity (ROA)
- FDA Maximum Recommended Daily Dose (FDAMDD)
- Carcinogenicity
- Respiratory Toxicity
- Eye irritation/eye corrosion (EI/EC)
- Predicting the toxicology in the 21st century (Tox21) program
- Nuclear receptor pathway toxicity
- Nuclear receptor–Androgen receptor (NR-AR)
- 2.
- Nuclear receptor–Androgen receptor ligand binding domain (NR-AR-LBD)
- 3.
- Nuclear receptor–Aryl hydrocarbon Receptor (NR-AhR)
- 4.
- NR-Aromatase
- 5.
- Nuclear receptor–Estrogen receptor (NR-ER)
- 6.
- Nuclear receptor–Estrogen receptor α ligand binding domain (NR-ER-LBD)
- 7.
- Nuclear receptor–peroxisome proliferator-activated receptors gamma (NR-PPARg)
- Stress response (SR) panel
- The antioxidant response element signaling pathway (SR-ARE)
- 2.
- ATPase family AAA domain-containing protein 5 (SR-ATAD5)
- 3.
- Heat shock factor response element (SR-HSE)
- 4.
- Mitochondrial membrane potential (SR-MMP, ΔΨm)
- 5.
- p53, a tumor suppressor protein (SR- p53)
- The prediction of the existence or absence of toxicophores and compliance with toxicity rules:
- The number of toxic substructures (toxicophores) present in the studied compounds were 5, 1 and 3, respectively;
- Based on the genotoxic carcinogenicity rule, the molecules possessed 5, 0 and 5 substructures, respectively, which would cause carcinogenicity or mutagenicity through genotoxic mechanisms;
- Based on the non-genotoxic carcinogenicity rule, the molecules possessed 0, 1 and 1 substructures, respectively, which would cause carcinogenicity through nongenotoxic mechanisms;
- Based on the skin sensitization rule, the molecules possessed 1, 1 and 2 substructures, respectively, which would cause skin irritation;
- Based on the non-biodegradable rule, the molecules possessed 2, 2 and 3 substructures, respectively, which would make them non-biodegradable;
- Based on the SureChEMBL rule, the molecules did not have any structural alerts to have a MedChem unfriendly status.
- Predictions of environmental toxicity
- Bioconcentration Factor (BCF)The BCF is used to reflect on secondary poisoning potential and evaluate risks to human health via the food chain. The unit of BCF is log10(L/kg) and it is calculated based on the ratio of a chemical concentration in the organism as a result of absorption via the respiratory and dermal surfaces to that in water at a steady state. Substances are considered highly bioaccumulative (should be severely restricted) with a BCF value of ≥ 3.7, accumulative with BCF ranging between 3 and 3.3, and non-accumulative having BCF values of < 3, according to the US Environmental Protection Agency under the Toxic Substances Control Act [104]. For the studied compounds the computed values were 0.741, 1.7 and 2.212; thus, all of them would be non-bioaccumulative, and so they are considered to be non-ecotoxic.
- The 50% growth inhibitory concentration (IGC50) for Tetrahymena pyriformisThis value indicates aquatic toxicity by estimating the concentration of a chemical in water in mg/L that causes 50% growth inhibition to Tetrahymena pyriformis after 48 h. The predicted values in units of [−log10[(mg/L)/(1000 × MW)] were 4.771, 5.339 and 5.222, respectively.
- The median lethal concentration values against flathead minnow (LC50FM)This value refers to the concentration of a molecule in water in mg/L that causes 50% of fathead minnow to die after 96 h, expressed in [−log10[(mg/L)/(1000 × MW)]. The computed values were 5.083, 6.709 and 6.738 unit.
- The median lethal concentration values against Daphnia magna (LC50DM)This value is defined as the concentration of a compound in water in mg/L which causes death to 50% of a population of Daphnia magna after 48 h. The recorded values for the compounds were 5.959, 6.99 and 6.865 [−log10[(mg/L)/(1000 × MW], respectively.
3. Materials and Methods
3.1. Chemistry
3.1.1. General
3.1.2. General Procedures for the Synthesis of 6-substituted or 6,7-disubstituted-3-aryl-2-thioxo-2,3-dihydro-1H-quinazolin-4-one 3a–h
3.1.3. Synthesis of 2-(benzylsulfanyl)-3-aryl-3H-quinazolin-4-one Derivatives 5a–h
General Procedures
3.2. Biology
3.2.1. DPPH Radical Scavenging Assay
3.2.2. COX-2 Inhibition Assay
3.2.3. Lactate Dehydrogenase A (LDHA) Inhibitory Assay
3.2.4. In Vitro α-Glucosidase (AG) Inhibitory Activity
3.2.5. In Vitro α-Amylase (AA) Inhibition Assay
3.2.6. Viability Assay
3.2.7. Statistical Analysis
3.2.8. Determination of the Expressional Levels of Bax, caspase-3 and Bcl-2 Genes
Cell Culture
Design of the Primer
Reverse-Transcription PCR (RT-PCR)
Quantitative Real-Time PCR
3.2.9. Annexin-V-FITC Assay
3.2.10. Cell Cycle Assay
3.2.11. Immunoblot Experiments
3.3. In Silico Studies
3.3.1. Molecular Docking Studies
- Preparation of the protein
- Preparation of ligands
- Docking studies
3.3.2. ADMET Analysis
3.3.3. The Bioavailability Radar Charts
4. Conclusions
Supplementary Materials
Author Contributions
Funding
Institutional Review Board Statement
Informed Consent Statement
Data Availability Statement
Acknowledgments
Conflicts of Interest
References
- Xi, Y.; Xu, P. Global colorectal cancer burden in 2020 and projections to 2040. Trans. Oncol. 2021, 14, 101174. [Google Scholar] [CrossRef] [PubMed]
- Orlandi, G.; Roncucci, L.; Carnevale, G.; Sena, P. Different Roles of Apoptosis and Autophagy in the Development of Human Colorectal Cancer. Int. J. Mol. Sci. 2023, 24, 10201. [Google Scholar] [CrossRef] [PubMed]
- Zhou, L.; Zhang, Z.; Huang, Z.; Nice, E.; Zou, B.; Huang, C. Revisiting cancer hallmarks: Insights from the interplay between oxidative stress and non-coding RNAs. Mol. Biomed. 2020, 1, 4. [Google Scholar] [CrossRef] [PubMed]
- Bardelčíková, A.; Šoltys, J.; Mojžiš, J. Oxidative Stress, Inflammation and Colorectal Cancer: An Overview. Antioxidants 2023, 12, 901. [Google Scholar] [CrossRef]
- Zheng, S.; Wang, X.; Zhao, D.; Liu, H.; Hu, Y. Calcium homeostasis and cancer: Insights from endoplasmic reticulum-centered organelle communications. Trends Cell Biol. 2023, 33, 312–323. [Google Scholar] [CrossRef]
- Xiao, M.; Zhong, H.; Xia, L.; Tao, Y.; Yin, H. Pathophysiology of mitochondrial lipid oxidation: Role of 4-hydroxynonenal (4-HNE) and other bioactive lipids in mitochondria. Free Radic. Biol. Med. 2017, 111, 316–327. [Google Scholar] [CrossRef]
- Gentile, F.; Arcaro, A.; Pizzimenti, S.; Daga, M.; Cetrangolo, G.P.; Dianzani, C.; Lepore, A.; Graf, M.; Ames, P.R.J.; Barrera, G. DNA damage by lipid peroxidation products: Implications in cancer, inflammation and autoimmunity. AIMS Genet. 2017, 4(2), 103–137. [Google Scholar] [CrossRef]
- Martemucci, G.; Costagliola, C.; Mariano, M.; D’andrea, L.; Napolitano, P.; D’Alessandro, A.G. Free Radical Properties, Source and Targets, Antioxidant Consumption and Health. Oxygen 2022, 2, 48–78. [Google Scholar] [CrossRef]
- Kloudova, A.; Guengerich, F.P.; Soucek, P. The Role of Oxysterols in Human Cancer. Trends Endocrinol. Metab. 2017, 28, 485–496. [Google Scholar] [CrossRef]
- Kumari, S.; Badana, A.K.; Murali Mohan, G.; Shailender, G.; Malla, R. Reactive Oxygen Species: A Key Constituent in Cancer Survival. Biomark. Insights 2018, 13, 1177271918755391. [Google Scholar] [CrossRef]
- Krejbich, P.; Birringer, M. The Self-Administered Use of Complementary and Alternative Medicine (CAM) Supplements and Antioxidants in Cancer Therapy and the Critical Role of Nrf-2-A Systematic Review. Antioxidants 2022, 11, 2149. [Google Scholar] [CrossRef] [PubMed]
- Ho, B.Y.; Wu, Y.M.; Chang, K.J.; Pan, T.M. Dimerumic acid inhibits SW620 cell invasion by attenuating H2O2-mediated MMP-7 expression via JNK/C-Jun and ERK/C-Fos activation in an AP-1-dependent manner. Int. J. Biol. Sci. 2011, 7, 869–880. [Google Scholar] [CrossRef]
- Sheng, J.; Sun, H.; Yu, F.B.; Li, B.; Zhang, Y.; Zhu, Y.T. The Role of Cyclooxygenase-2 in Colorectal Cancer. Int. J. Med. Sci. 2020, 17, 1095–1101. [Google Scholar] [CrossRef]
- Roelofs, H.M.; Te Morsche, R.H.; van Heumen, B.W.; Nagengast, F.M.; Peters, W.H. Over-expression of COX-2 mRNA in colorectal cancer. BMC Gastroenterol. 2014, 14, 9005–9010. [Google Scholar] [CrossRef]
- Wilson, D.J.; DuBois, R.N. Role of Prostaglandin E2 in the Progression of Gastrointestinal Cancer. Cancer Prev. Res. 2022, 15, 355–363. [Google Scholar] [CrossRef]
- Rahman, M.; Selvarajan, K.; Hasan, M.R.; Chan, A.P.; Jin, C.; Kim, J.; Chan, S.K.; Le, N.D.; Kim, Y.B.; Tai, I.T. Inhibition of COX-2 in colon cancer modulates tumor growth and MDR-1 expression to enhance tumor regression in therapy-refractory cancers in vivo. Neoplasia 2012, 14, 624–633. [Google Scholar] [CrossRef] [PubMed]
- Thumkeo, D.; Punyawatthananukool, S.; Prasongtanakij, S.; Matsuura, R.; Arima, K.; Nie, H.; Yamamoto, R.; Aoyama, N.; Hamaguchi, H.; Sugahara, S.; et al. PGE2-EP2/EP4 signaling elicits immunosuppression by driving the mregDC-Treg axis in inflammatory tumor microenvironment. Cell Rep. 2022, 39, 110914–110928. [Google Scholar] [CrossRef] [PubMed]
- Wang, D.; Fu, L.; Sun, H.; Guo, L.; DuBois, R.N. Prostaglandin E2 Promotes Colorectal Cancer Stem Cell Expansion and Metastasis in Mice. Gastroenterology 2015, 149, 1884–1895.e4. [Google Scholar] [CrossRef]
- Sun, Y.; Tang, X.M.; Half, E.; Kuo, M.T.; Sinicrope, F.A. Cyclooxygenase-2 overexpression reduces apoptotic susceptibility by inhibiting the cytochrome c-dependent apoptotic pathway in human colon cancer cells. Cancer Res. 2002, 62, 6323–6328. [Google Scholar]
- Karpisheh, V.; Nikkhoo, A.; Hojjat-Farsangi, M.; Namdar, A.; Azizi, G.; Ghalamfarsa, G.; Sabz, G.; Yousefi, M.; Yousefi, B.; Jadidi-Niaragh, F. Prostaglandin E2 as a potent therapeutic target for treatment of colon cancer. Prostaglandins Other Lipid Mediat. 2019, 144, 106338. [Google Scholar] [CrossRef]
- Wang, L.; Zhang, R.; Yu, L.; Xiao, J.; Zhou, X.; Li, X.; Song, P.; Li, X. Aspirin Use and Common Cancer Risk: A Meta-Analysis of Cohort Studies and Randomized Controlled Trials. Front. Oncol. 2021, 11, 690219. [Google Scholar] [CrossRef] [PubMed]
- Arber, N.; Eagle, C.J.; Spicak, J.; Rácz, I.; Dite, P.; Hajer, J.; Zavoral, M.; Lechuga, M.J.; Gerletti, P.; Tang, J.; et al. Celecoxib for the prevention of colorectal adenomatous polyps. N. Engl. J. Med. 2006, 355, 885–895. [Google Scholar] [CrossRef] [PubMed]
- Chen, W.S.; Liu, J.H.; Liu, J.M.; Lin, J.K. Sequence-dependent effect of a cyclooxygenase-2 inhibitor on topoisomerase I inhibitor and 5-fluorouracil-induced cytotoxicity of colon cancer cells. Anti Cancer Drugs 2004, 15, 287–294. [Google Scholar] [CrossRef] [PubMed]
- Warburg, O. On the origin of cancer cells. Science 1956, 123, 309–314. [Google Scholar] [CrossRef]
- El Sayed, S.M. Biochemical Origin of the Warburg Effect in Light of 15 Years of Research Experience: A Novel Evidence-Based View (An Expert Opinion Article). Onco Targets Ther. 2023, 16, 143–155. [Google Scholar] [CrossRef]
- Kliebhan, J.; Besse, A.; Kampa-Schittenhelm, K.; Schittenhelm, M.; Driessen, C. Mutant TP53 driving the Warburg Effect in Mantle Cell lymphoma. Clin. Case Rep. 2022, 10, e6296–e6300. [Google Scholar] [CrossRef] [PubMed]
- Brand, A.; Singer, K.; Koehl, G.E.; Kolitzus, M.; Schoenhammer, G.; Thiel, A.; Matos, C.; Bruss, C.; Klobuch, S.; Peter, K.; et al. LDHA-Associated Lactic Acid Production Blunts Tumor Immunosurveillance by T and NK Cells. Cell Metab. 2016, 24, 657–671. [Google Scholar] [CrossRef] [PubMed]
- de la Cruz-López, K.G.; Castro-Muñoz, L.J.; Reyes-Hernández, D.O.; García-Carrancá, A.; Manzo-Merino, J. Lactate in the Regulation of Tumor Microenvironment and Therapeutic Approaches. Front. Oncol. 2019, 9, 1143. [Google Scholar] [CrossRef] [PubMed]
- Daverio, Z.; Balcerczyk, A.; Rautureau, G.J.P.; Panthu, B. How Warburg-Associated Lactic Acidosis Rewires Cancer Cell Energy Metabolism to Resist Glucose Deprivation. Cancers 2023, 15, 1417. [Google Scholar] [CrossRef]
- Le, A.; Cooper, C.R.; Gouw, A.M.; Dinavahi, R.; Maitra, A.; Deck, L.M.; Royer, R.E.; Vander Jagt, D.L.; Semenza, G.L.; Dang, C.V. Inhibition of lactate dehydrogenase A induces oxidative stress and inhibits tumor progression. Proc. Natl. Acad. Sci. USA 2010, 107, 2037–2042. [Google Scholar] [CrossRef]
- Zhai, X.; Yang, Y.; Wan, J.; Zhu, R.; Wu, Y. Inhibition of LDH-A by oxamate induces G2/M arrest, apoptosis and increases radiosensitivity in nasopharyngeal carcinoma cells. Oncol. Rep. 2013, 30, 2983–2991. [Google Scholar] [CrossRef] [PubMed]
- Han, J.H.; Kim, M.; Kim, H.J.; Jang, S.B.; Bae, S.J.; Lee, I.K.; Ryu, D.; Ha, K.T. Targeting Lactate Dehydrogenase A with Catechin Resensitizes SNU620/5FU Gastric Cancer Cells to 5-Fluorouracil. Int. J. Mol. Sci. 2021, 22, 5406. [Google Scholar] [CrossRef]
- Maftouh, M.; Avan, A.; Sciarrillo, R.; Granchi, C.; Leon, L.G.; Rani, R.; Funel, N.; Smid, K.; Honeywell, R.; Boggi, U.; et al. Synergistic interaction of novel lactate dehydrogenase inhibitors with gemcitabine against pancreatic cancer cells in hypoxia. Br. J. Cancer 2014, 110, 172–182. [Google Scholar] [CrossRef] [PubMed]
- Liu, Z.; Ma, S. Recent Advances in Synthetic α-Glucosidase Inhibitors. Chem. Med. Chem. 2017, 12, 819–829. [Google Scholar] [CrossRef]
- Tomic, D.; Shaw, J.E.; Magliano, D.J. The burden and risks of emerging complications of diabetes mellitus. Nat. Rev. Endocrinol. 2022, 18, 525–539. [Google Scholar] [CrossRef] [PubMed]
- Cheng, H.C.; Chang, T.K.; Su, W.C.; Tsai, H.L.; Wang, J.Y. Narrative review of the influence of diabetes mellitus and hyperglycemia on colorectal cancer risk and oncological outcomes. Transl. Oncol. 2021, 14, 101089. [Google Scholar] [CrossRef] [PubMed]
- Yu, G.H.; Li, S.F.; Wei, R.; Jiang, Z. Diabetes and colorectal cancer risk: Clinical and therapeutic implications. J. Diabetes Res. 2022, 2022, 1747326. [Google Scholar] [CrossRef]
- Yeh, C.S.; Wang, J.Y.; Chung, F.Y.; Lee, S.C.; Huang, M.Y.; Kuo, C.W.; Yang, M.J.; Lin, S.R. Significance of the glycolytic pathway and glycolysis related-genes in tumorigenesis of human colorectal cancers. Oncol. Rep. 2008, 19, 81–91. [Google Scholar] [CrossRef][Green Version]
- Schröter, D.; Höhn, A. Role of Advanced Glycation End Products in Carcinogenesis and their Therapeutic Implications. Curr. Pharm. Des. 2018, 24, 5245–5251. [Google Scholar] [CrossRef]
- Vekic, J.; Zeljkovic, A.; Stefanovic, A.; Giglio, R.V.; Ciaccio, M.; Rizzo, M. Diabetes and Colorectal Cancer Risk: A New Look at Molecular Mechanisms and Potential Role of Novel Antidiabetic Agents. Int. J. Mol. Sci. 2021, 22, 12409. [Google Scholar] [CrossRef]
- Dahlén, A.D.; Dashi, G.; Maslov, I.; Attwood, M.M.; Jonsson, J.; Trukhan, V.; Schiöth, H.B. Trends in Antidiabetic Drug Discovery: FDA Approved Drugs, New Drugs in Clinical Trials and Global Sales. Front. Pharmacol. 2022, 12, 807548. [Google Scholar] [CrossRef]
- Ferey-Roux, G.; Perrier, J.; Forest, E.; Marchis-Mouren, G.; Puigserver, A.; Santimone, M. The human pancreatic alpha-amylase isoforms: Isolation, structural studies and kinetics of inhibition by acarbose. Biochim. Biophys. Acta 1998, 1388, 10–20. [Google Scholar] [CrossRef]
- Hedrington, M.S.; Davis, S.N. Considerations when using alpha-glucosidase inhibitors in the treatment of type 2 diabetes. Expert Opin. Pharmacother. 2019, 20, 2229–2235. [Google Scholar] [CrossRef] [PubMed]
- Hossain, A.; Pervin, R. Current Antidiabetic Drugs: Review of Their Efficacy and Safety. In Nutritional and Therapeutic Interventions for Diabetes and Metabolic Syndrome, 2nd ed.; Bagchi, D., Nair, S., Eds.; Elsevier Academic Press: Oxford, UK, 2018; Chapter 34, pp. 445–473. [Google Scholar] [CrossRef]
- Rajasekaran, P.; Ande, C.; Vankar, Y.D. Synthesis of (5,6 & 6,6)-oxa-oxa annulated sugars as glycosidase inhibitors from 2-formyl galactal using iodocyclization as a key step. Arkivoc 2022, 2022, 5–23. [Google Scholar] [CrossRef]
- Tseng, P.S.; Ande, C.; Moremen, K.W.; Crich, D. Influence of side chain conformation on the activity of glycosidase inhibitors. Angew. Chem. Int. Ed. Engl. 2023, 62, e202217809. [Google Scholar] [CrossRef] [PubMed]
- Compain, P.; Martin, O.R. (Eds.) Iminosugars: From Synthesis to Therapeutic Applications; John Wiley & Sons Ltd.: Chichester, UK, 2007; pp. 7–123. Available online: http://library.navoiy-uni.uz/files/martin%20o.%20r.%20-%20iminosugars-%20from%20synthesis%20to%20therapeutic%20applications%20(2007)(456s).pdf (accessed on 11 August 2023).
- Singh, A.; Singh, K.; Sharma, A.; Kaur, K.; Kaur, K.; Chadha, R.; Bedi, P.M.S. Recent developments in synthetic α-glucosidase inhibitors: A comprehensive review with structural and molecular insight. J. Mol. Struct. 2023, 1281, 135115. [Google Scholar] [CrossRef]
- Chaudhury, A.; Duvoor, C.; Reddy Dendi, V.S.; Kraleti, S.; Chada, A.; Ravilla, R.; Marco, A.; Shekhawat, N.S.; Montales, M.T.; Kuriakose, K.; et al. Clinical Review of Antidiabetic Drugs: Implications for Type 2 Diabetes Mellitus Management. Front. Endocrinol. 2017, 8, 6. [Google Scholar] [CrossRef]
- Elmore, S. Apoptosis: A review of programmed cell death. Toxicol. Pathol. 2007, 35, 495–516. [Google Scholar] [CrossRef]
- Hanahan, D.; Weinberg, R.A. Hallmarks of cancer: The next generation. Cell 2011, 144, 646–674. [Google Scholar] [CrossRef]
- Kiraz, Y.; Adan, A.; Kartal Yandim, M.; Baran, Y. Major apoptotic mechanisms and genes involved in apoptosis. Tumor Biol. 2016, 37, 8471–8486. [Google Scholar] [CrossRef]
- Du, C.; Fang, M.; Li, Y.; Li, L.; Wang, X. Smac, a mitochondrial protein that promotes cytochrome c-dependent caspase activation by eliminating IAP inhibition. Cell 2000, 102, 33–42. [Google Scholar] [CrossRef]
- Chinnaiyan, A.M. The apoptosome: Heart and soul of the cell death machine. Neoplasia 1999, 1, 5–15. [Google Scholar] [CrossRef]
- Hill, M.M.; Adrain, C.; Duriez, P.J.; Creagh, E.M.; Martin, S.J. Analysis of the composition, assembly kinetics and activity of native Apaf-1 apoptosomes. EMBO J. 2004, 23, 2134–2145. [Google Scholar] [CrossRef]
- Qian, S.; Wei, Z.; Yang, W.; Huang, J.; Yang, Y.; Wang, J. The role of BCL-2 family proteins in regulating apoptosis and cancer therapy. Front. Oncol. 2022, 12, 985363. [Google Scholar] [CrossRef]
- Kaloni, D.; Diepstraten, S.T.; Strasser, A.; Kelly, G.L. BCL-2 protein family: Attractive targets for cancer therapy. Apoptosis 2023, 28, 20–38. [Google Scholar] [CrossRef]
- Zhang, X.; Liu, X.; Zhou, D.; Zheng, G. Targeting anti-apoptotic BCL-2 family proteins for cancer treatment. Future Med. Chem. 2020, 12, 563–565. [Google Scholar] [CrossRef] [PubMed]
- Yangnok, K.; Innajak, S.; Sawasjirakij, R.; Mahabusarakam, W.; Watanapokasin, R. Effects of Artonin E on Cell Growth Inhibition and Apoptosis Induction in Colon Cancer LoVo and HCT116 Cells. Molecules 2022, 27, 2095. [Google Scholar] [CrossRef] [PubMed]
- Liu, Z.; Ding, Y.; Ye, N.; Wild, C.; Chen, H.; Zhou, J. Direct Activation of Bax Protein for Cancer Therapy. Med. Res. Rev. 2016, 36, 313–341. [Google Scholar] [CrossRef] [PubMed]
- Fu, R.G.; Sun, Y.; Sheng, W.B.; Liao, D.F. Designing multi-targeted agents: An emerging anticancer drug discovery paradigm. Eur. J. Med. Chem. 2017, 136, 195–211. [Google Scholar] [CrossRef]
- Radwan, A.A.; Alanazi, F.K. Biological activity of quinazolinones. In Quinazolinone and Quinazoline Derivatives; Al-kaf, A.G., Ed.; IntechOpen: London, UK, 2020; Chapter 2; pp. 11–38. Available online: https://www.intechopen.com/chapters/70910 (accessed on 24 February 2023).
- El-Sayed, N.N.E.; Almaneai, N.M.; Ben Bacha, A.; Al-Obeed, O.; Ahmad, R.; Abdulla, M.; Alafeefy, A.M. Synthesis and evaluation of anticancer, antiphospholipases, antiproteases, and antimetabolic syndrome activities of some 3H-quinazolin-4-one derivatives. J. Enzyme Inhib. Med. Chem. 2019, 34, 672–683. [Google Scholar] [CrossRef]
- Al-Salahi, R.; Ahmad, R.; Anouar, E.; Nor Azman, N.I.I.; Marzouk, M.; Abuelizz, H.A. 3-Benzyl(phenethyl)-2-thioxobenzo[g]quinazolines as a new class of potent α-glucosidase inhibitors: Synthesis and molecular docking study. Future Med. Chem. 2018, 10, 1889–1905. [Google Scholar] [CrossRef]
- Moussa, G.; Alaaeddine, R.; Alaeddine, L.M.; Nassra, R.; Belal, A.S.F.; Ismail, A.; El-Yazbi, A.F.; Abdel-Ghany, Y.S.; Hazzaa, A. Novel click modifiable thioquinazolinones as anti-inflammatory agents: Design, synthesis, biological evaluation and docking study. Eur. J. Med. Chem. 2018, 144, 635–650. [Google Scholar] [CrossRef]
- Al-Salahi, R.; Taie, H.A.A.; Bakheit, A.H.; Marzouk, M.; Almehizia, A.A.; Herqash, R.; Abuelizz, H.A. Antioxidant activities and molecular docking of 2-thioxobenzo[g]quinazoline derivatives. Pharmacol. Rep. 2019, 71, 695–700. [Google Scholar] [CrossRef]
- El-Messery, S.M.; Hassan, G.S.; Nagi, M.N.; Habib, E.E.; Al-Rashood, S.T.; El-Subbagh, H.I. Synthesis, biological evaluation and molecular modeling study of some new methoxylated 2-benzylthio-quinazoline-4(3H)-ones as nonclassical antifolates. Bioorg. Med. Chem. Lett. 2016, 26, 4815–4823. [Google Scholar] [CrossRef] [PubMed]
- Mahdy, H.A.; Ibrahim, M.K.; Metwaly, A.M.; Belal, A.; Mehany, A.B.M.; El-Gamal, K.M.A.; El-Sharkawy, A.; Elhendawy, M.A.; Radwan, M.M.; Elsohly, M.A.; et al. Design, synthesis, molecular modeling, in vivo studies and anticancer evaluation of quinazolin-4(3H)-one derivatives as potential VEGFR-2 inhibitors and apoptosis inducers. Bioorg. Chem. 2020, 94, 103422. [Google Scholar] [CrossRef] [PubMed]
- Gillis, E.P.; Eastman, K.J.; Hill, M.D.; Donnelly, D.J.; Meanwell, N.A. Applications of Fluorine in Medicinal Chemistry. J. Med. Chem. 2015, 58, 8315–8359. [Google Scholar] [CrossRef] [PubMed]
- Hamidian, H.; Tikdari, A.M.; Khabazzadeh, H. Synthesis of New 4(3H)-Quinazolinone Derivatives Using 5(4H)-Oxazolones. Molecules 2006, 11, 377–382. [Google Scholar] [CrossRef]
- Mohamed, M.A.; Ayyad, R.R.; Shawer, T.Z.; Abdel-Aziz, A.A.; El-Azab, A.S. Synthesis and antitumor evaluation of trimethoxyanilides based on 4(3H)-quinazolinone scaffolds. Eur. J. Med. Chem. 2016, 112, 106–113. [Google Scholar] [CrossRef] [PubMed]
- Ichikawa, K.; Sasada, R.; Chiba, K.; Gotoh, H. Effect of Side Chain Functional Groups on the DPPH Radical Scavenging Activity of Bisabolane-Type Phenols. Antioxidants 2019, 8, 65. [Google Scholar] [CrossRef]
- Kim, E.Y.; Choi, H.J.; Park, M.J.; Jung, Y.S.; Lee, S.O.; Kim, K.J.; Choi, J.H.; Chung, T.W.; Ha, K.T. Myristica fragrans Suppresses Tumor Growth and Metabolism by Inhibiting Lactate Dehydrogenase A. Am. J. Chin. Med. 2016, 44, 1063–1079. [Google Scholar] [CrossRef]
- Lica, J.J.; Wieczór, M.; Grabe, G.J.; Heldt, M.; Jancz, M.; Misiak, M.; Gucwa, K.; Brankiewicz, W.; Maciejewska, N.; Stupak, A.; et al. Effective Drug Concentration and Selectivity Depends on Fraction of Primitive Cells. Int. J. Mol. Sci. 2021, 22, 4931. [Google Scholar] [CrossRef] [PubMed]
- Tsai, F.M.; Wu, C.C.; Shyu, R.Y.; Wang, C.H.; Jiang, S.Y. Tazarotene-induced gene 1 inhibits prostaglandin E2-stimulated HCT116 colon cancer cell growth. J. Biomed. Sci. 2011, 18, 88. [Google Scholar] [CrossRef]
- Paul-Samojedny, M.; Kokocińska, D.; Samojedny, A.; Mazurek, U.; Partyka, R.; Lorenz, Z.; Wilczok, T. Expression of cell survival/death genes: Bcl-2 and Bax at the rate of colon cancer prognosis. Biochim. Biophys. Acta 2005, 1741, 25–29. [Google Scholar] [CrossRef]
- Hauseman, Z.J.; Harvey, E.P.; Newman, C.E.; Wales, T.E.; Bucci, J.C.; Mintseris, J.; Schweppe, D.K.; David, L.; Fan, L.; Cohen, D.T.; et al. Homogeneous Oligomers of Pro-apoptotic BAX Reveal Structural Determinants of Mitochondrial Membrane Permeabilization. Mol. Cell 2020, 79, 68–83.e7. [Google Scholar] [CrossRef]
- Wani, A.K.; Akhtar, N.; Mir, T.U.G.; Singh, R.; Jha, P.K.; Mallik, S.K.; Sinha, S.; Tripathi, S.K.; Jain, A.; Jha, A.; et al. Targeting Apoptotic Pathway of Cancer Cells with Phytochemicals and Plant-Based Nanomaterials. Biomolecules 2023, 13, 194. [Google Scholar] [CrossRef]
- Ocker, M.; Höpfner, M. Apoptosis-modulating drugs for improved cancer therapy. Eur. Surg. Res. 2012, 48, 111–120. [Google Scholar] [CrossRef] [PubMed]
- Zorofchian Moghadamtousi, S.; Karimian, H.; Rouhollahi, E.; Paydar, M.; Fadaeinasab, M.; Abdul Kadir, H. Annona muricata leaves induce G₁ cell cycle arrest and apoptosis through mitochondria-mediated pathway in human HCT-116 and HT-29 colon cancer cells. J. Ethnopharmacol. 2014, 156, 277–289. [Google Scholar] [CrossRef]
- Lee, S.T.; Wong, P.F.; Cheah, S.C.; Mustafa, M.R. Alpha-tomatine induces apoptosis and inhibits nuclear factor-kappa B activation on human prostatic adenocarcinoma PC-3 cells. PLoS ONE 2011, 6, e18915. [Google Scholar] [CrossRef]
- Xiang, L.; He, B.; Liu, Q.; Hu, D.; Liao, W.; Li, R.; Peng, X.; Wang, Q.; Zhao, G. Antitumor effects of curcumin on the proliferation, migration and apoptosis of human colorectal carcinoma HCT-116 cells. Oncol. Rep. 2020, 44, 1997–2008. [Google Scholar] [CrossRef] [PubMed]
- Maurus, R.; Begum, A.; Williams, L.K.; Fredriksen, J.R.; Zhang, R.; Withers, S.G.; Brayer, G.D. Alternative catalytic anions differentially modulate human alpha-amylase activity and specificity. Biochemistry 2008, 47, 3332–3344. [Google Scholar] [CrossRef]
- Hassan, M.Z.; Alsayari, A.; Asiri, Y.I.; Bin Muhsinah, A. 1, 2, 4-Triazole-3-Thiones: Greener, One-Pot, Ionic Liquid Mediated Synthesis and Antifungal Activity. Polycycl. Aromat. Compd. 2023, 43, 167–175. [Google Scholar] [CrossRef]
- Roig-Zamboni, V.; Cobucci-Ponzano, B.; Iacono, R.; Ferrara, M.C.; Germany, S.; Bourne, Y.; Parenti, G.; Moracci, M.; Sulzenbacher, G. Structure of human lysosomal acid α-glucosidase-a guide for the treatment of Pompe disease. Nat. Commun. 2017, 8, 1111. [Google Scholar] [CrossRef]
- Read, J.A.; Winter, V.J.; Eszes, C.M.; Sessions, R.B.; Brady, R.L. Structural basis for altered activity of M- and H-isozyme forms of human lactate dehydrogenase. Proteins 2001, 43, 175–185. [Google Scholar] [CrossRef] [PubMed]
- Kim, E.Y.; Chung, T.W.; Han, C.W.; Park, S.Y.; Park, K.H.; Jang, S.B.; Ha, K.T. A Novel Lactate Dehydrogenase Inhibitor, 1-(Phenylseleno)-4-(Trifluoromethyl) Benzene, Suppresses Tumor Growth through Apoptotic Cell Death. Sci. Rep. 2019, 9, 3969. [Google Scholar] [CrossRef] [PubMed]
- Wang, J.L.; Limburg, D.; Graneto, M.J.; Springer, J.; Hamper, J.R.; Liao, S.; Pawlitz, J.L.; Kurumbail, R.G.; Maziasz, T.; Talley, J.J.; et al. The novel benzopyran class of selective cyclooxygenase-2 inhibitors. Part 2: The second clinical candidate having a shorter and favorable human half-life. Bioorg. Med. Chem. Lett. 2010, 20, 7159–7163. [Google Scholar] [CrossRef]
- Xiong, G.; Wu, Z.; Yi, J.; Fu, L.; Yang, Z.; Hsieh, C.; Yin, M.; Zeng, X.; Wu, C.; Lu, A.; et al. ADMETlab 2.0: An integrated online platform for accurate and comprehensive predictions of ADMET properties. Nucleic Acids Res. 2021, 49, W5–W14. [Google Scholar] [CrossRef]
- Bickerton, G.R.; Paolini, G.V.; Besnard, J.; Muresan, S.; Hopkins, A.L. Quantifying the chemical beauty of drugs. Nat. Chem. 2012, 4, 90–98. [Google Scholar] [CrossRef]
- Lipinski, C.A.; Lombardo, F.; Dominy, B.W.; Feeney, P.J. Experimental and computational approaches to estimate solubility and permeability in drug discovery and development settings. Adv. Drug Deliv. Rev. 1997, 23, 3–25. [Google Scholar] [CrossRef]
- Hughes, J.D.; Blagg, J.; Price, D.A.; Bailey, S.; Decrescenzo, G.A.; Devraj, R.V.; Ellsworth, E.; Fobian, Y.M.; Gibbs, M.E.; Gilles, R.W.; et al. Physiochemical drug properties associated with in vivo toxicological outcomes. Bioorg. Med. Chem. Lett. 2008, 18, 4872–4875. [Google Scholar] [CrossRef]
- Gleeson, M.P. Generation of a set of simple, interpretable ADMET rules of thumb. J. Med. Chem. 2008, 51, 817–834. [Google Scholar] [CrossRef]
- Johnson, T.W.; Dress, K.R.; Edwards, M. Using the Golden Triangle to optimize clearance and oral absorption. Bioorg. Med. Chem. Lett. 2009, 19, 5560–5564. [Google Scholar] [CrossRef] [PubMed]
- Daina, A.; Michielin, O.; Zoete, V. SwissADME: A free web tool to evaluate pharmacokinetics, drug-likeness and medicinal chemistry friendliness of small molecules. Sci. Rep. 2017, 7, 42717. [Google Scholar] [CrossRef] [PubMed]
- Capuzzi, S.J.; Muratov, E.N.; Tropsha, A. Phantom PAINS: Problems with the Utility of Alerts for Pan-Assay INterference Compounds. J. Chem. Inf. Model. 2017, 57, 417–427. [Google Scholar] [CrossRef]
- Baell, J.B.; Holloway, G.A. New substructure filters for removal of pan assay interference compounds (PAINS) from screening libraries and for their exclusion in bioassays. J. Med. Chem. 2010, 53, 2719–2740. [Google Scholar] [CrossRef]
- Waring, M.J.; Arrowsmith, J.; Leach, A.R.; Leeson, P.D.; Mandrell, S.; Owen, R.M.; Pairaudeau, G.; Pennie, W.D.; Pickett, S.D.; Wang, J.; et al. An analysis of the attrition of drug candidates from four major pharmaceutical companies. Nat. Rev. Drug Discov. 2015, 14, 475–486. [Google Scholar] [CrossRef]
- Lovering, F.; Bikker, J.; Humblet, C. Escape from flatland: Increasing saturation as an approach to improving clinical success. J. Med. Chem. 2009, 52, 6752–6756. [Google Scholar] [CrossRef]
- Nguyen, T.T.; Duong, V.A.; Maeng, H.J. Pharmaceutical Formulations with P-Glycoprotein Inhibitory Effect as Promising Approaches for Enhancing Oral Drug Absorption and Bioavailability. Pharmaceutics 2021, 13, 1103. [Google Scholar] [CrossRef] [PubMed]
- Boobis, A.; Gundert-Remy, U.; Kremers, P.; Macheras, P.; Pelkonen, O. In silico prediction of ADME and pharmacokinetics. Report of an expert meeting organised by COST B15. Eur. J. Pharm. Sci. 2002, 17, 183–193. [Google Scholar] [CrossRef]
- Kratochwil, N.A.; Huber, W.; Müller, F.; Kansy, M.; Gerber, P.R. Predicting Plasma Protein Binding of Drugs: A New Approach. Biochem. Pharmacol. 2002, 64, 1355–1374. [Google Scholar] [CrossRef]
- Van De Waterbeemd, H.; Gifford, E. ADMET in silico modelling: Towards prediction paradise? Nat. Rev. Drug Discov. 2003, 2, 192–204. [Google Scholar] [CrossRef]
- Babalola, S.; Igie, N.; Odeyemi, I. Molecular Docking, Drug-Likeness Analysis, In Silico Pharmacokinetics, and Toxicity Studies of p-Nitrophenyl Hydrazones as Anti-inflammatory Compounds against COX-2, 5-LOX, and H+/K+ ATPase. Pharm. Fronts 2022, 4, e250–e266. [Google Scholar] [CrossRef]
- Bersuder, P.; Hole, M.; Smith, G. Antioxidants from a heated histidine-glucose model system. I: Investigation of the antioxidant role of histidine and isolation of antioxidants by high-performance liquid chromatography. J. Am. Oil Chem. Soc. 1998, 75, 181–187. [Google Scholar] [CrossRef]
- Andrade-Cetto, A.; Becerra-Jiménez, J.; Cárdenas-Vázquez, R. Alfa-glucosidase-inhibiting activity of some Mexican plants used in the treatment of type 2 diabetes. J. Ethnopharmacol. 2008, 116, 27–32. [Google Scholar] [CrossRef]
- Subramanian, R.; Asmawi, M.Z.; Sadikun, A. In vitro alpha-glucosidase and alpha-amylase enzyme inhibitory effects of Andrographis paniculata extract and andrographolide. Acta Biochim. Polym. 2008, 55, 391–398. [Google Scholar] [CrossRef]
- Nicoletti, I.; Migliorati, G.; Pagliacci, M.; Grignani, F.; Riccardi, C. A rapid and simple method for measuring thymocyte apoptosis by propidium iodide staining and flow cytometry. J. Immunol. Methods 1991, 139, 271–279. [Google Scholar] [CrossRef]
- Bradford, M.M. A rapid and sensitive method for the quantitation of microgram quantities of protein utilizing the principle of protein-dye binding. Anal. Biochem. 1976, 72, 248–254. [Google Scholar] [CrossRef]


| Comp. # (MW) | Mean Values of Half Maximal Inhibitory Potency in mg/mL ± SD (mM) |
|---|---|
| 3a (356.75) | 0.068 ± 0.004 (0.191 ± 0.011) |
| 3b (401.20) | 0.161 ± 0.016 (1.520 ± 0.039) |
| 3c (382.36) | 0.100 ± 0.014 (0.262 ± 0.037) |
| 3d (356.75) | 0.179 ± 0.016 (0.502 ± 0.045) |
| 3e (401.20) | 0.290 ± 0.028 (0.723 ± 0.070) |
| 3f (333.75) | 0.227 ± 0.010 (0.680 ± 0.030) |
| 3g (378.20) | 0.0625 ± 0.002 (0.165 ± 0.005) |
| 3h (359.36) | 0.325 ± 0.007 (0.904 ± 0.0195) |
| 5a (464.86) | 0.080 ± 0.002 (0.172 ± 0.004) |
| 5b (525.77) | 0.167 ± 0.010 (0.318 ± 0.019) |
| 5c (517.48) | 0.186 ± 0.006 (0.359 ± 0.012) |
| 5d (481.31) | 0.200 ± 0.028 (0.416 ± 0.058) |
| 5e (600.25) | 0.225 ± 0.021 (0.375 ± 0.035) |
| 5f (532.79) | 0.241 ± 0.013 (0.452 ± 0.024) |
| 5g (513.32) | 0.200 ± 0.014 (0.390 ± 0.027) |
| 5h (483.92) | 0.364 ± 0.020 (0.752 ± 0.041) |
| BHT (220.35) | 0.054 ± 0.006 (0.245 ± 0.027) |
| Comp. # | Mean Values of % Inhibition ± SD | |
|---|---|---|
| At 0.100 mg/mL | At 0.200 mg/mL (Fold) | |
| 3a | 57.000 ± 2.828 | 97.050 ± 1.344 (1.70) |
| 3b | 6.250 ± 1.768 | 10.750 ± 2.475 (1.72) |
| 3c | 9.850 ± 1.626 | 20.200 ± 1.131(2.05) |
| 3d | 20.200 ± 1.131 | 32.750 ± 2.475 (1.62) |
| 3e | 10.400 ± 1.697 | 15.650 ± 0.494975 (1.50) |
| 3f | 11.450 ± 0.778 | 26.750 ± 3.889 (2.34) |
| 3g | 60.000 ± 2.828 | 98.900 ± 1.556 (1.65) |
| 3h | 14.550 ± 0.636 | 27.650 ± 2.192 (1.900) |
| 5a | 34.200 ± 1.697 | 63.150 ± 5.869 (1.85) |
| 5b | 9.250 ± 1.768 | 19.500 ± 2.121 (2.11) |
| 5c | 18.650 ± 3.465 | 26.250 ± 4.031 (1.41) |
| 5d | 26.300 ± 1.839 | 44.050 ± 1.344 (1.68) |
| 5e | 31.000 ± 2.828 | 51.650 ± 4.879 (1.67) |
| 5f | 28.900 ± 2.687 | 52.000 ± 2.828 (1.80) |
| 5g | 14.250 ± 1.768 | 26.000 ± 2.828 (1.83) |
| 5h | 11.200 ± 0.990 | 28.900 ± 0.283 (2.58) |
| Celecoxib at 0.1 mg/mL | 100.000 ± 0.000 | ND 1 |
| Comp. # | Mean Values of % Inhibition ± SD | |
|---|---|---|
| At 0.1 mg/mL | At 0.2 mg/mL (Fold Change as Compared to 0.1 mg/mL) | |
| 3a | 53.500 ± 1.131 | 98.450 ± 1.344 (1.84) |
| 3b | 29.150 ± 2.192 | 42.350 ± 1.909 (1.45) |
| 3c | 17.800 ± 1.556 | 30.750 ± 1.7678 (0.2) |
| 3d | 33.500 ± 2.121 | 53.500 ± 2.121 (1.59) |
| 3e | 22.150 ± 1.202 | 35.950 ± 1.344 (1.62) |
| 3f | 21.500 ± 1.556 | 34.250 ± 1.768 (1.59) |
| 3g | 68.250 ± 4.596 | 100.000 ± 0.000 (1.7) |
| 3h | 29.850 ± 1.768 | 43.900 ± 1.556 (1.47) |
| 5a | 24.000 ± 1.697 | 38.900 ± 1.131 (1.62) |
| 5b | 14.500 ± 1.131 | 22.500 ± 1.697 (1.55) |
| 5c | 8.550 ± 1.061 | 14.300 ± 1.556 (1.67) |
| 5d | 13.850 ± 2.051 | 20.400 ± 1.980 (1.47) |
| 5e | 15.150 ± 1.768 | 19.650 ± 2.334 (1.29) |
| 5f | 31.950 ± 2.475 | 51.050 ± 3.606 (1.60) |
| 5g | 15.750 ± 2.050 | 27.700 ± 2.546 (1.75) |
| 5h | 15.350 ± 1.202 | 21.750 ± 1.344 (1.42) |
| Sodium Oxamate at 0.111 mg/mL (1 mM) | 100.000 ± 0.000 | ND 1 |
| Comp. # (MW) | Mean IC50 Values in µg/mL ± SD/(µM ± SD) | |
|---|---|---|
| COX-2 | LDHA | |
| 3a (356.75) | 100.380 ± 3.762/ (281.374 ± 10.545) | 97.516 ± 5.739/ (273.345 ± 16.087) |
| 3g (378.20) | 95.223 ± 8.329/ (251.780 ± 22.023) | 91.630 ± 11.837/ (242.279 ± 31.298) |
| Celecoxib (381.373) | 0.0517 × 10 −3 ± 0.0021 × 10 −3/ (0.136 × 10 −3 ± 0.006 × 10 −3) | ND 1 |
| Sodium oxamate (111.03) | ND 1 | 15.600 ± 0.849/ (140.503 ± 7.647) |
| Comp. # (MW) | Mean IC50 Values in µg/mL ± SD (µM ± SD) | |
|---|---|---|
| α-Glucosidase (AG) | α-Amylase (AA) | |
| 3a (356.75) | 11.200 ± 0.300 (31.395 ± 0.841) | 124.333 ± 4.042 (348.516 ± 11.330) |
| 3b (401.20) | 26.033 ± 0.503 (64.888 ± 1.254) | 17171.333 ± 4.163 (427.051± 10.376) |
| 3c (382.36) | 7.867 ± 0.306 (20.5 ± 0.800) | 92.000 ± 3.000 (240.611 ± 7.846) |
| 3d (356.75) | 37.200 ± 0.361 (104.275 ± 1.012) | 335.667 ± 3.055 (940.903 ± 8.563) |
| 3e (401.20) | 30.500 ± 0.819 (76.022 ± 2.041) | 252.00 ± 4.583 (628.116 ± 11.423) |
| 3f (333.75) | 5.233 ± 0.153 (15.679 ± 0.458) | 111.667 ± 3.512 (334.583 ± 10.523) |
| 3g (378.20) | 12.500 ± 0.889 (33.051 ± 2.351) | 179.333 ± 7.768 (474.175 ± 20.539) |
| 3h (359.36) | 4.633 ± 0.153 (12.882 ± 0.426) | 122.000 ± 4.583 (339.492 ± 12.753) |
| 5a (464.86) | 5.833 ± 0.252 (12.548 ± 0.542) | 86.667 ± 4.509 (186.437 ± 9.700) |
| 5b (525.77) | 37.033 ± 0.252 (70.436 ± 4.793) | 162.000 ± 5.568 (308.120 ± 10.590) |
| 5c (517.48) | 41.367 ± 1.002 (79.939 ± 1.936) | 197.333 ± 4.509 (381.335 ± 8.713) |
| 5d (481.31) | 38.100 ± 0.656 (79.159 ± 1.363) | 181.667 ± 5.508 (377.443 ± 11.444) |
| 5e (600.25) | 43.133 ± 2.055 (71.858 ± 3.424) | 150.333 ± 3.512 (250.451 ± 5.851) |
| 5f (532.79) | 23.600 ± 0.400 (44.295 ± 0.751) | 106.667 ± 5.033 (200.205 ± 9.446) |
| 5g (513.32) | 20.633 ± 0.737 (40.195 ± 1.436) | 339.000 ± 4.000 (660.407 ± 7.792) |
| 5h (483.92) | 6.100 ± 0.458 (12.605 ± 0.946) | 117.667 ± 3.055 (243.154 ± 6.313) |
| Quercetin (302.236) | 3.967 ± 0.208 (13.126 ± 0.688) | 121.667 ± 3.055 (402.566 ± 10.108) |
| Comp. # | Mean % of Viable Cells ± SD | ||
|---|---|---|---|
| LoVo | HCT-116 | HUVEC | |
| 3a | 23.500 ± 1.500 | 26.833 ± 1.258 | 97.000 ± 2.646 |
| 3b | 62.000 ± 3.606 | 70.667 ± 2.517 | ND 1 |
| 3c | 47.333 ± 2.517 | 65.000 ± 3.606 | 99.667 ± 0.577 |
| 3d | 87.000 ± 1.732 | 96.000 ± 1.732 | ND 1 |
| 3e | 90.667 ± 3.512 | 92.333 ± 2.517 | ND 1 |
| 3f | 22.667 ± 2.082 | 4.667 ± 0.577 | 99.667 ± 0.577 |
| 3g | 55.667 ± 3.055 | 42.333 ±2.517 | 98.667 ± 1.155 |
| 3h | 64.000 ± 3.000 | 70.333 ± 3.786 | ND 1 |
| 5a | 90.333 ± 1.528 | 89.667 ± 3.055 | ND 1 |
| 5b | 37.667 ± 2.517 | 60.333 ± 2.517 | 96.333 ± 0.577 |
| 5c | 78.333 ± 3.512 | 82.333 ± 2.517 | ND 1 |
| 5d | 76.000 ± 1.732 | 86.667 ± 1.528 | ND 1 |
| 5e | 64.333 ± 2.082 | 79.667 ± 2.517 | ND 1 |
| 5f | 84.333 ± 3.512 | 76.000 ± 1.732 | ND 1 |
| 5g | 74.667 ± 2.517 | 66.333 ± 3.055 | ND 1 |
| 5h | 81.667 ± 3.055 | 91.000 ± 2.646 | ND 1 |
| Positive Control (Triton X-100, 0.1%) | 0.000 | 0.000 | ND 1 |
| Negative Control (Assay medium) 5-FU | 99.500 ± 0.707 | 100.000 ± 0.000 | 57.333 ± 2.517 |
| Comp. # (MW) | Mean IC50 Values in µg/mL/(µM) ± SD | ||
|---|---|---|---|
| LoVo Cells | HCT-116 Cells | HUVEC | |
| 3a (356.75) | 105.000 ± 3.000/ (294.324 ± 8.409) | 106.333 ± 4.726/ (298.060 ± 13.247) | |
| 3c (382.36) | 275.333 ± 4.509/ (720.088 ± 11.792) | 281.000 ± 3.606/ (734.910 ± 9.431) | |
| 3f (333.75) | 128.000 ± 3.000/ (383.521 ± 8.989) | 108.000 ± 1.000 (323.596 ± 2.996) | |
| 3g (378.20) | 221.667 ± 3.512/ (586.111 ± 9.286) | 168.333 ± 3.512/ (444.090 ± 9.286) | |
| 5b (525.77) | 161.000 ± 3.606/ (306.218 ± 6.859) | 246.000 ± 1.732/ (467.885 ± 3.294) | |
| 5-FU (130.08) | 2.910 ± 0.028/ (22.371 ± 0.215) | 11.850 ± 0.354/ (91.098 ± 2.721) | 298.500 ± 19.092 (2294 ± 146.77) |
| Comp.# | Binding Energies (kcal/mol) | |
|---|---|---|
| α-Amylase | α-Glucosidase | |
| 3c | −8.7 | −5.6 |
| 3f | −8.4 | −5.2 |
| 3h | −9.1 | −4.8 |
| 5a | −8.9 | −9.0 |
| 5f | −8.7 | ND 1 |
| 5h | −8.4 | −5.7 |
| Quercetin | −9.3 | −7.0 |
| Acarbose | −5.4 | 1 ND |
| 1-Deoxynojirimycin | 1 ND | −5.7 |
| Comp.# | MW1 | nHA1 | nHD1 | nRot1 | TPSA1 | LogS1 | Logp1 | LogD1 | Fsp3 | nRig |
|---|---|---|---|---|---|---|---|---|---|---|
| 3a | 356.00 | 3 | 1 | 2 | 37.79 | −4.594 | 3.762 | 3.732 | 0.067 | 19 |
| 3c | 382.06 | 5 | 1 | 4 | 56.25 | −4.421 | 2.886 | 3.295 | 0.176 | 19 |
| 3f | 333.00 | 6 | 1 | 2 | 80.83 | −4.032 | 2.871 | 2.633 | 0 | 20 |
| 3g | 376.95 | 6 | 1 | 2 | 80.93 | −4.102 | 3.076 | 2.493 | 0 | 20 |
| 3h | 359.06 | 8 | 1 | 4 | 99.39 | −3.934 | 2.011 | 2.284 | 0.125 | 20 |
| 5a | 464.04 | 3 | 0 | 5 | 34.89 | −7.104 | 5.561 | 4.422 | 0.091 | 24 |
| 5b | 523.96 | 3 | 0 | 5 | 34.89 | −7.588 | 6.153 | 4.22 | 0.091 | 24 |
| 5c | 517.09 | 8 | 0 | 8 | 96.49 | −6.868 | 4.228 | 3.921 | 0.167 | 25 |
| 5d | 480.01 | 3 | 0 | 5 | 34.89 | −7.543 | 6.039 | 4.385 | 0.091 | 24 |
| 5e | 597.92 | 4 | 0 | 6 | 44.12 | −7.779 | 6.228 | 4.13 | 0.13 | 24 |
| 5f | 530.97 | 7 | 0 | 6 | 87.26 | −7.54 | 5.344 | 4.046 | 0.091 | 25 |
| 5h | 483.07 | 3 | 0 | 7 | 96.49 | −6.87 | 4.192 | 3.788 | 0.13 | 25 |
| Comp. # | QED 1 | Lipinski | Pfizer | Golden Triangle |
|---|---|---|---|---|
| 3a | 0.641 | Accepted | Rejected | Accepted |
| 3c | 0.64 | Accepted | Accepted | Accepted |
| 3f | 0.441 | Accepted | Accepted | Accepted |
| 3g | 0.419 | Accepted | Accepted | Accepted |
| 3h | 0.437 | Accepted | Accepted | Accepted |
| 5a | 0.197 | Accepted | Rejected | Accepted |
| 5b | 0.21 | Rejected | Rejected | Rejected |
| 5c | 0.136 | Accepted | Accepted | Rejected |
| 5d | 0.233 | Accepted | Rejected | Accepted |
| 5e | 0.179 | Rejected | Rejected | Rejected |
| 5f | 0.131 | Rejected | Accepted | Rejected |
| 5h | 0.153 | Accepted | Accepted | Accepted |
| Gene | Primer Sequence (5′ to 3′) |
|---|---|
| Bax | F 5′-TCAGGATGCGTCCACCAAGAAG-3′,R 5′-TGTGTCCACGGCGGCAATCATC-3′. |
| Bcl-2 | F 5′-ATCGCCCTGTGGATGACTGAGT -3′,R 5′-GCCAGGAGAAATCAAACAGAGGC-3′. |
| Caspase 3 | F 5′-GGAAGCGAATCAATGGACTCTGG-3′,R 5’-GCATCGACATCTGTACCAGACC -3′. |
| GAPDH | F 5′-GTCTCCTCTGACTTCAACAGCG-3′ R 5′-ACCACCCTGTTGCTGTAGCCAA-3′ |
Disclaimer/Publisher’s Note: The statements, opinions and data contained in all publications are solely those of the individual author(s) and contributor(s) and not of MDPI and/or the editor(s). MDPI and/or the editor(s) disclaim responsibility for any injury to people or property resulting from any ideas, methods, instructions or products referred to in the content. |
© 2023 by the authors. Licensee MDPI, Basel, Switzerland. This article is an open access article distributed under the terms and conditions of the Creative Commons Attribution (CC BY) license (https://creativecommons.org/licenses/by/4.0/).
Share and Cite
El-Sayed, N.N.E.; Al-Otaibi, T.M.; Barakat, A.; Almarhoon, Z.M.; Hassan, M.Z.; Al-Zaben, M.I.; Krayem, N.; Masand, V.H.; Ben Bacha, A. Synthesis and Biological Evaluation of Some New 3-Aryl-2-thioxo-2,3-dihydroquinazolin-4(1H)-ones and 3-Aryl-2-(benzylthio)quinazolin-4(3H)-ones as Antioxidants; COX-2, LDHA, α-Glucosidase and α-Amylase Inhibitors; and Anti-Colon Carcinoma and Apoptosis-Inducing Agents. Pharmaceuticals 2023, 16, 1392. https://doi.org/10.3390/ph16101392
El-Sayed NNE, Al-Otaibi TM, Barakat A, Almarhoon ZM, Hassan MZ, Al-Zaben MI, Krayem N, Masand VH, Ben Bacha A. Synthesis and Biological Evaluation of Some New 3-Aryl-2-thioxo-2,3-dihydroquinazolin-4(1H)-ones and 3-Aryl-2-(benzylthio)quinazolin-4(3H)-ones as Antioxidants; COX-2, LDHA, α-Glucosidase and α-Amylase Inhibitors; and Anti-Colon Carcinoma and Apoptosis-Inducing Agents. Pharmaceuticals. 2023; 16(10):1392. https://doi.org/10.3390/ph16101392
Chicago/Turabian StyleEl-Sayed, Nahed Nasser Eid, Taghreed M. Al-Otaibi, Assem Barakat, Zainab M. Almarhoon, Mohd. Zaheen Hassan, Maha I. Al-Zaben, Najeh Krayem, Vijay H. Masand, and Abir Ben Bacha. 2023. "Synthesis and Biological Evaluation of Some New 3-Aryl-2-thioxo-2,3-dihydroquinazolin-4(1H)-ones and 3-Aryl-2-(benzylthio)quinazolin-4(3H)-ones as Antioxidants; COX-2, LDHA, α-Glucosidase and α-Amylase Inhibitors; and Anti-Colon Carcinoma and Apoptosis-Inducing Agents" Pharmaceuticals 16, no. 10: 1392. https://doi.org/10.3390/ph16101392
APA StyleEl-Sayed, N. N. E., Al-Otaibi, T. M., Barakat, A., Almarhoon, Z. M., Hassan, M. Z., Al-Zaben, M. I., Krayem, N., Masand, V. H., & Ben Bacha, A. (2023). Synthesis and Biological Evaluation of Some New 3-Aryl-2-thioxo-2,3-dihydroquinazolin-4(1H)-ones and 3-Aryl-2-(benzylthio)quinazolin-4(3H)-ones as Antioxidants; COX-2, LDHA, α-Glucosidase and α-Amylase Inhibitors; and Anti-Colon Carcinoma and Apoptosis-Inducing Agents. Pharmaceuticals, 16(10), 1392. https://doi.org/10.3390/ph16101392