
Evaluation of the Cardiac Electrophysiological and Haemodynamic Effects of Elsholtzia ciliata Essential Oil on Swine

 ,
,  ,
,  ,
,  , and
, and 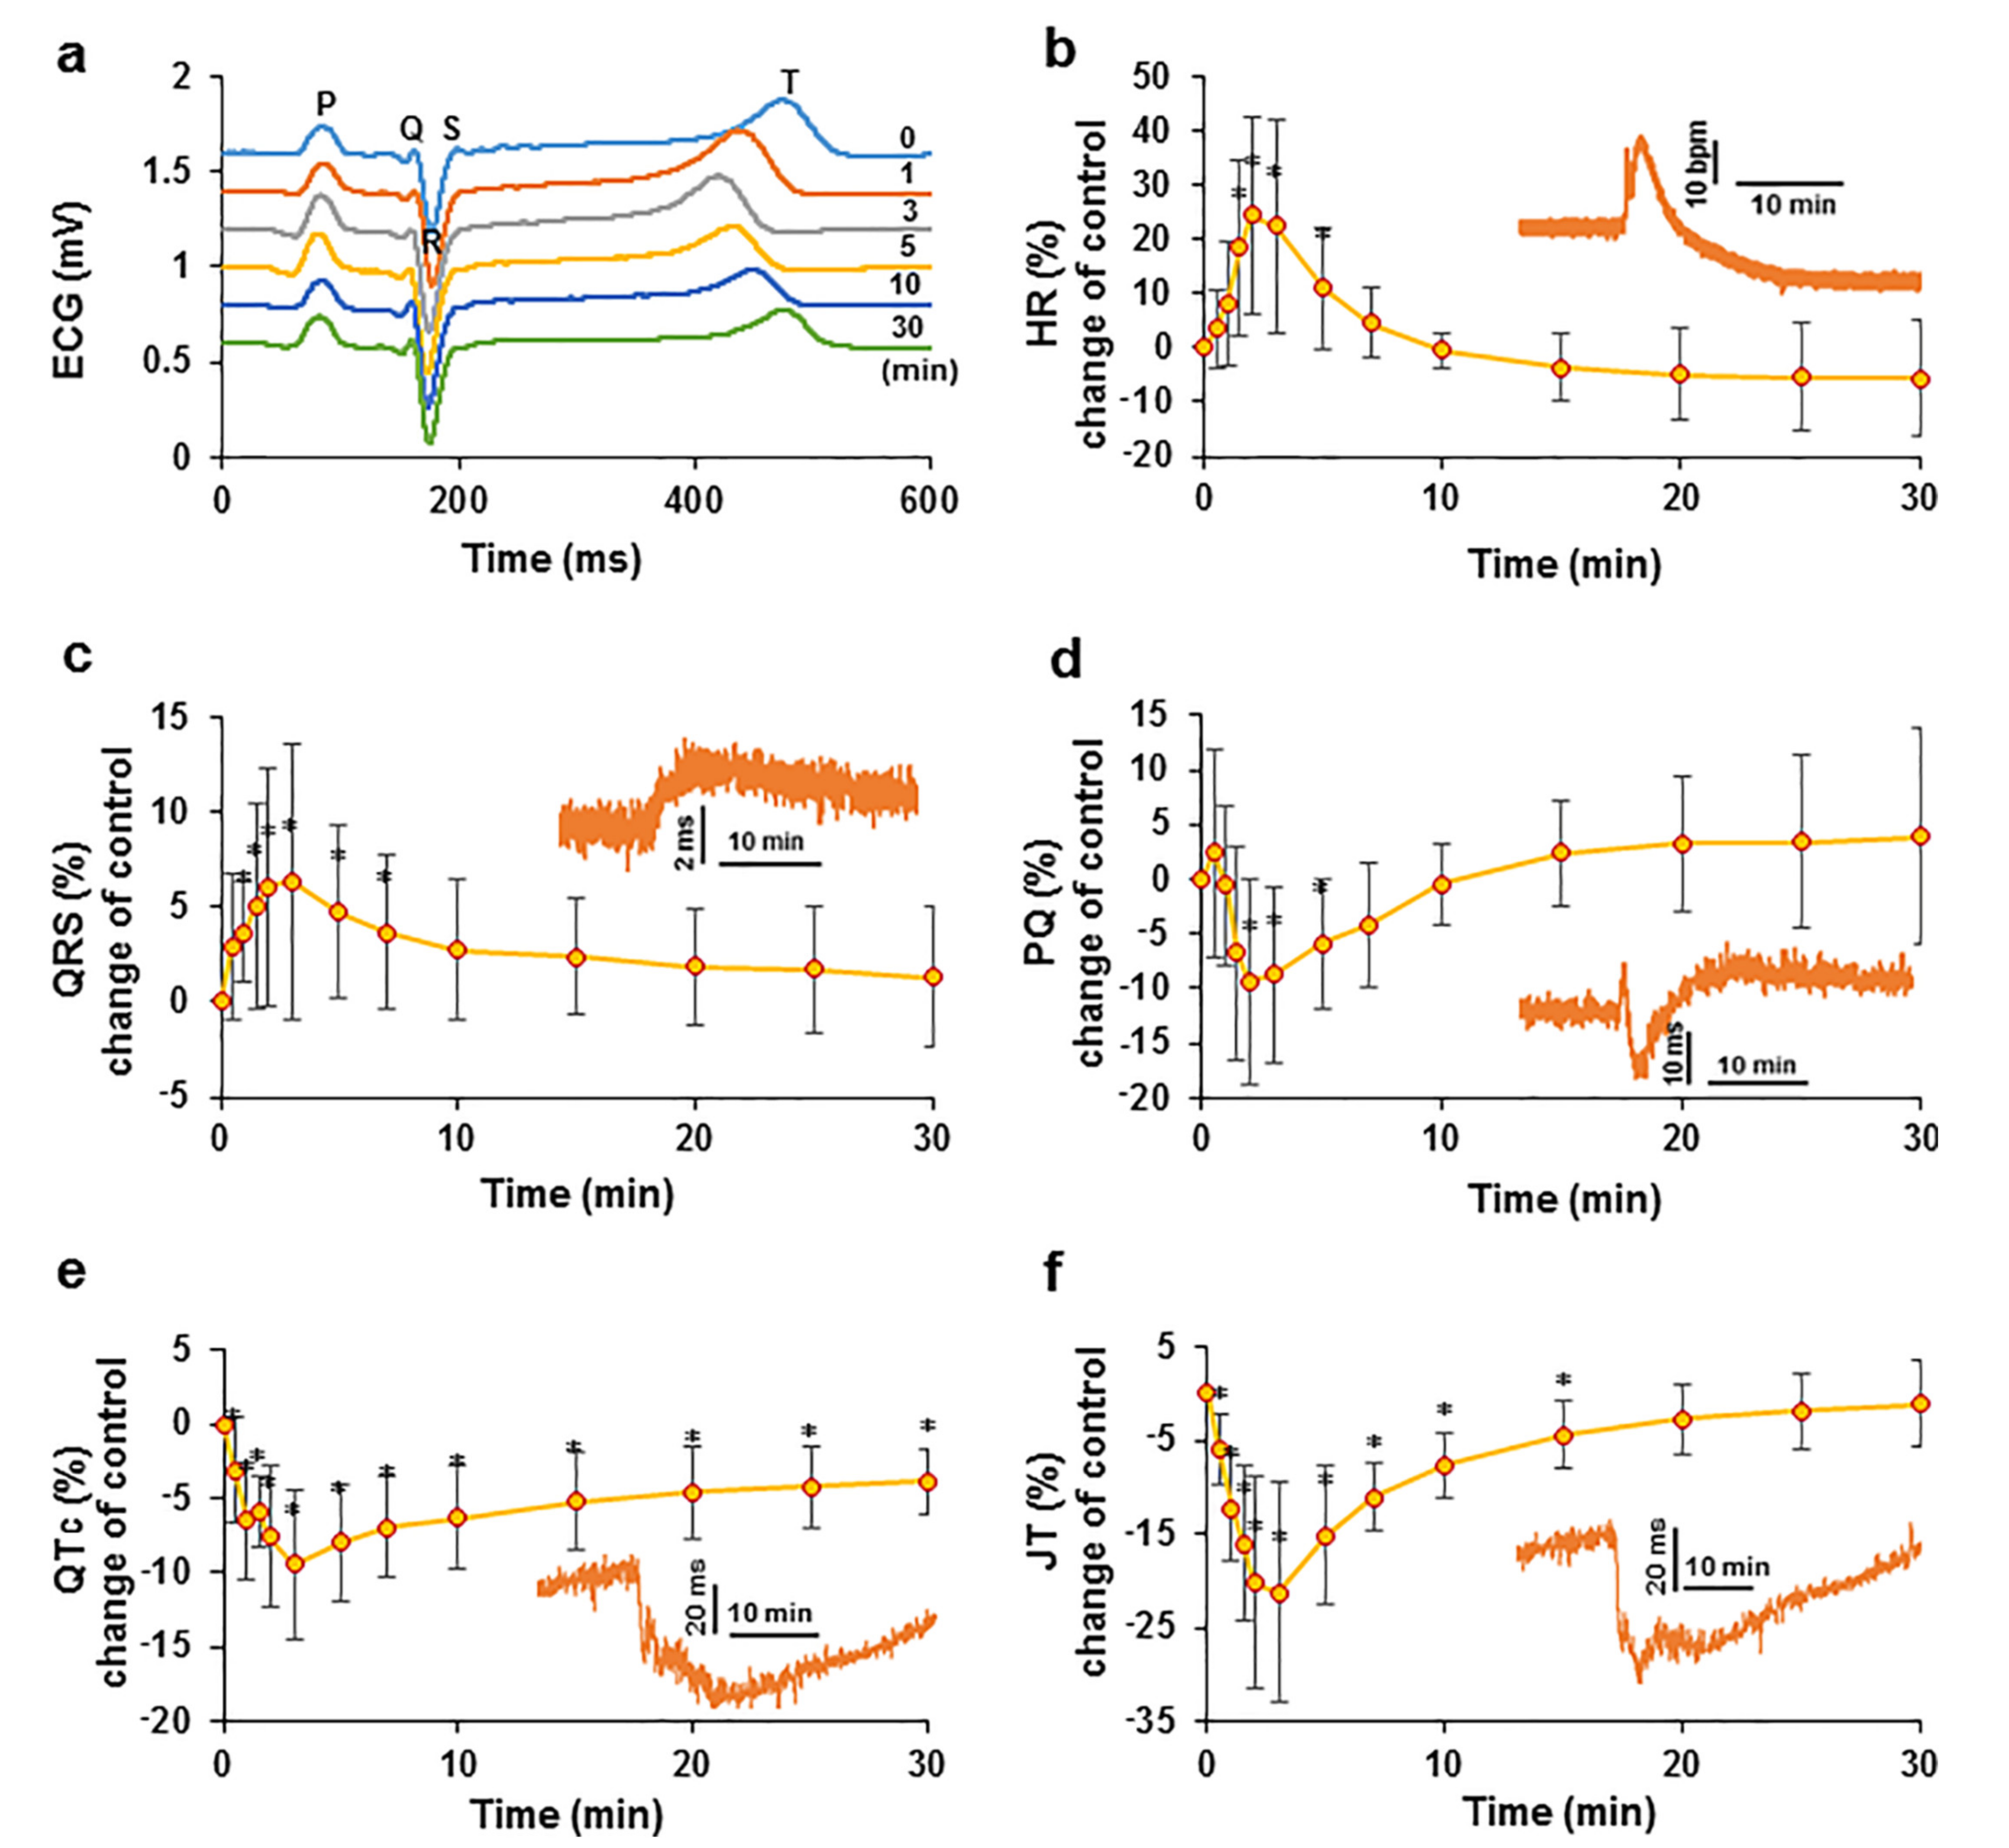
Abstract
:1. Introduction
2. Results
2.1. Effect of Elsholtzia ciliata on ECG Parameters
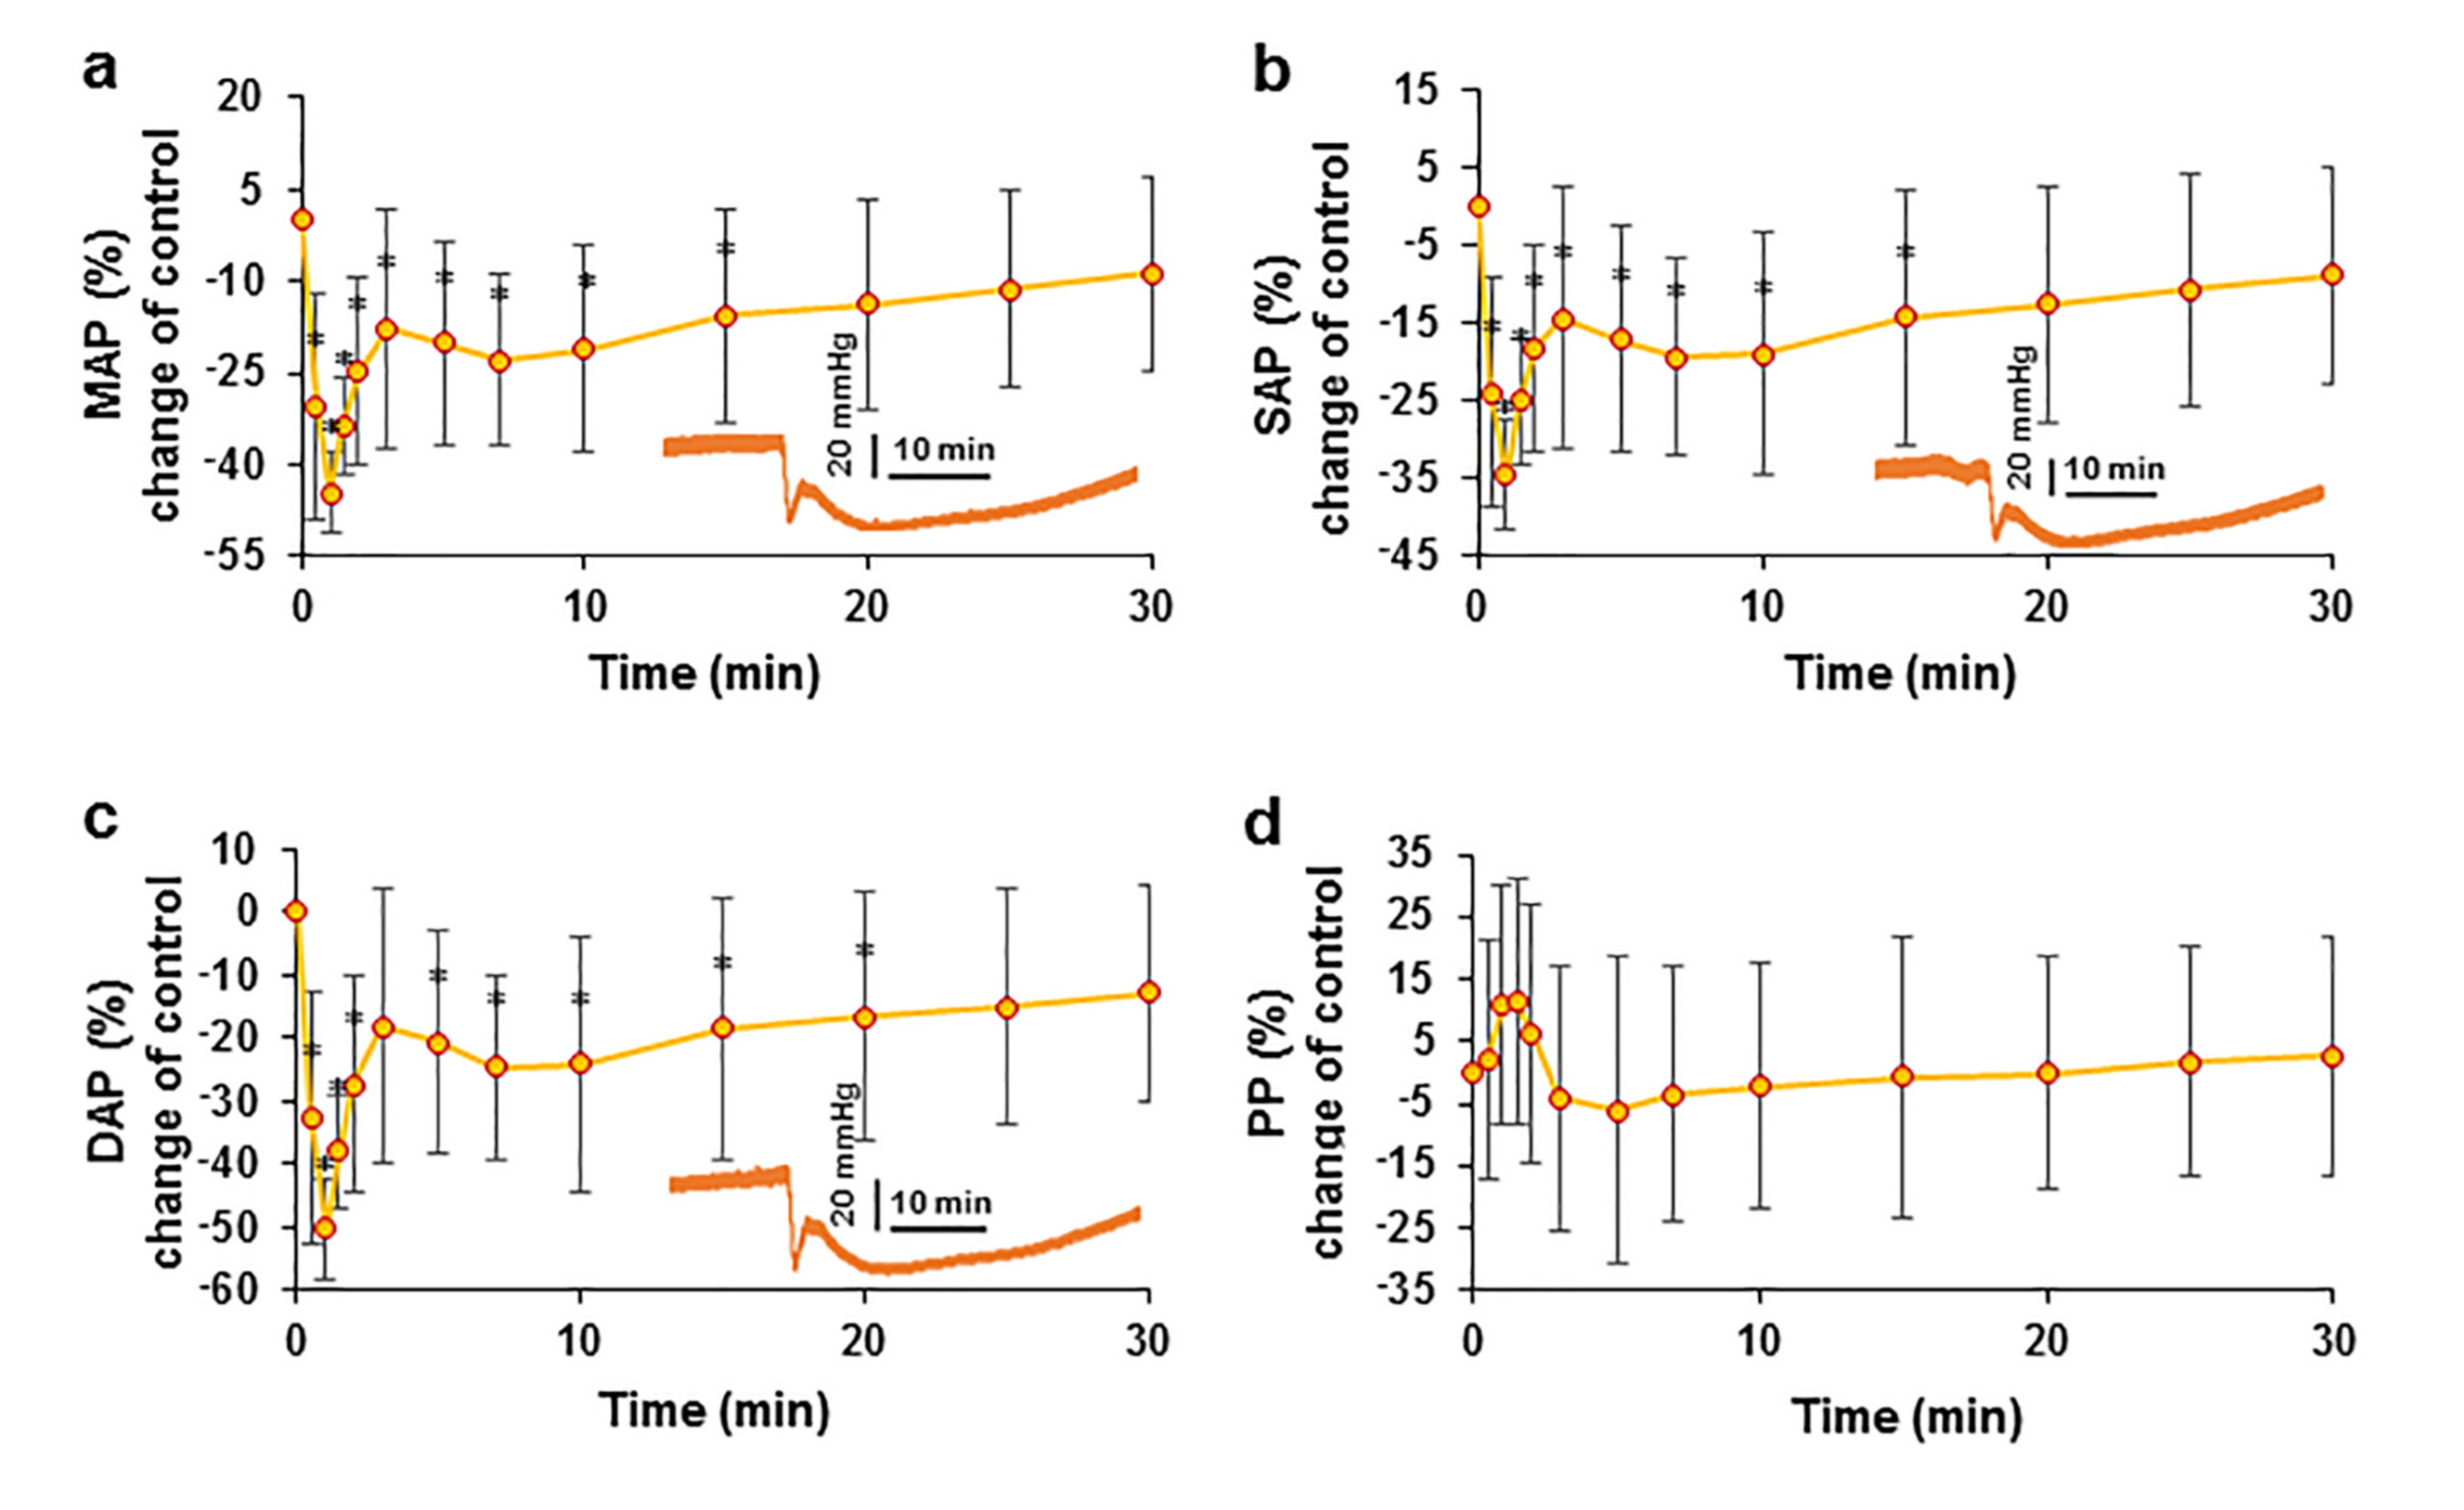
2.2. Effect of EO on Arterial Blood Pressure
2.3. Evaluation of the Relationship between Blood Pressure and HR after the Administration of the EO Bolus
2.4. Effects of EO on Heart Rate Variability
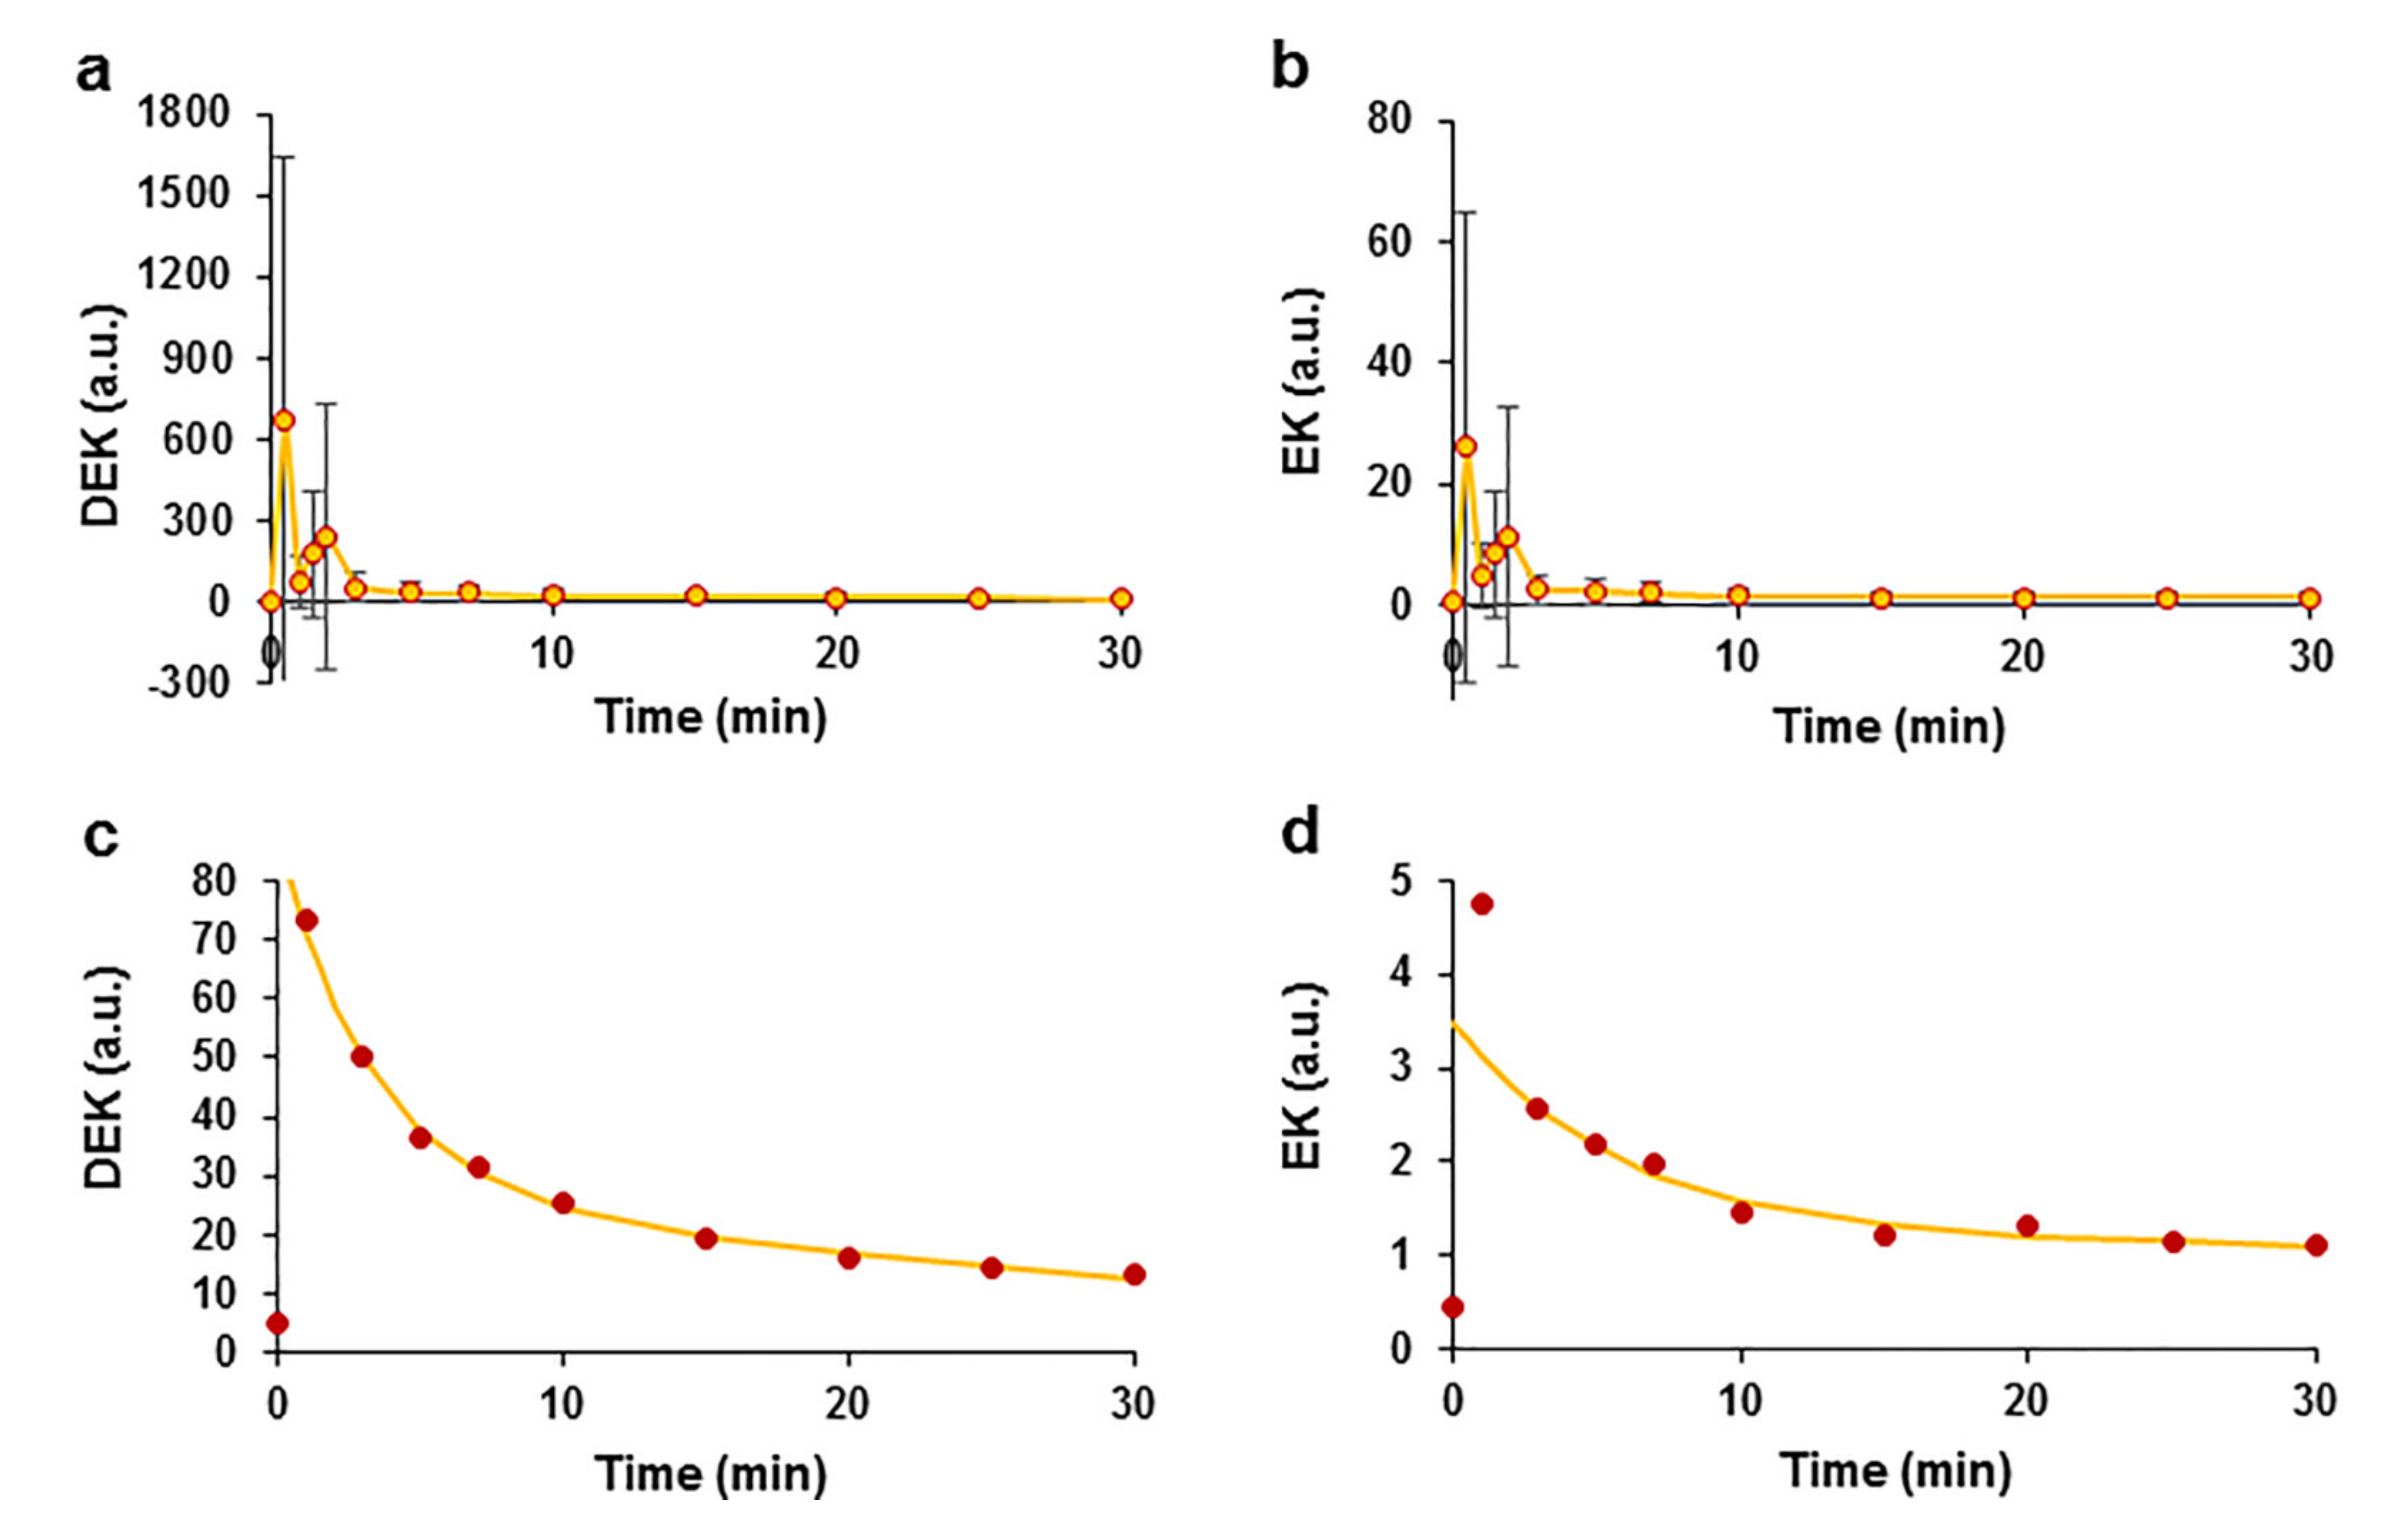
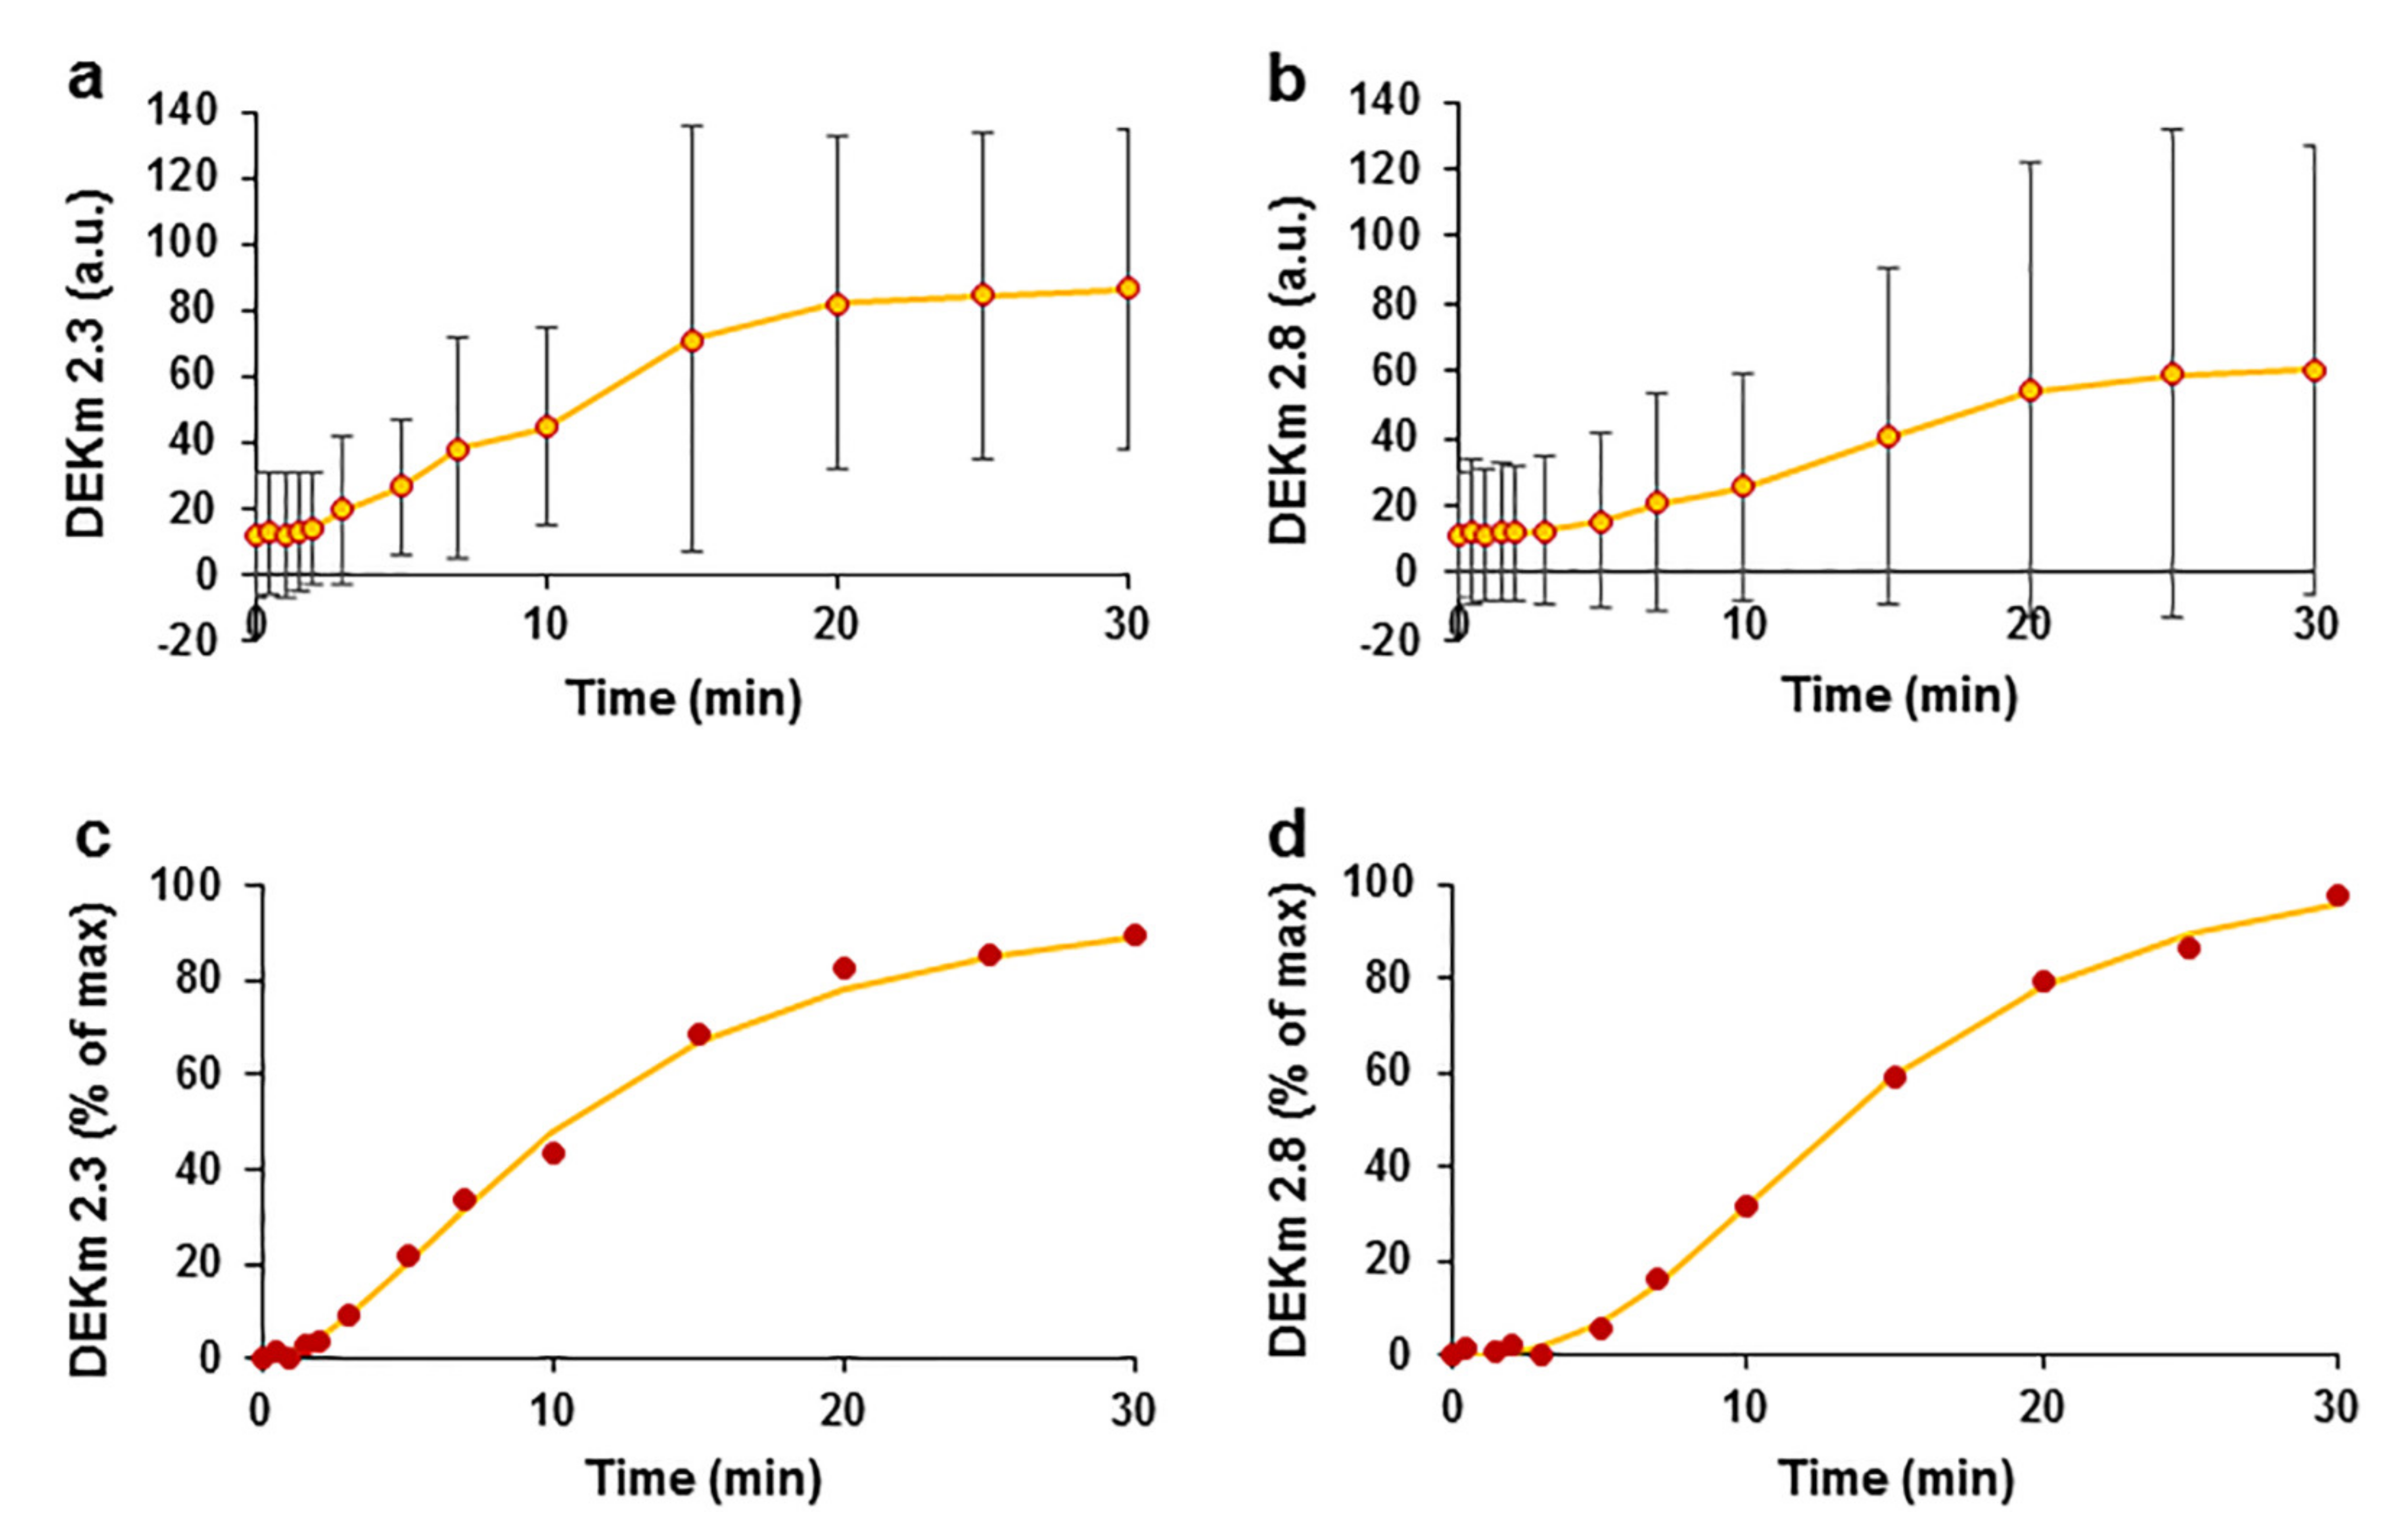
2.5. Kinetic Profile of EO Phytochemicals after Intravenous Bolus
2.6. The Effect of EO on Blood Parameters
3. Discussion
4. Materials and Methods
4.1. Animals
4.2. Materials
4.3. Experimental Protocol
4.4. Time of Measurements
4.5. Measured Parameters
4.6. Plasma Preparation for the Pharmacokinetic Analysis
4.7. Ultraperformance Liquid Chromatography–Electrospray Ionization–Tandem Mass Spectrometry (UPLC–ESI–MS/MS) Analysis of Plasma Samples
4.8. Blood Parameters
4.9. Statistical Analysis
5. Conclusions
Supplementary Materials
Author Contributions
Funding
Institutional Review Board Statement
Informed Consent Statement
Data Availability Statement
Acknowledgments
Conflicts of Interest
References
- Shenasa, M.; Shenasa, H. Hypertension, Left Ventricular Hypertrophy, and Sudden Cardiac Death. Int. J. Cardiol. 2017, 237, 60–63. [Google Scholar] [CrossRef] [PubMed]
- Srinivasan, N.T.; Schilling, R.J. Sudden Cardiac Death and Arrhythmias. Arrhythmia Electrophysiol. Rev. 2018, 7, 111. [Google Scholar] [CrossRef]
- Schiweck, C.; Piette, D.; Berckmans, D.; Claes, S.; Vrieze, E. Heart Rate and High Frequency Heart Rate Variability during Stress as Biomarker for Clinical Depression. A Systematic Review. Psychol. Med. 2019, 49, 200–211. [Google Scholar] [CrossRef] [PubMed]
- Darbar, D.; Roden, D.M. Future of Antiarrhythmic Drugs. Curr. Opin. Cardiol. 2006, 21, 361–367. [Google Scholar] [CrossRef] [PubMed]
- Godfraind, T. Discovery and Development of Calcium Channel Blockers. Front. Pharmacol. 2017, 8, 286. [Google Scholar] [CrossRef] [Green Version]
- Andersen, S.S.; Hansen, M.L.; Gislason, G.H.; Schramm, T.K.; Folke, F.; Fosbol, E.; Abildstrom, S.Z.; Madsen, M.; Kober, L.; Torp-Pedersen, C. Antiarrhythmic Therapy and Risk of Death in Patients with Atrial Fibrillation: A Nationwide Study. Europace 2009, 11, 886–891. [Google Scholar] [CrossRef]
- Malhotra, S.; Das, M.K. Delayed and Indirect Effects of Antiarrhythmic Drugs in Reducing Sudden Cardiac Death. Future Cardiol. 2011, 7, 203–217. [Google Scholar] [CrossRef]
- Camm, A.J. Hopes and Disappointments with Antiarrhythmic Drugs. Int. J. Cardiol. 2017, 237, 71–74. [Google Scholar] [CrossRef]
- D’Souza, S.P.; Chavannavar, S.V.; Kanchanashri, B.; Niveditha, S.B. Pharmaceutical Perspectives of Spices and Condiments as Alternative Antimicrobial Remedy. J. Evid.-Based Complementary Altern. Med. 2017, 22, 1002–1010. [Google Scholar] [CrossRef] [Green Version]
- Tongnuanchan, P.; Benjakul, S. Essential Oils: Extraction, Bioactivities, and Their Uses for Food Preservation. J. Food Sci. 2014, 79, R1231–R1249. [Google Scholar] [CrossRef]
- Wińska, K.; Mączka, W.; Łyczko, J.; Grabarczyk, M.; Czubaszek, A.; Szumny, A. Essential Oils as Antimicrobial Agents—Myth or Real Alternative? Molecules 2019, 24, 2130. [Google Scholar] [CrossRef] [PubMed] [Green Version]
- Aguiar, F.C.; Solarte, A.L.; Gómez-Gascón, L.; Galán-Relaño, A.; Luque, I.; Tarradas, C.; Rodríguez-Ortega, M.J.; Huerta, B. Antimicrobial Susceptibility of Cinnamon and Red and Common Thyme Essential Oils and Their Main Constituent Compounds against Streptococcus suis. Lett. Appl. Microbiol. 2022, 74, 63–72. [Google Scholar] [CrossRef] [PubMed]
- Fratini, F.; Forzan, M.; Turchi, B.; Mancini, S.; Alcamo, G.; Pedonese, F.; Pistelli, L.; Najar, B.; Mazzei, M. In Vitro Antibacterial Activity of Manuka (Leptospermum scoparium J.R. et G. Forst) and Winter Savory (Satureja montana L.) Essential Oils and Their Blends against Pathogenic E. coli Isolates from Pigs. Animals 2020, 10, 2202. [Google Scholar] [CrossRef] [PubMed]
- Sharifi-Rad, J.; Soufi, L.; Ayatollahi, S.A.M.; Iriti, M.; Sharifi-Rad, M.; Varoni, E.M.; Shahri, F.; Esposito, S.; Kuhestani, K.; Sharifi-Rad, M. Anti-Bacterial Effect of Essential Oil from Xanthium Strumarium against Shiga Toxin-Producing Escherichia coli. Cell Mol. Biol. 2016, 62, 69–74. [Google Scholar]
- Wu, Z.; Tan, B.; Liu, Y.; Dunn, J.; Martorell Guerola, P.; Tortajada, M.; Cao, Z.; Ji, P. Chemical Composition and Antioxidant Properties of Essential Oils from Peppermint, Native Spearmint and Scotch Spearmint. Molecules 2019, 24, 2825. [Google Scholar] [CrossRef] [Green Version]
- Aljeldah, M.M. Antioxidant and Antimicrobial Potencies of Chemically-Profiled Essential Oil from Asteriscus graveolens against Clinically-Important Pathogenic Microbial Strains. Molecules 2022, 27, 3539. [Google Scholar] [CrossRef]
- Cardia, G.F.E.; Silva-Comar, F.M.D.S.; Silva, E.L.; da Rocha, E.M.T.; Comar, J.F.; Silva-Filho, S.E.; Zagotto, M.; Uchida, N.S.; Bersani-Amado, C.A.; Cuman, R.K.N. Lavender (Lavandula officinalis) essential oil prevents acetaminophen-induced hepatotoxicity by decreasing oxidative stress and inflammatory response. Res. Soc. Dev. 2021, 10, e43410313461. [Google Scholar] [CrossRef]
- Brochot, A.; Guilbot, A.; Haddioui, L.; Roques, C. Antibacterial, Antifungal, and Antiviral Effects of Three Essential Oil Blends. Microbiologyopen 2017, 6, e00459. [Google Scholar] [CrossRef]
- Okano, S.; Honda, Y.; Kodama, T.; Kimura, M. The Effects of Frankincense Essential Oil on Stress in Rats. J. Oleo Sci. 2019, 68, 1003–1009. [Google Scholar] [CrossRef] [Green Version]
- Pereira, G.L.D.C.; Almeida, T.C.; Seibert, J.B.; Amparo, T.R.; Soares, R.D.D.O.A.; Rodrigues, I.V.; de Souza, G.H.B.; dos Santos, O.D.H.; da Silva, G.N. Antitumor Effect of Cymbopogon densiflorus (Linneu) Essential Oil in Bladder Cancer Cells. Nat. Prod. Res. 2021, 35, 5238–5242. [Google Scholar] [CrossRef]
- Lee, G.; Park, J.; Kim, M.S.; Seol, G.H.; Min, S.S. Analgesic Effects of Eucalyptus Essential Oil in Mice. Korean J. Pain 2019, 32, 79–86. [Google Scholar] [CrossRef] [PubMed] [Green Version]
- Labib, R.M.; Ayoub, I.M.; Michel, H.E.; Mehanny, M.; Kamil, V.; Hany, M.; Magdy, M.; Moataz, A.; Maged, B.; Mohamed, A. Appraisal on the Wound Healing Potential of Melaleuca Alternifolia and Rosmarinus officinalis L. Essential Oil-Loaded Chitosan Topical Preparations. PLoS ONE 2019, 14, e0219561. [Google Scholar] [CrossRef]
- Guo, Z.; Liu, Z.; Wang, X.; Liu, W.; Jiang, R.; Cheng, R.; She, G. Elsholtzia: Phytochemistry and Biological Activities. Chem. Cent. J. 2012, 6, 147. [Google Scholar] [CrossRef] [PubMed] [Green Version]
- Tian, G. Chemical Constituents in Essential Oils from Elsholtzia ciliata and Their Antimicrobial Activities. Chin. Herb. Med. 2014, 4, 104–108. [Google Scholar]
- Pudziuvelyte, L.; Stankevicius, M.; Maruska, A.; Petrikaite, V.; Ragazinskiene, O.; Draksiene, G.; Bernatoniene, J. Chemical Composition and Anticancer Activity of Elsholtzia ciliata Essential Oils and Extracts Prepared by Different Methods. Ind. Crops Prod. 2017, 107, 90–96. [Google Scholar] [CrossRef]
- Mačianskienė, R.; Pudžiuvelytė, L.; Bernatonienė, J.; Almanaitytė, M.; Navalinskas, A.; Treinys, R.; Andriulė, I.; Jurevičius, J. Antiarrhythmic Properties of Elsholtzia ciliata Essential Oil on Electrical Activity of the Isolated Rabbit Heart and Preferential Inhibition of Sodium Conductance. Biomolecules 2020, 10, 948. [Google Scholar] [CrossRef] [PubMed]
- Bernatoniene, J.; Pudziuvelyte, L.; Jurevicius, J.; Macianskiene, R.; Simonyte, S. Elsholtzia Ciliata Essential Oil Extract as Antiarrhythmic Drug. WO Patent WO/2019/193400, 14 January 2021. [Google Scholar]
- Van Essen, G.J.; Hekkert, M.T.L.; Sorop, O.; Heinonen, I.; van der Velden, J.; Merkus, D.; Duncker, D.J. Cardiovascular Function of Modern Pigs Does Not Comply with Allometric Scaling Laws. Sci. Rep. 2018, 8, 792. [Google Scholar] [CrossRef] [Green Version]
- Muzykantov, V.R. Drug Delivery by Red Blood Cells: Vascular Carriers Designed by Mother Nature. Expert Opin. Drug Deliv. 2010, 7, 403–427. [Google Scholar] [CrossRef] [Green Version]
- Romagnoli, N.; Al-Qudah, K.M.; Armorini, S.; Lambertini, C.; Zaghini, A.; Spadari, A.; Roncada, P. Pharmacokinetic Profile and Partitioning in Red Blood Cells of Romifidine after Single Intravenous Administration in the Horse. Vet. Med. Sci. 2017, 3, 187–197. [Google Scholar] [CrossRef]
- Tian, M.; Peng, Y.; Zheng, J. Metabolic Activation and Hepatotoxicity of Furan-Containing Compounds. Drug Metab. Dispos. 2022, 50, 655–670. [Google Scholar] [CrossRef]
- Adams, P. Identification of Essential Oil Components by Gas Chromatography/Mass Spectrometry, 4th ed.; Allured Publishing Corporation: Carol Stream, IL, USA, 2019. [Google Scholar]
- Pingzhao, M.; Chaoliu, X.; Lai, D.; Zhou, L.; Longliu, Z. Analysis of the Essential Oil of Elsholtzia Ciliate Aerial Parts and Its Insecticidal Activities against Liposcelis bostrychophila. Helv. Chim. Acta 2016, 99, 90–94. [Google Scholar] [CrossRef]
- de Boer, R.W.; Karemaker, J.M. Cross-Wavelet Time-Frequency Analysis Reveals Sympathetic Contribution to Baroreflex Sensitivity as Cause of Variable Phase Delay between Blood Pressure and Heart Rate. Front. Neurosci. 2019, 13, 694. [Google Scholar] [CrossRef] [PubMed] [Green Version]
- Bertram, D.; Barrès, C.; Cuisinaud, G.; Julien, C. The Arterial Baroreceptor Reflex of the Rat Exhibits Positive Feedback Properties at the Frequency of Mayer Waves. J. Physiol. 1998, 513, 251–261. [Google Scholar] [CrossRef] [PubMed]
- Gulli, G.; Cooper, V.L.; Claydon, V.E.; Hainsworth, R. Prolonged Latency in the Baroreflex Mediated Vascular Resistance Response in Subjects with Postural Related Syncope. Clin. Auton. Res. 2005, 15, 207–212. [Google Scholar] [CrossRef] [PubMed]
- Von Borell, E.; Langbein, J.; Després, G.; Hansen, S.; Leterrier, C.; Marchant-Forde, J.; Marchant-Forde, R.; Minero, M.; Mohr, E.; Prunier, A.; et al. Heart Rate Variability as a Measure of Autonomic Regulation of Cardiac Activity for Assessing Stress and Welfare in Farm Animals—A Review. Physiol. Behav. 2007, 92, 293–316. [Google Scholar] [CrossRef]
- Shafi, T.; Mullangi, S.; Jaar, B.G.; Silber, H. Autonomic Dysfunction as a Mechanism of Intradialytic Blood Pressure Instability. Semin. Dial. 2017, 30, 537–544. [Google Scholar] [CrossRef]
- Gabor, A.; Leenen, F.H. Mechanisms of Sympathetic Regulation in Cardiovascular Disease Central Neuromodulatory Pathways Regulating Sympathetic Activity in Hypertension. J. Appl. Physiol. 2012, 113, 1294–1303. [Google Scholar] [CrossRef]
- Byrd, C.J.; Johnson, J.S.; Radcliffe, J.S.; Craig, B.A.; Eicher, S.D.; Lay, D.C. Nonlinear Analysis of Heart Rate Variability for Evaluating the Growing Pig Stress Response to an Acute Heat Episode. Animal 2020, 14, 379–387. [Google Scholar] [CrossRef]
- Robertson, D. Primer on the Autonomic Nervous System, 3rd ed.; Biaggioni, I., Burnstock, G., Low, A.P., Paton, F.R.J., Eds.; Elsvier: London, UK, 2012. [Google Scholar]
- Shaffer, F.; Ginsberg, J.P. An Overview of Heart Rate Variability Metrics and Norms. Front. Public Health 2017, 5, 258. [Google Scholar] [CrossRef] [Green Version]
- Armstrong, M.; Kerndt, C.C.; Moore, R.A. Physiology, Baroreceptors; StatPearls Publishing, LLC: Tampa, FL, USA, 2022. [Google Scholar]
- Bonyhay, I.; Freeman, R. Sympathetic Nerve Activity in Response to Hypotensive Stress in the Postural Tachycardia Syndrome. Circulation 2004, 110, 3193–3198. [Google Scholar] [CrossRef] [Green Version]
- Poletto, R.; Janczak, A.M.; Marchant-Forde, R.M.; Marchant-Forde, J.N.; Matthews, D.L.; Dowell, C.A.; Hogan, D.F.; Freeman, L.J.; Lay, D.C. Identification of Low and High Frequency Ranges for Heart Rate Variability and Blood Pressure Variability Analyses Using Pharmacological Autonomic Blockade with Atropine and Propranolol in Swine. Physiol. Behav. 2011, 103, 188–196. [Google Scholar] [CrossRef] [PubMed]
- Del Colle, S.; Morello, F.; Rabbia, F.; Milan, A.; Naso, D.; Puglisi, E.; Mulatero, P.; Veglio, F. Antihypertensive Drugs and the Sympathetic Nervous System. J. Cardiovasc. Pharmacol. 2007, 50, 487–496. [Google Scholar] [CrossRef] [PubMed]
- Grassi, G. Sympathomodulatory Effects of Antihypertensive Drug Treatment. Am. J. Hypertens. 2016, 29, 665–675. [Google Scholar] [CrossRef] [PubMed] [Green Version]
- Katsurada, K.; Kario, K. Sympathetic Modulation by Antihypertensive Drugs. J. Clin. Hypertens. 2021, 23, 1715–1717. [Google Scholar] [CrossRef] [PubMed]
- de Champlain, J.; Karas, M.; Toal, C.; Nadeau, R.; Larochelle, P. Effects of Antihypertensive Therapies on the Sympathetic Nervous System. Can. J. Cardiol. 1999, 15 (Suppl A), 8A–14A. [Google Scholar]
- Lefrant, J.-Y.; Muller, L.; de La Coussaye, J.E.; Lalourcey, L.; Ripart, J.; Peray, P.A.; Mazoit, X.; Dauzat, M.; Sassine, A.; Eledjam, J.-J. Hemodynamic and Cardiac Electrophysiologic Effects of Lidocaine–Bupivacaine Mixture in Anesthetized and Ventilated Piglets. Anesthesiology 2003, 98, 96–103. [Google Scholar] [CrossRef]
- McKeever, R.G.; Hamilton, R.J. Calcium Channel Blockers; StatPearls Publishing: Treasure Island, FL, USA, 2022. [Google Scholar]
- Freed, M.I.; Rastegar, A.; Bia, M.J. Effects of Calcium Channel Blockers on Potassium Homeostasis. Yale J. Biol. Med. 1191, 64, 177–186. [Google Scholar]
- Somers, M.P.; Brady, W.J.; Perron, A.D.; Mattu, A. The Prominant T Wave: Electrocardiographic Differential Diagnosis. Am. J. Emerg. Med. 2002, 20, 243–251. [Google Scholar] [CrossRef]
- Manoury, B.; Idres, S.; Leblais, V.; Fischmeister, R. Ion Channels as Effectors of Cyclic Nucleotide Pathways: Functional Relevance for Arterial Tone Regulation. Pharmacol. Ther. 2020, 209, 107499. [Google Scholar] [CrossRef]
- Yanagisawa, T.; Yamagishi, T.; Okada, Y. Hyperpolarization Induced by K+ Channel Openers Inhibits Ca2+ Influx and Ca2+ Release in Coronary Artery. Cardiovasc. Drugs Ther. 1993, 7, 565–574. [Google Scholar] [CrossRef]
- de Simone, G.; Pasanisi, F. Systolic, Diastolic and Pulse Pressure: Pathophysiology. Ital. Heart J. Suppl. 2001, 2, 359–362. [Google Scholar] [PubMed]
- King, D.R.; Entz, M.; Blair, G.A.; Crandell, I.; Hanlon, A.L.; Lin, J.; Hoeker, G.S.; Poelzing, S. The Conduction Velocity-Potassium Relationship in the Heart Is Modulated by Sodium and Calcium. Pflüg. Arch. Eur. J. Physiol. 2021, 473, 557–571. [Google Scholar] [CrossRef] [PubMed]
- Pudziuvelyte, L.; Liaudanskas, M.; Jekabsone, A.; Sadauskiene, I.; Bernatoniene, J. Elsholtzia ciliata (Thunb.) Hyl. Extracts from Different Plant Parts: Phenolic Composition, Antioxidant, and Anti-Inflammatory Activities. Molecules 2020, 25, 1153. [Google Scholar] [CrossRef] [PubMed] [Green Version]
- Chatterjee, A.; Dutta, U.; Bandyopadhyay, D.; Nayak, A.; Basak, B.; Banerji, A.; Banerji, J. An Overview of the Genus Nardostachys. Nat. Prod. Commun. 2007, 29110, 1763–1773. [Google Scholar] [CrossRef]
- Roullet, J.-B.; Luft, U.C.; Xue, H.; Chapman, J.; Bychkov, R.; Roullet, C.M.; Luft, F.C.; Haller, H.; McCarron, D.A. Farnesol Inhibits L-Type Ca2+ Channels in Vascular Smooth Muscle Cells. J. Biol. Chem. 1997, 272, 32240–32246. [Google Scholar] [CrossRef] [Green Version]
- Gonçalves, M.S.S.; Barreto, A.S. Nerolidol, a Sesquiterpene Alcohol, Attenuates Acute Myocardial Infarction in Rats; Research Square: Durham, NC, USA, 2021. [Google Scholar] [CrossRef]
- du Sert, N.P.; Hurst, V.; Ahluwalia, A.; Alam, S.; Avey, M.T.; Browne, W.J.; Clark, A. The ARRIVE Guidelines 2.0: Updated Guidelines for Reporting Animal Research. PLoS Biol. 2020, 18, e3000410. [Google Scholar] [CrossRef]


Publisher’s Note: MDPI stays neutral with regard to jurisdictional claims in published maps and institutional affiliations. |
© 2022 by the authors. Licensee MDPI, Basel, Switzerland. This article is an open access article distributed under the terms and conditions of the Creative Commons Attribution (CC BY) license (https://creativecommons.org/licenses/by/4.0/).
Share and Cite
Zigmantaitė, V.; Jonušaitė, E.; Grigalevičiūtė, R.; Kučinskas, A.; Treinys, R.; Navalinskas, A.; Žvikas, V.; Jakštas, V.; Pudžiuvelytė, L.; Bernatonienė, J.; et al. Evaluation of the Cardiac Electrophysiological and Haemodynamic Effects of Elsholtzia ciliata Essential Oil on Swine. Pharmaceuticals 2022, 15, 982. https://doi.org/10.3390/ph15080982
Zigmantaitė V, Jonušaitė E, Grigalevičiūtė R, Kučinskas A, Treinys R, Navalinskas A, Žvikas V, Jakštas V, Pudžiuvelytė L, Bernatonienė J, et al. Evaluation of the Cardiac Electrophysiological and Haemodynamic Effects of Elsholtzia ciliata Essential Oil on Swine. Pharmaceuticals. 2022; 15(8):982. https://doi.org/10.3390/ph15080982
Chicago/Turabian StyleZigmantaitė, Vilma, Eglė Jonušaitė, Ramunė Grigalevičiūtė, Audrius Kučinskas, Rimantas Treinys, Antanas Navalinskas, Vaidotas Žvikas, Valdas Jakštas, Lauryna Pudžiuvelytė, Jurga Bernatonienė, and et al. 2022. "Evaluation of the Cardiac Electrophysiological and Haemodynamic Effects of Elsholtzia ciliata Essential Oil on Swine" Pharmaceuticals 15, no. 8: 982. https://doi.org/10.3390/ph15080982
APA StyleZigmantaitė, V., Jonušaitė, E., Grigalevičiūtė, R., Kučinskas, A., Treinys, R., Navalinskas, A., Žvikas, V., Jakštas, V., Pudžiuvelytė, L., Bernatonienė, J., Mačianskienė, R., & Jurevičius, J. (2022). Evaluation of the Cardiac Electrophysiological and Haemodynamic Effects of Elsholtzia ciliata Essential Oil on Swine. Pharmaceuticals, 15(8), 982. https://doi.org/10.3390/ph15080982