
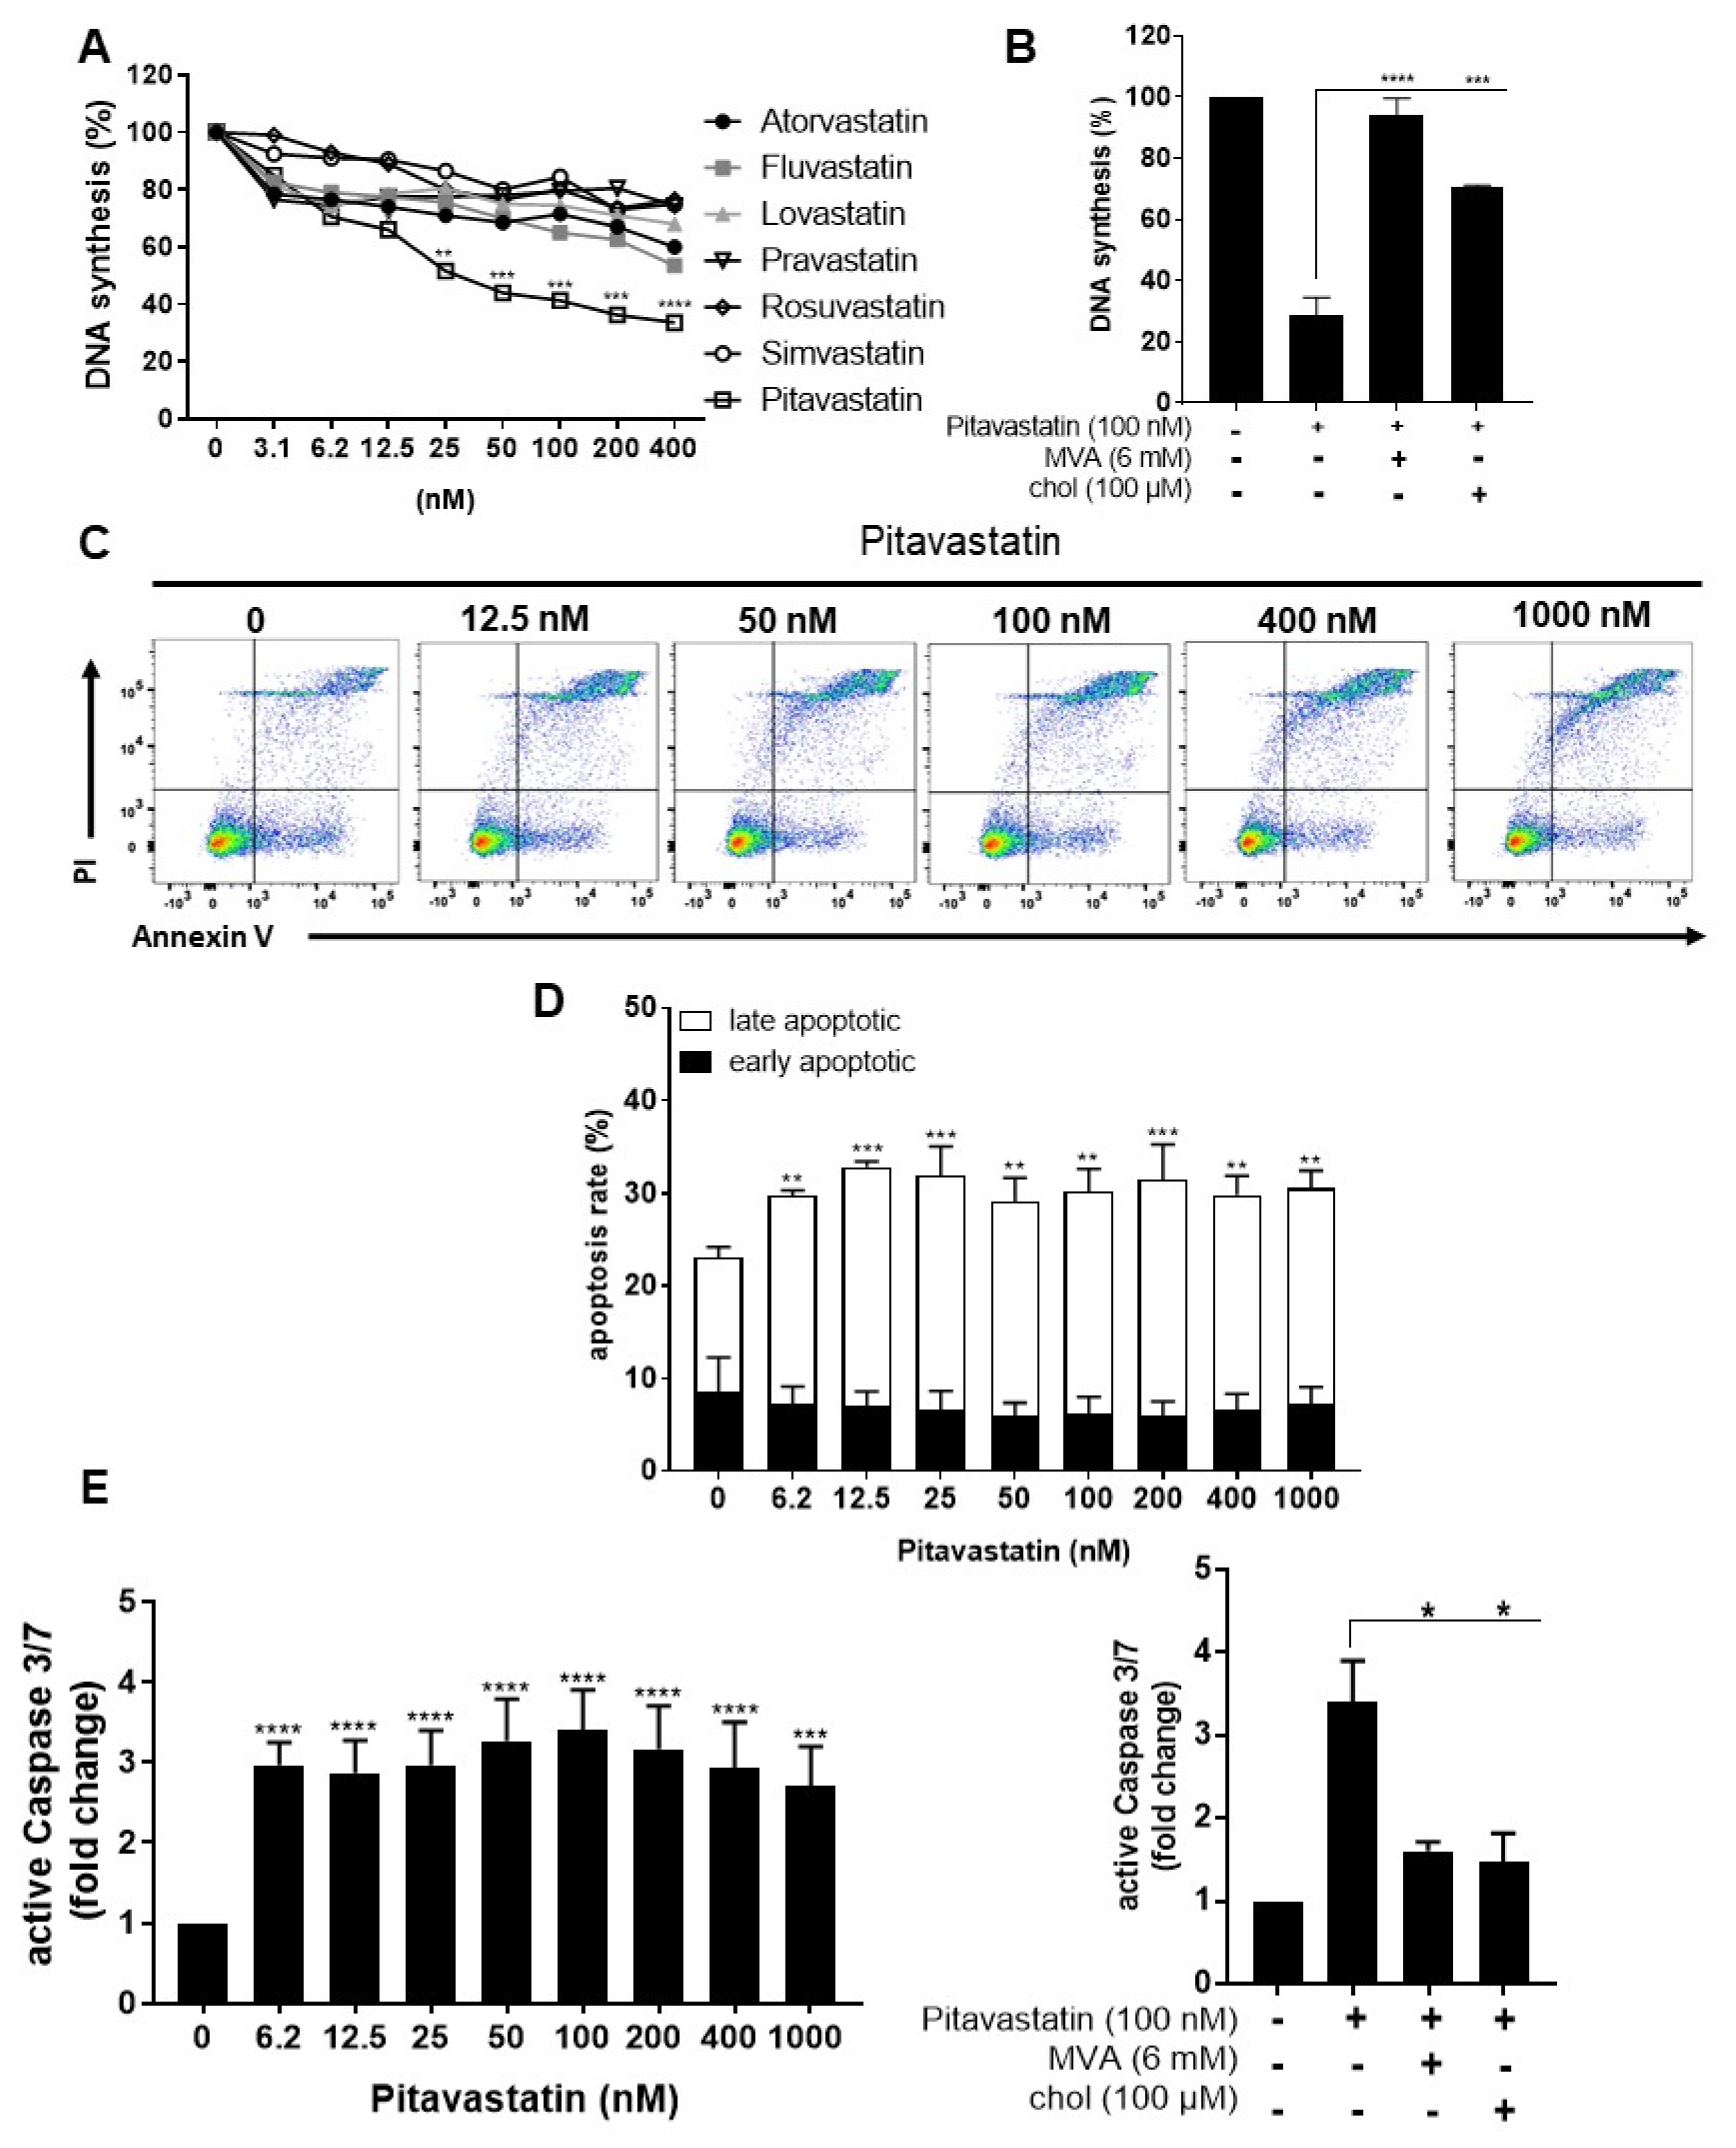
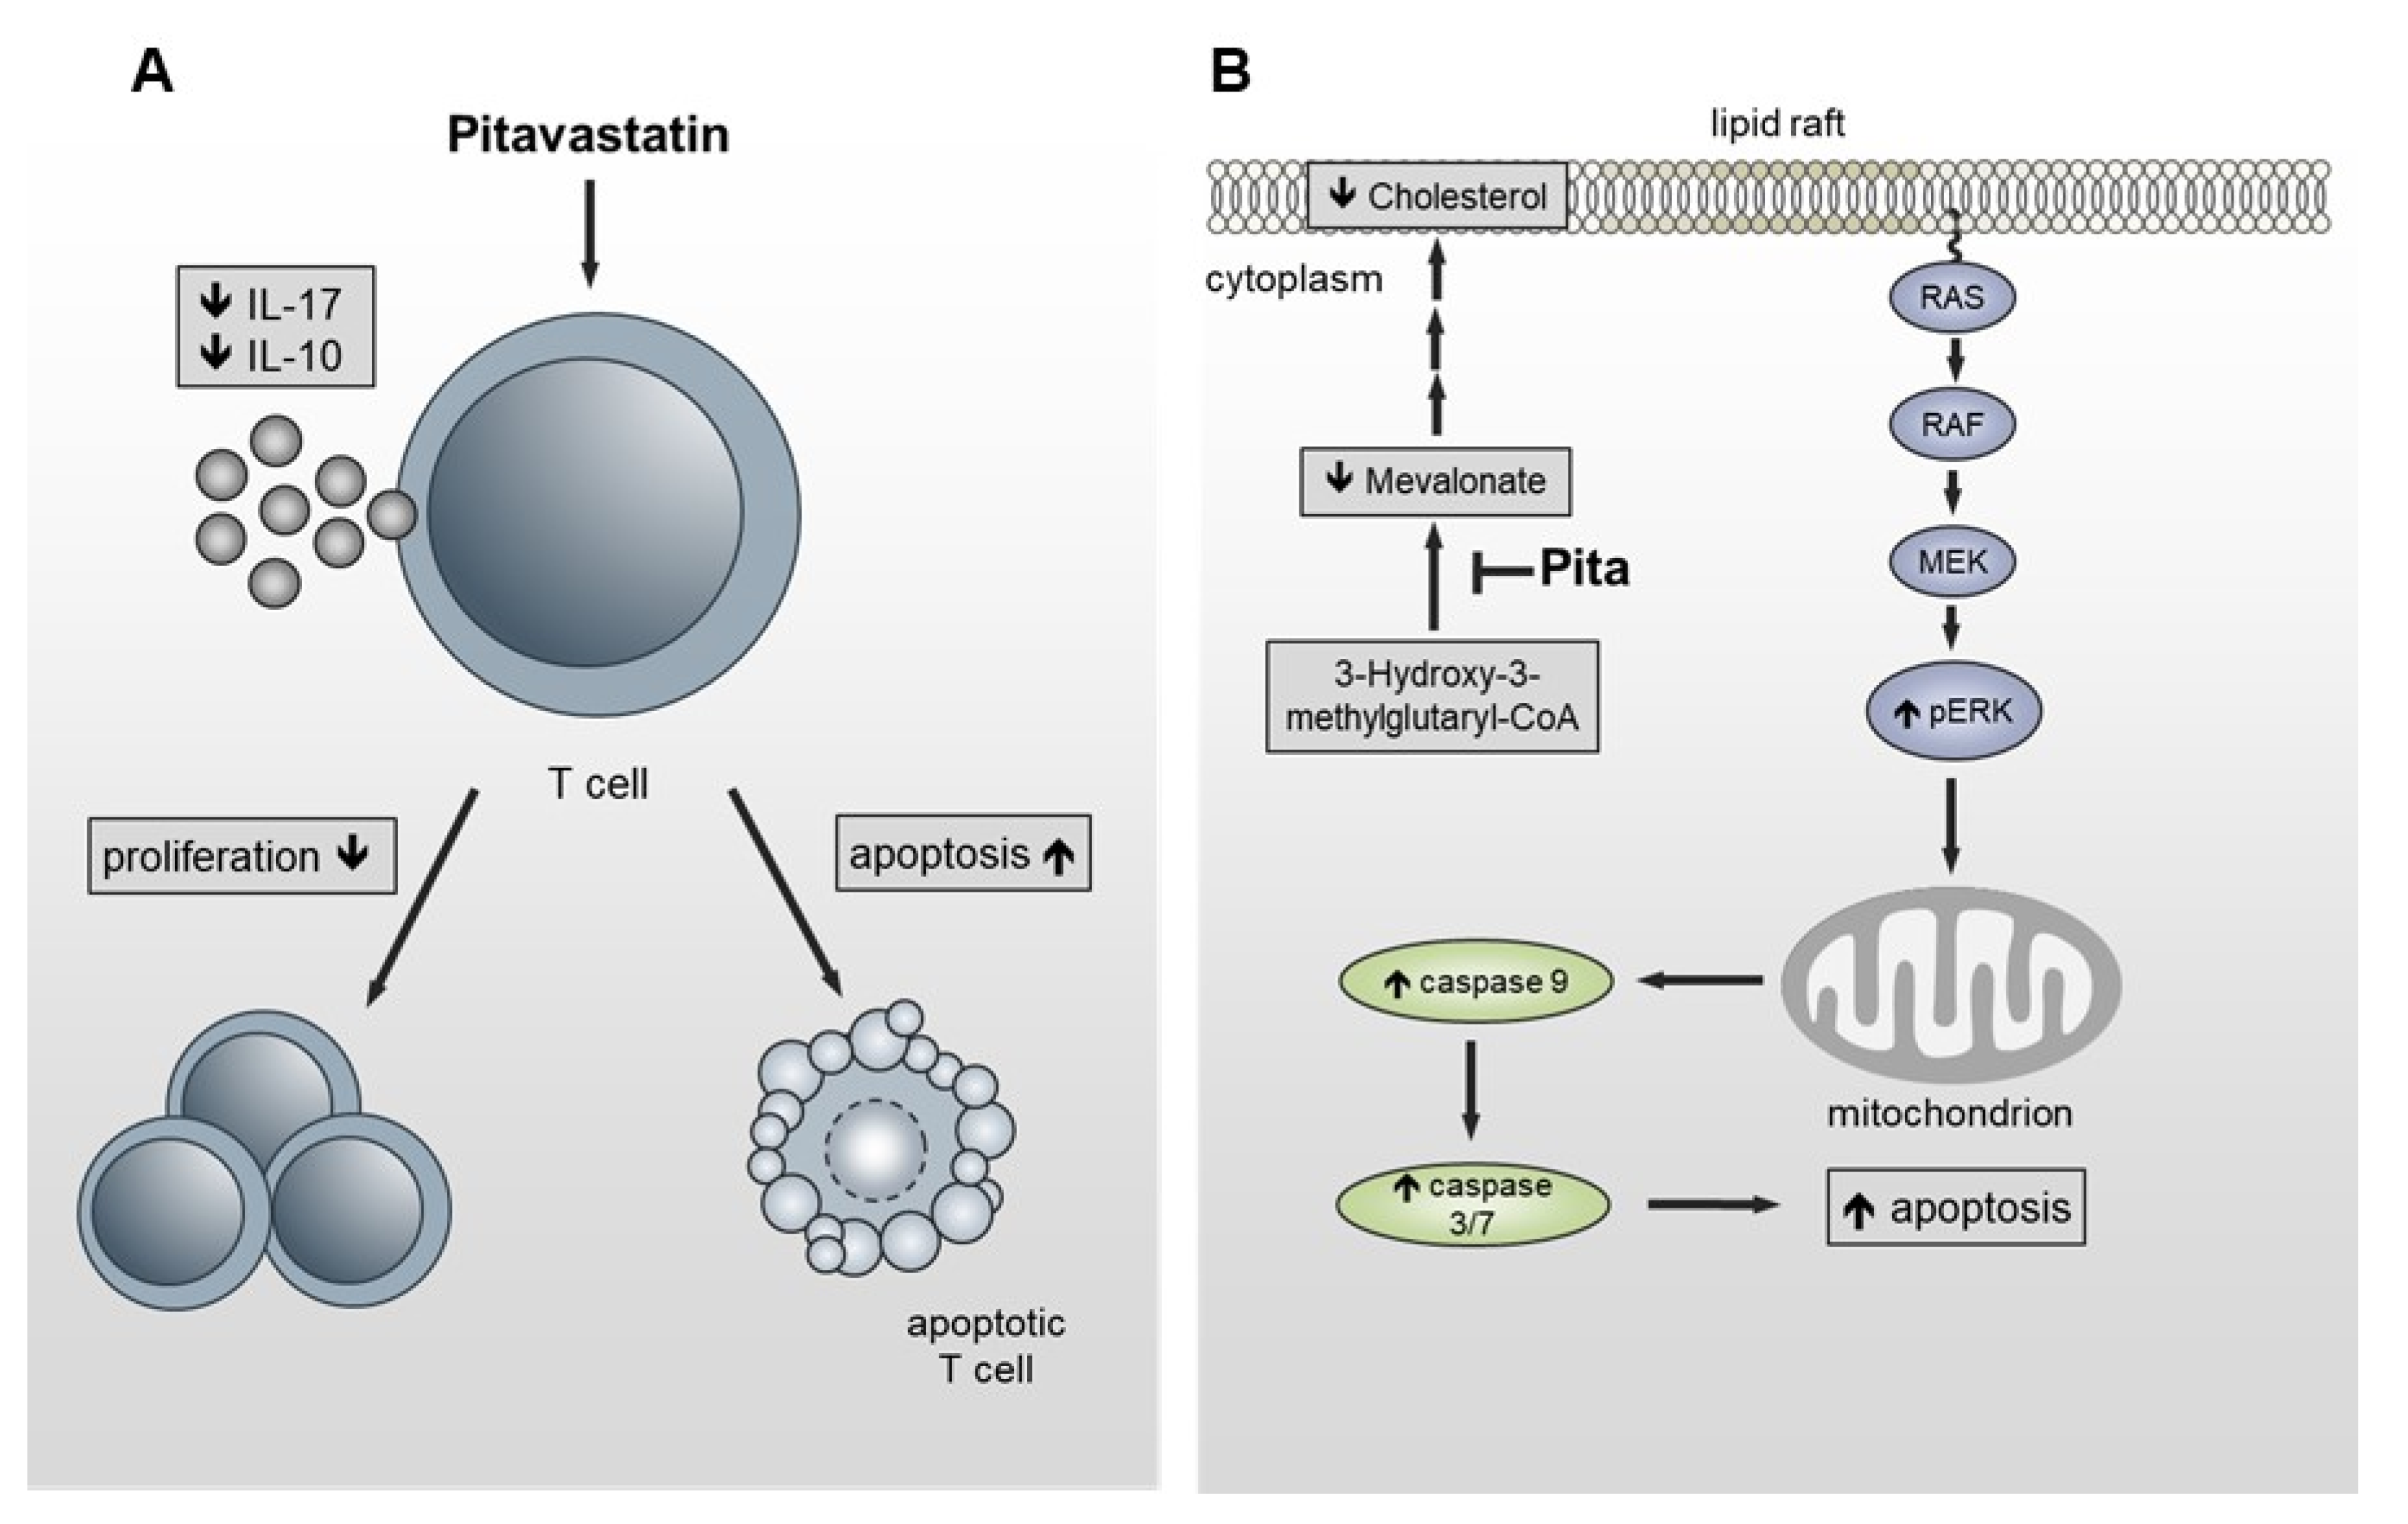
Pitavastatin Is a Highly Potent Inhibitor of T-Cell Proliferation

 ,
,  and
and 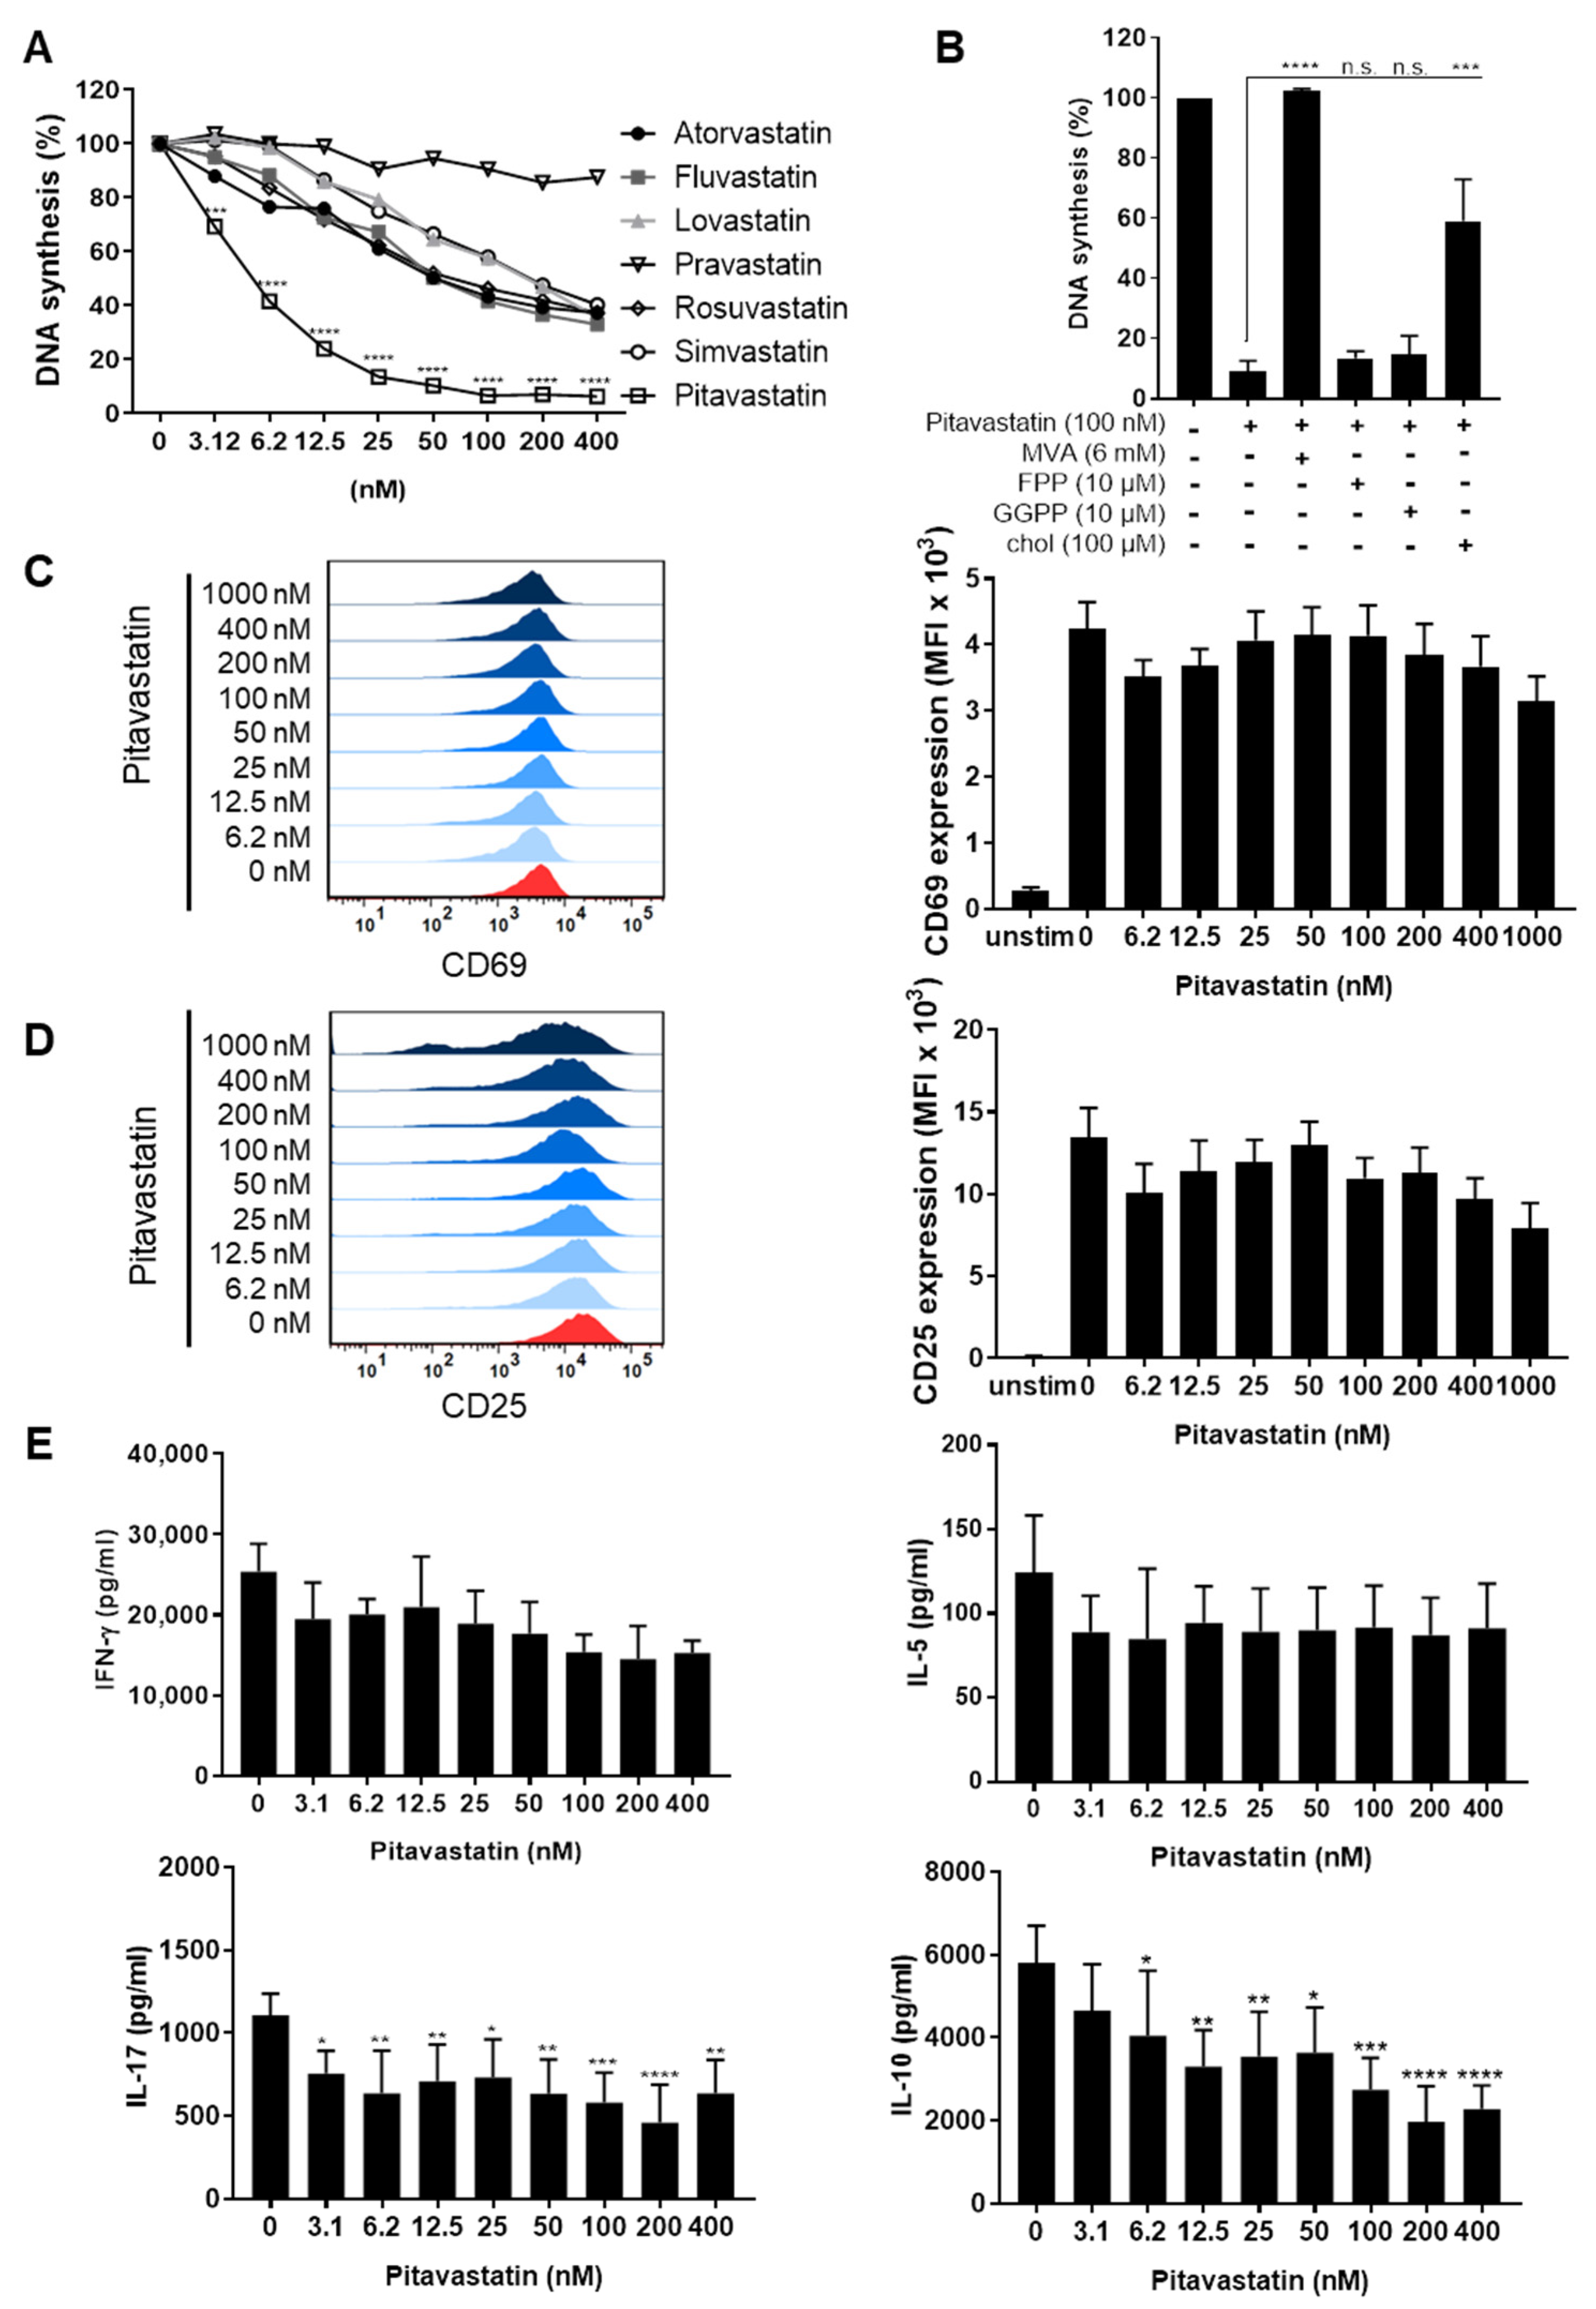
Abstract
1. Introduction
2. Results
2.1. Pitavastatin Suppresses Proliferation, as Well as IL-10 and IL-17 Production of Freshly Stimulated T Cells, but Shows No Effect on T-Cell Activation
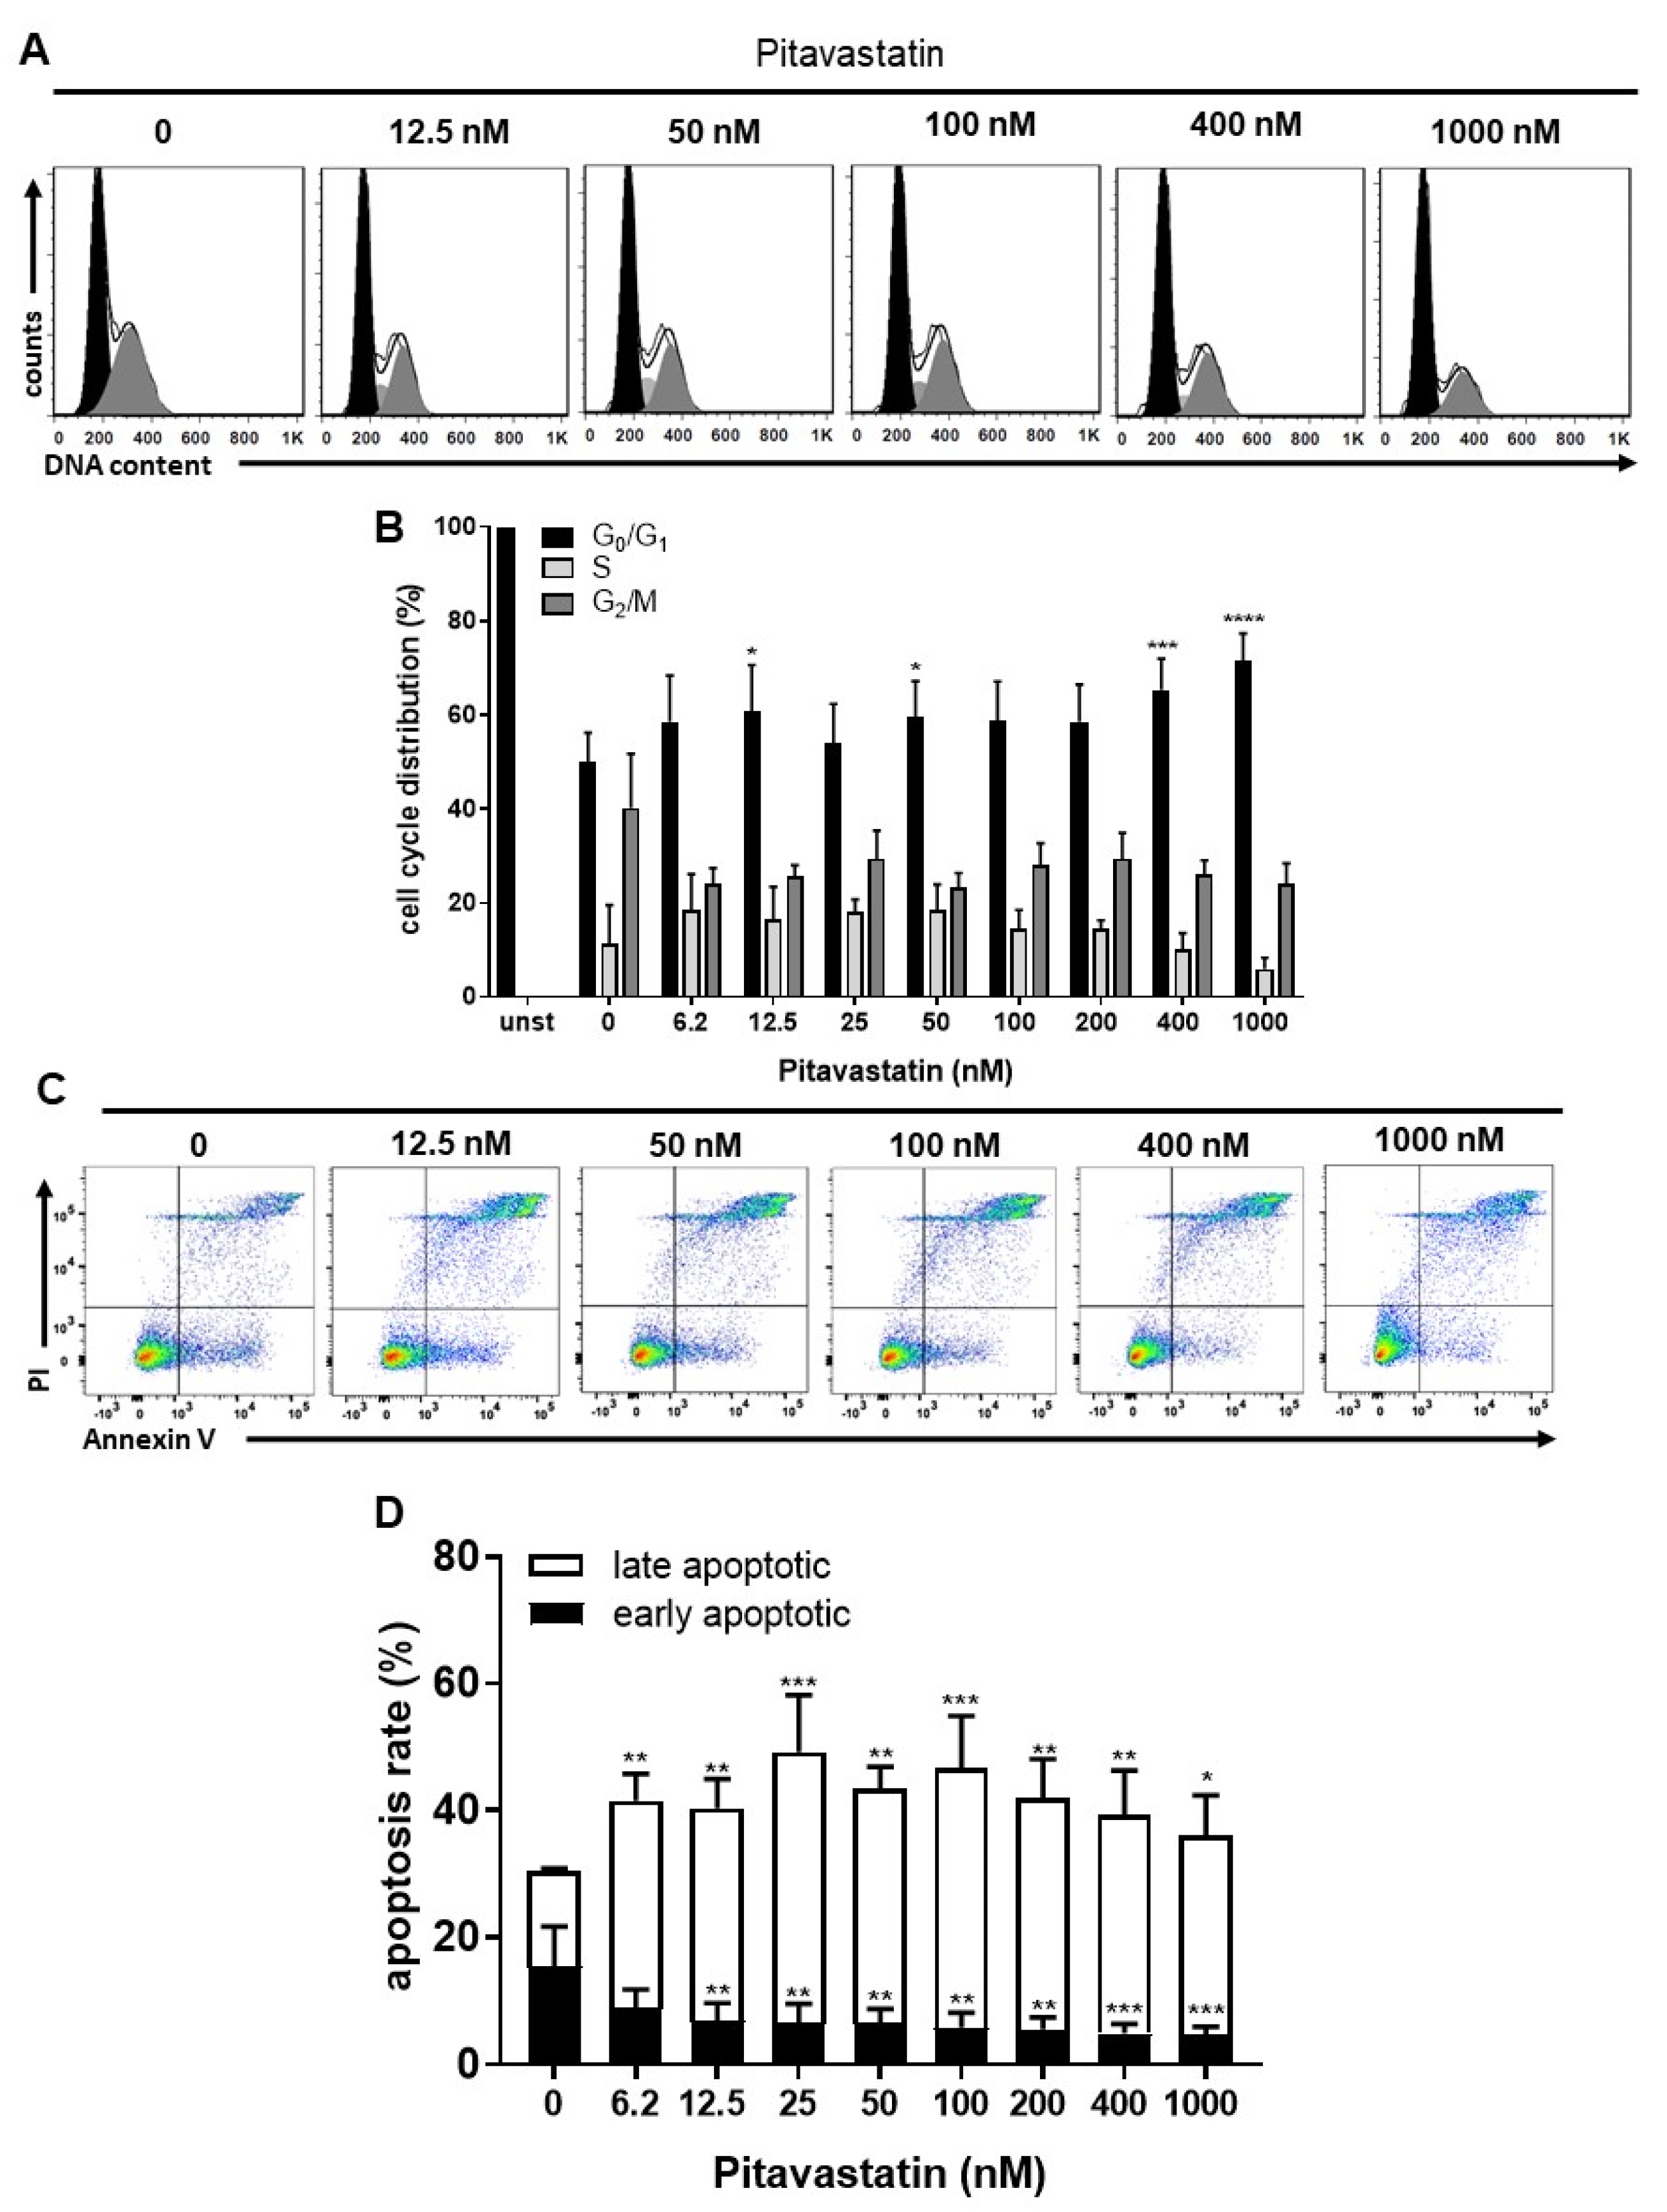
2.2. Pitavastatin Induces Apoptosis in Freshly Stimulated T Cells at Low Concentrations
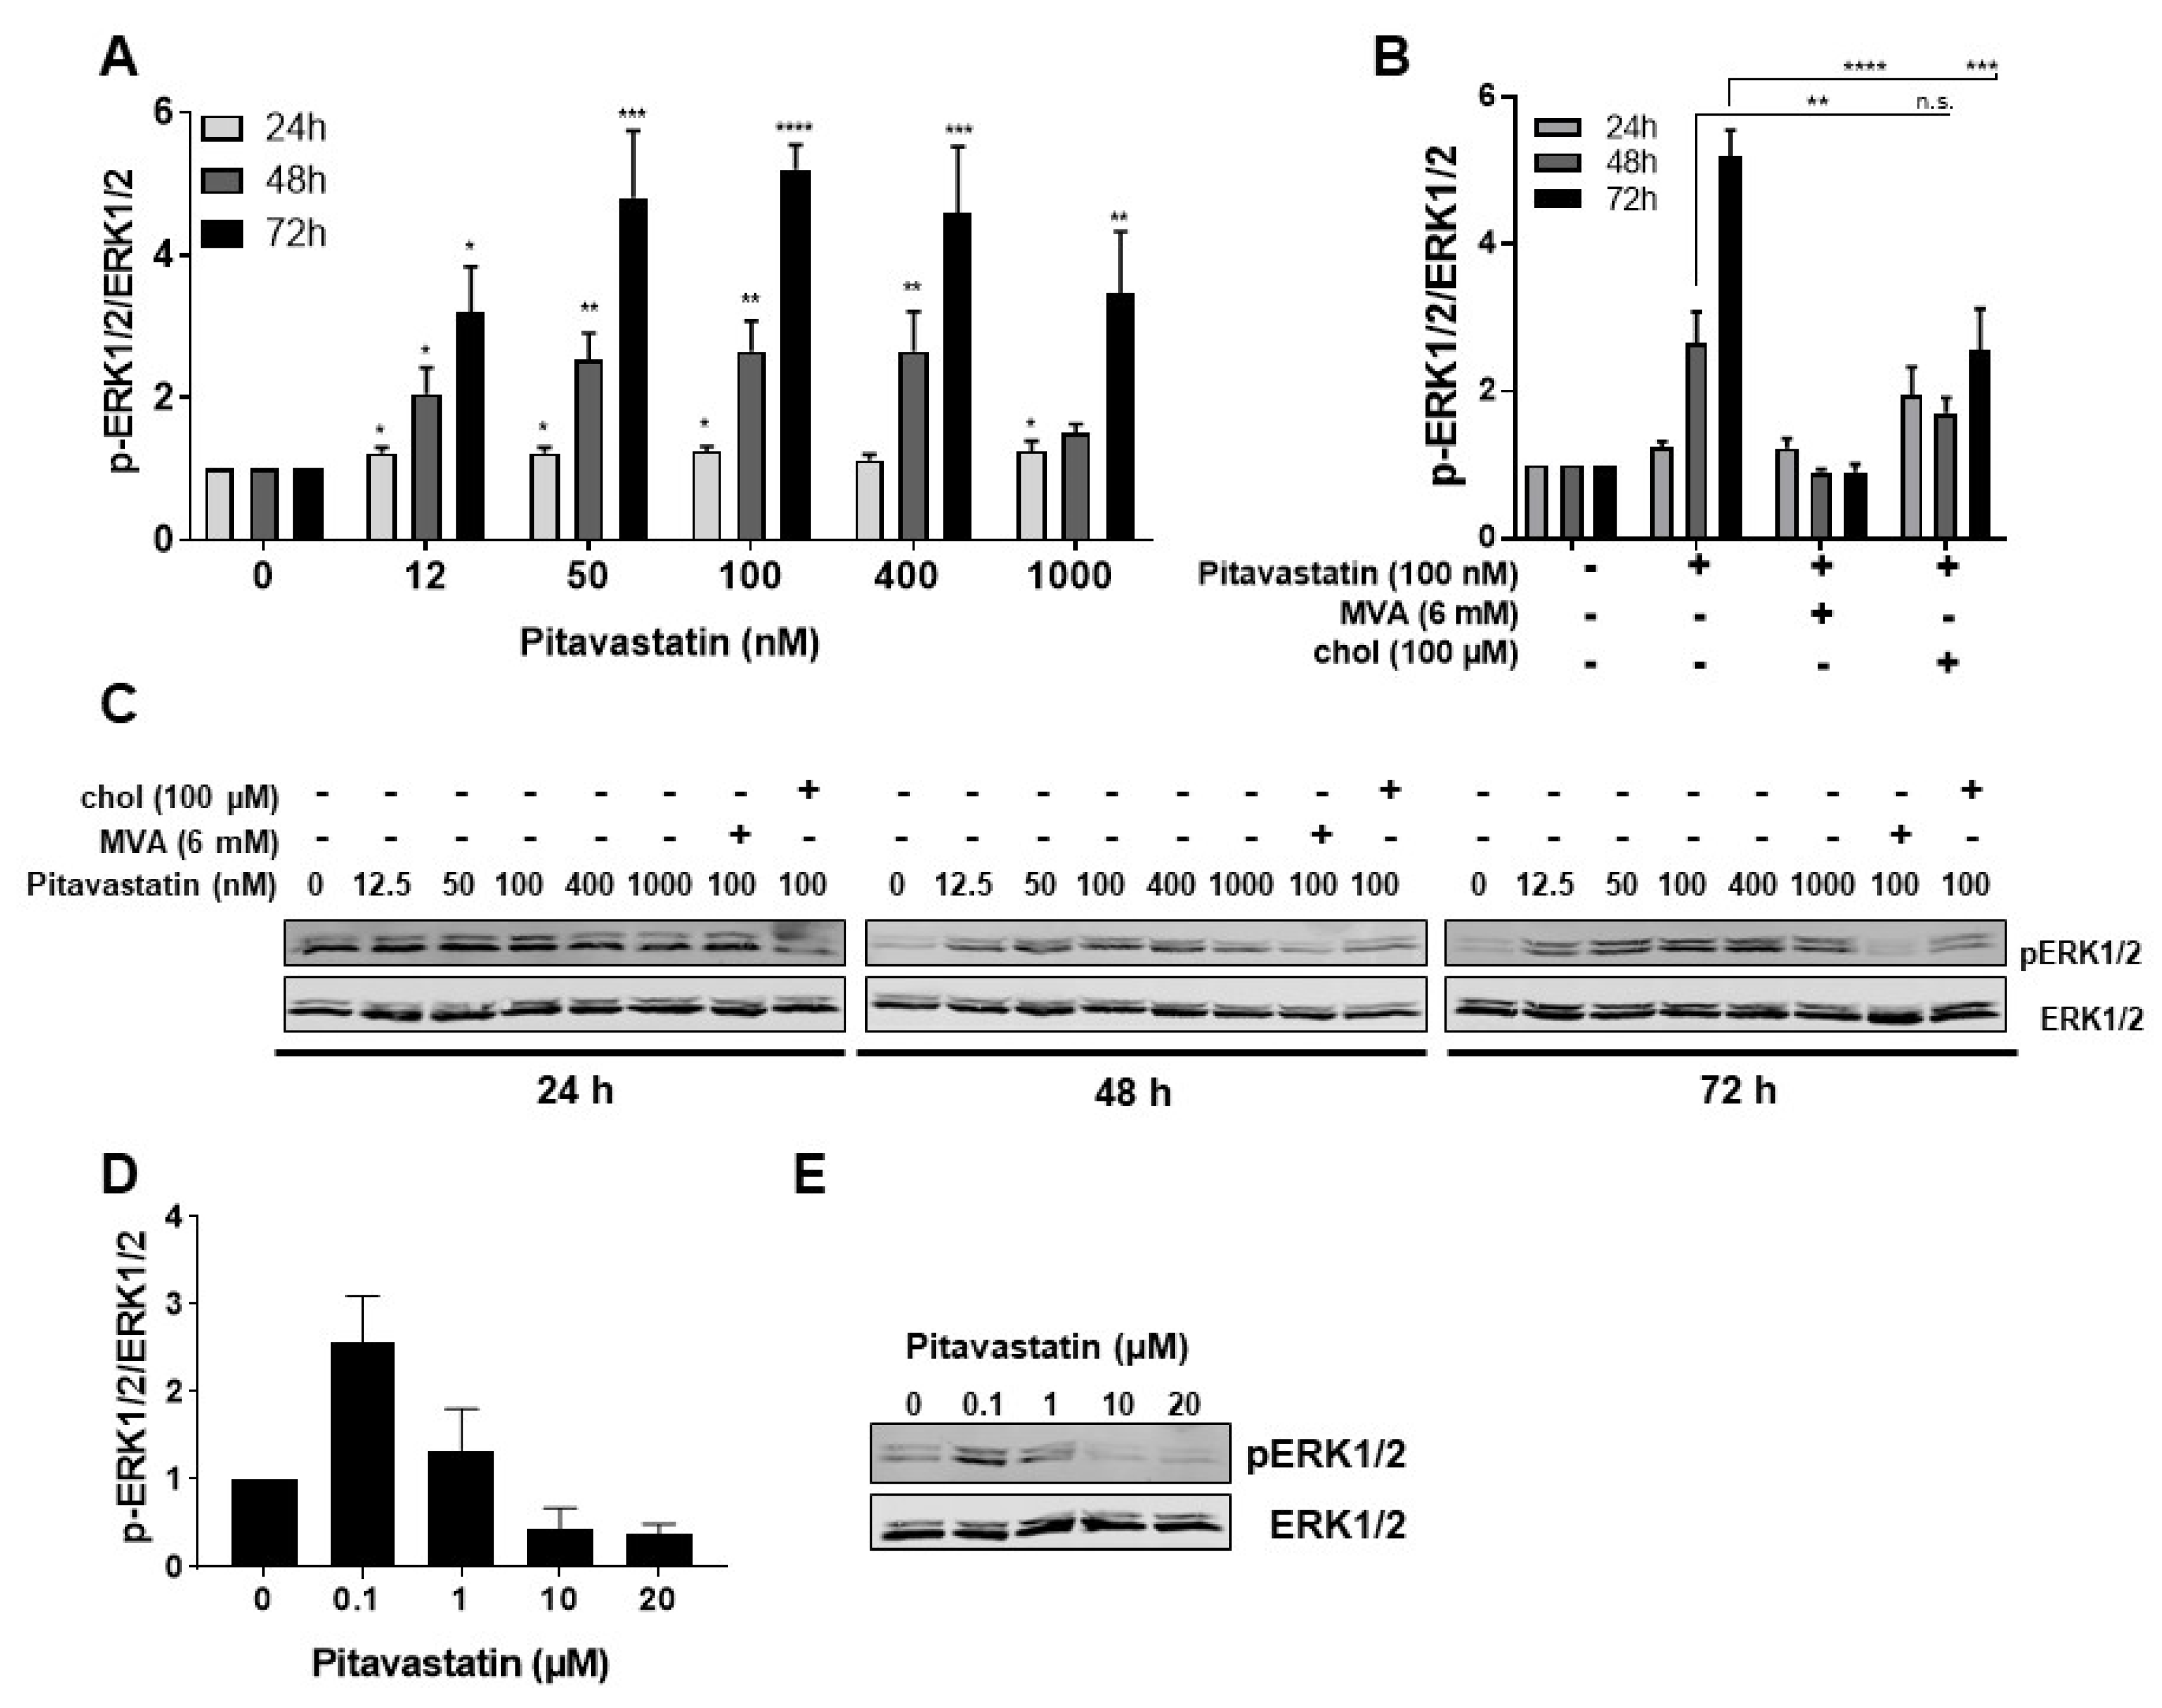
2.3. Pitavastatin Induces Strong ERK1/2 Phosphorylation at Low Concentrations
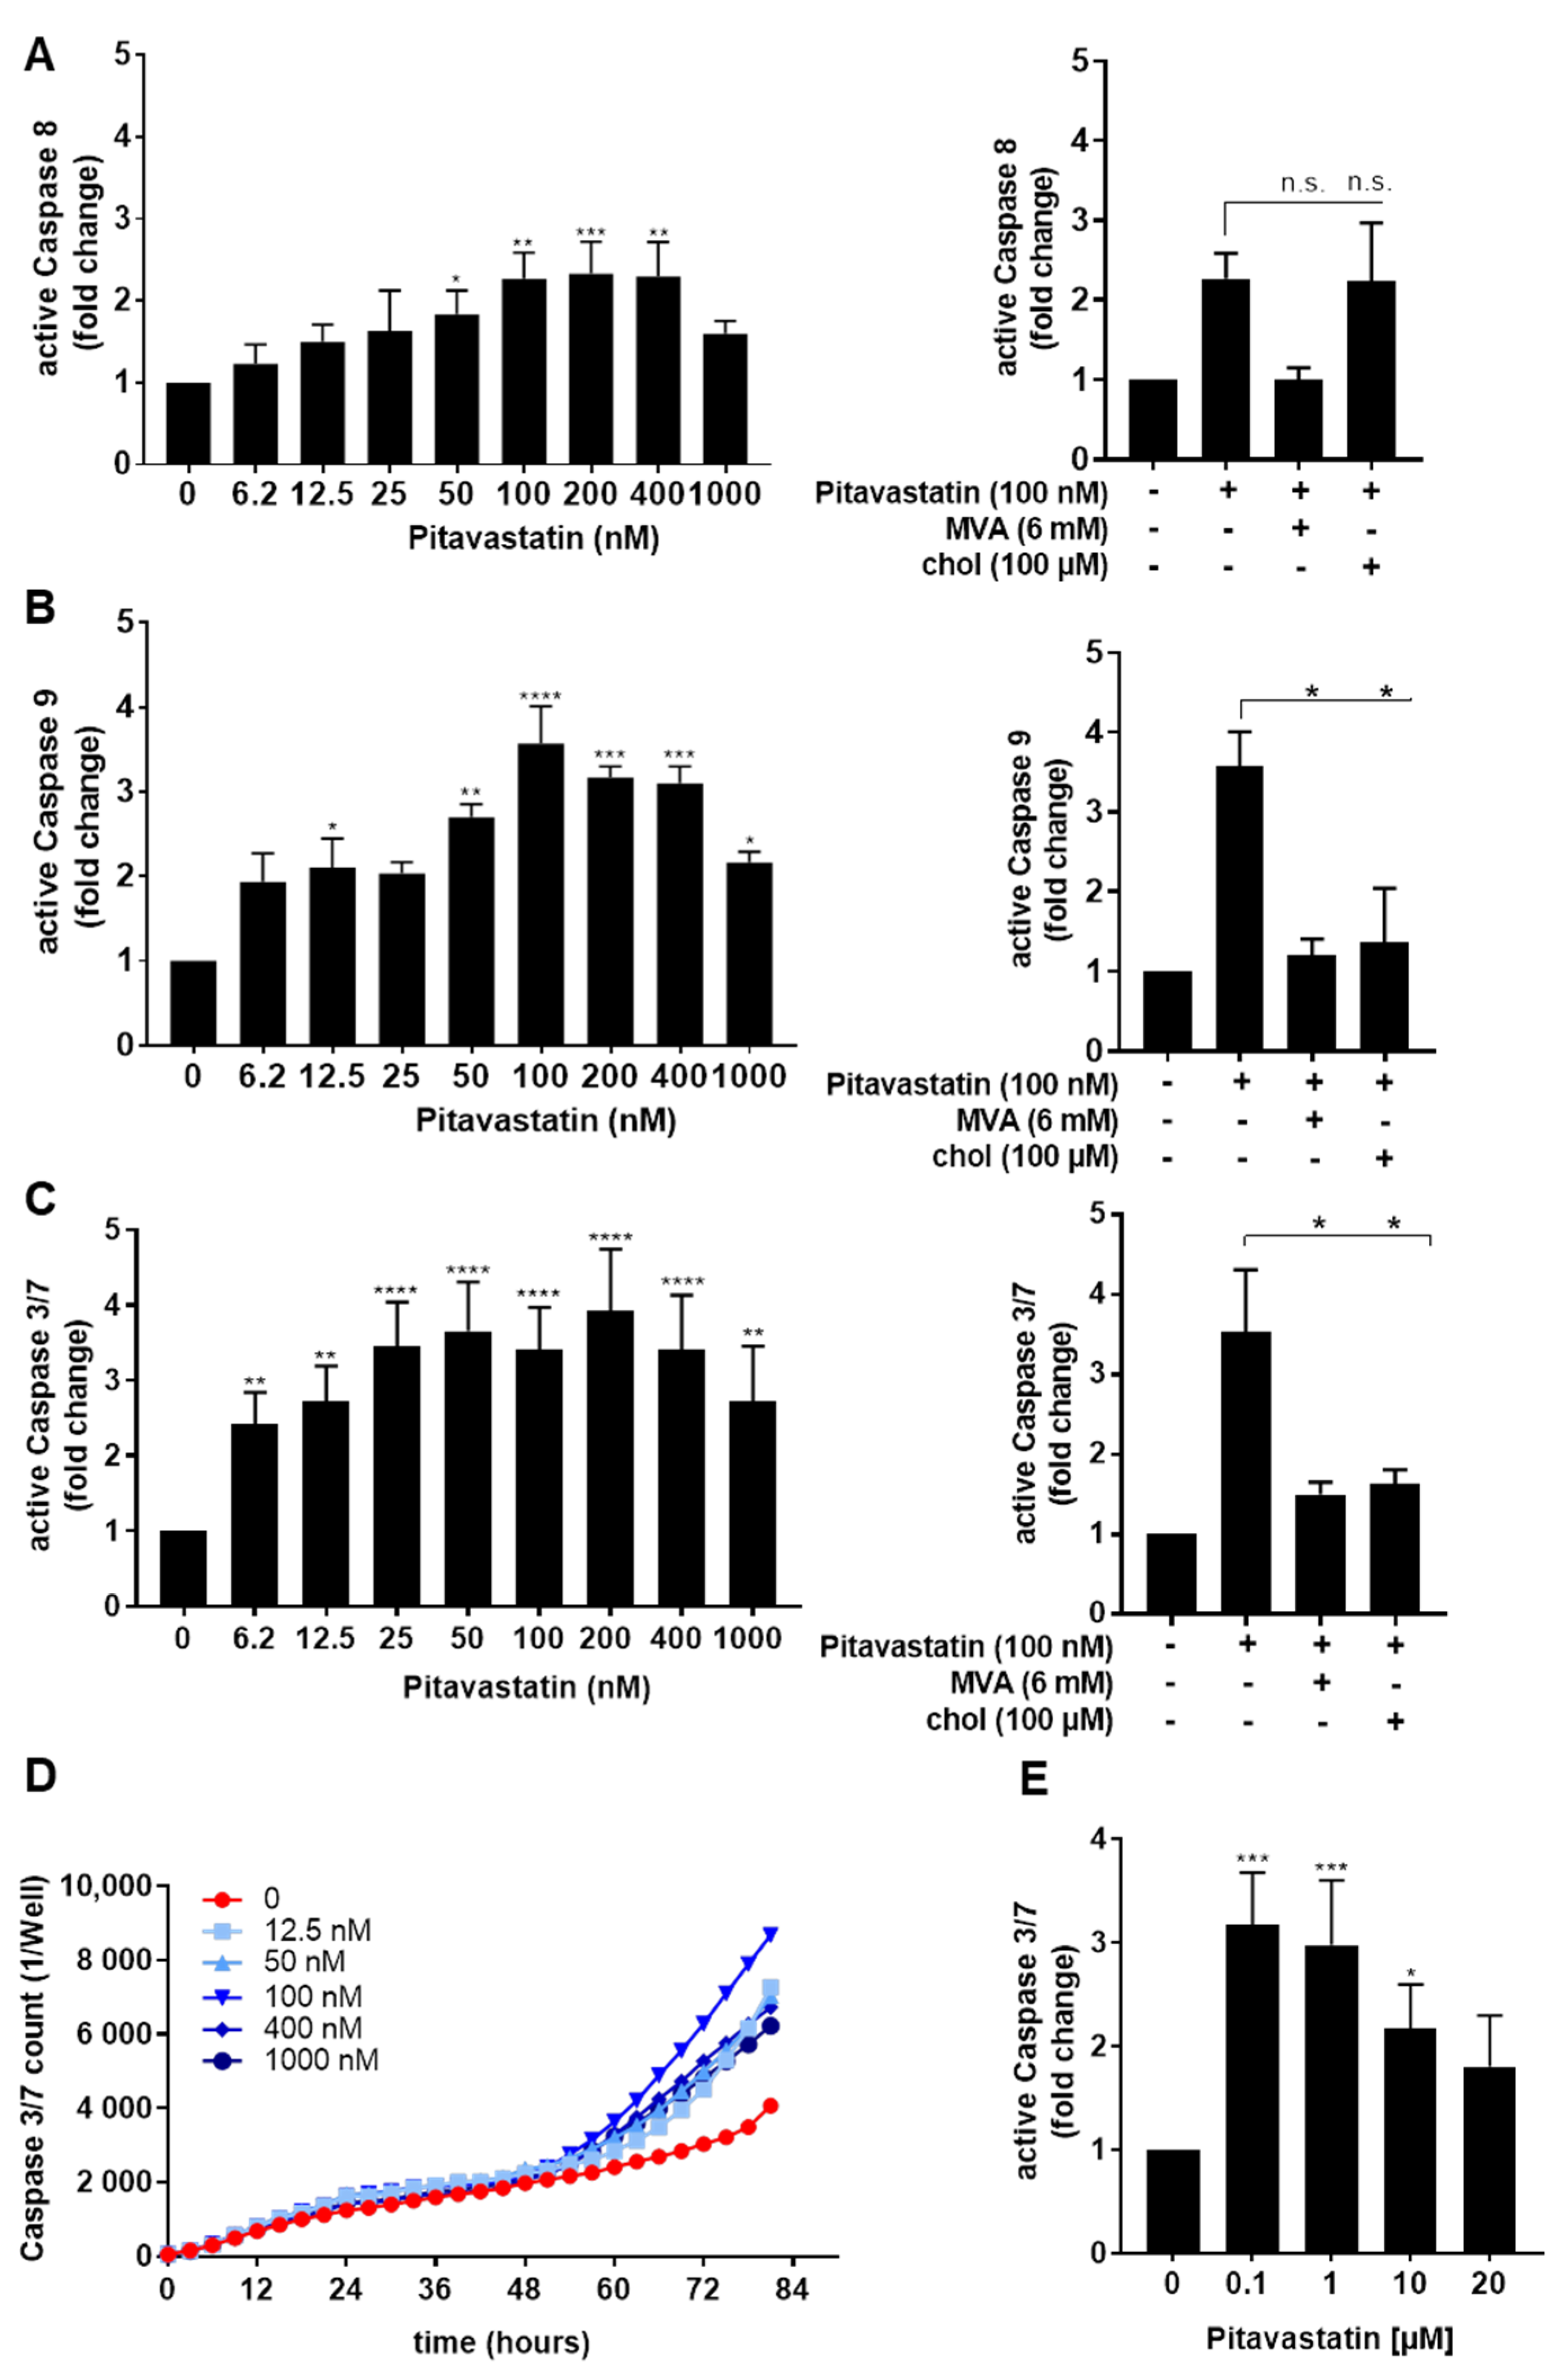
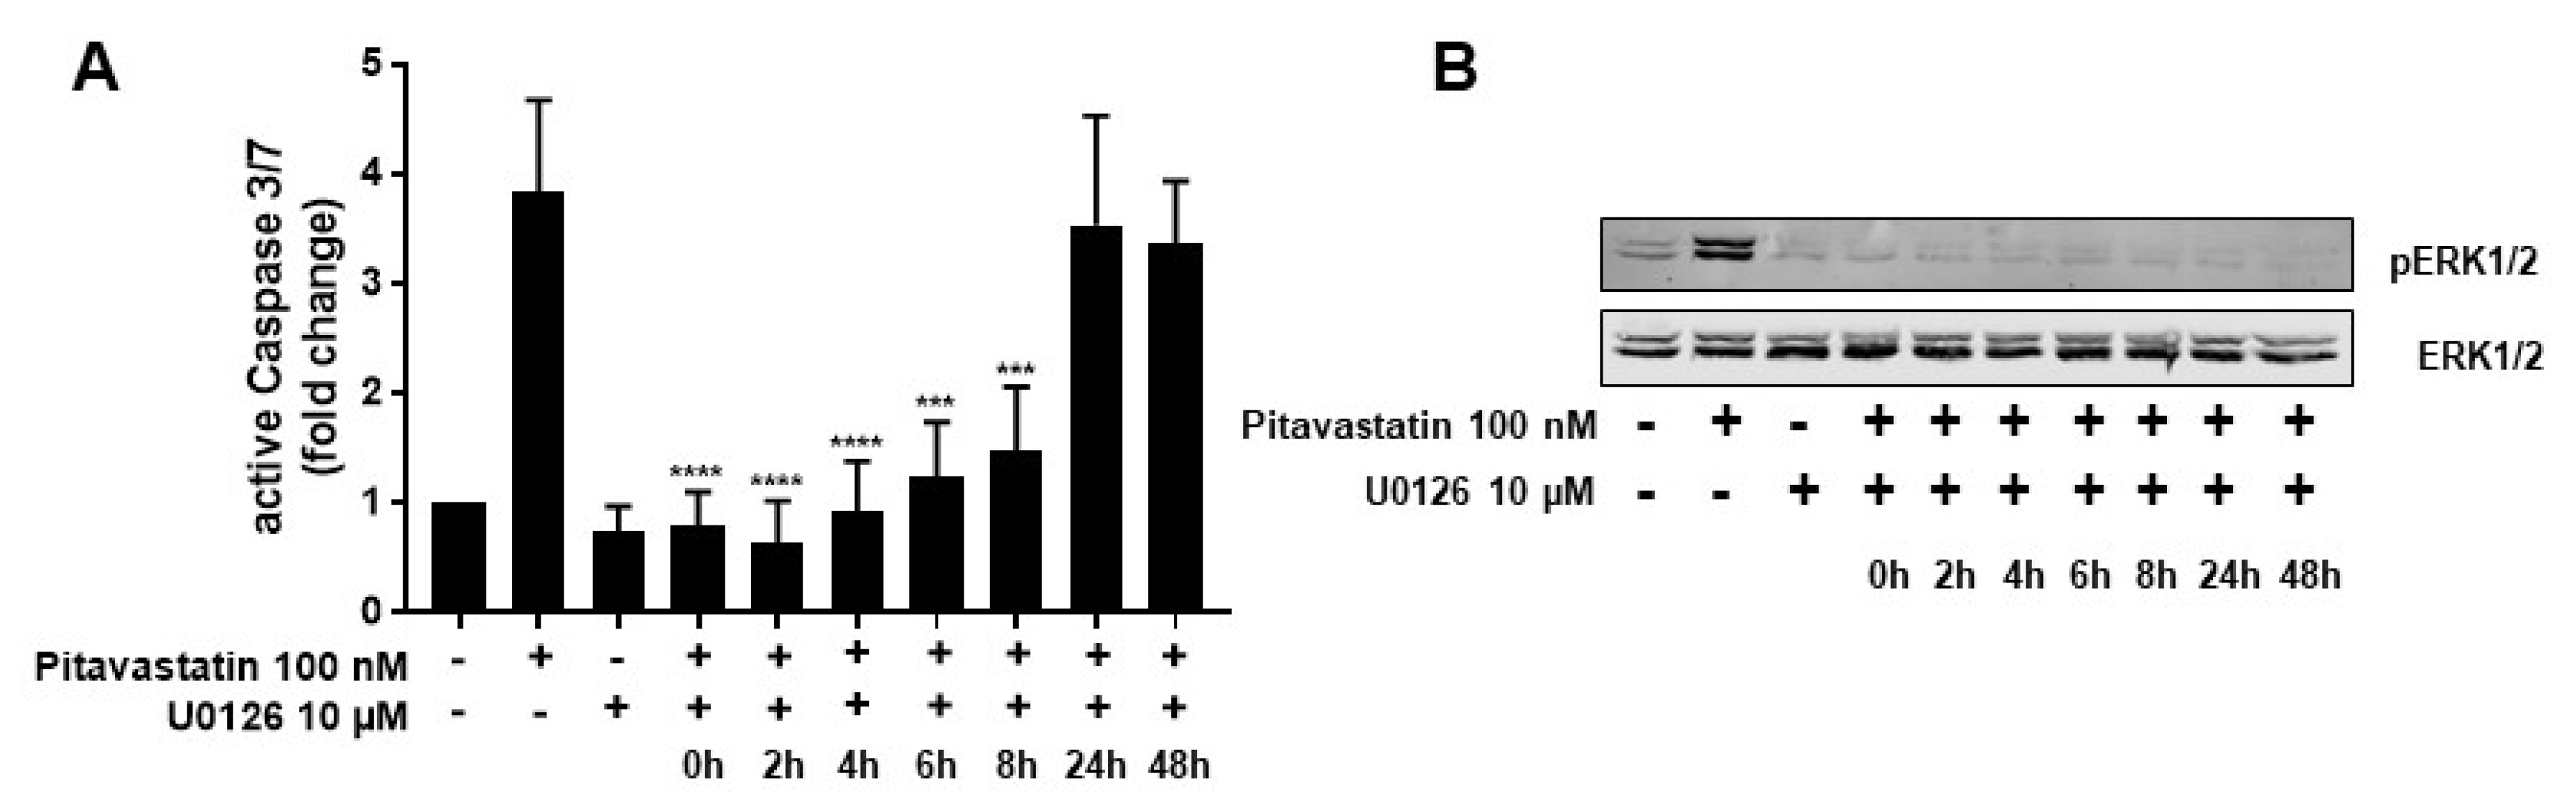
2.4. ERK1/2 Hyperphosphorylation Mediates Pitavastatin-Induced Apoptosis
2.5. Pitavastatin Suppresses Proliferation and Induced Apoptosis in Pre-Activated T Cells
3. Discussion
4. Materials and Methods
4.1. Reagents
4.2. Cells
4.3. T-Cell Proliferation Assay
4.4. Flow Cytometric Analysis of Activation Markers
4.5. Cytokine ELISA
4.6. Apoptosis measurement
4.7. Flow Cytometric Analysis of Active Caspase-3/7
4.8. IncuCyte Caspase-3/7 Assay
4.9. Flow Cytometric Caspase-8 and Caspase-9 Assay
4.10. Western Blot
4.11. Cell-Cycle Analysis
4.12. Statistical Analysis
5. Conclusions
Author Contributions
Funding
Institutional Review Board Statement
Informed Consent Statement
Data Availability Statement
Conflicts of Interest
References
- Van Norman, G.A. Drugs, Devices, and the FDA: Part 1: An Overview of Approval Processes for Drugs. JACC Basic Transl. Sci. 2016, 1, 170–179. [Google Scholar] [CrossRef] [PubMed]
- Collier, R. Rapidly rising clinical trial costs worry researchers. CMAJ 2009, 180, 277–278. [Google Scholar] [CrossRef]
- Sertkaya, A.; Wong, H.H.; Jessup, A.; Beleche, T. Key cost drivers of pharmaceutical clinical trials in the United States. Clin. Trials 2016, 13, 117–126. [Google Scholar] [CrossRef] [PubMed]
- Arrowsmith, J. Trial watch: Phase III and submission failures: 2007–2010. Nat. Rev. Drug Discov. 2011, 10, 87. [Google Scholar] [CrossRef]
- Pushpakom, S.; Iorio, F.; Eyers, P.A.; Escott, K.J.; Hopper, S.; Wells, A.; Doig, A.; Guilliams, T.; Latimer, J.; McNamee, C.; et al. Drug repurposing: Progress, challenges and recommendations. Nat. Rev. Drug Discov. 2018, 18, 41–58. [Google Scholar] [CrossRef] [PubMed]
- Ashburn, T.T.; Thor, K.B. Drug repositioning: Identifying and developing new uses for existing drugs. Nat. Rev. Drug Discov. 2004, 3, 673–683. [Google Scholar] [CrossRef]
- Breckenridge, A.; Jacob, R. Overcoming the legal and regulatory barriers to drug repurposing. Nat. Rev. Drug Discov. 2018, 18, 1–2. [Google Scholar] [CrossRef]
- Goodnow, C.C. Multistep Pathogenesis of Autoimmune Disease. Cell 2007, 130, 25–35. [Google Scholar] [CrossRef]
- Wang, L.; Wang, F.-S.; Gershwin, M.E. Human autoimmune diseases: A comprehensive update. J. Intern. Med. 2015, 278, 369–395. [Google Scholar] [CrossRef] [PubMed]
- Rosenblum, M.D.; Remedios, K.A.; Abbas, A.K. Mechanisms of human autoimmunity. J. Clin. Investig. 2015, 125, 2228–2233. [Google Scholar] [CrossRef] [PubMed]
- Devarajan, P.; Chen, Z. Autoimmune effector memory T cells: The bad and the good. Immunol. Res. 2013, 57, 12–22. [Google Scholar] [CrossRef]
- Malmström, V.; Trollmo, C.; Klareskog, L. Modulating co-stimulation: A rational strategy in the treatment of rheumatoid arthritis? Arthritis Res. Ther. 2005, 7, S15–S20. [Google Scholar] [CrossRef][Green Version]
- Guttek, K.; Wagenbrett, L.; Reinhold, A.; Grüngreiff, K.; Reinhold, D. Zinc aspartate suppresses proliferation and Th1/Th2/Th17 cytokine production of pre-activated human T cells in vitro. J. Trace Elem. Med. Biol. 2018, 49, 86–90. [Google Scholar] [CrossRef]
- Voss, L.; Guttek, K.; Reddig, A.; Reinhold, A.; Voss, M.; Schraven, B.; Reinhold, D. Screening of FDA-approved drug library identifies Adefovir Dipivoxil as highly potent inhibitor of T cell proliferation. Front. Immunol. 2021, 11, 3425. [Google Scholar] [CrossRef]
- Stein, E.A. The power of statins: Aggressive lipid lowering. Clin. Cardiol. 2003, 26, 25–31. [Google Scholar] [CrossRef] [PubMed]
- Istvan, E.S.; Deisenhofer, J. Structural mechanism for statin inhibition of HMG-CoA reductase. Science 2001, 292, 1160–1164. [Google Scholar] [CrossRef] [PubMed]
- Goldstein, J.L.; Brown, M.S. Regulation of the mevalonate pathway. Nature 1990, 343, 425–430. [Google Scholar] [CrossRef] [PubMed]
- Liao, J.K. Isoprenoids as mediators of the biological effects of statins. J. Clin. Investig. 2002, 110, 285–288. [Google Scholar] [CrossRef]
- Jeong, A.; Suazo, K.F.; Wood, W.G.; Distefano, M.D.; Li, L. Isoprenoids and protein prenylation: Implications in the pathogenesis and therapeutic intervention of Alzheimer’s disease. Crit. Rev. Biochem. Mol. Biol. 2018, 53, 279–310. [Google Scholar] [CrossRef] [PubMed]
- Tajiri, K.; Shimojo, N.; Sakai, S.; Machino-Ohtsuka, T.; Imanaka-Yoshida, K.; Hiroe, M.; Tsujimura, Y.; Kimura, T.; Sato, A.; Yasutomi, Y.; et al. Pitavastatin regulates helper T-Cell differentiation and ameliorates autoimmune myocarditis in mice. Cardiovasc. Drugs Ther. 2013, 27, 413–424. [Google Scholar] [CrossRef]
- Ghittoni, R.; Lazzerini, P.E.; Pasini, F.L.; Baldari, C.T. T Lymphocytes as targets of Statins: Molecular mechanisms and therapeutic perspectives. Inflamm. Allergy Drug Targets 2007, 6, 3–16. [Google Scholar] [CrossRef] [PubMed]
- Greenwood, J.; Walters, C.E.; Pryce, G.; Kanuga, N.; Beraud, E.; Baker, D.; Adamson, P. Lovastatin inhibits brain endothelial cell Rho-mediated lymphocyte migration and attenuates experimental autoimmune encephalomyelitis. FASEB J. 2003, 17, 905–907. [Google Scholar] [CrossRef]
- Weitz-Schmidt, G.; Welzenbach, K.; Brinkmann, V.; Kamata, T.; Kallen, J.; Bruns, C.; Cottens, S.; Takada, Y.; Hommel, U. Statins selectively inhibit leukocyte function antigen-1 by binding to a novel regulatory integrin site. Nat. Med. 2001, 7, 687–692. [Google Scholar] [CrossRef] [PubMed]
- Lee, S.J.; Qin, H.; Benveniste, E.N. The IFN-γ-induced transcriptional program of the CIITA gene is inhibited by statins. Eur. J. Immunol. 2008, 38, 2325–2336. [Google Scholar] [CrossRef] [PubMed]
- Youssef, S.; Stüve, O.; Patarroyo, J.O.; Ruiz, P.J.; Radosevich, J.L.; Hur, E.M.; Bravo, M.; Mitchell, D.J.; Sobel, R.A.; Stelnman, L.; et al. The HMG-CoA reductase inhibitor, atorvastatin, promotes a Th2 bias and reverses paralysis in central nervous system autoimmune disease. Nature 2002, 420, 78–84. [Google Scholar] [CrossRef]
- Chen, L.W.; Lin, C.S.; Tsai, M.C.; Shih, S.F.; Lim, Z.W.; Chen, S.J.; Tsui, P.F.; Ho, L.J.; Lai, J.H.; Liou, J.T. Pitavastatin exerts potent anti-inflammatory and immunomodulatory effects via the suppression of AP-1 signal transduction in human T cells. Int. J. Mol. Sci. 2019, 20, 3534. [Google Scholar] [CrossRef]
- Kamigaki, M.; Sasaki, T.; Serikawa, M.; Inoue, M.; Kobayashi, K.; Itsuki, H.; Minami, T.; Yukutake, M.; Okazaki, A.; Ishigaki, T.; et al. Statins induce apoptosis and inhibit proliferation in cholangiocarcinoma cells. Int. J. Oncol. 2011, 39, 561–568. [Google Scholar] [CrossRef][Green Version]
- Yanae, M.; Tsubaki, M.; Satou, T.; Itoh, T.; Imano, M.; Yamazoe, Y.; Nishida, S. Statin-induced apoptosis via the suppression of ERK1/2 and Akt activation by inhibition of the geranylgeranyl-pyrophosphate biosynthesis in glioblastoma. J. Exp. Clin. Cancer Res. 2011, 30, 74. [Google Scholar] [CrossRef]
- Liao, J.K.; Laufs, U. Pleiotropic effects of statins. Annu. Rev. Pharmacol. Toxicol. 2005, 45, 89–118. [Google Scholar] [CrossRef] [PubMed]
- Antonopoulos, A.S.; Margaritis, M.; Lee, R.; Channon, K.; Antoniades, C. Statins as anti-inflammatory agents in atherogenesis: Molecular mechanisms and lessons from the recent clinical trials. Curr. Pharm. Des. 2012, 18, 1519–1530. [Google Scholar] [CrossRef]
- Chow, S.C. Immunomodulation by statins: Mechanisms and potential impact on autoimmune diseases. Arch. Immunol. Ther. Exp. 2009, 57, 243–251. [Google Scholar] [CrossRef]
- Blank, N.; Schiller, M.; Krienke, S.; Busse, F.; Schätz, B.; Ho, A.D.; Kalden, J.R.; Lorenz, H.-M. Atorvastatin inhibits T cell activation through 3-hydroxy-3-methylglutaryl coenzyme A reductase without decreasing cholesterol synthesis. J. Immunol. 2007, 179, 3613–3621. [Google Scholar] [CrossRef]
- Jameel, A.; Ooi, K.G.J.; Jeffs, N.R.; Galatowicz, G.; Lightman, S.L.; Calder, V.L. Statin modulation of human T-cell proliferation, IL-1 β and IL-17 production, and IFN- γ T cell expression: Synergy with conventional immunosuppressive agents. Int. J. Inflam. 2013, 2013, 434586. [Google Scholar] [CrossRef] [PubMed]
- Palinski, W.; Tsimikas, S. Immunomodulatory effects of statins: Mechanisms and potential impact on arteriosclerosis. J. Am. Soc. Nephrol. 2002, 13, 1673–1681. [Google Scholar] [CrossRef] [PubMed]
- Crosbie, J.; Magnussen, M.; Dornbier, R.; Iannone, A.; Steele, T.A. Statins inhibit proliferation and cytotoxicity of a human leukemic natural killer cell line. Biomark. Res. 2013, 1, 33. [Google Scholar] [CrossRef]
- Waiczies, S.; Bendix, I.; Zipp, F. Geranylgeranylation but not GTP-loading of Rho GTPases determines T cell function. Sci. Signal. 2008, 1, pt3. [Google Scholar] [CrossRef] [PubMed]
- Burke, L.; Allen, D.; Kukoly, C. Both farnesylpyrophosphate (FPP) and geranylgeranylpyrophosphate (GGPP) rescue prenylation in the presence of statins, but only GGPP rescues cell viability. Proc. Am. Assoc. Cancer Res. 2004, 45, 466. [Google Scholar]
- Gbelcová, H.; Rimpelová, S.; Knejzlík, Z.; Šáchová, J.; Kolář, M.; Strnad, H.; Repiská, V.; D’Acunto, W.C.; Ruml, T.; Vítek, L. Isoprenoids responsible for protein prenylation modulate the biological effects of statins on pancreatic cancer cells. Lipids Health Dis. 2017, 16, 250. [Google Scholar] [CrossRef] [PubMed]
- Fox, C.J.; Hammerman, P.S.; Thompson, C.B. Fuel feeds function: Energy metabolism and the T-cell response. Nat. Rev. Immunol. 2005, 5, 844–852. [Google Scholar] [CrossRef]
- Chakrabarti, R.; Engleman, E.G. Interrelationships between mevalonate metabolism and the mitogenic signaling pathway in T lymphocyte proliferation. J. Biol. Chem. 1991, 266, 12216–12222. [Google Scholar] [CrossRef]
- Bietz, A.; Zhu, H.; Xue, M.; Xu, C. Cholesterol metabolism in T cells. Front. Immunol. 2017, 8, 1664. [Google Scholar] [CrossRef] [PubMed]
- Das, J.; Ho, M.; Zikherman, J.; Govern, C.; Yang, M.; Weiss, A.; Chakraborty, A.K.; Roose, J.P. Digital signaling and hysteresis characterize Ras activation in lymphoid cells. Cell 2009, 136, 337–351. [Google Scholar] [CrossRef] [PubMed]
- Schuh, K.; Twardzik, T.; Kneitz, B.; Heyer, J.; Schimpl, A.; Serfling, E. The interleukin 2 receptor α chain/CD25 promoter is a target for nuclear factor of activated T cells. J. Exp. Med. 1998, 188, 1369–1373. [Google Scholar] [CrossRef] [PubMed]
- Ghittoni, R.; Patrussi, L.; Pirozzi, K.; Pellegrini, M.; Lazzerini, P.E.; Capecchi, P.L.; Pasini, F.L.; Baldari, C.T. Simvastatin inhibits T-cell activation by selectively impairing the function of Ras superfamily GTPases. FASEB J. 2005, 19, 1–24. [Google Scholar] [CrossRef]
- Perucha, E.; Melchiotti, R.; Bibby, J.A.; Wu, W.; Frederiksen, K.S.; Roberts, C.A.; Hall, Z.; LeFriec, G.; Robertson, K.A.; Lavender, P.; et al. The cholesterol biosynthesis pathway regulates IL-10 expression in human Th1 cells. Nat. Commun. 2019, 10, 498. [Google Scholar] [CrossRef] [PubMed]
- Brinkkoetter, P.T.; Gottmann, U.; Schulte, J.; Van Der Woude, F.J.; Braun, C.; Yard, B.A. Atorvastatin interferes with activation of human CD4+ T cells via inhibition of small guanosine triphosphatase (GTPase) activity and caspase-independent apoptosis. Clin. Exp. Immunol. 2006, 146, 524–532. [Google Scholar] [CrossRef]
- Aktas, O.; Waiczies, S.; Smorodchenko, A.; Dörr, J.; Seeger, B.; Prozorovski, T.; Sallach, S.; Endres, M.; Brocke, S.; Nitsch, R.; et al. Treatment of relapsing paralysis in experimental encephalomyelitis by targeting Th1 cells through atorvastatin. J. Exp. Med. 2003, 197, 725–733. [Google Scholar] [CrossRef]
- Vosper, J.; Masuccio, A.; Kullmann, M.; Ploner, C.; Geley, S.; Hengst, L. Statin-induced depletion of geranylgeranyl pyrophosphate inhibits cell proliferation by a novel pathway of Skp2 degradation. Oncotarget 2015, 6, 2889–2902. [Google Scholar] [CrossRef][Green Version]
- Feldt, M.; Bjarnadottir, O.; Kimbung, S.; Jirström, K.; Bendahl, P.O.; Veerla, S.; Grabau, D.; Hedenfalk, I.; Borgquist, S. Statin-induced anti-proliferative effects via cyclin D1 and p27 in a window-of-opportunity breast cancer trial. J. Transl. Med. 2015, 13, 133. [Google Scholar] [CrossRef]
- Wang, S.T.; Ho, H.J.; Lin, J.T.; Shieh, J.J.; Wu, C.Y. Simvastatin-induced cell cycle arrest through inhibition of STAT3/SKP2 axis and activation of AMPK to promote p27 and p21 accumulation in hepatocellular carcinoma cells. Cell Death Dis. 2017, 8, e2626. [Google Scholar] [CrossRef]
- Samson, K.T.R.; Minoguchi, K.; Tanaka, A.; Oda, N.; Yokoe, T.; Okada, S.; Yamamoto, Y.; Watanabe, Y.; Yamamoto, M.; Ohta, S.; et al. Effect of fluvastatin on apoptosis in human CD4+T cells. Cell. Immunol. 2005, 235, 136–144. [Google Scholar] [CrossRef]
- Qi, X.F.; Zheng, L.; Lee, K.J.; Kim, D.H.; Kim, C.S.; Cai, D.Q.; Wu, Z.; Qin, J.W.; Yu, Y.H.; Kim, S.K. HMG-CoA reductase inhibitors induce apoptosis of lymphoma cells by promoting ROS generation and regulating Akt, Erk and p38 signals via suppression of mevalonate pathway. Cell Death Dis. 2013, 4, e518. [Google Scholar] [CrossRef] [PubMed]
- Mohammed, A.; Qian, L.; Janakiram, N.B.; Lightfoot, S.; Steele, V.E.; Rao, C.V. Atorvastatin delays progression of pancreatic lesions to carcinoma by regulating PI3/AKT signaling in p48 Cre/+ LSL-Kras G12D/+ mice. Int. J. Cancer 2012, 131, 1951–1962. [Google Scholar] [CrossRef]
- Cemeus, C.; Zhao, T.T.; Barrett, G.M.; Lorimer, I.A.; Dimitroulakos, J. Lovastatin enhances gefitinib activity in glioblastoma cells irrespective of EGFRvIII and PTEN status. J. Neurooncol. 2008, 90, 9–17. [Google Scholar] [CrossRef]
- Green, D.R. Overview: Apoptotic signaling pathways in the immune system. Immunol. Rev. 2003, 193, 5–9. [Google Scholar] [CrossRef]
- Guimarães, C.A.; Linden, R. Programmed cell death: Apoptosis and alternative deathstyles. Eur. J. Biochem. 2004, 271, 1638–1650. [Google Scholar] [CrossRef] [PubMed]
- Kubota, T.; Fujisaki, K.; Itoh, Y.; Yano, T.; Sendo, T.; Oishi, R. Apoptotic injury in cultured human hepatocytes induced by HMG-CoA reductase inhibitors. Biochem. Pharmacol. 2004, 67, 2175–2186. [Google Scholar] [CrossRef] [PubMed]
- Alizadeh, J.; Zeki, A.A.; Mirzaei, N.; Tewary, S.; Moghadam, A.R.; Glogowska, A.; Nagakannan, P.; Eftekharpour, E.; Wiechec, E.; Gordon, J.W.; et al. Mevalonate cascade inhibition by Simvastatin induces the intrinsic apoptosis pathway via depletion of Isoprenoids in tumor cells. Sci. Rep. 2017, 7, 44841. [Google Scholar] [CrossRef] [PubMed]
- Kuzyk, C.L.; Anderson, C.C.; Roede, J.R. Simvastatin induces delayed apoptosis through disruption of glycolysis and mitochondrial impairment in neuroblastoma cells. Clin. Transl. Sci. 2020, 13, 563–572. [Google Scholar] [CrossRef]
- Wang, J.; Tokoro, T.; Matsui, K.; Higa, S.; Kitajima, I. Pitavastatin at low dose activates endothelial nitric oxide synthase through PI3K-AKT pathway in endothelial cells. Life Sci. 2005, 76, 2257–2268. [Google Scholar] [CrossRef]
- Katsumoto, M.; Shingu, T.; Kuwashima, R.; Nakata, A.; Nomura, S.; Chayama, K. Biphasic effect of HMG-CoA reductase inhibitor, Pitavastatin, on vascular endothelial cells and angiogenesis. Circ. J. 2005, 69, 1547–1555. [Google Scholar] [CrossRef]
- Sever, R.; Brugge, J.S. Signal transduction in cancer. Cold Spring Harb. Perspect. Med. 2015, 5, a006098. [Google Scholar] [CrossRef] [PubMed]
- Cagnol, S.; Chambard, J.C. ERK and cell death: Mechanisms of ERK-induced cell death—Apoptosis, autophagy and senescence. FEBS J. 2010, 277, 2–21. [Google Scholar] [CrossRef]
- Kim, Y.H.; Lee, D.H.; Jeong, J.H.; Guo, Z.S.; Lee, Y.J. Quercetin augments TRAIL-induced apoptotic death: Involvement of the ERK signal transduction pathway. Biochem. Pharmacol. 2008, 75, 1946–1958. [Google Scholar] [CrossRef] [PubMed]
- Bacus, S.S.; Gudkov, A.V.; Lowe, M.; Lyass, L.; Yung, Y.; Komarov, A.P.; Keyomarsi, K.; Yarden, Y.; Seger, R. Taxol-induced apoptosis depends on MAP kinase pathways (ERK and p38) and is independent of p53. Oncogene 2001, 20, 147–155. [Google Scholar] [CrossRef]
- Kim, G.S.; Hong, J.S.; Kim, S.W.; Koh, J.M.; An, C.S.; Choi, J.Y.; Cheng, S.L. Leptin induces apoptosis via ERK/cPLA2/cytochrome c pathway in human bone marrow stromal cells. J. Biol. Chem. 2003, 278, 21920–21929. [Google Scholar] [CrossRef] [PubMed]
- Nesterov, A.; Nikrad, M.; Johnson, T.; Kraft, A.S. Oncogenic Ras sensitizes normal human cells to tumor necrosis factor-α-related apoptosis-inducing ligand-induced apoptosis. Cancer Res. 2004, 64, 3922–3927. [Google Scholar] [CrossRef] [PubMed]
- Zhang, X.; Shan, P.; Sasidhar, M.; Chupp, G.L.; Flavell, R.A.; Choi, A.M.K.; Lee, P.J. Reactive oxygen species and extracellular signal-regulated kinase 1/2 mitogen-activated protein kinase mediate hyperoxia-induced cell death in lung epithelium. Am. J. Respir. Cell Mol. Biol. 2003, 28, 305–315. [Google Scholar] [CrossRef] [PubMed]
- Kim, Y.K.; Kim, H.J.; Kwon, C.H.; Kim, J.H.; Woo, J.S.; Jung, J.S.; Kim, J.M. Role of ERK activation in cisplatin-induced apoptosis in OK renal epithelial cells. J. Appl. Toxicol. 2005, 25, 374–382. [Google Scholar] [CrossRef]
- Panaretakis, T.; Hjortsberg, L.; Tamm, K.P.; Björklund, A.C.; Joseph, B.; Grander, D. Interferon α induces nucleus-independent apoptosis by activating extracellular signal-regulated kinase 1/2 and c-Jun NH2-terminal kinase downstream of phosphatidylinositol 3-kinase and mammalian target of rapamycin. Mol. Biol. Cell. 2008, 19, 41–50. [Google Scholar] [CrossRef]
- Li, H.; Wang, X.; Li, N.; Qiu, J.; Zhang, Y.; Cao, X. hPEBP4 resists TRAIL-induced apoptosis of human prostate cancer cells by activating Akt and deactivating ERK1/2 pathways. J. Biol. Chem. 2007, 282, 4943–4950. [Google Scholar] [CrossRef] [PubMed]
- Honigmann, A.; Mueller, V.; Ta, H.; Schoenle, A.; Sezgin, E.; Hell, S.W.; Eggeling, C. Scanning STED-FcS reveals spatiotemporal heterogeneity of lipid interaction in the plasma membrane of living cells. Nat. Commun. 2014, 5, 5412. [Google Scholar] [CrossRef]
- Hou, T.Y.; McMurray, D.N.; Chapkin, R.S. Omega-3 fatty acids, lipid rafts, and T cell signaling. Eur. J. Pharmacol. 2016, 785, 2–9. [Google Scholar] [CrossRef] [PubMed]
- Zhuang, L.; Kim, J.; Adam, R.M.; Solomon, K.R.; Freeman, M.R. Cholesterol targeting alters lipid raft composition and cell survival in prostate cancer cells and xenografts. J. Clin. Investig. 2005, 115, 959–968. [Google Scholar] [CrossRef]
- Furuchi, T.; Anderson, R.G.W. Cholesterol depletion of caveolae causes hyperactivation of extracellular signal-related kinase (ERK). J. Biol. Chem. 1998, 273, 21099–21104. [Google Scholar] [CrossRef] [PubMed]
- Catapano, A.L. Pitavastatin: A different pharmacological profile. Clin. Lipidol. 2012, 7, 3–9. [Google Scholar] [CrossRef]


Publisher’s Note: MDPI stays neutral with regard to jurisdictional claims in published maps and institutional affiliations. |
© 2021 by the authors. Licensee MDPI, Basel, Switzerland. This article is an open access article distributed under the terms and conditions of the Creative Commons Attribution (CC BY) license (https://creativecommons.org/licenses/by/4.0/).
Share and Cite
Voss, L.; Guttek, K.; Reddig, A.; Reinhold, A.; Voss, M.; Simeoni, L.; Schraven, B.; Reinhold, D. Pitavastatin Is a Highly Potent Inhibitor of T-Cell Proliferation. Pharmaceuticals 2021, 14, 727. https://doi.org/10.3390/ph14080727
Voss L, Guttek K, Reddig A, Reinhold A, Voss M, Simeoni L, Schraven B, Reinhold D. Pitavastatin Is a Highly Potent Inhibitor of T-Cell Proliferation. Pharmaceuticals. 2021; 14(8):727. https://doi.org/10.3390/ph14080727
Chicago/Turabian StyleVoss, Linda, Karina Guttek, Annika Reddig, Annegret Reinhold, Martin Voss, Luca Simeoni, Burkhart Schraven, and Dirk Reinhold. 2021. "Pitavastatin Is a Highly Potent Inhibitor of T-Cell Proliferation" Pharmaceuticals 14, no. 8: 727. https://doi.org/10.3390/ph14080727
APA StyleVoss, L., Guttek, K., Reddig, A., Reinhold, A., Voss, M., Simeoni, L., Schraven, B., & Reinhold, D. (2021). Pitavastatin Is a Highly Potent Inhibitor of T-Cell Proliferation. Pharmaceuticals, 14(8), 727. https://doi.org/10.3390/ph14080727