
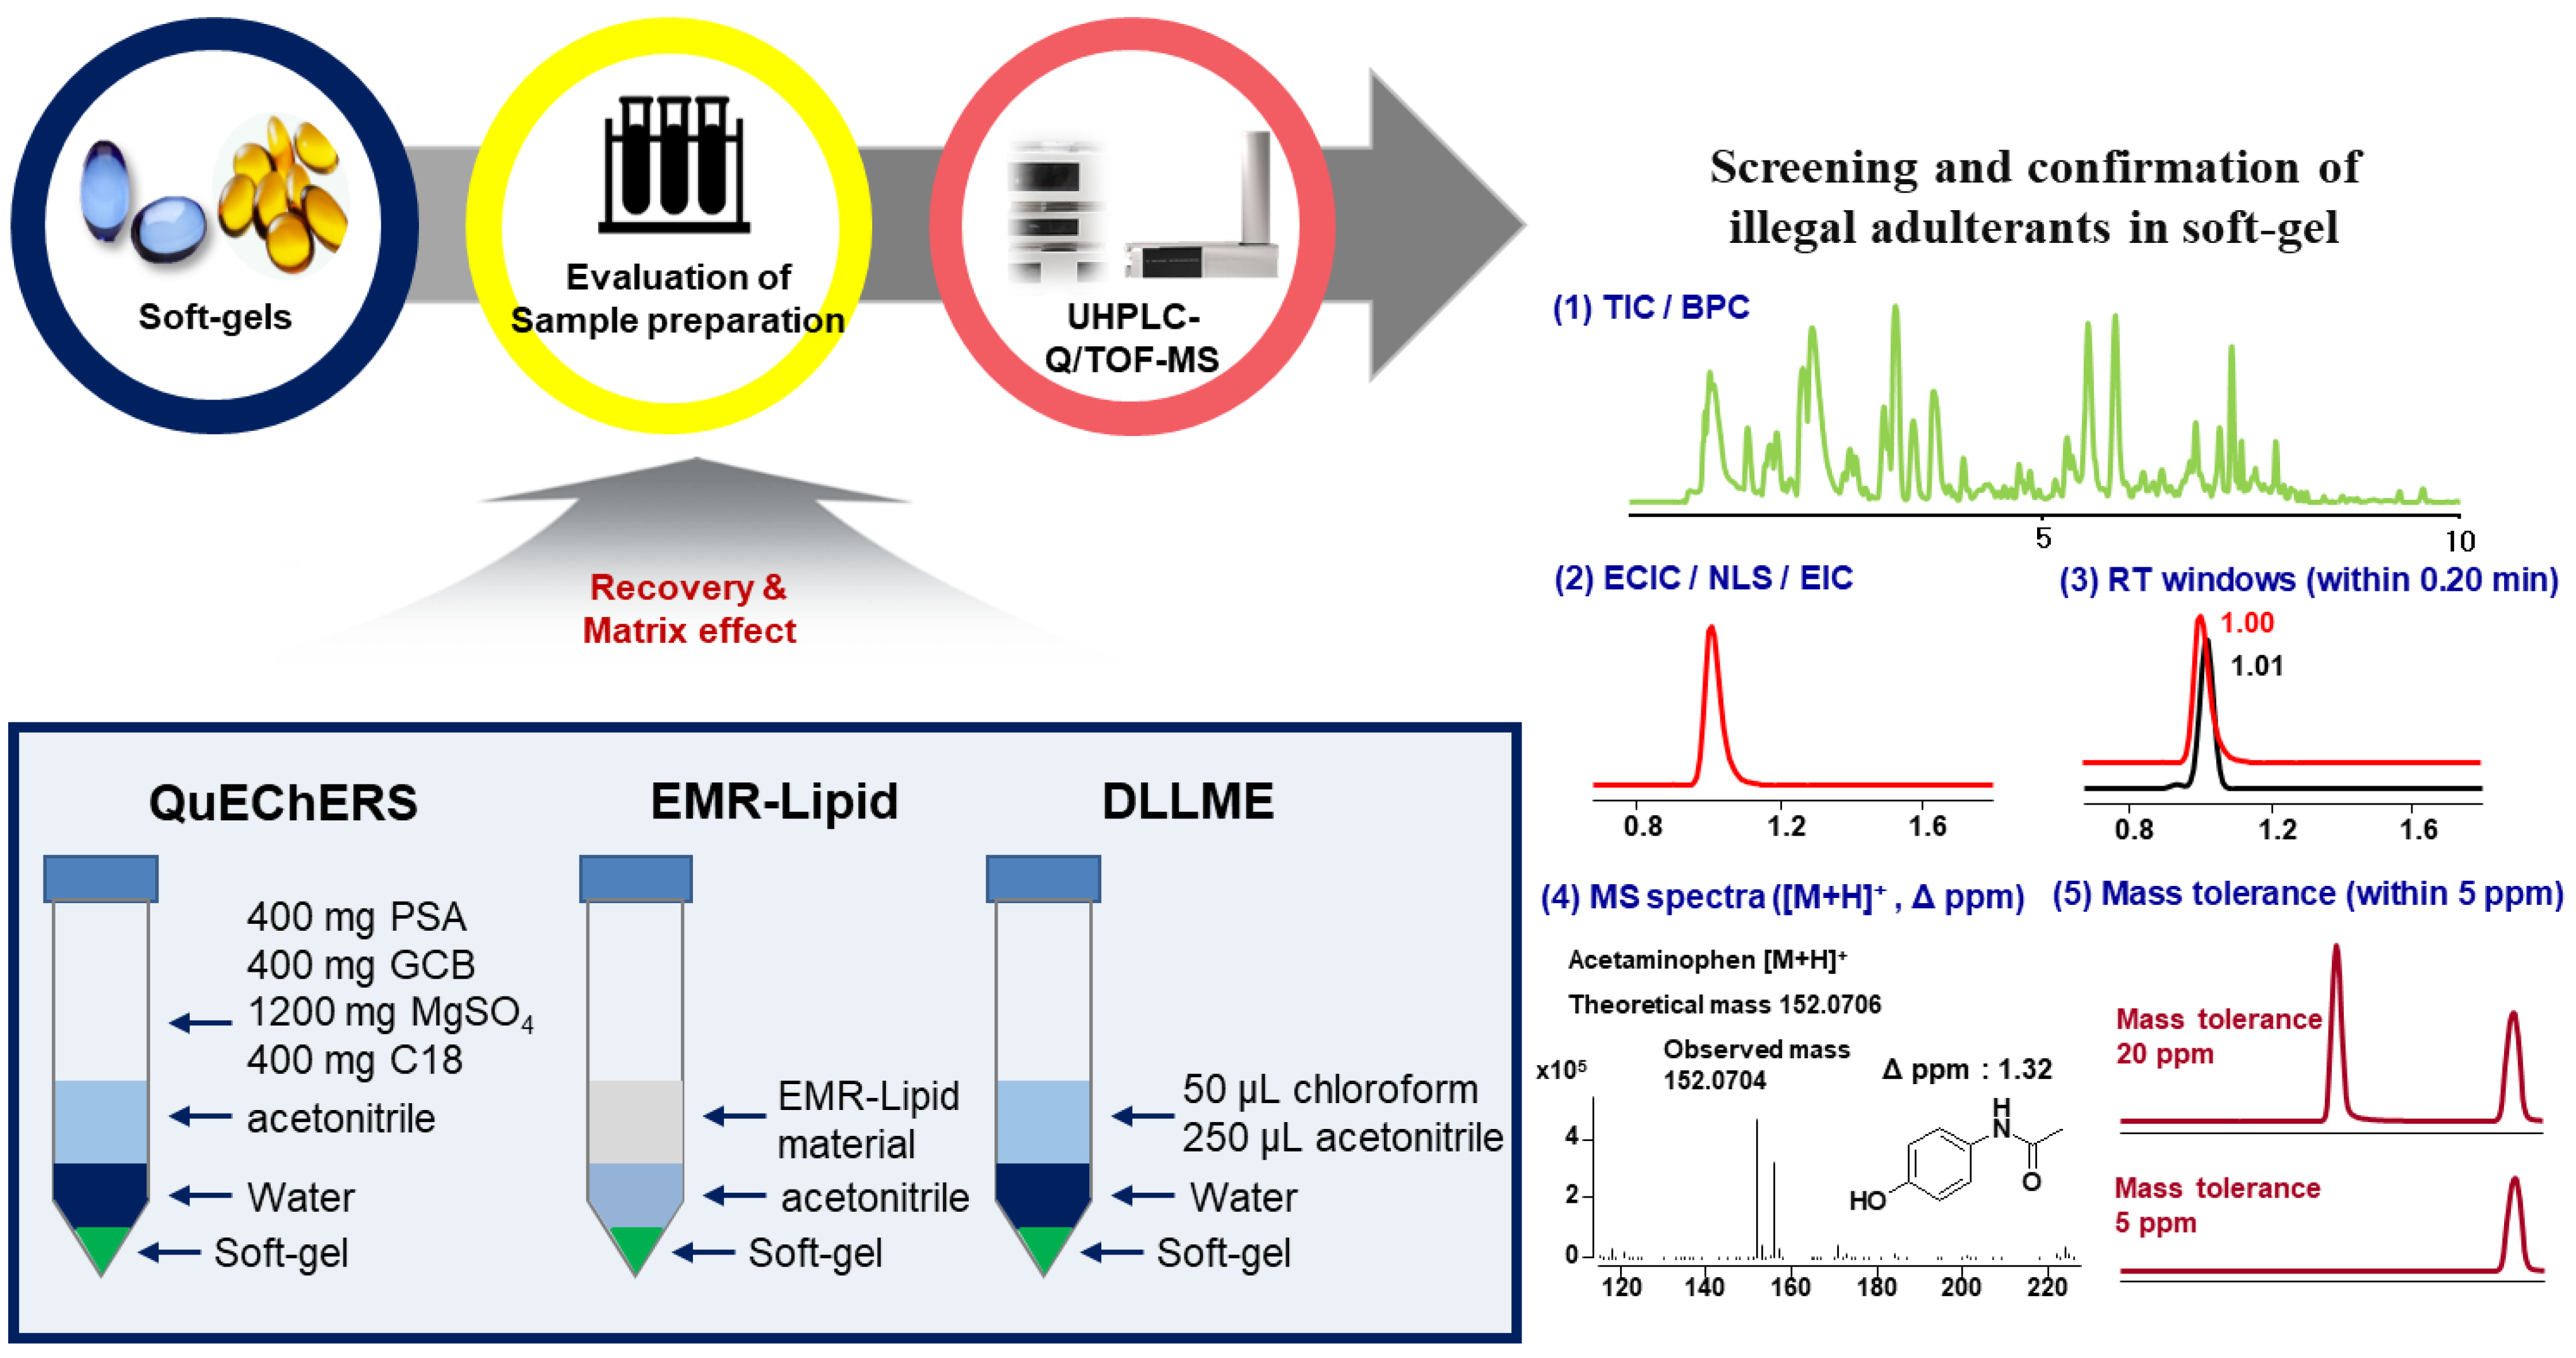
Efficient Matrix Cleanup of Soft-Gel-Type Dietary Supplements for Rapid Screening of 92 Illegal Adulterants Using EMR-Lipid dSPE and UHPLC-Q/TOF-MS


Abstract
1. Introduction
2. Results and Discussion
2.1. Extraction and Cleanup Methods
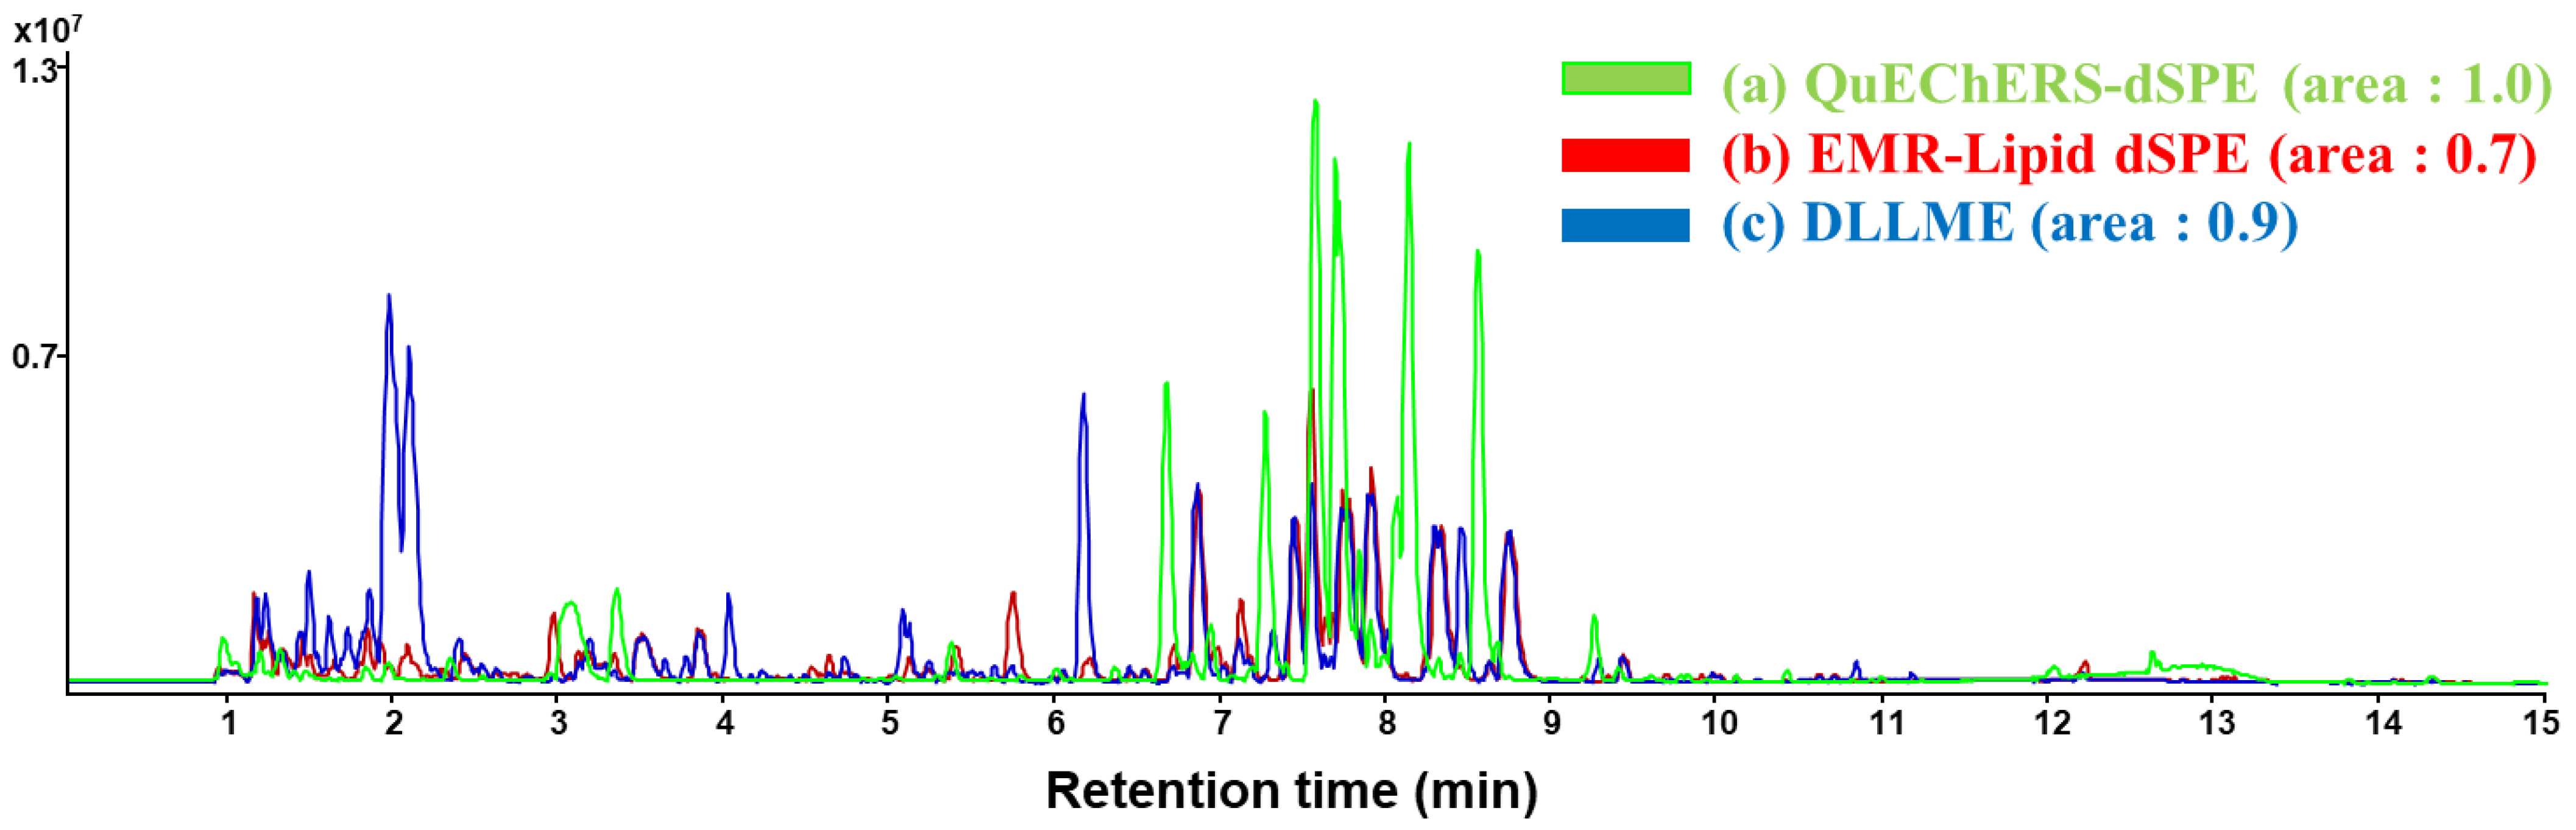
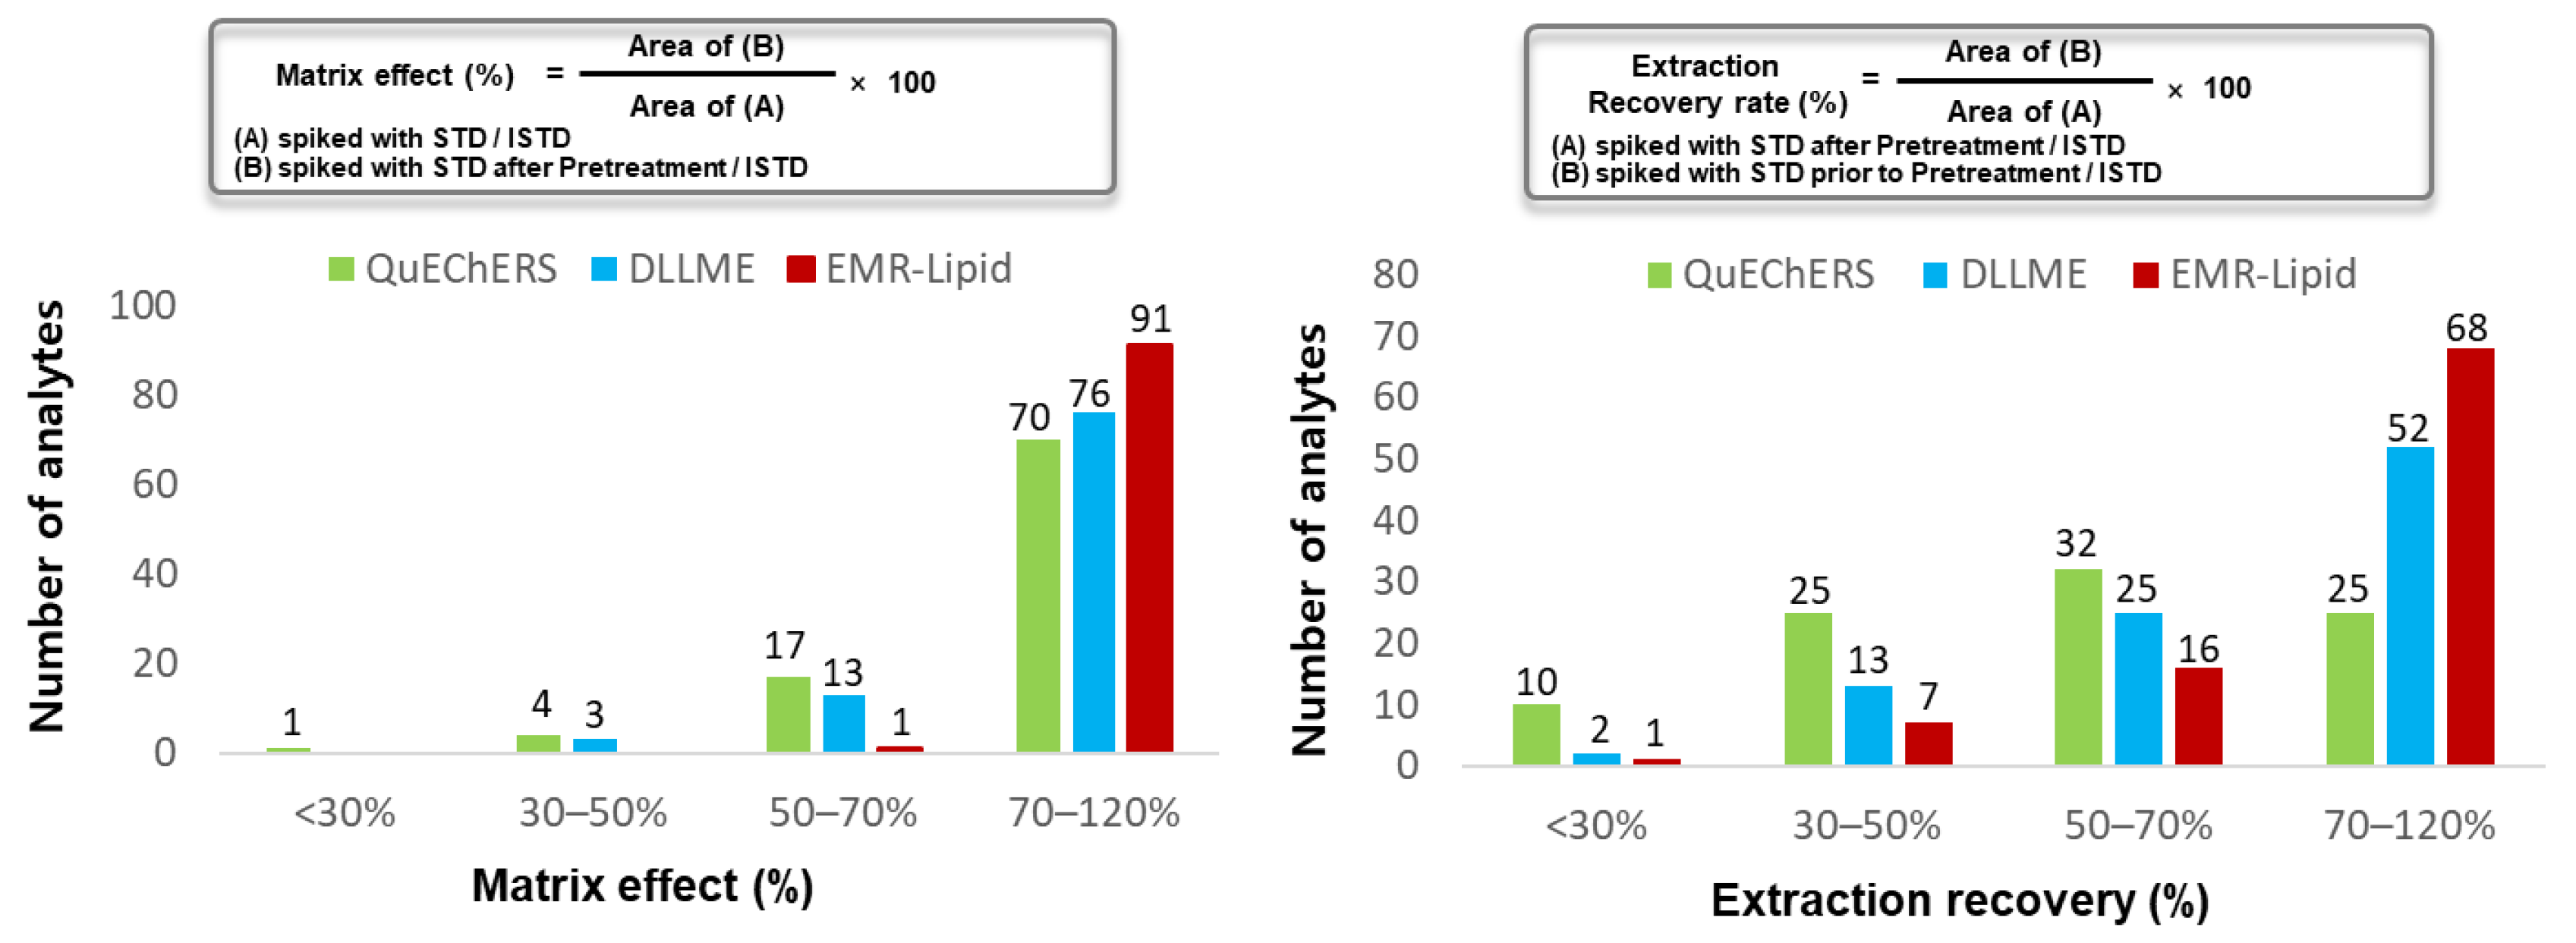
2.2. Comparison of DLLME, QuEChERS-dSPE, and EMR-Lipid dSPE Methods
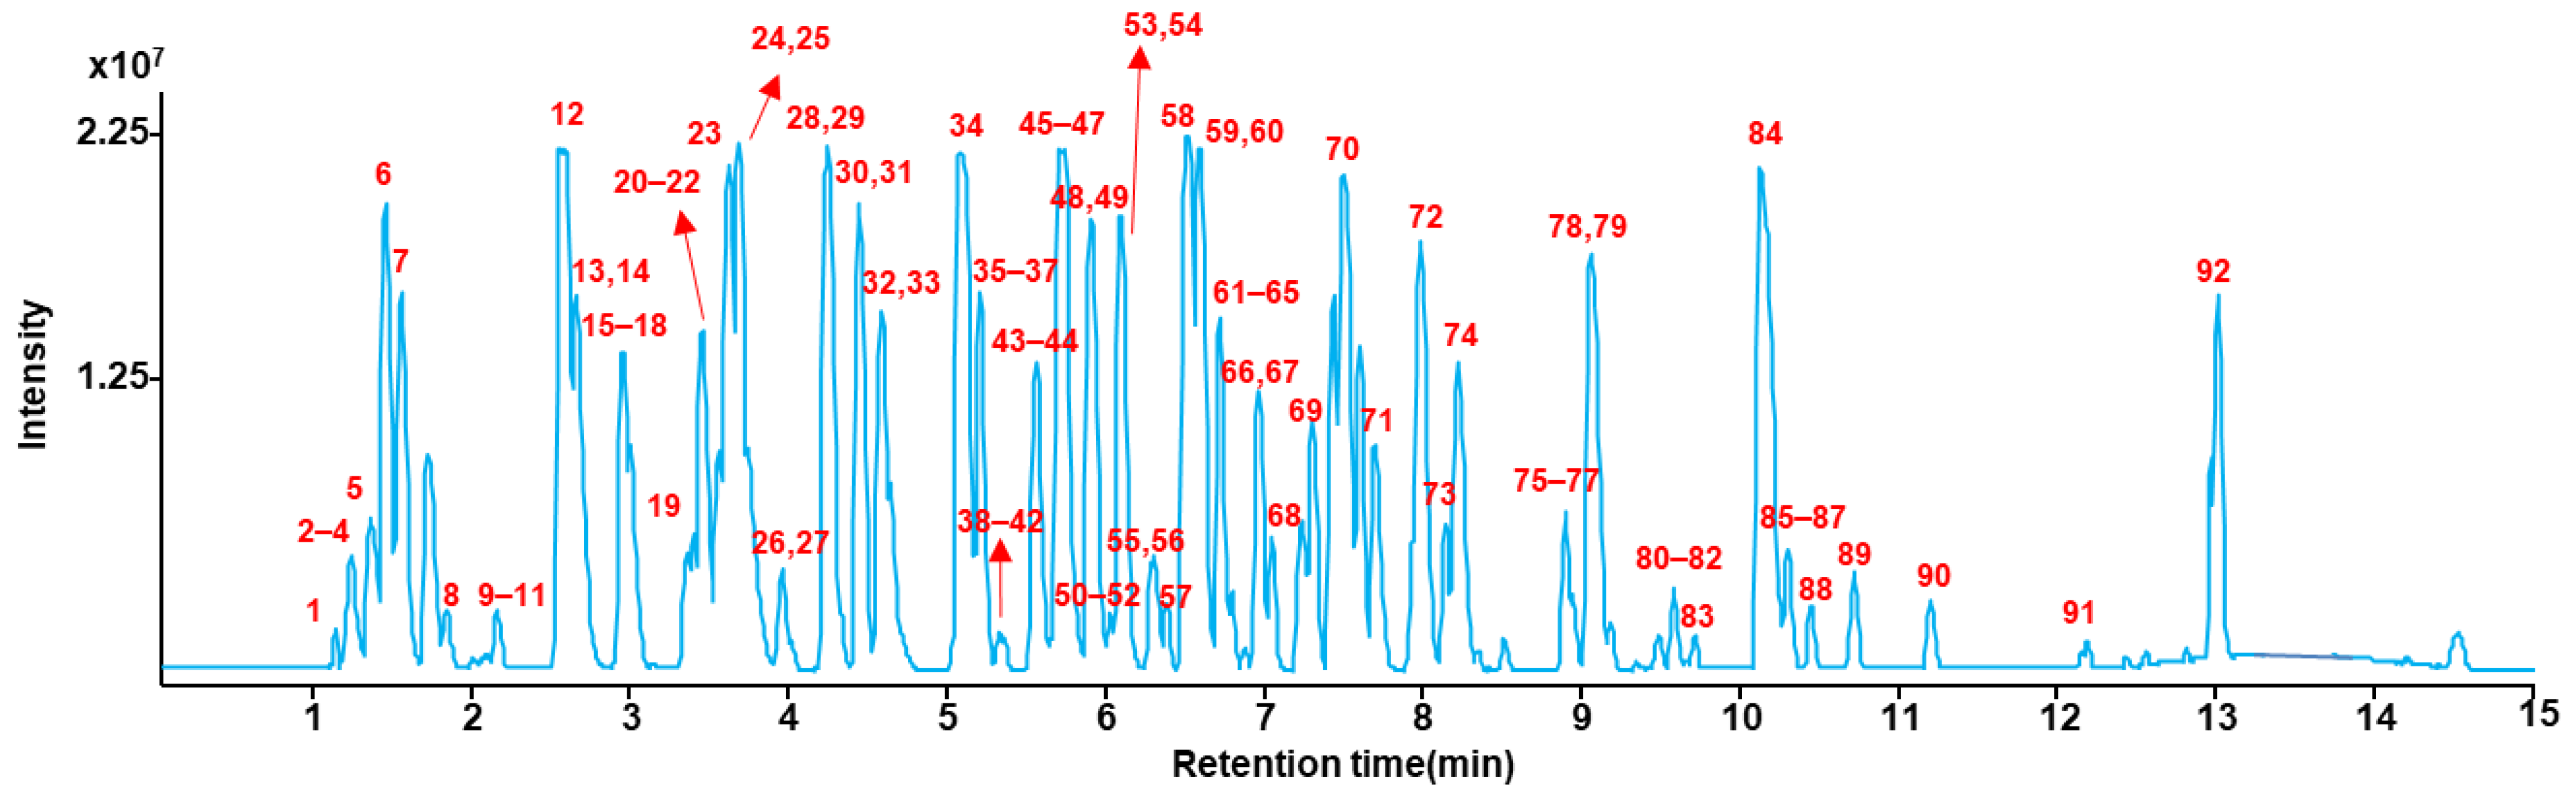
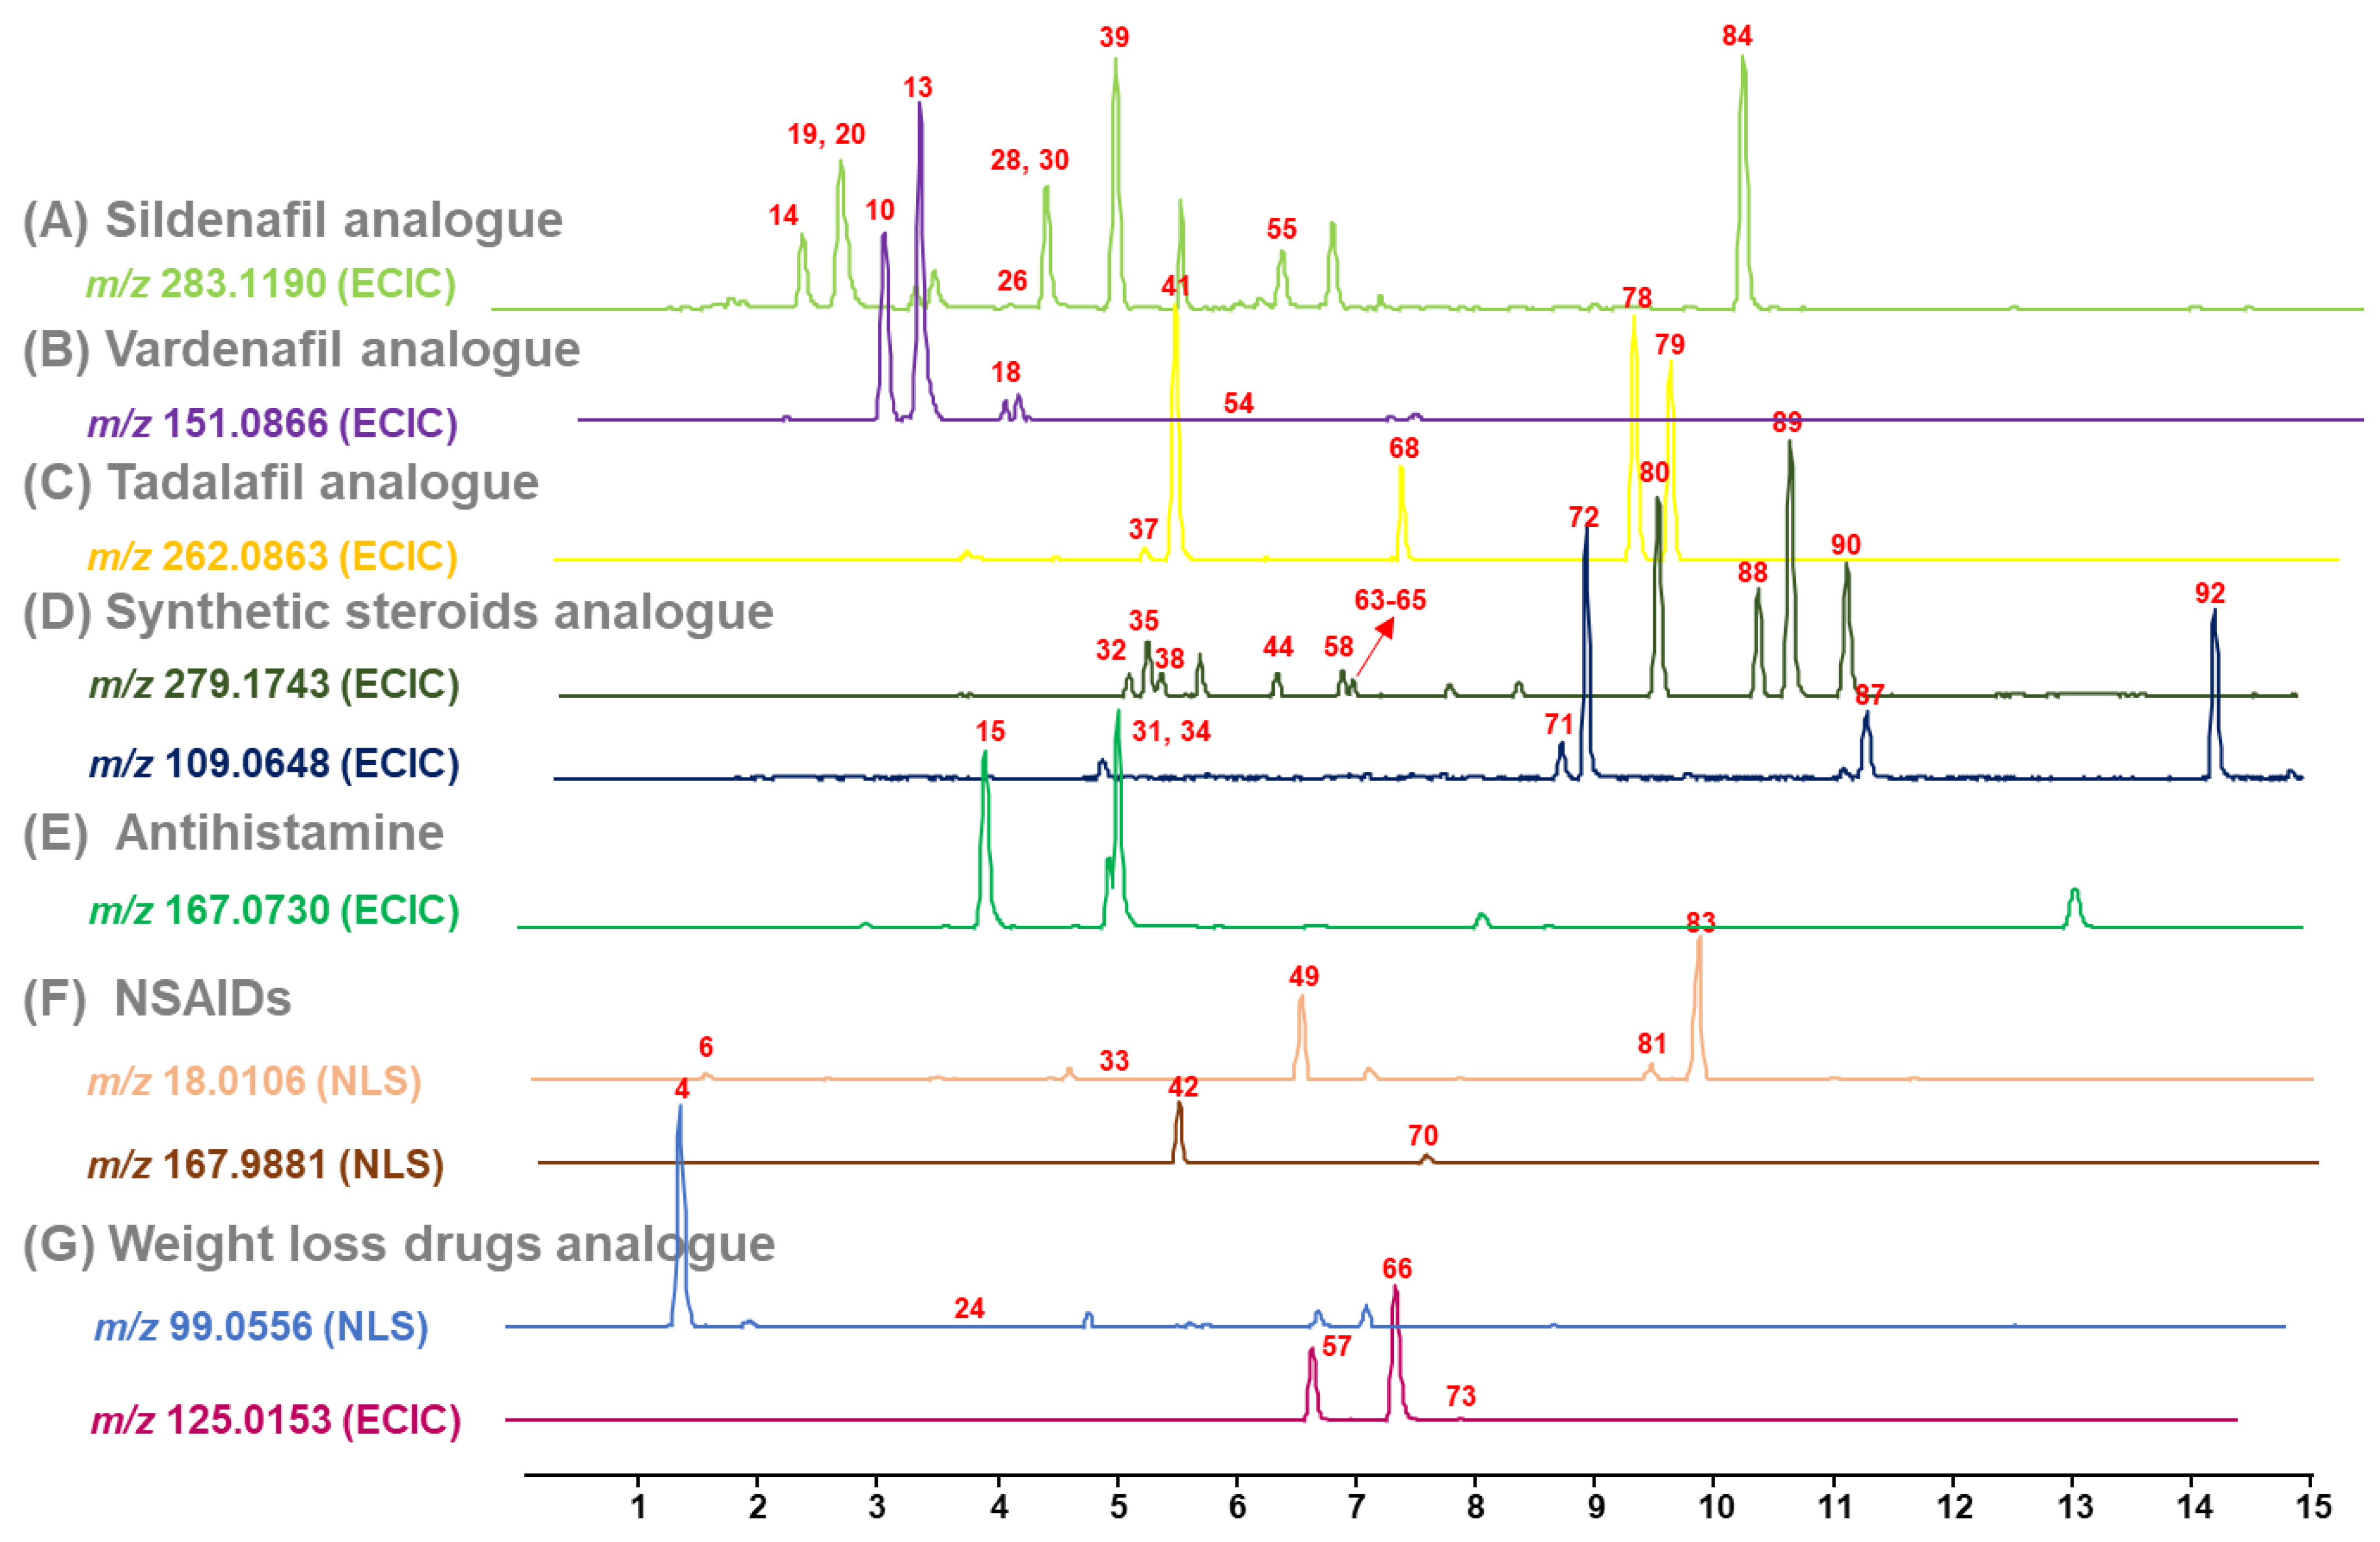
2.3. Analysis of 92 Illegal Adulterants by UHPLC-Q/TOF-MS
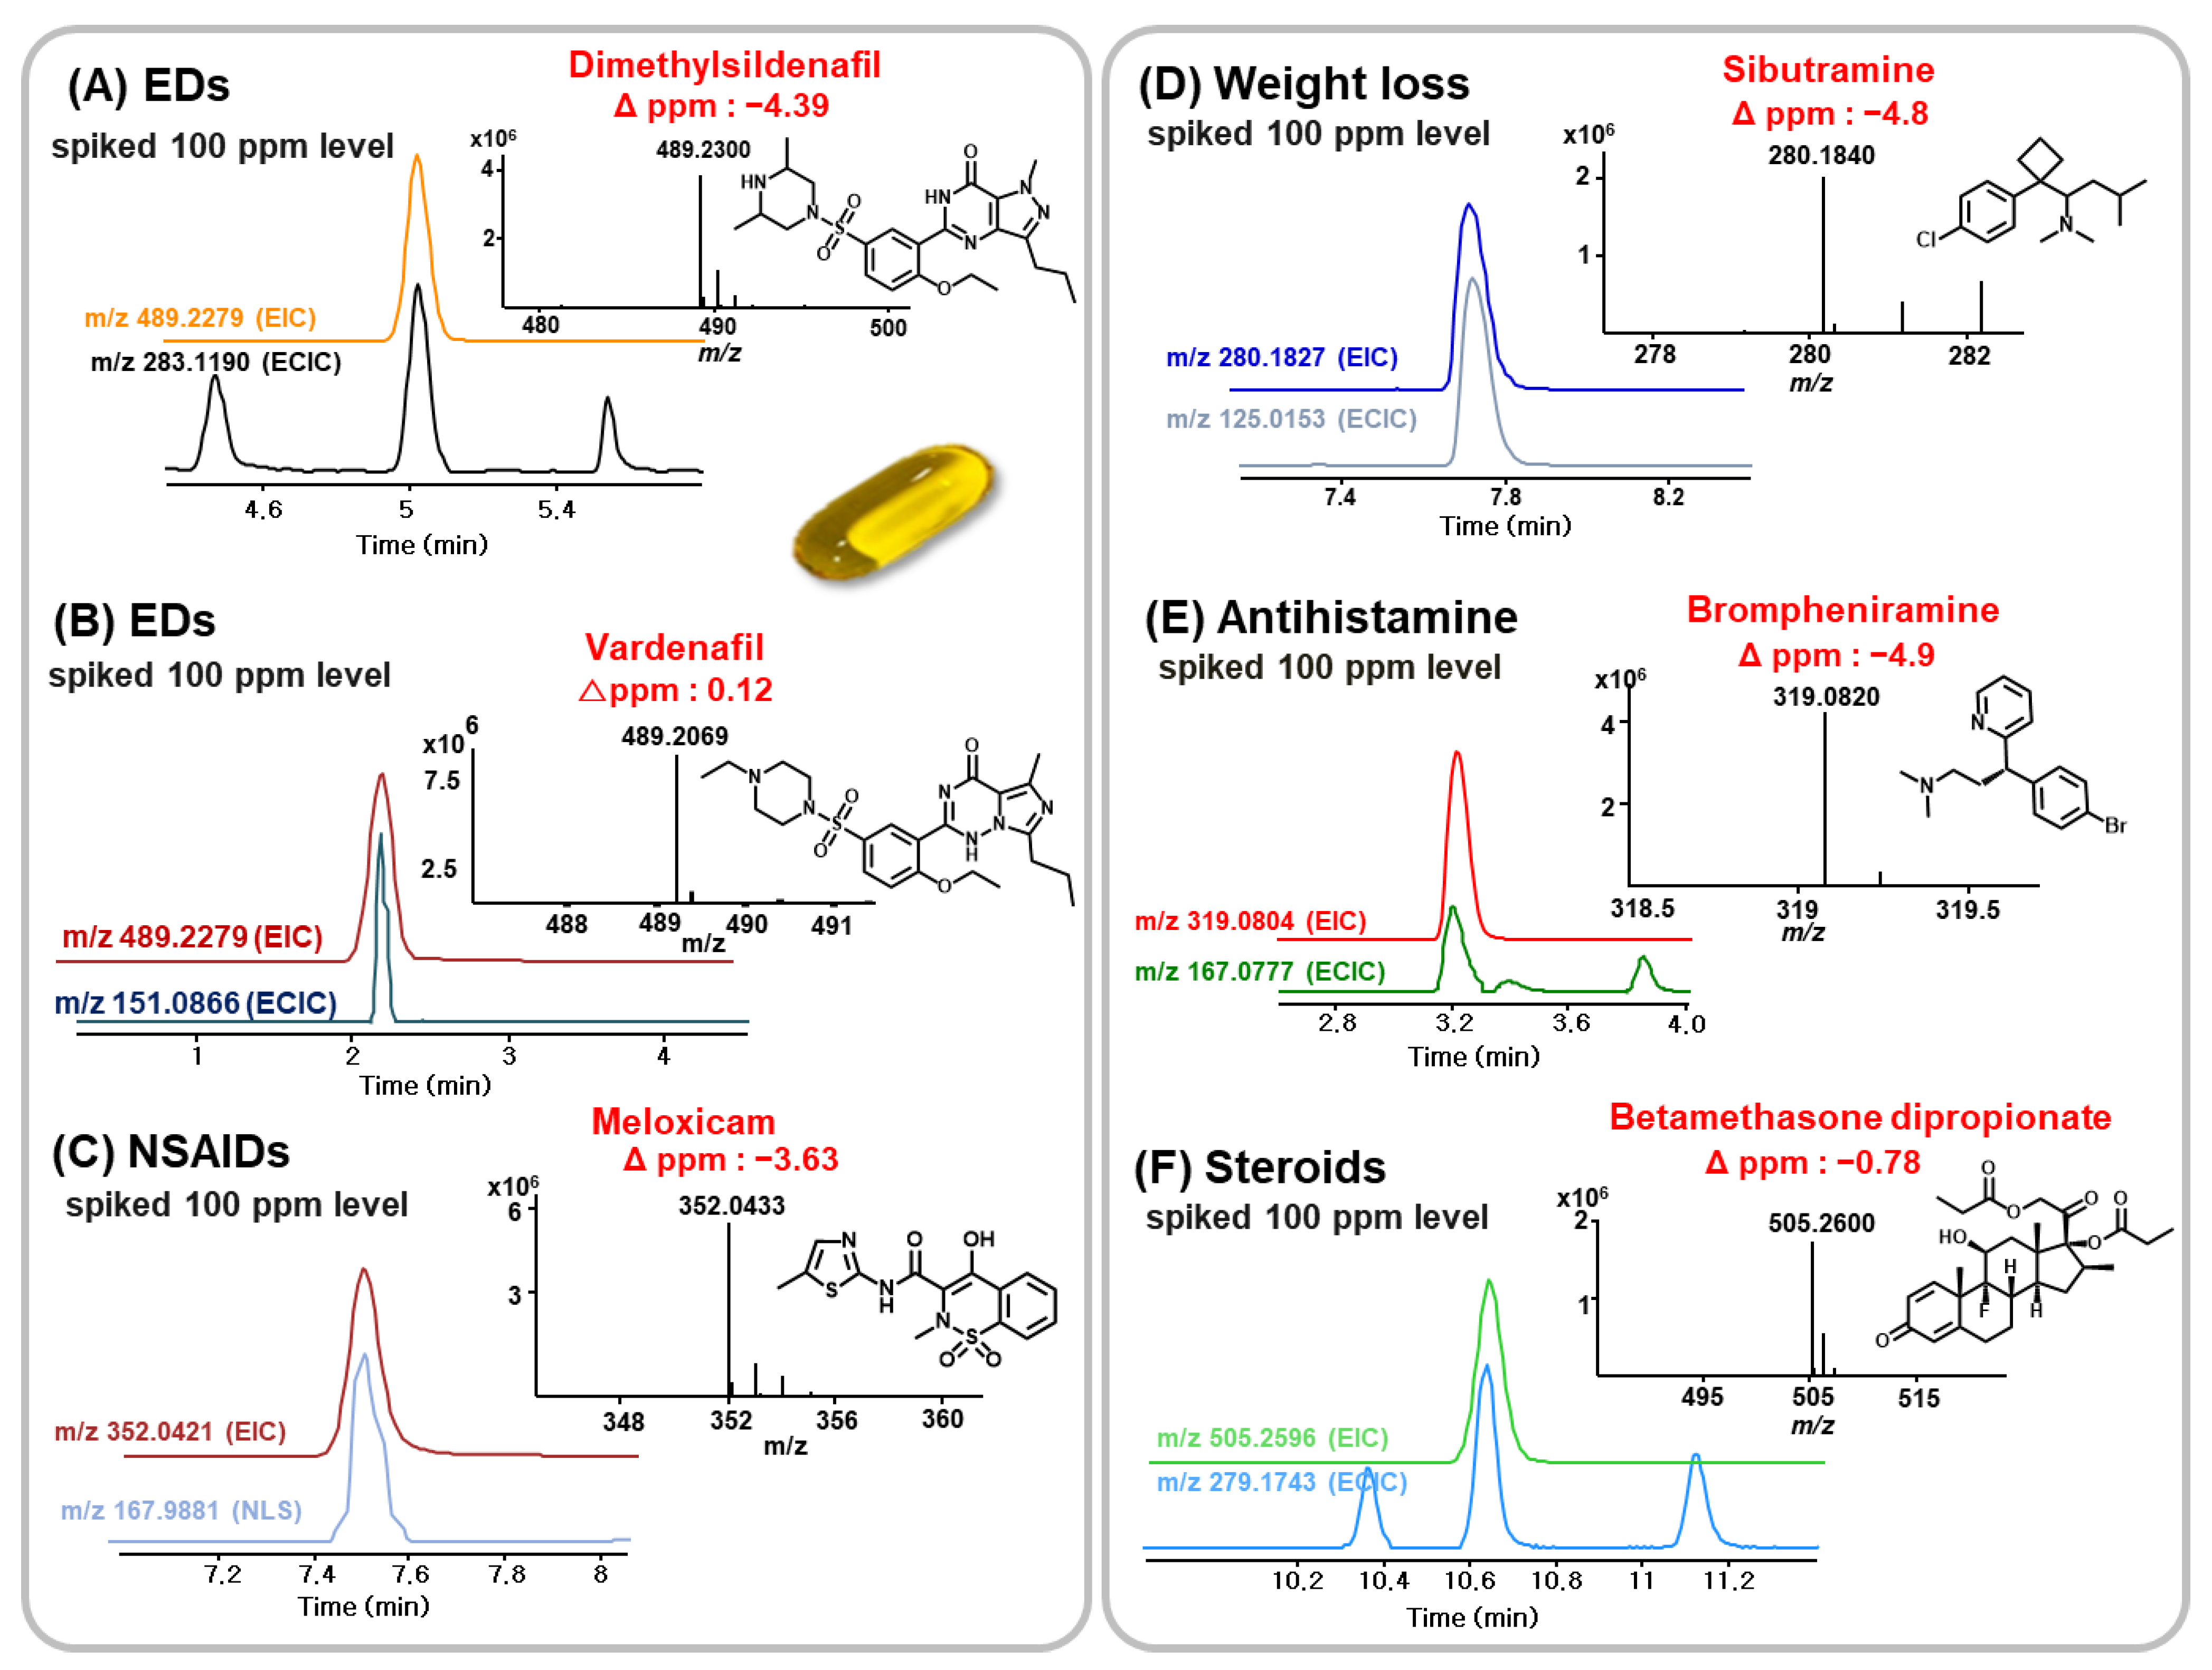
2.4. Method Applications
3. Experiments
3.1. Chemicals and Materials
3.2. Preparation of Reference Standards
3.3. Sample Preparation
3.4. UHPLC Conditions
3.5. Q/TOF-MS Conditions
3.6. Method Validation
3.7. Application
4. Conclusions
Supplementary Materials
Author Contributions
Funding
Institutional Review Board Statement
Informed Consent Statement
Data Availability Statement
Conflicts of Interest
References
- The Production Performance of Food, Food Additive, Health Functional Food, and Livestock Products in 2019. Available online: https://www.mfds.go.kr/brd/m_374/view.do?seq=30200&srchFr=&srchTo=&srchWord=&srchTp=&itm_seq_1=0&itm_seq_2=0&multi_itm_seq=0&company_cd=&company_nm=&page=1 (accessed on 14 June 2021).
- Kang, S.H.R.Y.P.; Park, S.; Huh, Y.; Lee, J.; Park, J.H.; Kim, D.; Kwon, S.W. Determination of tadalafil and N-desmethyl sibutramine in health and dietary supplements using ultra-performance liquid chromatography (UPLC) coupled with quadrupole-time-of-flight mass spectrometry (Q-TOF MS). Food Addit. Contam. 2011, 28, 1475–1482. [Google Scholar]
- Park, M.; Ahn, S. Quantitative Analysis of Sildenafil and Tadalafil in Various Fake Drugs Recently Distributed in Korea. J. Forensic Sci. 2012, 57, 1637–1640. [Google Scholar] [CrossRef]
- Vaysse, J.; Gilard, V.; Balayssac, S.; Zedde, C.; Martino, R.; Malet-Martino, M. Identification of a novel sildenafil analogue in an adulterated herbal supplement. J. Pharm. Biomed. Anal. 2012, 59, 58–66. [Google Scholar] [CrossRef]
- Lee, W.; Kim, H.J.; Lee, M.E.; Kim, B.H.; Park, S.C.; Lee, J.H.; Lee, Y.M.; Oh, H.B.; Hong, J. Reliable screening and classification of phosphodiesterase type 5 inhibitors in dietary supplements using gas chromatography/mass spectrometry combined with specific common ions. J. Chromatogr. A 2020, 1623, 461210. [Google Scholar] [CrossRef]
- Liu, Y.; Pi, J.; Jin, P.; Xie, X.; Zhang, Y.; Yue, Z.; Mai, X.; Fan, H.; Zhang, W. Multi-dimensional fingerprint profiling analysis for screening and quantification of illegal adulterated antidiabetics in hypoglycemic health products by aqueous two-phase extraction and multi-wavelength detection. J. Chromatogr. A 2020, 1622, 461149. [Google Scholar] [CrossRef] [PubMed]
- Gullapalli, R.P. Soft Gelatin Capsules (Softgels). J. Pharm. Sci. 2010, 99, 4107–4148. [Google Scholar] [CrossRef] [PubMed]
- Damian, F.; Harati, M.; Schwartzenhauer, J.; Cauwenberghe, O.V.; Wettig, S.D. Challenges of Dissolution Methods Development for Soft Gelatin Capsules. Pharmaceutics 2021, 13, 214. [Google Scholar] [CrossRef] [PubMed]
- Bende, G.; Biswal, S.; Bhad, P.; Chen, Y.; Salunke, A.; Winter, S.; Wagner, R.; Sunkara, G. Relative bioavailability of diclofenac potassium from softgel capsule versus powder for oral solution and immediate-release tablet formulation. Clin. Pharmacol. Drug Dev. 2016, 5, 76–82. [Google Scholar] [CrossRef]
- Gupta, S.; Kesarla, R.; Omri, A. Formulation strategies to improve the bioavailability of poorly absorbed drugs with special emphasis on self-emulsifying systems. Int. Sch. Res. Not. 2013, 2013, 848043. [Google Scholar] [CrossRef] [PubMed]
- Moreira, A.P.L.; Motta, M.J.; Molin, T.R.D.; Viana, C.; De Carvalho, L.M. Determination of diuretics and laxatives as adulterants in herbal formulations for weight loss. Food Addit. Contam. Part A 2013, 30, 1230–1237. [Google Scholar] [CrossRef]
- Venhuis, B.; de Kaste, D. Towards a decade of detecting new analogues of sildenafil, tadalafil and vardenafil in food supplements: A history, analytical aspects and health risks. J. Pharm. Biomed. Anal. 2012, 69, 196–208. [Google Scholar] [CrossRef]
- Jeong, J.H.; Lee, J.H.; Kim, H.J.; Park, H.J.; Hwang, I.S.; Han, K.M.; Yoon, C.-Y.; Cho, S.; Kim, W.S. LC-ESI-MS/MS analysis of phosphodiesterase-5 inhibitors and their analogues in foods and dietary supplements in Korea. Food Addit. Contam. Part B 2015, 9, 1–8. [Google Scholar] [CrossRef]
- Lee, J.H.; Na Park, H.; Park, O.R.; Kim, N.S.; Park, S.-K.; Kang, H. Screening of illegal sexual enhancement supplements and counterfeit drugs sold in the online and offline markets between 2014 and 2017. Forensic Sci. Int. 2019, 298, 10–19. [Google Scholar] [CrossRef]
- Lee, E.-S.; Lee, J.H.; Han, K.M.; Kim, J.W.; Hwang, I.S.; Cho, S.Y.; Han, S.Y.; Kim, J.H. Simultaneous determination of 38 phosphodiesterase-5 inhibitors in illicit erectile dysfunction products by liquid chromatography-electrospray ionization-tandem mass spectrometry. J. Pharm. Biomed. Anal. 2013, 83, 171–178. [Google Scholar] [CrossRef] [PubMed]
- Ki, N.-Y.; Hur, J.; Kim, B.H.; Kim, K.H.; Moon, B.J.; Bin Oh, H.; Hong, J. Rapid screening of sulfonamides in dietary supplements based on extracted common ion chromatogram and neutral loss scan by LC-Q/TOF-mass spectrometry. J. Food Drug Anal. 2019, 27, 164–174. [Google Scholar] [CrossRef] [PubMed]
- Kim, E.H.; Seo, H.S.; Ki, N.Y.; Park, N.-H.; Lee, W.; Do, J.A.; Park, S.; Baek, S.Y.; Moon, B.; Bin Oh, H.; et al. Reliable screening and confirmation of 156 multi-class illegal adulterants in dietary supplements based on extracted common ion chromatograms by ultra-high-performance liquid chromatography-quadrupole/time of flight-mass spectrometry. J. Chromatogr. A 2017, 1491, 43–56. [Google Scholar] [CrossRef] [PubMed]
- Hachema, R.; Assemata, G.; Martinsb, N.; Balayssaca, S.; Gilarda, V.; Martinoa, R.; Malet-Martinoa, M. Proton NMR for detection, identification and quantification of adulterants in 160 herbal food supplements marketed for weight loss. J. Pharm. Biomed. Anal. 2016, 124, 34–47. [Google Scholar] [CrossRef] [PubMed]
- Vazquez, P.P.; Ferrer, C.; Bueno, M.J.M.; Fernandez-Alba, A.R. Pesticide residues in spices and herbs: Sample preparation methods and determination by chromatographic techniques. TrAC-Trends Anal. Chem. 2019, 115, 13–22. [Google Scholar] [CrossRef]
- Ma, L.; Wang, Y.; Li, H.; Peng, F.; Qiu, B.; Yang, Z. Development of QuEChERS-DLLME method for determination of neonicotinoid pesticide residues in grains by liquid chromatography-tandem mass spectrometry. Food Chem. 2020, 331, 127190. [Google Scholar] [CrossRef]
- Morais, E.H.C.; Collins, C.H.; Jardim, I.C.S.F. Pesticide determination in sweet peppers using QuEChERS and LC–MS/MS. Food Chem. 2018, 249, 77–83. [Google Scholar] [CrossRef]
- Hernández-Mesa, M.; García-Campaña, A.M. Determination of sulfonylurea pesticide residues in edible seeds used as nutraceuticals by QuEChERS in combination with ultra-high-performance liquid chromatography-tandem mass spectrometry. J. Chromatogr. A 2020, 1617, 460831. [Google Scholar] [CrossRef]
- Li, J.; Roh, S.H.; Shaodong, J.; Hong, J.Y.; Lee, D.-K.; Shin, B.-K.; Park, J.H.; Lee, J.; Kwon, S.W. Solid-phase extraction assisted dispersive liquid-liquid microextraction based on solidification of floating organic droplet to determine sildenafil and its analogues in dietary supplements. J. Sep. Sci. 2017, 40, 3120–3129. [Google Scholar] [CrossRef] [PubMed]
- Han, L.; Matarritab, J.; Sapozhnikovab, Y.; Lehotay, S.J. Evaluation of a recent product to remove lipids and other matrix co-extractives in the analysis of pesticide residues and environmental contaminants in foods. J. Chromatogr. A 2016, 1449, 17–29. [Google Scholar] [CrossRef] [PubMed]
- Rafael, L.B.; Rocío, N.M.; José, R.M. Evaluation of different cleanup sorbents for multiresidue pesticide analysis in fatty vegetable matrices by liquid chromatography tandem mass spectrometry. J. Chromatogr. A 2016, 1456, 89–104. [Google Scholar]
- Gonzalez, D.M.; Duran, J.A.; Addona, S.M.; Cambra, M.B. Multi-residue pesticide analysis in virgin olive oil by nanoflow liquid chromatography high resolution mass spectrometry. J. Chromatogr. A 2018, 1562, 27–35. [Google Scholar] [CrossRef]
- Vázquez, P.P.; Hakme, E.; Uclés, S.; Cutillas, V.; Galera, M.M.; Mughari, A.; Fernández-Alba, A. Large multiresidue analysis of pesticides in edible vegetable oils by using efficient solid-phase extraction sorbents based on quick, easy, cheap, effective, rugged and safe methodology followed by gas chromatography–tandem mass spectrometry. J. Chromatogr. A 2016, 1463, 20–31. [Google Scholar] [CrossRef]
- Hur, J.; Lee, W.; Kim, B.H.; Kim, H.J.; Lee, D.H.; Lee, J.H.; Lee, Y.M.; Bin Oh, H.; Hong, J. Comprehensive screening of multiclass illegal adulterants in herbal supplements and Spice-type drugs using specific MS/MS fragmentations by UHPLC-Q/TOF-MS. Anal. Methods 2019, 11, 5260–5273. [Google Scholar] [CrossRef]
- Baduel, C.; Mueller, J.F.; Tsai, H.; Ramos, M.J.G. Development of sample extraction and clean-up strategies for target and non-target analysis of environmental contaminants in biological matrices. J. Chromatogr. A 2015, 1426, 33–47. [Google Scholar] [CrossRef]
- Campone, L.; Piccinelli, A.L.; Pagano, I.; Carabetta, S.; Di Sanzo, R.; Russo, M.; Rastrelli, L. Determination of phenolic compounds in honey using dispersive liquid–liquid microextraction. J. Chromatogr. A 2014, 1334, 9–15. [Google Scholar] [CrossRef]
- Sapozhnikova, Y.; Lehotay, S.J. Evaluation of Different Parameters in the Extraction of Incurred Pesticides and Environmental Contaminants in Fish. J. Agric. Food Chem. 2015, 63, 5163–5168. [Google Scholar] [CrossRef]
- Martínez, D.; Torregrosa, D.; Grindlay, G.; Gras, L.; Mora, J. Coupling dispersive liquid-liquid microextraction to inductively coupled plasma atomic emission spectrometry: An oxymoron? Talanta 2018, 176, 374–381. [Google Scholar] [CrossRef]
- William, M.H. Handbook of Chemistry and Physics, 96th ed.; CRC: Boca Raton, FL, USA, 2010. [Google Scholar]
- Pastor-Belda, M.; Fernández-García, J.; Campillo, N.; Pérez-Cárceles, M.D.; Motas, M.; Hernández-Córdoba, M.; Vinas, P. Glyoxal and methylglyoxal as urinary markers of diabetes. Determination using a dispersive liquid–liquid microextraction procedure combined with gas chromatography–mass spectrometry. J. Chromatogr. A 2017, 1509, 43–49. [Google Scholar] [CrossRef]
- Vaclavik, L.; Krynitsky, A.J.; Rader, J.I. Targeted analysis of multiple pharmaceuticals, plant toxins and other secondary metabolites in herbal dietary supplements by ultra-high performance liquid chromatography–quadrupole-orbital ion trap mass spectrometry. Anal. Chim. Acta 2014, 810, 45–60. [Google Scholar] [CrossRef]
- Zhao, L.; Lucas, D.; Long, D.; Richter, B.; Stevens, J. Multi-class multi-residue analysis of veterinary drugs in meat using enhanced matrix removal lipid cleanup and liquid chromatography-tandem mass spectrometry. J. Chromatogr. A 2018, 1549, 14–24. [Google Scholar] [CrossRef]
- Gałuszka, A.; Migaszewski, Z.; Konieczka, P.; Namiesnik, J. Analytical Eco-Scale for assessing the greenness of analytical procedures. TrAC Trends Anal. Chem. 2012, 37, 61–72. [Google Scholar] [CrossRef]
- Płotka-Wasylka, J. A new tool for the evaluation of the analytical procedure: Green Analytical Procedure Index. Talanta 2018, 181, 204–209. [Google Scholar] [CrossRef] [PubMed]
- Rejczak, T.; Tuzimski, T. Method Development for Sulfonylurea Herbicides Analysis in Rapeseed Oil Samples by HPLC–DAD: Comparison of Zirconium-Based Sorbents and EMR-Lipid for Clean-up of QuEChERS Extract. Food Anal. Methods 2017, 10, 3666–3679. [Google Scholar] [CrossRef]
- Fu, Y.; Zhao, C.; Lu, X.; Xu, G. Nontargeted screening of chemical contaminants and illegal additives in food based on liquid chromatography–high resolution mass spectrometry. TrAC Trends Anal. Chem. 2017, 96, 89–98. [Google Scholar] [CrossRef]
- Cheng, Q.; Shou, L.; Chen, C.; Shi, S.; Zhou, M. Application of ultra-high-performance liquid chromatography coupled with LTQ-Orbitrap mass spectrometry for identification, confirmation and quantitation of illegal adulterated weight-loww drugs in plant dietary supplements. J. Chromatogr. B 2017, 1064, 92–99. [Google Scholar] [CrossRef] [PubMed]
- Guo, C.; Niu, C.; Zhou, L.; Wang, W.; Nie, Y.; Liu, Q.; Zhang, L.; Chen, Z.; Wang, W.; Xu, Y. Targeted and nontargeted screening and identification of 50 antihypertensive adulterants in dietary supplements and herbal medicines using quadrupole–orbitrap high resolution mass spectrometry with compound database. J. Sep. Sci. 2020, 43, 2529–2538. [Google Scholar] [CrossRef]
- Kim, N.S.; Kim, J.; Lim, N.Y.; Lee, J.H.; Park, S.; Kang, H. Simultaneous determination of illegal drug substances in dietary supplements for gout and osteoporosis using ultra-performance liquid chromatography and liquid chromatography-quadrupole-time-of-flight mass spectrometry. J. Pharm. Biomed. Anal. 2020, 179, 113003. [Google Scholar] [CrossRef] [PubMed]
- Pascali, J.P.; Fais, P.; Vaiano, F.; Bertol, E. Application of HRAM screening and LC-MS/MS confirmation of active pharmaceutical ingredient in “natural” herbal supplements. Forensic Sci. Int. 2018, 286, e28–e31. [Google Scholar] [CrossRef] [PubMed]
- International Conference on Harmonisation of Technical Requirements for Registration of Pharmaceuticals for Human Use, ICH Harmonised Tripartite Guideline, Validation of Analytical Procedures: Text and Methodology Q2(R1). Available online: https://database.ich.org/sites/default/files/Q2_R1_Guideline.pdf (accessed on 14 June 2021).


| No. | Analyte | QuEChERS | EMR-Lipid | DLLME | |||
|---|---|---|---|---|---|---|---|
| R 1 (RSD 3)% | M 2 (RSD 3)% | R 1 (RSD 3)% | M 2 (RSD 3)% | R 1 (RSD 3)% | M 2 (RSD 3)% | ||
| 1 | Metformin | 82.6 (3.2) | 83.6 (5.5) | 90.4 (6.8) | 86.6 (5.1) | 62.4 (7.5) | 70.8 (14.9) |
| 2 | Amiloride HCl | 81.3 (5.3) | 63.7 (2.0) | 101.5 (1.8) | 84.8 (9.0) | 79.4 (3.2) | 113.4 (6.4) |
| 3 | 4-Dimethylaminoantipyrine | 47.8 (9.3) | 60.6 (1.7) | 47.2 (10.9) | 81.3 (1.5) | 40.8 (4.8) | 42.5 (9.5) |
| 4 | Theophylline | 38.1 (2.9) | 44.1 (7.1) | 91.4 (12.4) | 93.2 (5.7) | 72.8 (6.7) | 75.0 (7.7) |
| 5 | Ephedrine HCl | 77.3 (7.7) | 71.8 (3.7) | 104.1 (6.7) | 103.7 (14.3) | 92.0 (3.5) | 102.1 (6.9) |
| 6 | Acetaminophen | 75.1 (6.2) | 53.3 (8.8) | 119.4 (7.7) | 81.0 (10.3) | 78.1 (3.6) | 97.1 (5.1) |
| 7 | Triamterene | 37.0 (4.4) | 25.1 (12.3) | 99.8 (5.9) | 96.0 (7.4) | 53.1 (8.7) | 54.7 (4.4) |
| 8 | Captopril | 37.2 (3.3) | 42.6 (11.5) | 69.2 (8.9) | 99.0 (2.4) | 25.4 (7.4) | 38.0 (3.9) |
| 9 | Yohimbin | 75.1 (8.9) | 75.6 (5.9) | 78.0 (3.2) | 88.9 (2.9) | 67.7 (3.1) | 81.9 (3.8) |
| 10 | Hydroxyvardenafil | 33.6 (7.1) | 79.2 (5.2) | 67.0 (5.6) | 91.1 (6.3) | 63.8 (7.1) | 80.1 (0.4) |
| 11 | Thioquinapiperifil | 14.5 (7.8) | 48.3 (5.3) | 16.9 (8.1) | 95.6 (2.7) | 14.3 (4.6) | 57.0 (8.9) |
| 12 | Bambuterol | 62.3 (6.7) | 91.9 (4.1) | 66.6 (9.2) | 91.1 (4.9) | 58.8 (9.4) | 82.3 (5.6) |
| 13 | Vardenafil | 29.0 (4.9) | 65.2 (3.9) | 77.6 (9.0) | 90.3 (7.5) | 70.2 (3.4) | 78.9 (7.4) |
| 14 | Carbodenafil | 48.8 (9.1) | 83.1 (7.8) | 66.8 (8.4) | 87.2 (1.5) | 57.1 (9.2) | 54.3 (13.1) |
| 15 | Brompheniramine | 26.8 (5.3) | 76.5 (3.0) | 50.8 (12.8) | 78.5 (11.9) | 45.8 (6.7) | 68.8 (2.3) |
| 16 | Bupropion HCl | 92.3 (6.1) | 84.3 (1.8) | 97.2 (7.7) | 82.4 (2.1) | 71.6 (5.6) | 86.2 (2.2) |
| 17 | Triprolidine | 24.3 (8.2) | 94.2 (4.9) | 49.6 (8.8) | 69.8 (11.2) | 33.4 (5.4) | 91.6 (6.7) |
| 18 | Norneovardenafil | 8.7 (12.9) | 56.5 (6.9) | 71.8 (2.1) | 86.4 (8.3) | 67.3 (4.9) | 103.0 (9.8) |
| 19 | Hongdenafil | 12.1 (9.2) | 92.2 (3.1) | 53.4 (9.0) | 109.5 (9.7) | 61.2 (3.8) | 74.8 (4.3) |
| 20 | Dimethylacetildenafil | 11.9 (4.7) | 82.4 (4.6) | 106.4 (4.7) | 84.7 (9.7) | 88.2 (2.4) | 95.1 (7.0) |
| 21 | Ketotifen fumarate salt | 74.8 (7.7) | 94.6 (12.6) | 98.9 (6.4) | 90.9 (10.2) | 76.4 (6.8) | 87.9 (4.3) |
| 22 | Icariin | 46.7 (2.5) | 69.6 (8.4) | 61.3 (2.1) | 78.1 (5.9) | 60.8 (7.6) | 85.2 (2.0) |
| 23 | Astemizole | 70.8 (9.1) | 103.6 (4.7) | 93.8 (9.6) | 114.8 (9.9) | 86.0 (6.2) | 106.2 (3.2) |
| 24 | Propranolol | 78.6 (6.4) | 83.6 (1.8) | 93.5 (1.3) | 78.2 (2.4) | 72.8 (6.5) | 87.9 (1.2) |
| 25 | Modafinil | 52.4 (2.7) | 49.8 (6.0) | 63.3 (12.2) | 73.8 (9.3) | 64.4 (9.9) | 70.1 (6.4) |
| 26 | Oxohongdenafil | 38.4 (7.9) | 109.2 (2.9) | 69.4 (6.2) | 96.1 (5.9) | 42.7 (9.5) | 102.5 (4.9) |
| 27 | Olopatadine | 44.2 (4.4) | 74.4 (5.2) | 39.3 (5.1) | 84.4 (10.6) | 77.8 (9.4) | 80.8 (0.8) |
| 28 | Sildenafil | 40.9 (4.8) | 91.4 (0.9) | 103.1 (6.9) | 99.2 (4.4) | 82.9 (4.1) | 84.7 (6.4) |
| 29 | Avanafil | 35.7 (3.2) | 79.6 (4.4) | 62.3 (12.2) | 70.2 (12.4) | 72.9 (5.6) | 86.7 (2.9) |
| 30 | Dimethylsildenafil | 59.7 (2.1) | 82.0 (2.6) | 87.8 (3.2) | 93.3 (1.2) | 86.2 (4.1) | 86.5 (4.6) |
| 31 | Diphenhydramine | 84.8 (2.3) | 73.7 (6.3) | 99.0 (5.8) | 84.9 (5.5) | 75.4 (5.2) | 77.9 (7.4) |
| 32 | Methylprednisolone | 47.0 (4.8) | 89.1 (4.9) | 82.7 (4.4) | 88.6 (2.5) | 80.6 (7.7) | 84.0 (2.9) |
| 33 | Carbamazepine | 90.4 (9.3) | 91.3 (1.4) | 94.5 (1.8) | 96.7 (4.4) | 80.1 (3.3) | 84.4 (1.4) |
| 34 | Dimenhydrinate | 69.2 (8.1) | 72.8 (4.8) | 102.6 (1.5) | 95.5 (2.2) | 82.7 (6.7) | 84.4 (2.8) |
| 35 | Betamethasone | 35.8 (9.7) | 74.3 (0.6) | 58.3 (4.3) | 72.1 (4.1) | 59.7 (9.6) | 76.8 (3.2) |
| 36 | Eplerenone | 67.3 (6.3) | 55.1 (2.6) | 95.3 (3.8) | 94.5 (3.0) | 74.8 (8.3) | 69.0 (4.6) |
| 37 | Acetaminotadalafil | 47.8 (2.6) | 66.0 (8.4) | 97.5 (5.4) | 98.8 (4.3) | 43.1 (4.5) | 53.5 (8.6) |
| 38 | Dexamethasone | 58.6 (5.6) | 82.2 (14.8) | 93.0 (10.8) | 92.6 (2.6) | 37.7 (4.4) | 51.8 (8.5) |
| 39 | Udenafil | 57.5 (2.2) | 93.3 (3.0) | 110.9 (7.3) | 104.0 (4.0) | 46.8 (6.8) | 79.3 (8.7) |
| 40 | Promethazine | 40.2 (6.8) | 58.2 (7.0) | 100.3 (0.7) | 99.9 (5.5) | 69.7 (8.1) | 62.2 (4.9) |
| 41 | Demethyltadalafil | 70.8 (3.3) | 89.2 (14.0) | 97.8 (4.3) | 93.0 (0.9) | 66.8 (9.4) | 106.4 (6.7) |
| 42 | Piroxicam | 79.1 (5.5) | 108.7 (2.9) | 101.6 (6.3) | 100.7 (6.4) | 83.2 (3.1) | 104.2 (8.4) |
| 43 | Paroxetine | 59.8 (6.4) | 74.4 (8.8) | 104.0 (8.5) | 101.6 (12.1) | 48.1 (5.4) | 53.6 (10.4) |
| 44 | Beclomethasone | 41.8 (2.5) | 100.2 (13.8) | 108.0 (5.3) | 98.6 (4.6) | 79.2 (4.6) | 69.5 (6.3) |
| 45 | 4-Isopropylantipyrine | 81.4 (7.7) | 112.9 (4.0) | 97.4 (11.3) | 87.9 (5.7) | 86.0 (7.6) | 114.3 (3.1) |
| 46 | Phenolphthalein | 45.2 (6.7) | 106.8 (9.0) | 99.8 (9.9) | 88.8 (6.8) | 82.9 (4.9) | 98.0 (2.5) |
| 47 | Ketorolac | 34.7 (9.6) | 80.8 (4.9) | 45.3 (5.5) | 73.4 (7.9) | 38.6 (3.2) | 57.1 (3.6) |
| 48 | Flunisolide | 65.4 (7.8) | 55.1 (7.7) | 113.2 (6.7) | 88.6 (2.9) | 80.2 (3.9) | 85.4 (4.2) |
| 49 | Sulindac | 59.3 (5.1) | 81.0 (2.4) | 41.2 (9.9) | 71.8 (6.4) | 75.4 (4.8) | 103.4 (9.3) |
| 50 | Cyproheptadine | 50.7 (9.1) | 84.3 (1.8) | 91.7 (11.4) | 95.6 (4.2) | 77.9 (3.8) | 86.6 (2.4) |
| 51 | Levothyroxine | 39.2 (6.5) | 76.7 (4.6) | 40.0 (5.8) | 82.8 (6.3) | 37.8 (6.6) | 83.3 (1.4) |
| 52 | Bisacodyl | 86.5 (8.2) | 87.8 (3.6) | 102.5 (0.4) | 97.6 (1.7) | 89.1 (4.4) | 92.7 (3.1) |
| 53 | Boldenone | 49.8 (5.1) | 76.6 (5.2) | 86.2 (8.2) | 84.9 (3.0) | 67.3 (8.8) | 80.0 (10.7) |
| 54 | Desulfovardenafil | 38.7 (3.5) | 85.4 (8.8) | 96.2 (9.2) | 96.0 (4.7) | 77.3 (3.2) | 88.8 (11.1) |
| 55 | Benzylsildenafil | 86.4 (9.6) | 93.4 (11.3) | 97.7 (6.9) | 94.2 (1.3) | 70.1 (7.6) | 73.8 (23.1) |
| 56 | Xanthoanthrafil | 88.7 (9.3) | 82.6 (11.2) | 103.5 (10.5) | 100.4 (5.6) | 73.4 (7.4) | 88.1 (8.2) |
| 57 | Didesmethylsibutramine | 79.2 (6.7) | 84.5 (4.5) | 114.3 (4.2) | 98.5 (7.6) | 80.3 (6.2) | 85.2 (4.7) |
| 58 | Prednisone-21-acetate | 59.2 (1.9) | 104.9 (1.4) | 103.4 (2.3) | 101.8 (4.3) | 75.6 (5.3) | 108.4 (6.6) |
| 59 | Fexofenadine | 72.6 (8.1) | 86.3 (2.5) | 52.7 (5.3) | 79.3 (2.4) | 47.8 (5.9) | 72.2 (5.4) |
| 60 | Fluoxetine HCl | 75.5 (3.5) | 82.0 (7.9) | 96.9 (7.1) | 88.7 (4.7) | 76.3 (7.1) | 86.8 (2.9) |
| 61 | Dapoxetine | 24.8 (6.3) | 89.9 (7.6) | 91.9 (5.6) | 100.8 (1.6) | 76.4 (5.8) | 85.5 (1.6) |
| 62 | Mirodenafil | 83.3 (3.4) | 94.7 (9.5) | 105.5 (7.6) | 102.3 (10.4) | 91.7 (2.9) | 114.6 (7.3) |
| 63 | Prednisolone-21-acetate | 61.2 (9.2) | 82.4 (1.3) | 108.4 (4.3) | 119.2 (7.2) | 89.6 (3.5) | 102.2 (8.9) |
| 64 | Beclomethasone-21-hemisuccinate | 58.1 (5.9) | 75.8 (5.7) | 61.5 (2.8) | 89.2 (1.4) | 53.6 (5.1) | 79.7 (5.4) |
| 65 | Cortisone-21-acetate | 64.0 (9.4) | 75.3 (11.0) | 107.0 (7.9) | 109.4 (3.8) | 75.4 (8.1) | 77.8 (11.9) |
| 66 | Sibutramine | 68.6 (3.6) | 81.4 (10.8) | 89.6 (5.1) | 94.1 (8.3) | 69.4 (3.2) | 89.0 (4.4) |
| 67 | Sertraline HCl | 57.5 (8.8) | 75.1 (3.1) | 101.3 (1.7) | 113.7 (9.7) | 52.8 (10.2) | 49.7 (5.1) |
| 68 | Homotadalafil | 60.8 (6.9) | 95.5 (3.2) | 93.2 (1.7) | 89.8 (9.2) | 66.9 (5.7) | 89.2 (9.8) |
| 69 | Boldione | 67.3 (3.2) | 73.2 (1.3) | 97.7 (13.3) | 91.2 (1.5) | 79.3 (7.8) | 84.4 (5.8) |
| 70 | Meloxicam | 78.3 (4.8) | 84.0 (5.7) | 90.4 (6.8) | 92.8 (6.3) | 70.1 (6.2) | 75.6 (1.3) |
| 71 | Mibolerone | 51.5 (4.1) | 62.2 (1.6) | 100.1 (5.0) | 101.7 (2.8) | 73.8 (5.9) | 83.5 (3.9) |
| 72 | Danazol (M) | 34.8 (6.8) | 61.7 (4.6) | 85.4 (5.7) | 83.5 (6.0) | 56.6 (5.4) | 69.5 (14.6) |
| 73 | Chlorosibutramine | 55.4 (4.6) | 65.8 (5.5) | 89.4 (1.4) | 91.2 (3.2) | 74.0 (4.8) | 91.7 (3.5) |
| 74 | Spironolactone | 74.1 (2.4) | 76.5 (2.5) | 82.8 (17.2) | 88.4 (8.1) | 78.3 (6.2) | 80.4 (1.3) |
| 75 | Fluocinonide | 65.6 (5.2) | 77.2 (3.0) | 107.3 (6.1) | 114.2 (4.2) | 75.4 (4.3) | 84.3 (0.5) |
| 76 | Calusterone | 65.3 (8.1) | 69.0 (4.1) | 117.0 (0.7) | 109.3 (9.1) | 59.3 (3.6) | 80.7 (7.3) |
| 77 | Clostebol | 72.9 (5.2) | 83.9 (3.9) | 96.9 (8.0) | 100.5 (2.4) | 74.1 (5.4) | 85.7 (2.0) |
| 78 | Cyclopentyltadalafil | 43.2 (7.9) | 65.2 (3.3) | 101.3 (8.3) | 112.2 (7.1) | 64.6 (5.1) | 80.0 (10.3) |
| 79 | Chloropretadalafil | 42.9 (7.8) | 64.2 (9.6) | 95.0 (1.3) | 97.3 (3.9) | 64.4 (9.5) | 70.2 (8.9) |
| 80 | Betamethasone-17-valerate | 34.8 (8.3) | 71.2 (8.6) | 105.6 (9.0) | 94.2 (7.9) | 68.3 (8.6) | 53.5 (9.8) |
| 81 | Diclofenac | 66.8 (3.7) | 63.6 (2.8) | 67.7 (3.6) | 87.5 (5.1) | 60.2 (5.1) | 75.9 (6.2) |
| 82 | Indomethacin | 52.3 (2.9) | 77.7 (9.7) | 58.1 (4.2) | 95.4 (2.6) | 43.1 (6.7) | 79.9 (4.7) |
| 83 | Aceclofenac | 27.1 (6.3) | 71.3 (3.6) | 61.5 (6.6) | 91.8 (1.2) | 60.5 (3.9) | 76.5 (1.6) |
| 84 | Imidazosagatriazinone | 64.2 (8.5) | 104.3 (7.5) | 97.0 (0.9) | 96.5 (3.7) | 71.6 (3.2) | 102.7 (4.3) |
| 85 | Terfenadine | 76.1 (9.0) | 86.3 (3.6) | 94.4 (11.2) | 95.4 (5.4) | 80.1 (4.2) | 82.2 (10.6) |
| 86 | Phenylbutazone | 25.3 (7.1) | 98.3 (8.5) | 32.4 (9.2) | 94.4 (6.2) | 30.1 (7.8) | 93.7 (4.9) |
| 87 | Norbolethone | 54.7 (3.8) | 76.8 (3.5) | 106.0 (5.1) | 107.5 (8.8) | 75.9 (6.4) | 77.3 (3.2) |
| 88 | Betamethasone-21-valerate | 64.9 (8.5) | 71.6 (12.7) | 102.1 (2.2) | 109.4 (6.9) | 74.1 (6.2) | 82.7 (5.1) |
| 89 | Betamethasone dipropionate | 57.2 (2.8) | 73.9 (1.6) | 94.6 (5.3) | 95.5 (4.3) | 73.5 (4.5) | 84.4 (1.8) |
| 90 | Beclomethasone dipropionate | 64.6 (7.6) | 73.9 (1.6) | 95.7 (7.4) | 97.1 (6.7) | 73.2 (7.1) | 84.9 (2.1) |
| 91 | Rimonabant | 63.8 (4.3) | 74.3 (2.0) | 108.3 (7.1) | 107.5 (9.2) | 78.8 (5.2) | 88.2 (13.2) |
| 92 | Testosterone-17-propionate | 69.7 (4.9) | 72.1 (9.1) | 98.5 (6.0) | 99.2 (3.1) | 76.7 (4.4) | 92.7 (1.4) |
| No. | Analyte | Linearity Range (ng/g) | Correlation Coefficient (r2) | LOD (ng/g) | Precision (%) | Accuracy (RSD) (%) | |
|---|---|---|---|---|---|---|---|
| Intra-Day | Inter-Day | ||||||
| 1 | Metformin 1 | 25–500 | 0.9924 | 4 | 0.09 | 12.14 | 101.1 (3.6) |
| 2 | Amiloride HCl 1 | 25–500 | 0.9911 | 15 | 2.22 | 10.34 | 87.4 (9.4) |
| 3 | 4-Dimethylaminoantipyrine 1 | 25–2000 | 0.9903 | 0.7 | 0.97 | 1.35 | 101.5 (3.7) |
| 4 | Theophylline 1 | 25–2000 | 0.9909 | 2 | 0.12 | 3.89 | 115.5 (0.1) |
| 5 | Ephedrine HCl 1 | 25–1000 | 0.9938 | 0.3 | 0.44 | 0.34 | 100.7 (0.5) |
| 6 | Acetaminophen 1 | 25–2000 | 0.9934 | 2 | 1.02 | 9.46 | 98.5 (0.6) |
| 7 | Triamterene 1 | 25–500 | 0.9943 | 0.4 | 1.98 | 12.23 | 110.2 (7.4) |
| 8 | Captopril 1 | 25–2000 | 0.9956 | 11 | 3.41 | 5.27 | 95.7 (3.0) |
| 9 | Yohimbin 1 | 5–500 | 0.9979 | 7 | 5.02 | 5.16 | 97.2 (8.4) |
| 10 | Hydroxyvardenafil 1 | 25–500 | 0.9991 | 4 | 4.35 | 0.27 | 95.6 (0.2) |
| 11 | Thioquinapiperifil 2 | 5–500 | 0.9967 | 2 | 4.07 | 2.54 | 103.0 (1.5) |
| 12 | Bambuterol 2 | 1–500 | 0.9962 | 0.2 | 3.39 | 0.62 | 115.7 (4.5) |
| 13 | Vardenafil 2 | 1–500 | 0.9978 | 0.4 | 2.86 | 2.12 | 86.7 (0.5) |
| 14 | Carbodenafil 2 | 5–500 | 0.9972 | 1 | 1.12 | 5.42 | 103.9 (0.4) |
| 15 | Brompheniramine 2 | 1–500 | 0.9966 | 0.1 | 3.31 | 0.56 | 98.7 (1.8) |
| 16 | Bupropion HCl 1 | 25–500 | 0.9935 | 0.4 | 5.32 | 6.72 | 105.9 (3.1) |
| 17 | Triprolidine 2 | 1–500 | 0.9979 | 0.3 | 6.02 | 1.81 | 112.5 (4.7) |
| 18 | Norneovardenafil 2 | 1–500 | 0.9983 | 0.1 | 3.50 | 3.40 | 116.6 (1.5) |
| 19 | Hongdenafil 2 | 1–500 | 0.9971 | 0.5 | 6.29 | 5.42 | 116.0 (1.5) |
| 20 | Dimethylacetildenafil 2 | 1–500 | 0.9985 | 0.5 | 5.74 | 5.21 | 92.9 (1.8) |
| 21 | Ketotifen fumarate salt 2 | 1–500 | 0.9975 | 0.1 | 6.69 | 1.02 | 100.8 (2.6) |
| 22 | Icariin 1 | 25–500 | 0.9982 | 8 | 2.05 | 0.27 | 110.8 (1.9) |
| 23 | Astemizole 2 | 5–500 | 0.9961 | 2 | 0.16 | 1.45 | 88.5 (5.2) |
| 24 | Propranolol 1 | 25–500 | 0.9915 | 0.1 | 1.16 | 14.18 | 96.8 (2.4) |
| 25 | Modafinil 1 | 25–1000 | 0.9961 | 0.5 | 1.45 | 12.58 | 106.0 (4.2) |
| 26 | Oxohongdenafil 1 | 25–500 | 0.9971 | 4 | 1.73 | 3.83 | 115.4 (1.2) |
| 27 | Olopatadine 2 | 1–500 | 0.9973 | 0.4 | 4.31 | 0.81 | 91.8 (1.7) |
| 28 | Sildenafil 2 | 5–500 | 0.9969 | 2 | 4.02 | 4.03 | 95.6 (9.2) |
| 29 | Avanafil 2 | 1–500 | 0.9997 | 0.5 | 6.29 | 6.67 | 86.6 (1.3) |
| 30 | Dimethylsildenafil 2 | 1–500 | 0.9985 | 0.2 | 1.86 | 1.23 | 109.3 (2.5) |
| 31 | Diphenhydramine 2 | 1–500 | 0.9978 | 0.4 | 7.53 | 1.02 | 105.7 (4.9) |
| 32 | Methylprednisolone 2 | 5–500 | 0.9991 | 2 | 1.97 | 4.12 | 96.0 (1.5) |
| 33 | Carbamazepine 1 | 25–1000 | 0.9939 | 1 | 0.72 | 5.51 | 95.3 (4.9) |
| 34 | Dimenhydrinate 2 | 1–500 | 0.9964 | 0.5 | 3.40 | 1.75 | 83.8 (2.9) |
| 35 | Betamethasone 2 | 5–500 | 0.9994 | 2 | 0.62 | 0.82 | 84.2 (4.7) |
| 36 | Eplerenone 1 | 25–2000 | 0.9964 | 2 | 1.98 | 4.22 | 107.5 (4.9) |
| 37 | Acetaminotadalafil 2 | 5–500 | 0.9978 | 0.7 | 0.95 | 3.30 | 105.5 (1.7) |
| 38 | Dexamethasone 2 | 5–500 | 0.9998 | 1 | 2.01 | 8.05 | 89.7 (1.4) |
| 39 | Udenafil 2 | 5–500 | 0.9987 | 0.2 | 4.58 | 4.90 | 107.0 (5.6) |
| 40 | Promethazine 2 | 5–500 | 0.9963 | 2 | 3.55 | 2.74 | 104.1 (2.7) |
| 41 | Demethyltadalafil 1 | 25–500 | 0.9994 | 10 | 1.73 | 5.84 | 109.6 (1.3) |
| 42 | Piroxicam 1 | 25–500 | 0.9902 | 16 | 8.24 | 11.37 | 101.7 (1.9) |
| 43 | Paroxetine 1 | 25–500 | 0.9927 | 0.2 | 4.54 | 0.32 | 96.3 (2.7) |
| 44 | Beclomethasone 2 | 5–500 | 0.9992 | 0.9 | 4.32 | 2.74 | 95.2 (8.8) |
| 45 | 4-Isopropylantipyrine 1 | 25–500 | 0.9974 | 0.2 | 0.93 | 10.15 | 104.7 (5.4) |
| 46 | Phenolphthalein 1 | 25–1000 | 0.9958 | 1 | 1.44 | 13.21 | 101.1 (0.8) |
| 47 | Ketorolac 1 | 25–1000 | 0.9957 | 2 | 0.17 | 0.90 | 101.1 (1.3) |
| 48 | Flunisolide 2 | 1–1000 | 0.9984 | 0.3 | 3.11 | 1.68 | 87.3 (4.9) |
| 49 | Sulindac 1 | 25–2000 | 0.9923 | 2 | 0.48 | 7.22 | 94.1 (2.8) |
| 50 | Cyproheptadine 2 | 1–500 | 0.9973 | 0.1 | 0.57 | 4.55 | 96.4 (1.5) |
| 51 | Levothyroxine 1 | 25–500 | 0.9940 | 2 | 1.08 | 10.54 | 105.6 (14.4) |
| 52 | Bisacodyl 1 | 25–500 | 0.9963 | 0.3 | 0.88 | 9.94 | 87.0 (9.4) |
| 53 | Boldenone 2 | 5–500 | 0.9997 | 0.1 | 3.88 | 3.02 | 110.5 (6.1) |
| 54 | Desulfovardenafil 2 | 5–500 | 0.9966 | 0.4 | 2.51 | 2.78 | 112.7 (1.5) |
| 55 | Benzylsildenafil 2 | 5–500 | 0.9988 | 2 | 5.03 | 5.57 | 88.0 (1.8) |
| 56 | Xanthoanthrafil 2 | 5–500 | 0.9969 | 3 | 3.40 | 3.84 | 116.3 (4.6) |
| 57 | Didesmethylsibutramine 1 | 25–500 | 0.9924 | 0.4 | 4.12 | 5.27 | 99.9 (0.1) |
| 58 | Prednisone-21-acetate 2 | 5–500 | 0.9987 | 1 | 3.96 | 4.84 | 91.5 (0.3) |
| 59 | Fexofenadine 2 | 5–500 | 0.9964 | 2 | 4.00 | 2.54 | 98.2 (1.2) |
| 60 | Fluoxetine HCl 1 | 25–2000 | 0.9908 | 0.2 | 0.75 | 0.44 | 93.8 (4.5) |
| 61 | Dapoxetine 2 | 5–500 | 0.9973 | 0.3 | 3.51 | 3.81 | 100.4 (5.2) |
| 62 | Mirodenafil 2 | 5–500 | 0.9973 | 0.7 | 3.12 | 7.42 | 108.6 (2.0) |
| 63 | Prednisolone-21-acetate 1 | 25–500 | 0.9997 | 7 | 4.37 | 5.53 | 94.7 (1.5) |
| 64 | Beclomethasone-21-Hemisuccinate 1 | 25–500 | 0.9995 | 8 | 1.99 | 3.64 | 100.1 (4.3) |
| 65 | Cortisone-21-acetate 2 | 5–500 | 0.9998 | 0.6 | 1.77 | 6.05 | 111.7 (0.3) |
| 66 | Sibutramine 1 | 25–500 | 0.9944 | 0.3 | 5.31 | 8.74 | 99.7 (1.6) |
| 67 | Sertraline HCl 1 | 25–500 | 0.9933 | 0.2 | 0.74 | 8.09 | 101.6 (9.3) |
| 68 | Homotadalafil 1 | 25–500 | 0.9997 | 8 | 2.44 | 6.88 | 112.5 (6.8) |
| 69 | Boldione 2 | 1–500 | 0.9988 | 0.1 | 3.24 | 1.73 | 81.6 (3.2) |
| 70 | Meloxicam 1 | 25–1000 | 0.9932 | 0.2 | 0.41 | 0.59 | 99.2 (0.6) |
| 71 | Mibolerone 2 | 5–500 | 0.9993 | 0.1 | 5.10 | 2.40 | 112.1 (6.5) |
| 72 | Danazol (M) 2 | 5–500 | 0.9997 | 0.2 | 1.98 | 1.35 | 82.0 (0.1) |
| 73 | Chlorosibutramine 1 | 25–500 | 0.9973 | 0.2 | 7.5 | 10.68 | 83.8 (10.9) |
| 74 | Spironolactone 1 | 25–2000 | 0.9925 | 4 | 4.22 | 1.98 | 94.1 (10.4) |
| 75 | Fluocinonide 2 | 5–500 | 0.9992 | 0.2 | 4.02 | 4.43 | 97.1 (7.2) |
| 76 | Calusterone 2 | 5–500 | 0.9980 | 0.1 | 1.98 | 6.00 | 99.4 (7.0) |
| 77 | Clostebol 2 | 5–500 | 0.9987 | 2 | 4.11 | 2.92 | 109.5 (8.3) |
| 78 | Cyclopentyltadalafil 2 | 5–500 | 0.9992 | 0.8 | 0.77 | 4.22 | 109.3 (3.8) |
| 79 | Chloropretadalafil 2 | 5–500 | 0.9997 | 0.1 | 1.30 | 3.39 | 93.6 (1.3) |
| 80 | Betamethasone-17-valerate 2 | 5–500 | 0.9994 | 0.8 | 2.13 | 5.51 | 99.3 (2.8) |
| 81 | Diclofenac 1 | 25–2000 | 0.9968 | 5 | 0.52 | 6.03 | 97.4 (2.3) |
| 82 | Indomethacin 1 | 25–2000 | 0.9932 | 10 | 0.94 | 14.65 | 104.7 (3.8) |
| 83 | Aceclofenac 1 | 25–2000 | 0.9919 | 5 | 1.02 | 2.14 | 87.2 (9.8) |
| 84 | Imidazosagatriazinone 2 | 5–500 | 0.9992 | 0.1 | 4.72 | 4.98 | 91.7 (1.5) |
| 85 | Terfenadine 2 | 5–500 | 0.9971 | 0.1 | 1.71 | 0.42 | 104.2 (2.1) |
| 86 | Phenylbutazone 1 | 50–2000 | 0.9917 | 6 | 1.08 | 10.08 | 102.3 (3.1) |
| 87 | Norbolethone 2 | 5–500 | 0.9999 | 0.1 | 1.84 | 5.20 | 90.8 (6.4) |
| 88 | Betamethasone-21-valerate 2 | 5–500 | 0.9995 | 3 | 2.31 | 4.43 | 114.6 (5.4) |
| 89 | Betamethasone dipropionate 2 | 5–500 | 0.9994 | 0.3 | 2.61 | 5.47 | 97.0 (1.1) |
| 90 | Beclomethasone dipropionate 2 | 5–500 | 0.9985 | 0.1 | 1.78 | 1.23 | 88.7 (2.5) |
| 91 | Rimonabant 1 | 25–2000 | 0.9963 | 0.2 | 4.96 | 4.09 | 94.1 (5.1) |
| 92 | Testosterone-17-propionate 2 | 5–500 | 0.9979 | 0.2 | 6.73 | 2.14 | 96.8 (2.8) |
Publisher’s Note: MDPI stays neutral with regard to jurisdictional claims in published maps and institutional affiliations. |
© 2021 by the authors. Licensee MDPI, Basel, Switzerland. This article is an open access article distributed under the terms and conditions of the Creative Commons Attribution (CC BY) license (https://creativecommons.org/licenses/by/4.0/).
Share and Cite
Kim, B.H.; Lee, W.; Kim, Y.L.; Lee, J.H.; Hong, J. Efficient Matrix Cleanup of Soft-Gel-Type Dietary Supplements for Rapid Screening of 92 Illegal Adulterants Using EMR-Lipid dSPE and UHPLC-Q/TOF-MS. Pharmaceuticals 2021, 14, 570. https://doi.org/10.3390/ph14060570
Kim BH, Lee W, Kim YL, Lee JH, Hong J. Efficient Matrix Cleanup of Soft-Gel-Type Dietary Supplements for Rapid Screening of 92 Illegal Adulterants Using EMR-Lipid dSPE and UHPLC-Q/TOF-MS. Pharmaceuticals. 2021; 14(6):570. https://doi.org/10.3390/ph14060570
Chicago/Turabian StyleKim, Beom Hee, Wonwoong Lee, You Lee Kim, Ji Hyun Lee, and Jongki Hong. 2021. "Efficient Matrix Cleanup of Soft-Gel-Type Dietary Supplements for Rapid Screening of 92 Illegal Adulterants Using EMR-Lipid dSPE and UHPLC-Q/TOF-MS" Pharmaceuticals 14, no. 6: 570. https://doi.org/10.3390/ph14060570
APA StyleKim, B. H., Lee, W., Kim, Y. L., Lee, J. H., & Hong, J. (2021). Efficient Matrix Cleanup of Soft-Gel-Type Dietary Supplements for Rapid Screening of 92 Illegal Adulterants Using EMR-Lipid dSPE and UHPLC-Q/TOF-MS. Pharmaceuticals, 14(6), 570. https://doi.org/10.3390/ph14060570