6.1. Evidence Problems in Most Studies and Their Formation Mechanisms
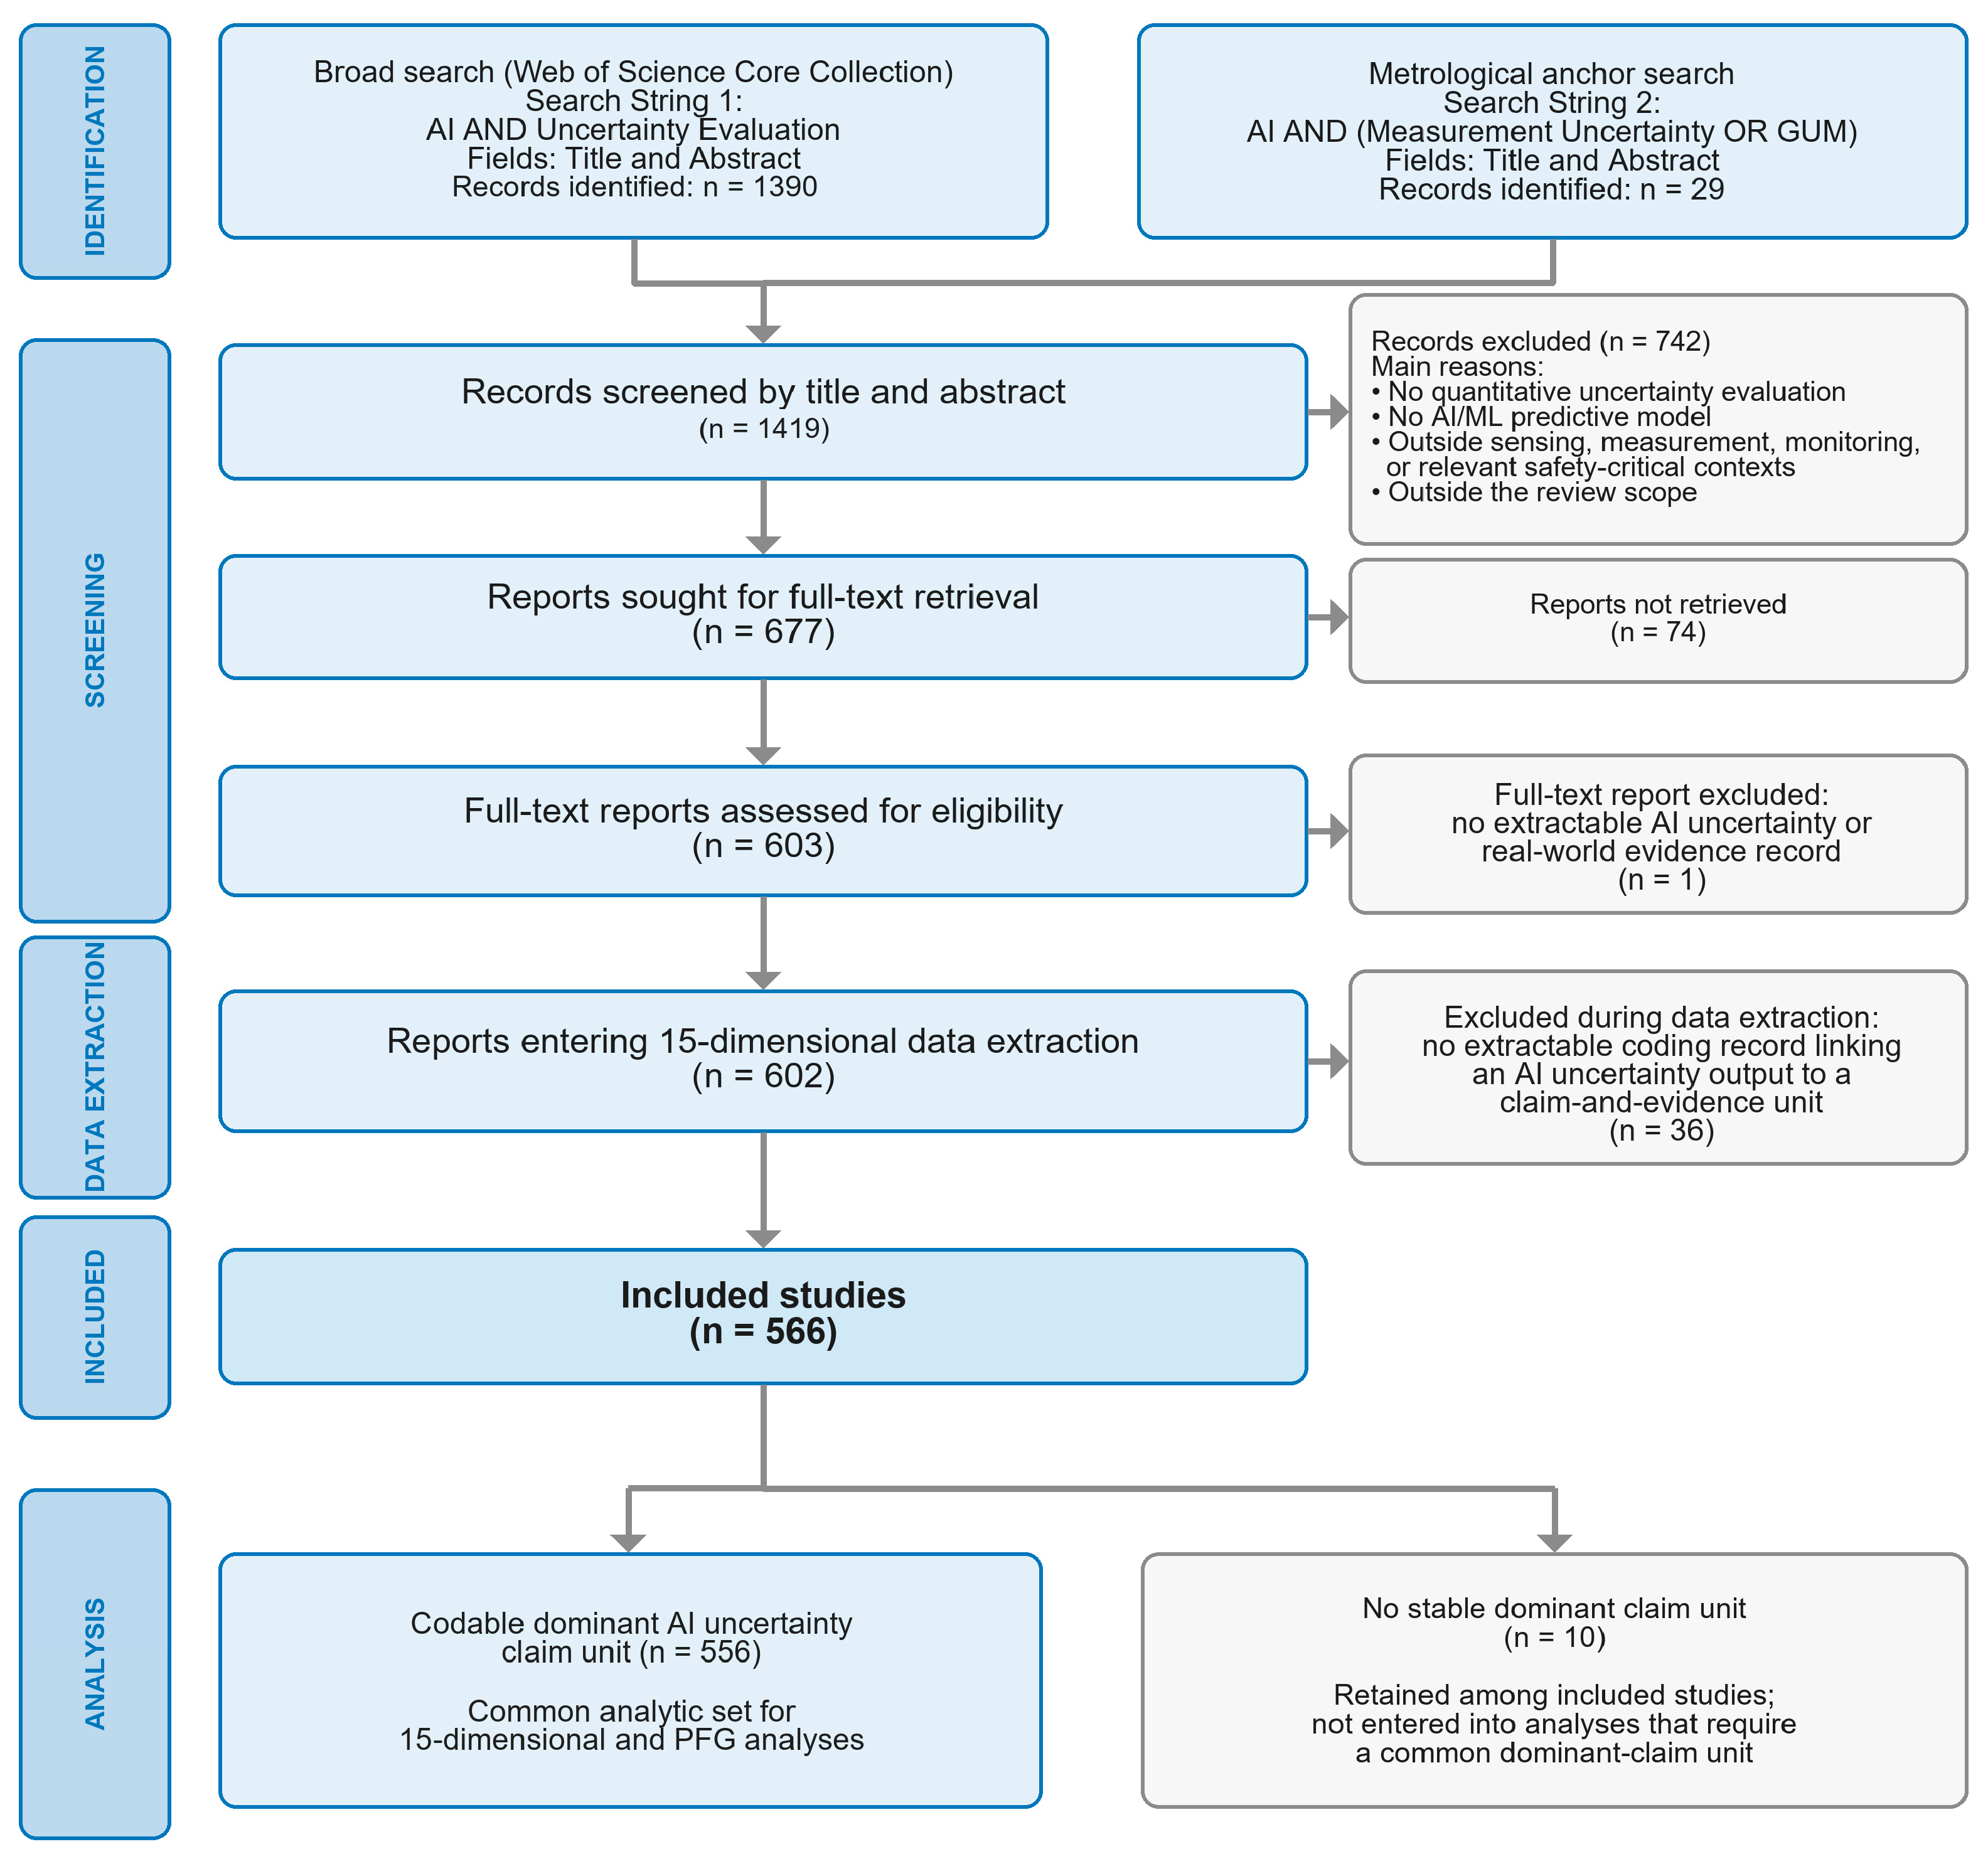
The most direct integrated conclusion of this study is that most published studies have not yet closed, within the paper, the evidence chain required by their dominant claim. Among the 566 included studies, 556 could form dominant claim analysis units; according to the three sequential nodes of condition testing, uncertainty response, and extended corroboration, 347 studies were classified as Weak, accounting for 62.4%, 133 as Medium, accounting for 23.9%, and 76 as Strong, accounting for 13.7%. Because Weak means that the evidence chain breaks at least at Q1 or Q2, this result quantitatively indicates that the lack of a traceable correspondence between AI uncertainty outputs and real-world conditions is not an isolated occurrence in the present corpus, but a systematic phenomenon in the publicly reported evidence. Here, ‘problem’ strictly refers to the failure of the claim–evidence relationship presented in the paper to close and must not be extended to mean that the algorithm is wrong or the study has no value.
This conclusion is important because the literature does not generally lack physical information, condition descriptions, or empirical evaluations. Identifiable physical or data-generation information was present in 88.3% of studies, 72.1% allowed conditions related to the claim to be identified, direct and indirect condition testing accounted for 41.7% and 46.0%, respectively, and 60.1% also used multiple validation protocols. The actual break lies in whether these elements form a connection around the same uncertainty claim: 179 studies did not form the correspondence in which an identifiable claim-relevant condition entered testing; another 168 studies had claim-relevant conditions enter testing but did not form codable evidence of an uncertainty-specific response. Among all 377 studies that passed Q1, the latter category accounted for 44.6%. Therefore, the main gap in the current field is that the conditions changed in the experiment, the endpoints observed, and the real-world meaning carried by the uncertainty output are not explicitly aligned.
This break can be explained by the common organization of existing papers. Many studies first select variance, intervals, probabilities, entropy, or proxy scores and then use random splits, overall performance, or generic out-of-distribution tests to demonstrate model performance. When physical information is used only as an input, feature, constraint, or application context, it serves as a modeling resource rather than an evidential obligation; when uncertainty is used only for screening, weighting, ranking, or decision-making, while the results report only accuracy, error, or AUC, the study can demonstrate that the module ‘was used’ but does not necessarily demonstrate that the claim it supports ‘was tested.’ This explains why adding physical variables, validation repetitions, or model complexity does not automatically reduce PFG.
In data-driven AI, assumptions can enter diffusely through data, model, and implementation interfaces. Explicit assumptions can be written into the data and protocol layers, including the support range of training samples, data partitioning, labeling rules, and the construction of perturbations or OOD data; they can also be written into the model and objective layers, including the likelihood, prior, loss, and predictive distribution, and enter actual computation through posterior approximation, sampling, ensembling, local compression, or post hoc calibration. Implicit assumptions are often embedded in default correspondences, such as treating offline samples as representative of the deployment distribution, treating labels as a sufficient reference, or interpreting changes in variance, entropy, and proxy scores as changes in real-world risk. The phenomenon revealed by shortcut learning, in which a model is effective within a benchmark but fails outside its context, shows that stable correlations in training data do not necessarily constitute a stable basis in the target context [
51]. In
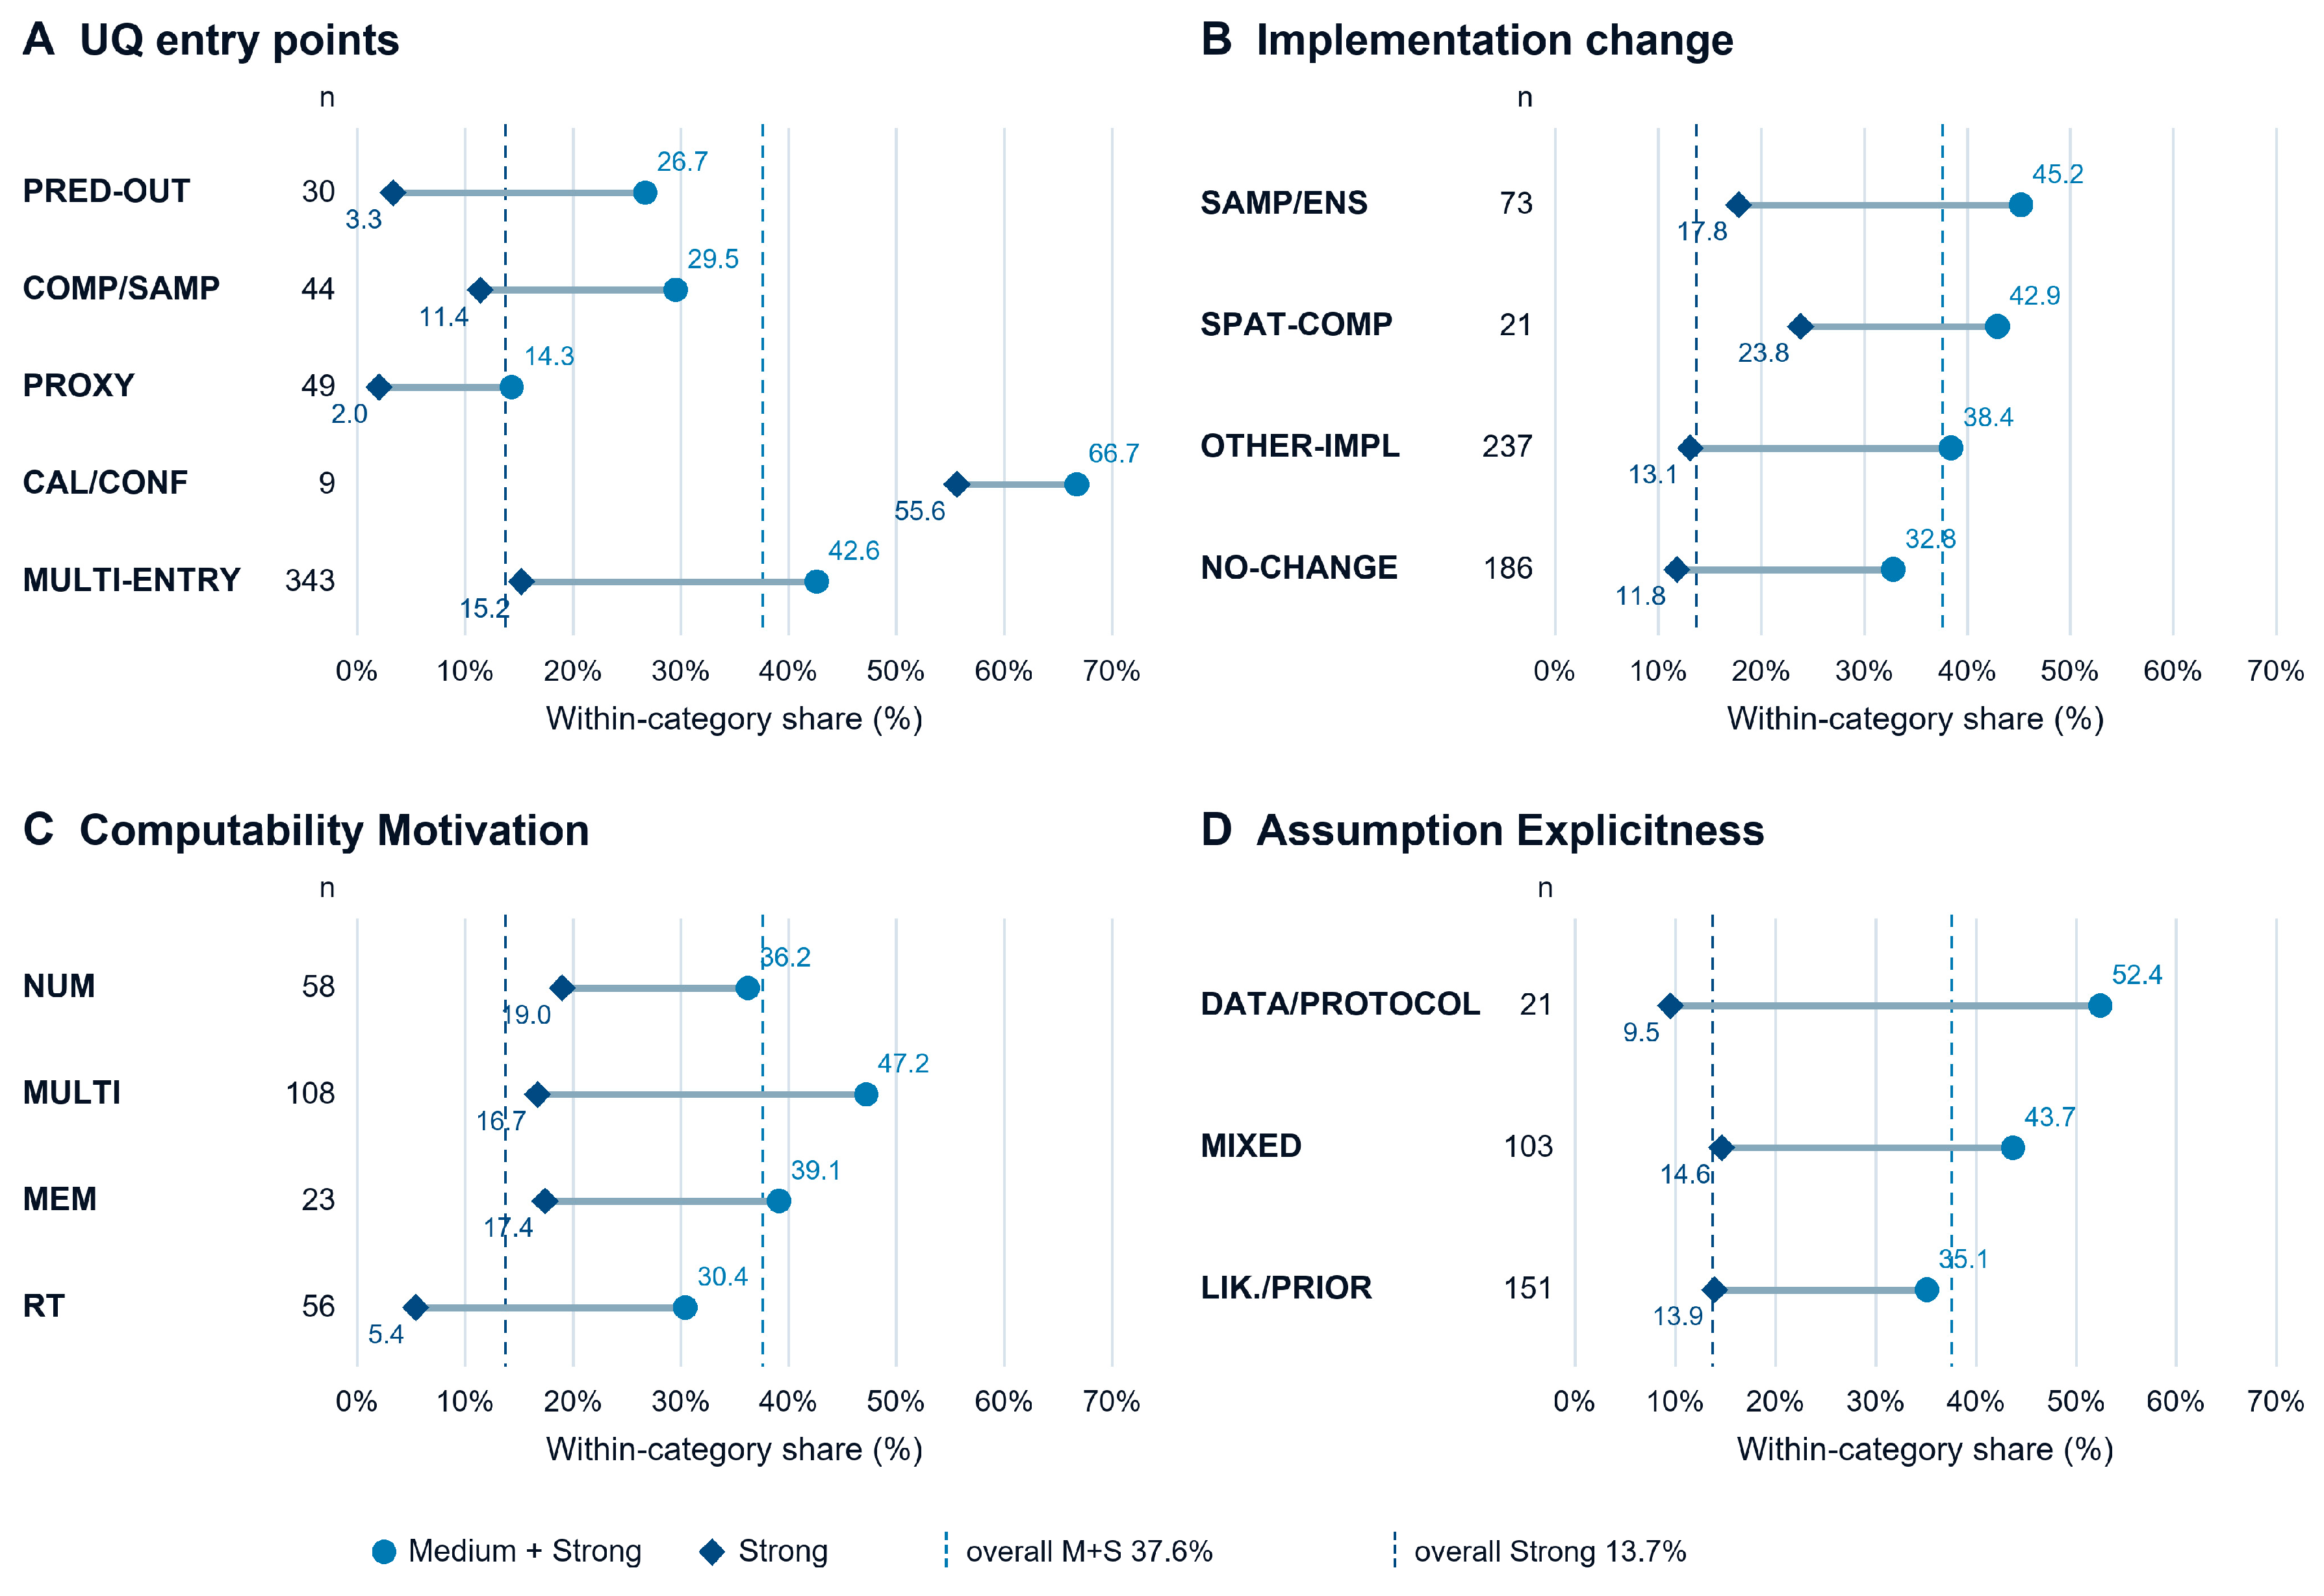
Section 5, the M + S/Strong proportions for Data/protocol, Mixed, and Likelihood/prior were 52.4%/9.5%, 43.7%/14.6%, and 35.1%/13.9%, respectively, and did not form a monotonic relationship from degree of formalization to evidence tier; different output types also showed no consistent advantage. These descriptive distributions are compatible with one interpretation: only when the correspondence among data range, model approximation, output semantics, and target conditions is converted into testable changes and the uncertainty output forms an identifiable response do the relevant premises move from modeling choices to traceable evidence.
This distributed mode of entry also explains the common direction across the dimensions in
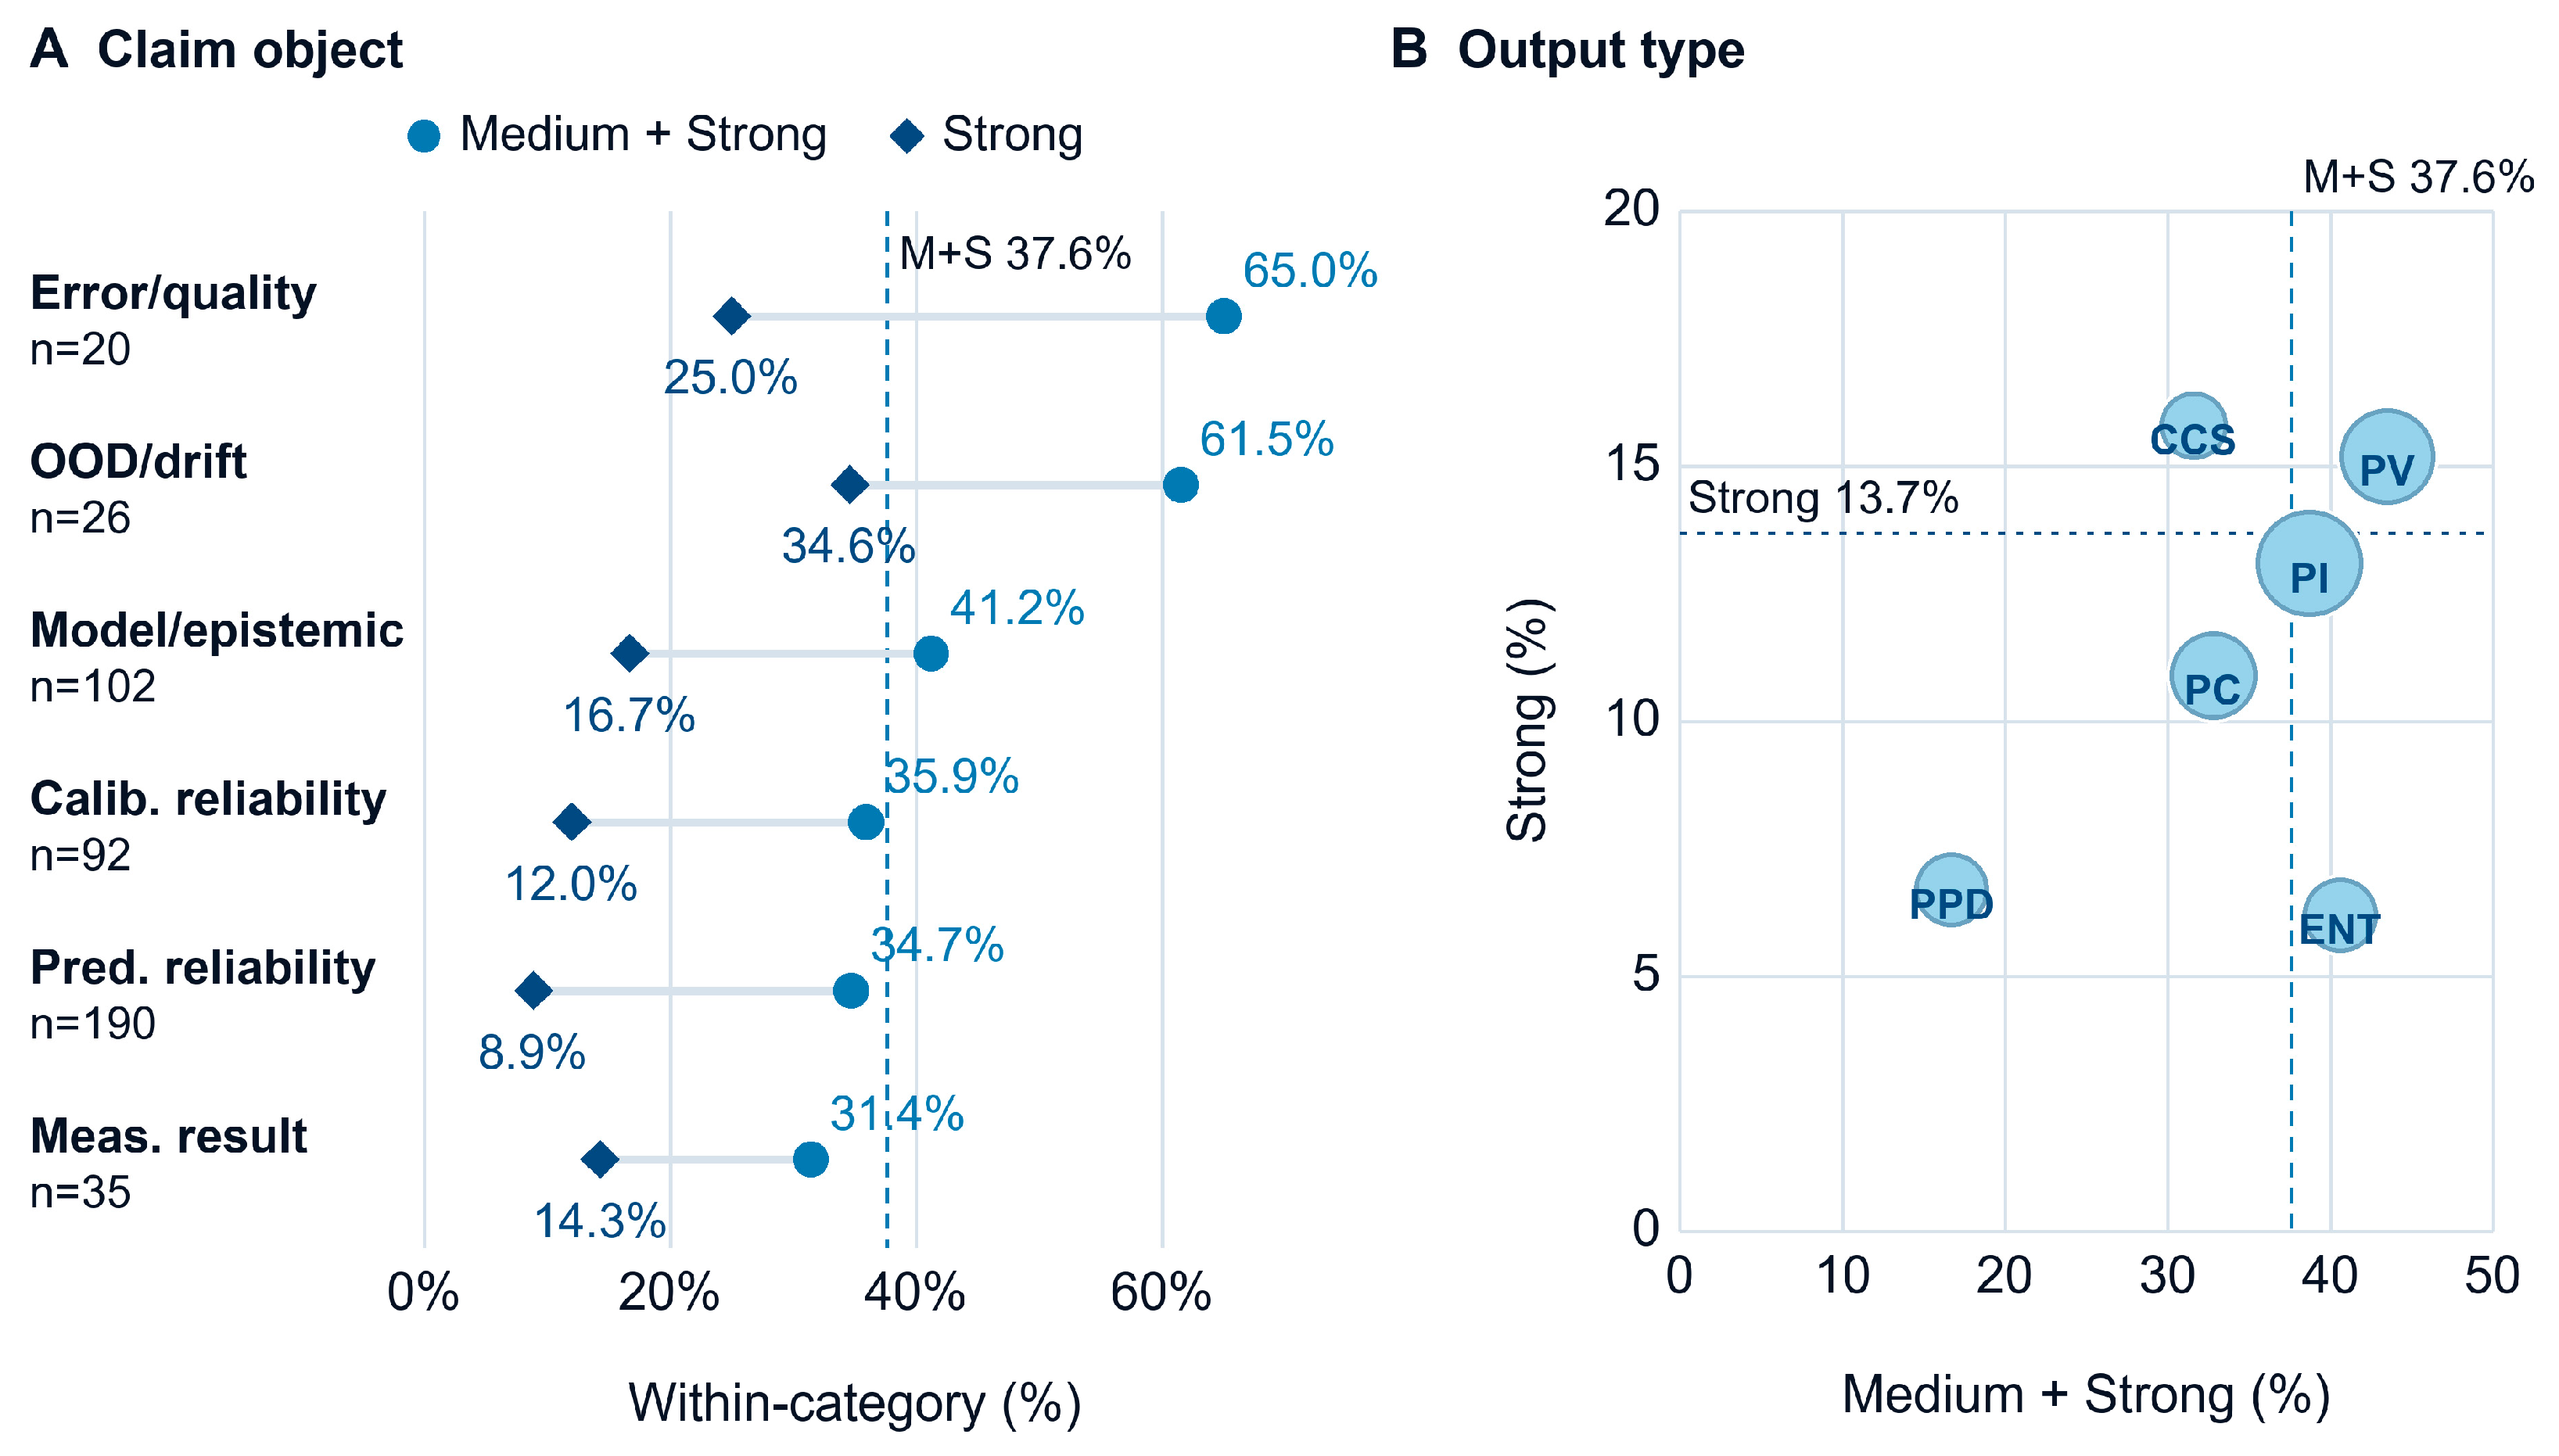
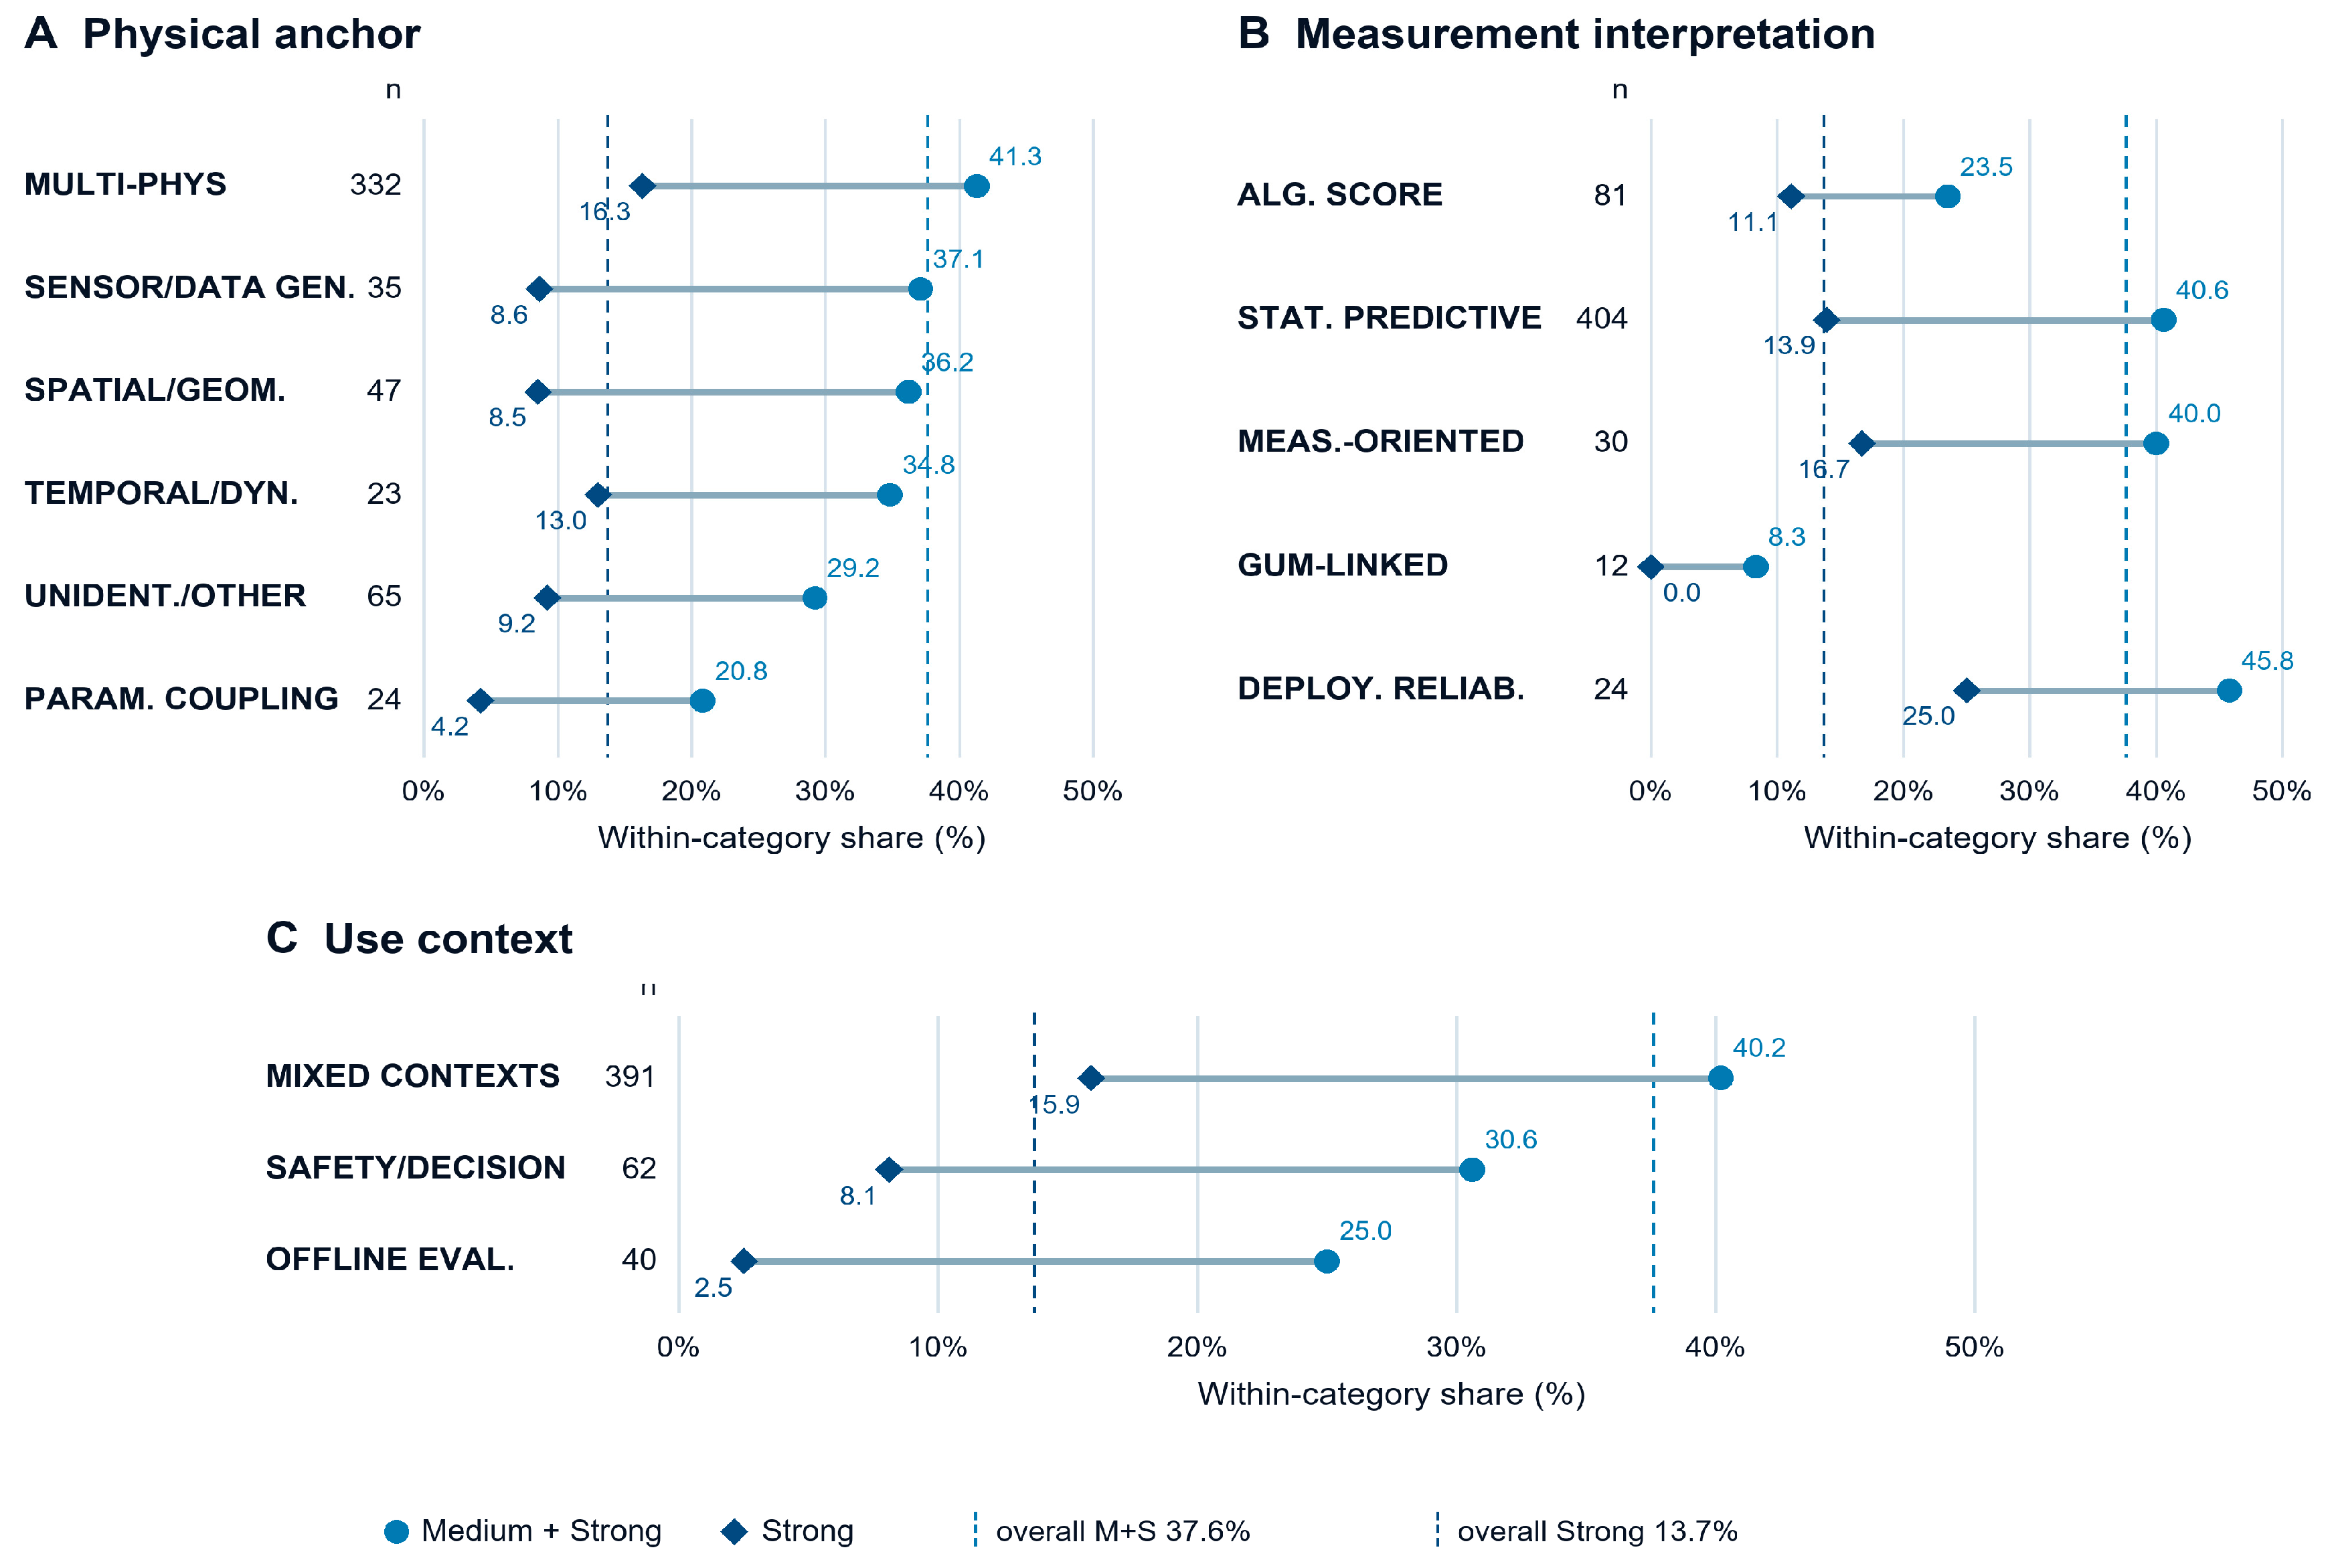
Section 5. The M + S/Strong proportions for Error/quality and OOD/drift were 65.0%/25.0% and 61.5%/34.6%, respectively, above the 34.7%/8.9% for Prediction reliability; MULTI-ENTRY was 42.6%/15.2%, whereas PROXY was 14.3%/2.0%; SAMP/ENS was +7.6/+4.1 percentage points relative to the overall M + S/Strong benchmarks, whereas real-time inference was 30.4%/5.4%. Real-world anchoring showed a similar direction: Multiple physical information types, Physical deployment reliability, and Multiple/mixed use contexts were 41.3%/16.3%, 45.8%/25.0%, and 40.2%/15.9%, respectively, whereas Algorithmic uncertainty score and Offline evaluation/comparison were 23.5%/11.1% and 25.0%/2.5%. Together, these directions suggest that specific risk objects, multiple entry points, and explicit target contexts more readily operationalize premises in data support, model choices, and implementation approximations into an observable ‘relevant condition–trigger–uncertainty response’ relationship; general reliability claims, a single proxy score, or overall offline performance more readily leave this correspondence at the level of a default assumption. Sampling, ensembling, and calibration provide implementation interfaces for establishing the correspondence, and existing research also shows that ensemble size and post hoc calibration change the reliability of uncertainty estimation [
52]; however, the evidential meaning of an implementation choice still depends on whether the corresponding condition enters dedicated testing and whether the uncertainty output itself forms an identifiable response. Among the 209 Medium or Strong studies, 35 still explicitly exposed failures, indicating that a more complete evidence chain increases the visibility of assumptions and applicability boundaries but does not guarantee method success. Thus, the statistical results in
Section 5 locate the ways in which assumptions enter AI uncertainty computation at interconnected interfaces, including data support, task and output definition, model and implementation approximation, and validation design, and show that these interfaces can be converted into more complete public evidence only when they form a verifiable correspondence around the same dominant claim.
6.2. What Kind of ‘Quality’ Does the Evidence Stratification Reflect?
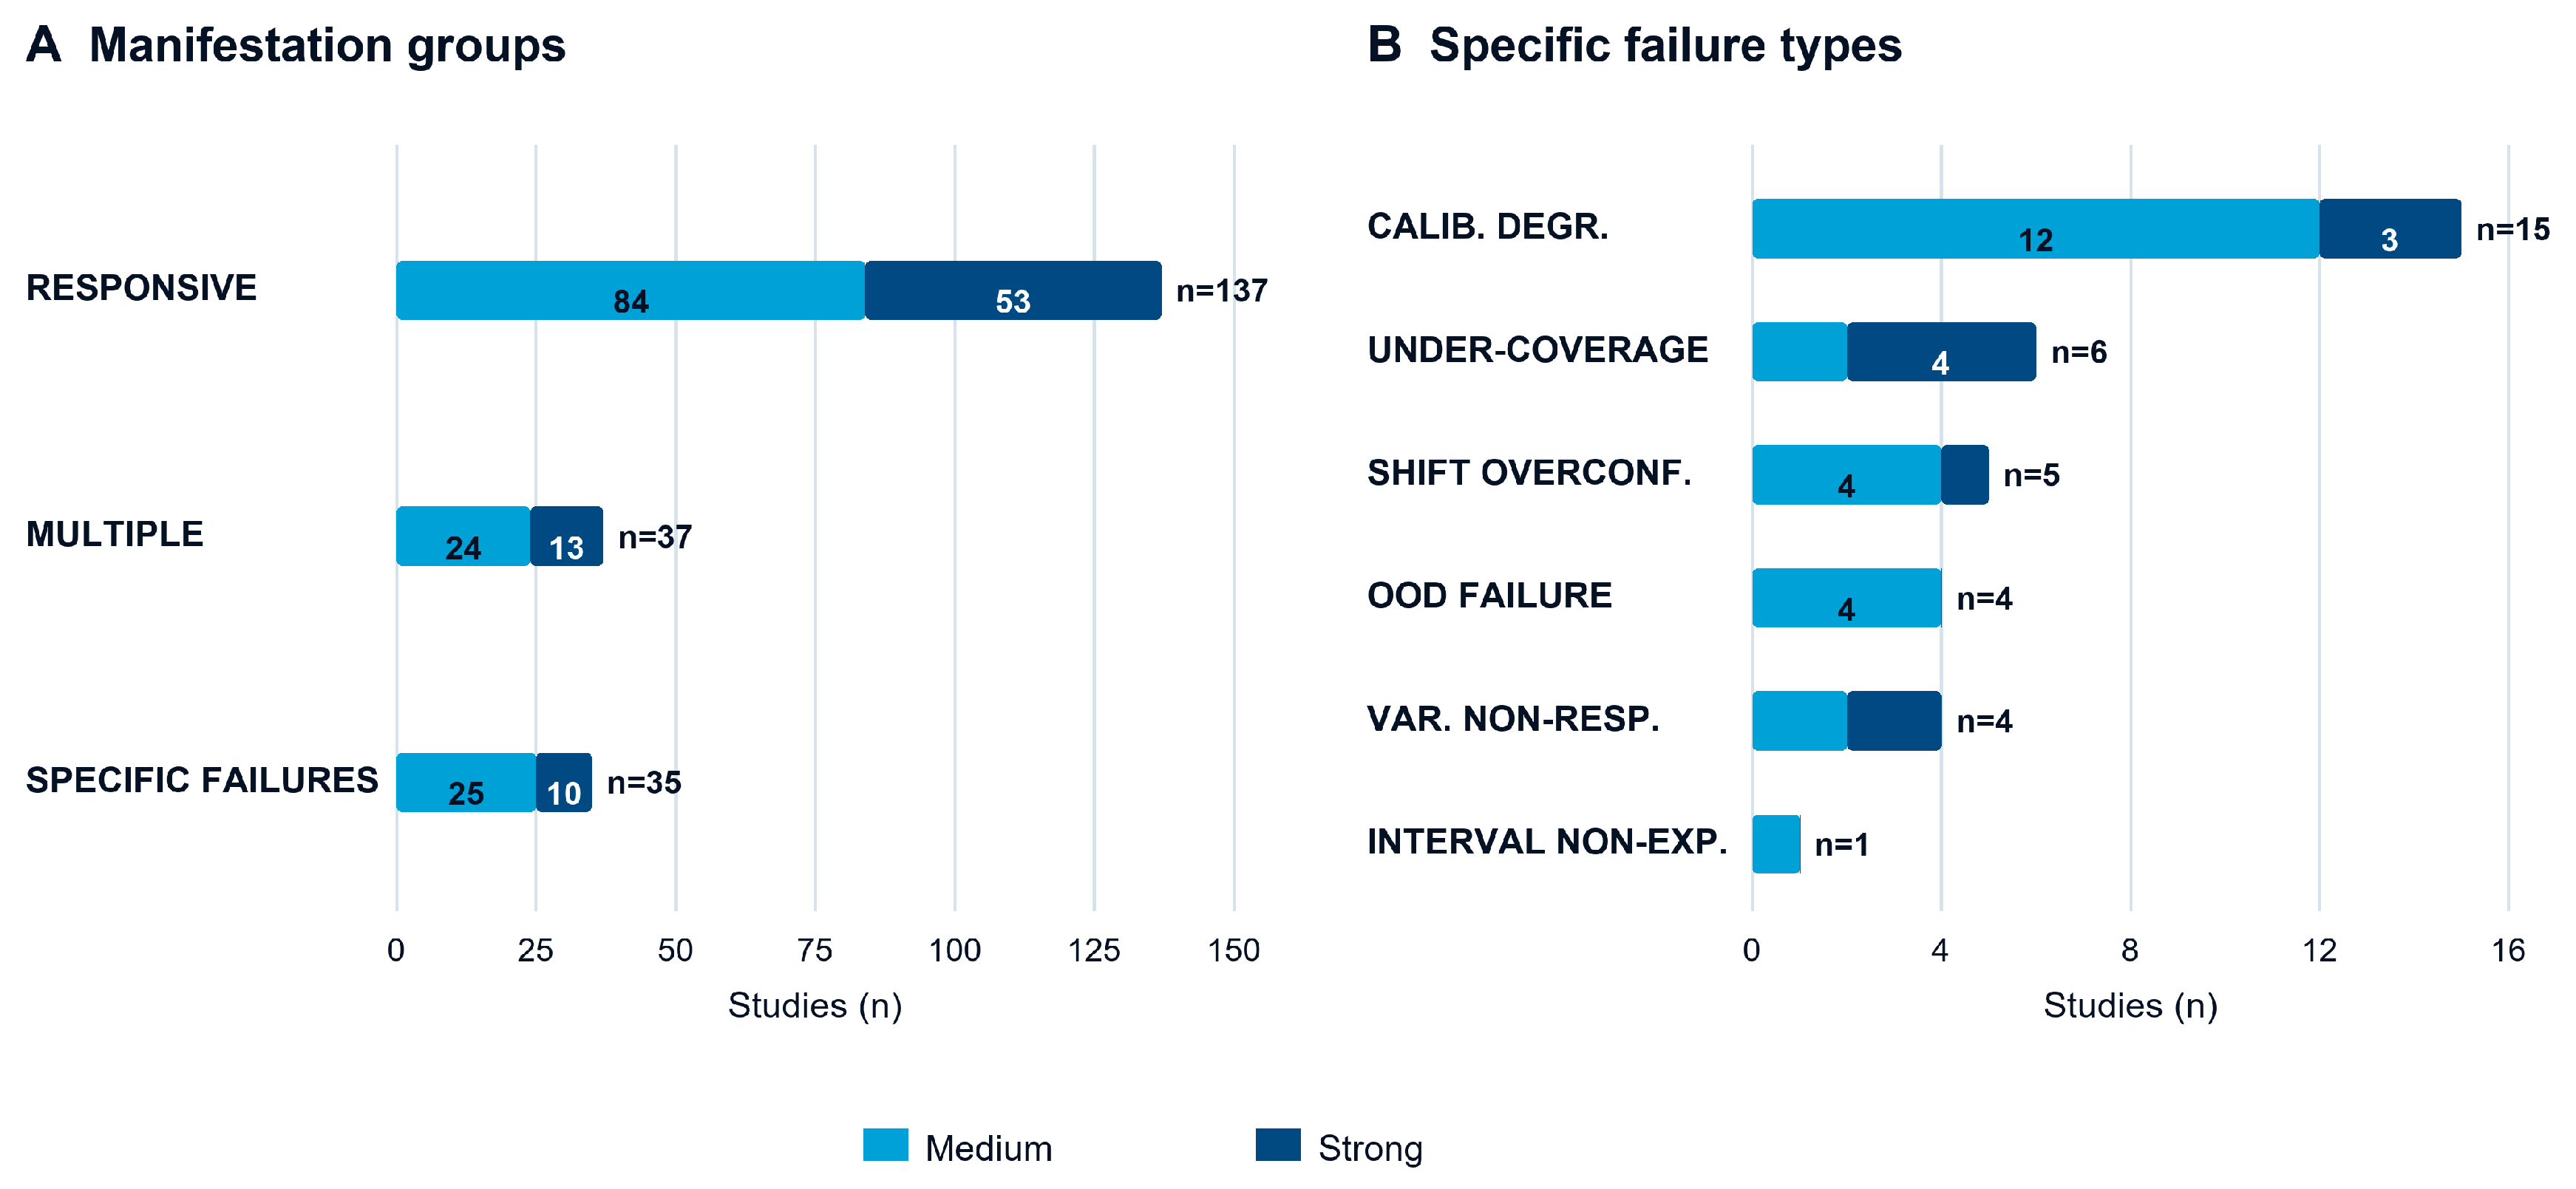
Strong, Medium, and Weak do reveal clear tier differences in current research on AI uncertainty quantification, but the ‘quality’ that can be discussed here is limited to the completeness with which the dominant claim receives real-world evidence support and cannot substitute for the overall quality of the paper, algorithmic performance, or research value. Strong means that, under the rules of this study, conditions, testing, uncertainty responses, and additional corroboration form a relatively complete and readily verifiable chain; Medium means that the core chain has formed but extended corroboration is limited; Weak means that the chain breaks earlier. The three tiers correspond inversely to PFG strength but do not constitute a success–failure ranking. Among the 76 Strong studies, 10 still explicitly exposed a single uncertainty failure, which precisely indicates that stronger evidence traceability increases the visibility of failure rather than guaranteeing a positive result.
This stratification can be understood as normal heterogeneity while the field remains at a stage in which evidence norms are gradually taking shape, but it should not be stated as ‘there is no authoritative method in metrology.’ Metrology has already established a formal framework for measurement uncertainty through the GUM [
34]; Carratù et al. further discussed the propagation of input measurement uncertainty in artificial neural networks [
35]. What is still lacking is an authoritative evaluation specification that can uniformly connect claims, real-world conditions, and empirical responses across AI tasks, output types, and application contexts. Existing UQ reviews have systematically organized probabilistic, non-probabilistic, and propagation techniques [
30] and have further summarized uncertainty-based multidisciplinary design optimization into surrogate modeling, decomposition, intelligent optimization, and other routes [
31]. PFG stratification supplements the evidence question after the adoption of a technique: regardless of the method used to generate an output, can the real-world claim it supports be traced, tested, and verified?
Therefore, the contribution of this study is not to propose an audit standard for judging whether a study is ‘qualified or unqualified’ but to convert the previously general statement that ‘AI uncertainty evidence varies in completeness’ into observable, decomposable, and comparable reference coordinates. A study falling into Weak indicates that at least one key evidence node has not yet closed and usually warrants targeted addition of condition testing, uncertainty response, or extended corroboration; a study entering Strong indicates only that the organization of its public evidence is relatively complete and cannot further certify that the computation is correct, the statistical inference is valid, the setting is generalizable, or the paper is of high quality. PFG thus has the asymmetric property of being ‘sensitive to defects and incapable of certification’: it is more suitable for locating positions that need improvement.
6.3. Conclusions
This study applied a structured 15-dimensional coding framework to 566 studies on AI uncertainty quantification and used the 556 studies with identifiable dominant claims as the common analytic set. The results show that 347 studies (62.4%) experienced an evidence chain break either at the identification or testing of claim-relevant conditions or at the uncertainty response link; among them, 179 studies did not form a closed correspondence at the identification of claim-relevant conditions or the entry of the condition into testing, whereas 168 studies broke at the test–uncertainty response link. This study thereby quantitatively confirms that, in the present literature corpus, the non-closure of publicly reported evidence between AI uncertainty outputs and real-world physical, measurement, or operational conditions is not an isolated phenomenon, but a systematic issue that most studies need to address.
The resulting Weak, Medium, and Strong tiers reflect differences in the completeness of claim–evidence support in the current field. Given that AI uncertainty outputs still lack a unified authoritative evaluation specification across tasks and output types, this heterogeneity has a realistic basis; however, it does not mean that all tiers are equally sufficient, nor does it equate the PFG tier with the overall quality of a paper. Weak indicates that at least one key node in the evidence chain still needs to be strengthened, whereas Strong indicates only that the evidence relationship is more complete and more readily verifiable under the current reference frame.
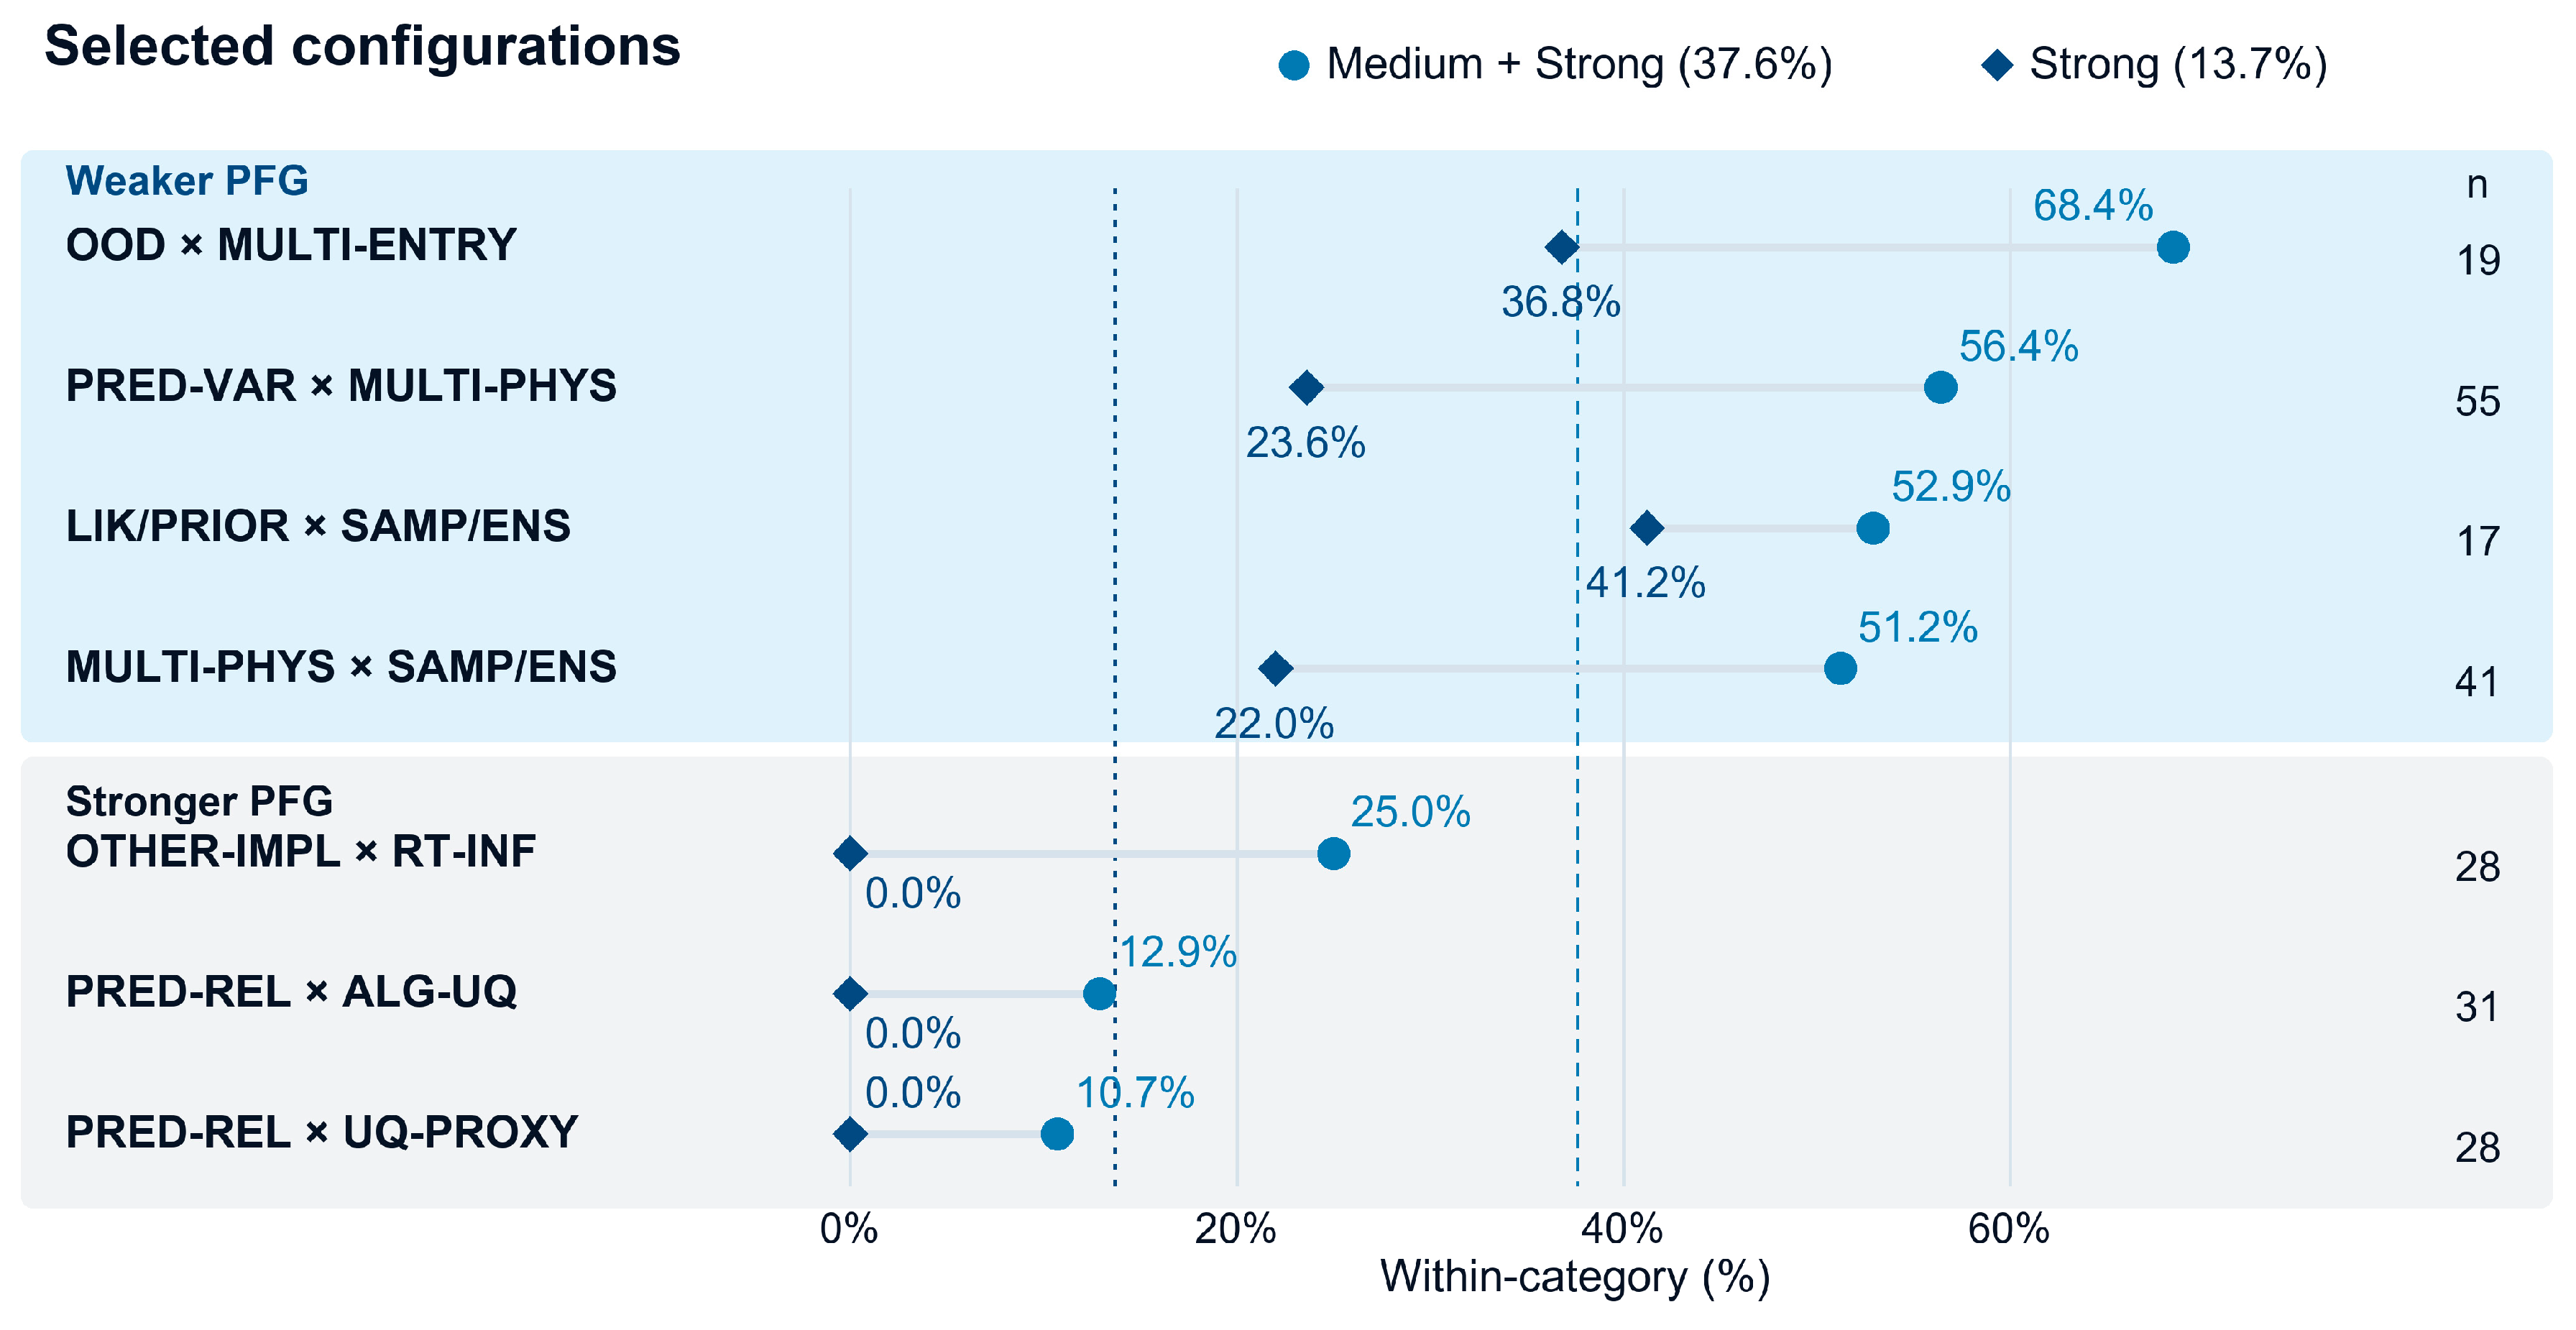
The category-specific tier distributions further indicate how these differences may arise. Specific OOD, drift, error, or quality claims, as well as Multiple uncertainty entry points, Multiple physical information types, and Sampling/ensemble approximation, more often co-occurred with Strong; general prediction reliability, independent proxy scores, and real-time implementation constraints more often co-occurred with Weak. These patterns do not constitute rankings of technologies or fields but provide a clear direction for improvement: studies should not only increase output complexity or the number of validations but should move toward a closed chain of ‘specific claim–relevant condition testing–uncertainty-specific response–extended corroboration.’
The core contribution of this study is therefore to provide a bounded evidence reference frame: it converts evidence defects in AI uncertainty quantification that were previously difficult to locate into enumerable breaks, comparable levels, and discussable research configurations. This reference frame can indicate where a study is most likely to need strengthening but cannot be used to certify that a method is correct, a study is qualified, or a paper is of high quality. The value of PFG lies in making ‘whether this uncertainty claim has received real-world support’ an answerable question, rather than replacing independent evaluations of algorithmic performance, statistical validity, and metrological conformity.
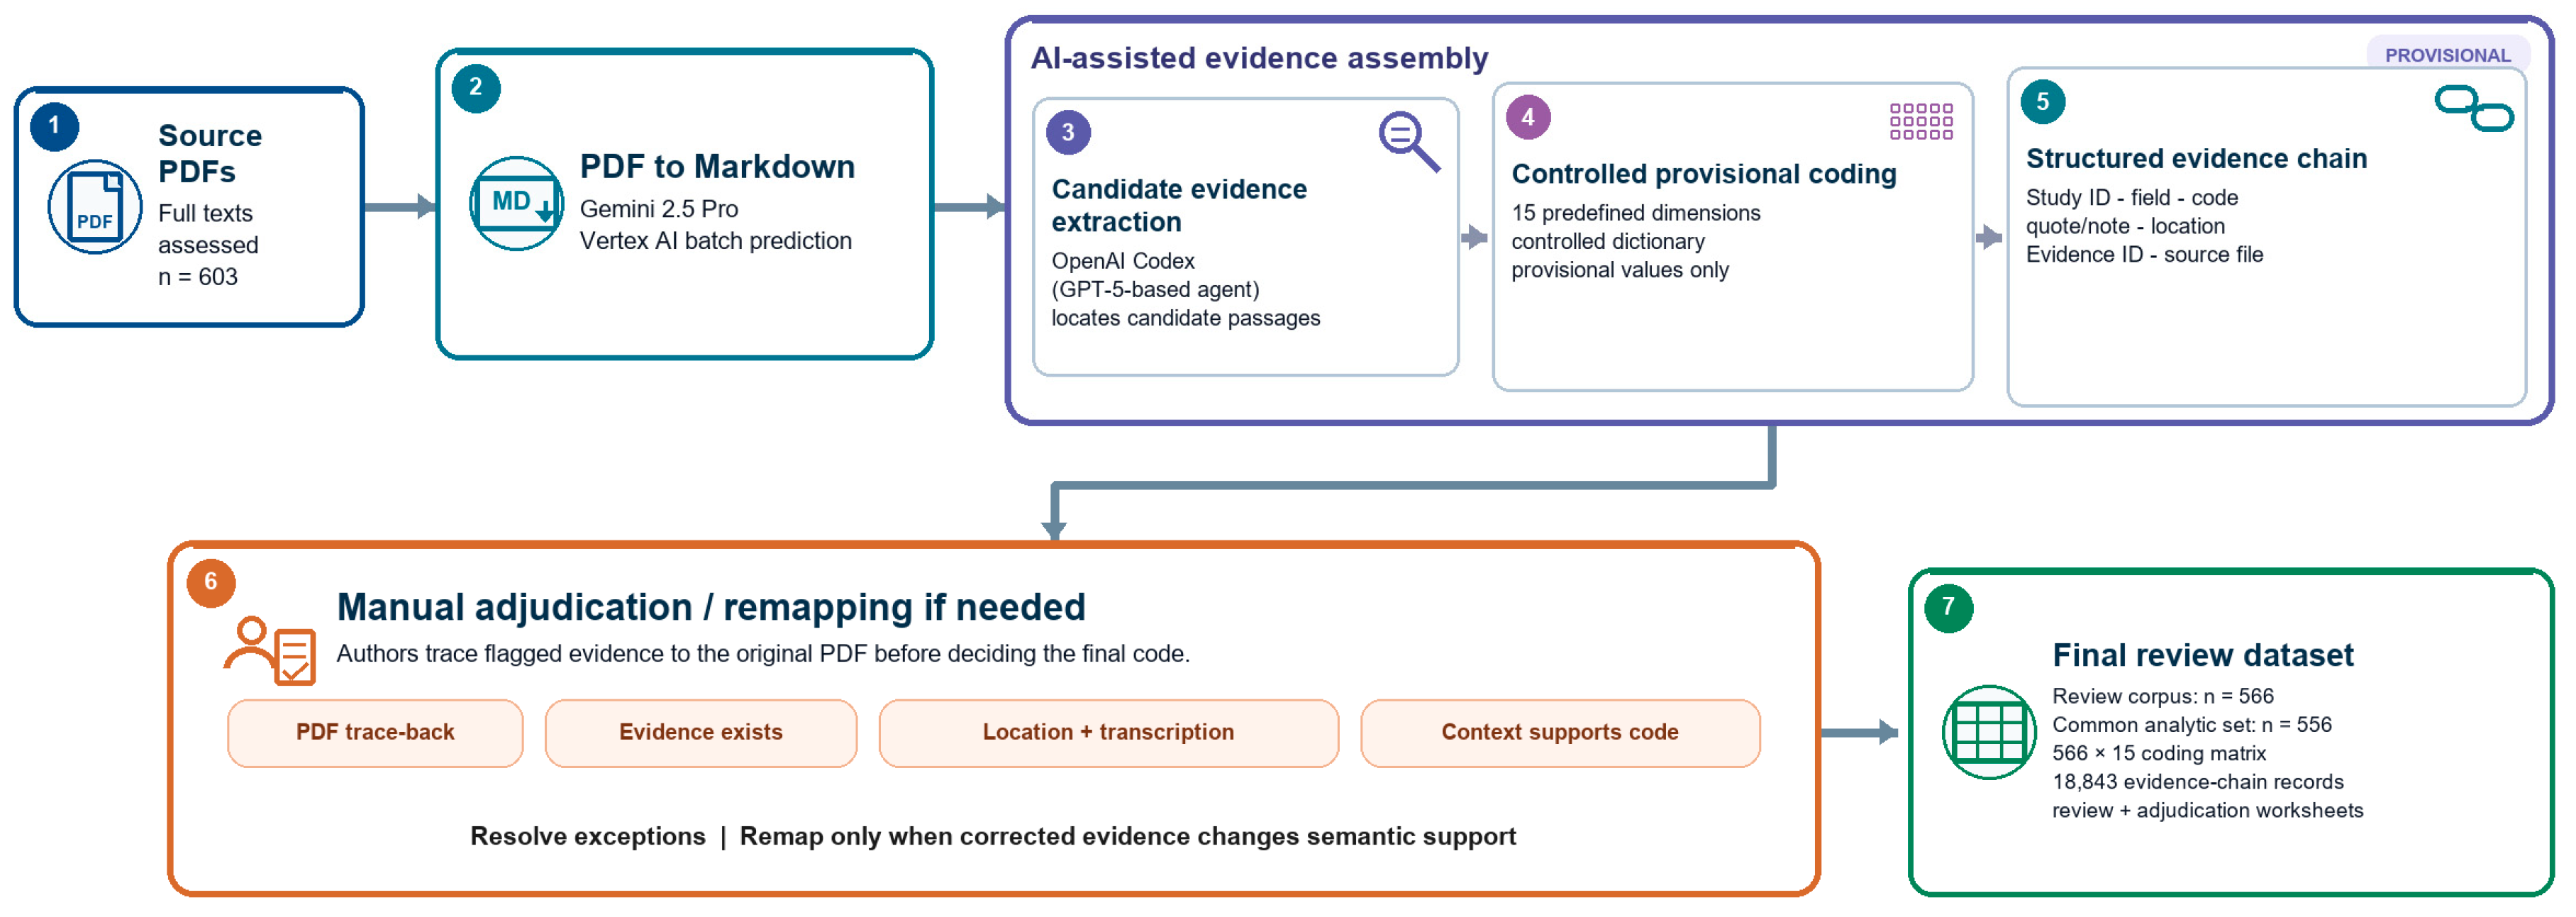
This review did not conduct a separate venue-oriented search of conference proceedings. The corpus was intentionally limited to journal studies identified through the Web of Science Core Collection for which full texts could be retrieved for row-level evidence coding. This scope improved consistency in source retrieval and evidence traceability across the 15 coding dimensions, while the resulting 566-study corpus provided a substantial basis for the intended descriptive analysis. However, it may underrepresent recent methodological developments disseminated primarily through conference venues such as UAI, AISTATS, and AAAI. The findings should therefore be interpreted as characterizing the defined journal-literature corpus rather than the complete literature on AI uncertainty quantification.