1. Introduction
Sprint acceleration performance is a key physical determinant in team sports such as basketball, where repeated high-intensity efforts occur over short distances and under constrained indoor conditions [
1,
2]. Players are frequently required to rapidly accelerate over distances shorter than 30 m, often from non-standard starting positions, making the ability to reach high velocities quickly a decisive component of performance. Consequently, quantifying sprint mechanical characteristics has become a central concern for performance practitioners seeking to individualize training, monitor adaptations, and guide return-to-play strategies [
3,
4].
Traditionally, sprint mechanical variables have been derived from gold-standard laboratory methods using three-dimensional motion capture and force-plate systems [
5,
6,
7]. While these approaches provide accurate estimates of center-of-mass kinematics and kinetics, they are poorly suited to ecological team-sport environments due to their cost, logistical constraints, and limited feasibility during routine training or competition [
8]. To overcome these limitations, a macroscopic inverse dynamic approach based on velocity-time or position–time data has been proposed, allowing the computation of key sprint mechanical outputs, such as maximal velocity, theoretical maximal velocity, horizontal force, and acceleration time constant, under field conditions [
9,
10].
The validity of this approach critically depends on the accuracy of the velocity or position data used as input [
8], in addition to the quality of the subsequent data processing. Several field-based measurement tools usable in applied practice have therefore been investigated, including motorized linear encoders (e.g., 1080 Sprint), laser guns, radar devices, global positioning systems (GPS), and timing gates [
8]. A comprehensive multi-system comparison by Fornasier-Santos et al. demonstrated that these technologies provide highly comparable estimates for maximal velocity-related variables, whereas early acceleration parameters such as the acceleration time constant and horizontal force exhibit larger inter-system discrepancies, reflecting the sensitivity of these variables to signal processing procedures, sampling frequency, modeling assumptions, and numerical differentiation methods, particularly when derived from position-based systems [
8,
11]. However, the use of these systems still relies on dedicated sprint testing protocols, which may limit their integration into routine training or competition environments.
In parallel, the widespread adoption of tracking technologies in team sports has enabled the continuous collection of velocity and acceleration data during training and competition [
12]. This has led to the recent development of “embedded” or in situ acceleration-velocity profiling methods derived from velocity-acceleration relationships, potentially allowing practitioners to estimate sprint mechanical characteristics without dedicated testing sessions [
13]. In youth basketball players, Jovanović et al. reported that LPS-derived maximal sprinting speed showed acceptable agreement and sensitivity when compared with laser gun measures, whereas acceleration-related parameters exhibited substantially poorer sensitivity, thereby limiting their usefulness for detecting small but meaningful changes in performance [
14]. These findings highlight that, even under controlled sprint conditions, the agreement and sensitivity of LPS-derived mechanical outputs remain variable across sprint metrics, raising important questions regarding their interchangeability with other field measurement systems.
Despite these advances, important gaps remain. First, most validation studies have been conducted in outdoor or athletics-oriented contexts, whereas basketball performance is characterized by short-distance sprints performed indoors with constrained run-up distances and frequent changes in movement patterns. Second, although local positioning systems (LPS) are now widely deployed in professional basketball, no study has yet directly compared sprint mechanical outputs derived simultaneously from LPS, radar, and laser technologies during maximal court-length sprints. Finally, previous basketball-specific investigations have typically relied on a single reference system and have not provided a comprehensive quantification of inter-system agreement and measurement error across multiple field technologies using standardized modeling approaches for characterizing acceleration-velocity mechanical outputs over a standard basketball court distance (28 m).
Therefore, the purpose of the present study is to compare LPS, radar, and laser-derived mechanical outputs during 28 m maximal sprints performed on an indoor basketball court. Specifically, this study aimed to (i) examine the inter-system agreement of these three technologies for estimating velocity- and acceleration-based sprint mechanical variables using a standardized time–velocity modeling approach, and (ii) evaluate their inter-trial reliability.
Based on previous literature, it was hypothesized that radar and laser technologies would demonstrate closer agreement for velocity-related variables, whereas LPS-derived acceleration-related parameters would exhibit larger discrepancies due to differences in signal processing and sampling frequency.
2. Materials and Methods
2.1. Participants
Twenty-two elite youth basketball players (age: 16.5 ± 1.1 years; height: 189.2 ± 7.3 cm; body mass: 75.8 ± 9.6 kg) from the French National Institute of Sport (INSEP) participated in the present study. All participants were competing at the national level and were free from musculoskeletal injury at the time of testing. The sample included guards, forwards, and centers representative of high-level youth basketball performance.
Participants and their legal guardians were informed of the purpose, procedures, and potential risks of the study and provided written informed consent prior to participation. The study was conducted in accordance with the Declaration of Helsinki.
2.2. Experimental Protocol
After a standardized 20 min warm-up including mobility exercises, progressive running drills, and submaximal sprints, each participant performed three maximal 28 m linear sprint trials on an indoor basketball court. Sprints were initiated from a stationary position following a verbal “go” signal, and athletes were instructed to sprint maximally through the end of the court. A minimum of 3 min of passive recovery was allowed between trials.
Sprint velocity and position were recorded simultaneously using three systems: (i) laser, (ii) radar, and (iii) LPS. The two fastest trials based on 28 m sprint time were retained for analysis. All systems captured running speed concurrently but were not time-synchronized because of hardware constraints. For each trial and each system, raw position– or velocity–time data were processed independently using the same modeling procedure described below.
2.3. Sprint Mechanical Model
Sprint kinematics were modeled using the time–velocity mono-exponential approach proposed by Morin and Samozino [
9,
10]:
Because velocity is not null at initiation under ecological field conditions, a temporal offset
was explicitly incorporated as key component of the modeling approach to account for rolling or non-zero start velocities. Importantly, the temporal offset
was not used to synchronize devices post hoc, but to account for the difference between the theoretical onset of the mono-exponential model and the first usable data point detected for each system. Thus, the origin of time was treated as a model parameter rather than as an externally imposed hardware trigger:
The corresponding position–time function was obtained by integration:
Acceleration was derived analytically as
From these equations, the following sprint mechanical parameters were extracted: theoretical maximal velocity , theoretical maximal acceleration , and acceleration time constant . These parameters describe the kinematic characteristics of sprint acceleration and differ from the theoretical force–velocity variables (V0 and F0) classically derived from force–velocity profiling approaches.
Model goodness of fit was evaluated using the coefficient of determination and the mean absolute error (MAE) computed between observed and predicted signals. Initial parameter estimates were set to S0 = 8 m·s−1, Tau = 1 s, and t0 = 0 s for all fitting procedures, while x0 was initialized at 0 m for position-based models only. No explicit bounds were imposed during the optimization procedure. Across all trials and systems, the optimization consistently converged toward physiologically plausible solutions.
2.4. Data Acquisition and Processing
2.4.1. Laser
The laser system (MuscleLab™, Ergotest Innovation AS, Stathelle, Norway) was positioned on a tripod 5 m behind the starting line and 1 m above ground level, corresponding approximately to the height of participants’ center of mass [
15]. The laser system calculates velocity measuring the time delay of pulsed infrared light that is reflected off the subject [
16]. Raw velocity data were sampled at 1000 Hz, smoothed using the manufacturer’s software, and exported in ASCII format for further processing (Python 3.9.15, Python Software Foundation, Wilmington, DE, USA). Because the proprietary signal processing parameters implemented within the manufacturer’s software are not fully accessible to the user, the present study relied on the processed signals directly exported from the commercial system, reflecting the practical field-based use of the technology. Sprint onset was defined as the first sample where velocity exceeded 0.5 m·s
−1 and termination was set at 25 m after sprint onset. Position data were fitted using Equation (3) via least-squares optimization [
17,
18].
2.4.2. Radar
Radar data were collected using a Stalker ATS II (Applied Concepts Inc., Richardson, TX, USA) positioned identically to the laser. Velocity was sampled at 46.875 Hz [
16] and processed using custom software (MookyStalker V2.0.9). Raw velocity was low-pass filtered for sprint detection only. Sprint onset was defined as the first sample exceeding 0.75 m·s
−1, and sprint termination corresponded to the end of the acceleration phase identified from the filtered velocity signal. Data were fitted using Equation (2) via least-squares optimization [
18].
2.4.3. Local Positioning System (LPS)
Positional data were captured at 20 Hz using a Kinexon LPS (Kinexon GmbH, Munich, Germany). Fourteen anchors were installed approximately 8 m above the court surface, and devices were worn between the scapulae. The Kinexon LPS has demonstrated acceptable reliability and validity for measuring instantaneous velocity and acceleration across a range of starting velocities (coefficient of variation < 10%, ICC > 0.9; mean biases: velocity < 0.5 km·h
−1, acceleration < 0.01 m·s
−2) [
19]. Raw positional data were exported and processed using Python (version 3.9.15). Instantaneous velocity was obtained by numerical differentiation and used exclusively for sprint detection. Samples exceeding 10 m·s
−1 were removed, as such values are not physiologically plausible in basketball sprinting and likely reflect transient tracking artefacts inherent to ultra-wideband positioning systems. Sprint onset was defined as the last sample before velocity exceeded 1 m·s
−1, and sprint termination was set at 25 m after sprint onset. This threshold was used exclusively for sprint detection and to avoid spurious fluctuations around zero velocity frequently observed in ultra-wideband positioning systems. Sprint mechanical outputs were subsequently estimated from the fitted position–time curve. Position–time data were then fitted using Equation (3) via a least-squares optimization procedure. This modeling approach was deliberately chosen to avoid direct numerical differentiation of LPS-derived positional data for the estimation of sprint mechanical outputs, as differentiation is known to amplify measurement noise and may bias velocity and acceleration estimates, particularly during the early acceleration phase. Fitting the position–time curve provides a constrained and physiologically plausible representation of sprint kinematics, allowing more robust estimation of velocity- and acceleration-related parameters.
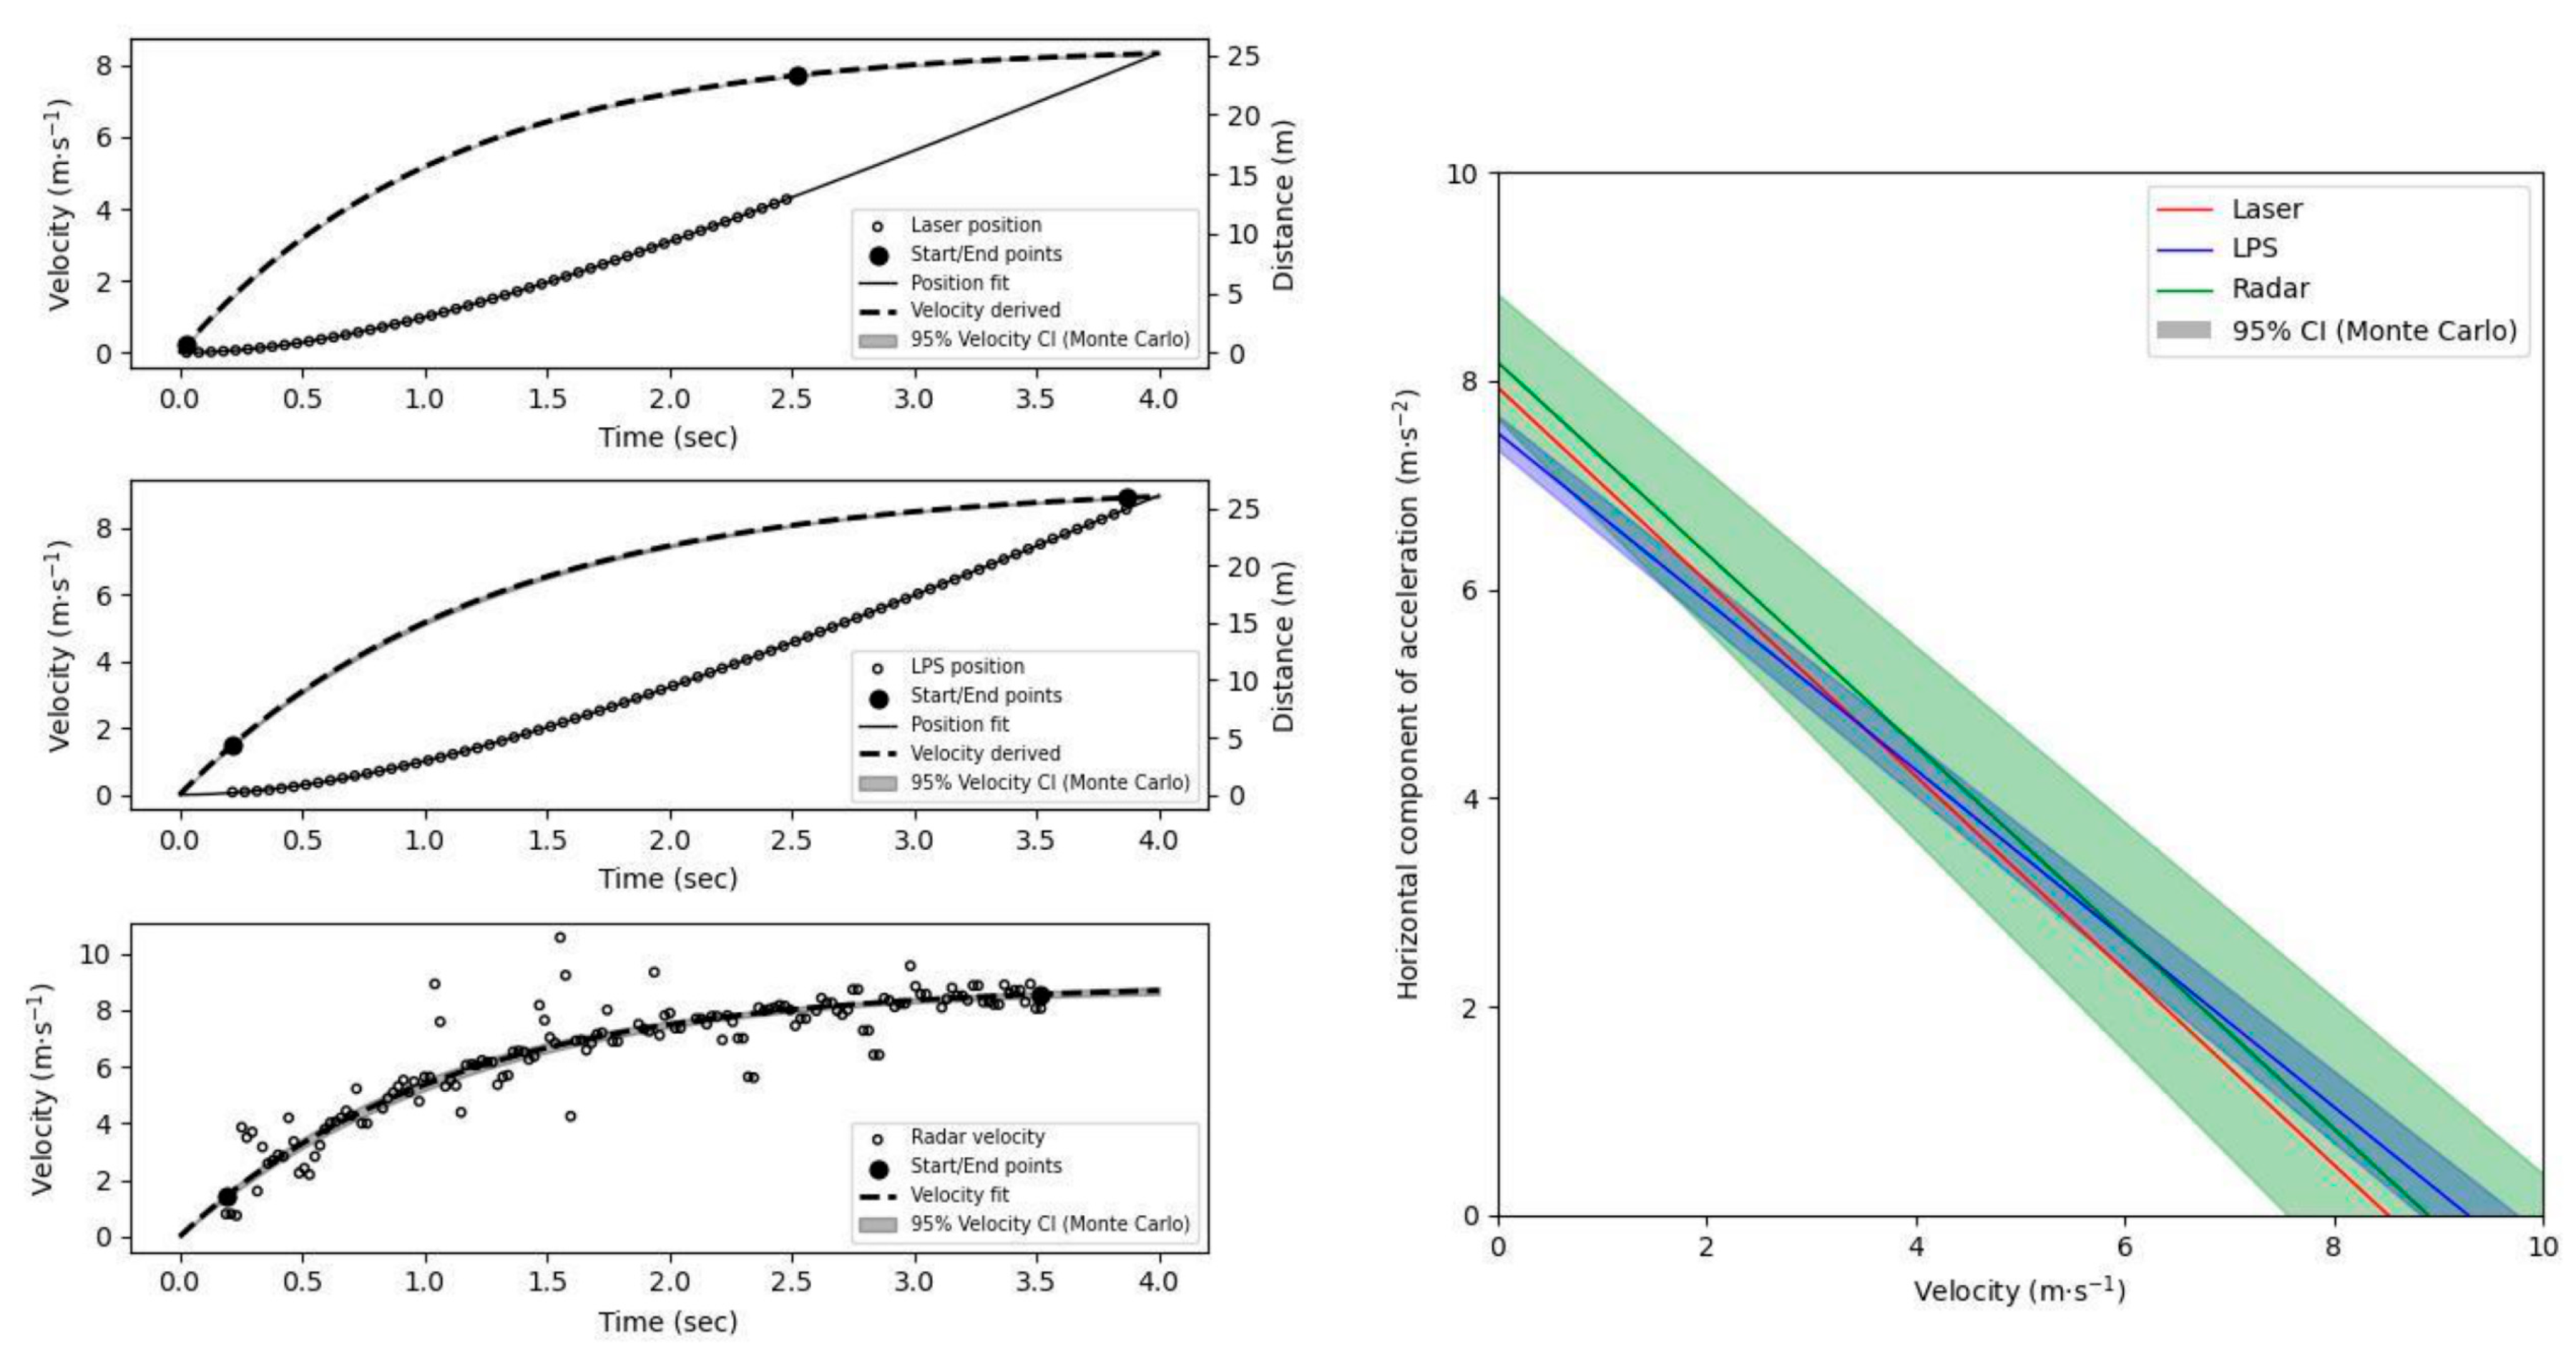
Representative examples of the fitted sprint curves obtained with the three measurement systems are presented in
Figure 1.
The fitting strategy was adapted to the native signal provided by each device. Radar directly provides velocity–time data and was therefore fitted using the velocity–time function. Conversely, laser and LPS provide position–time data, and position fitting was preferred to avoid numerical differentiation of positional signals, which is known to amplify measurement noise and may impair the estimation of acceleration-related parameters.
2.5. Statistics
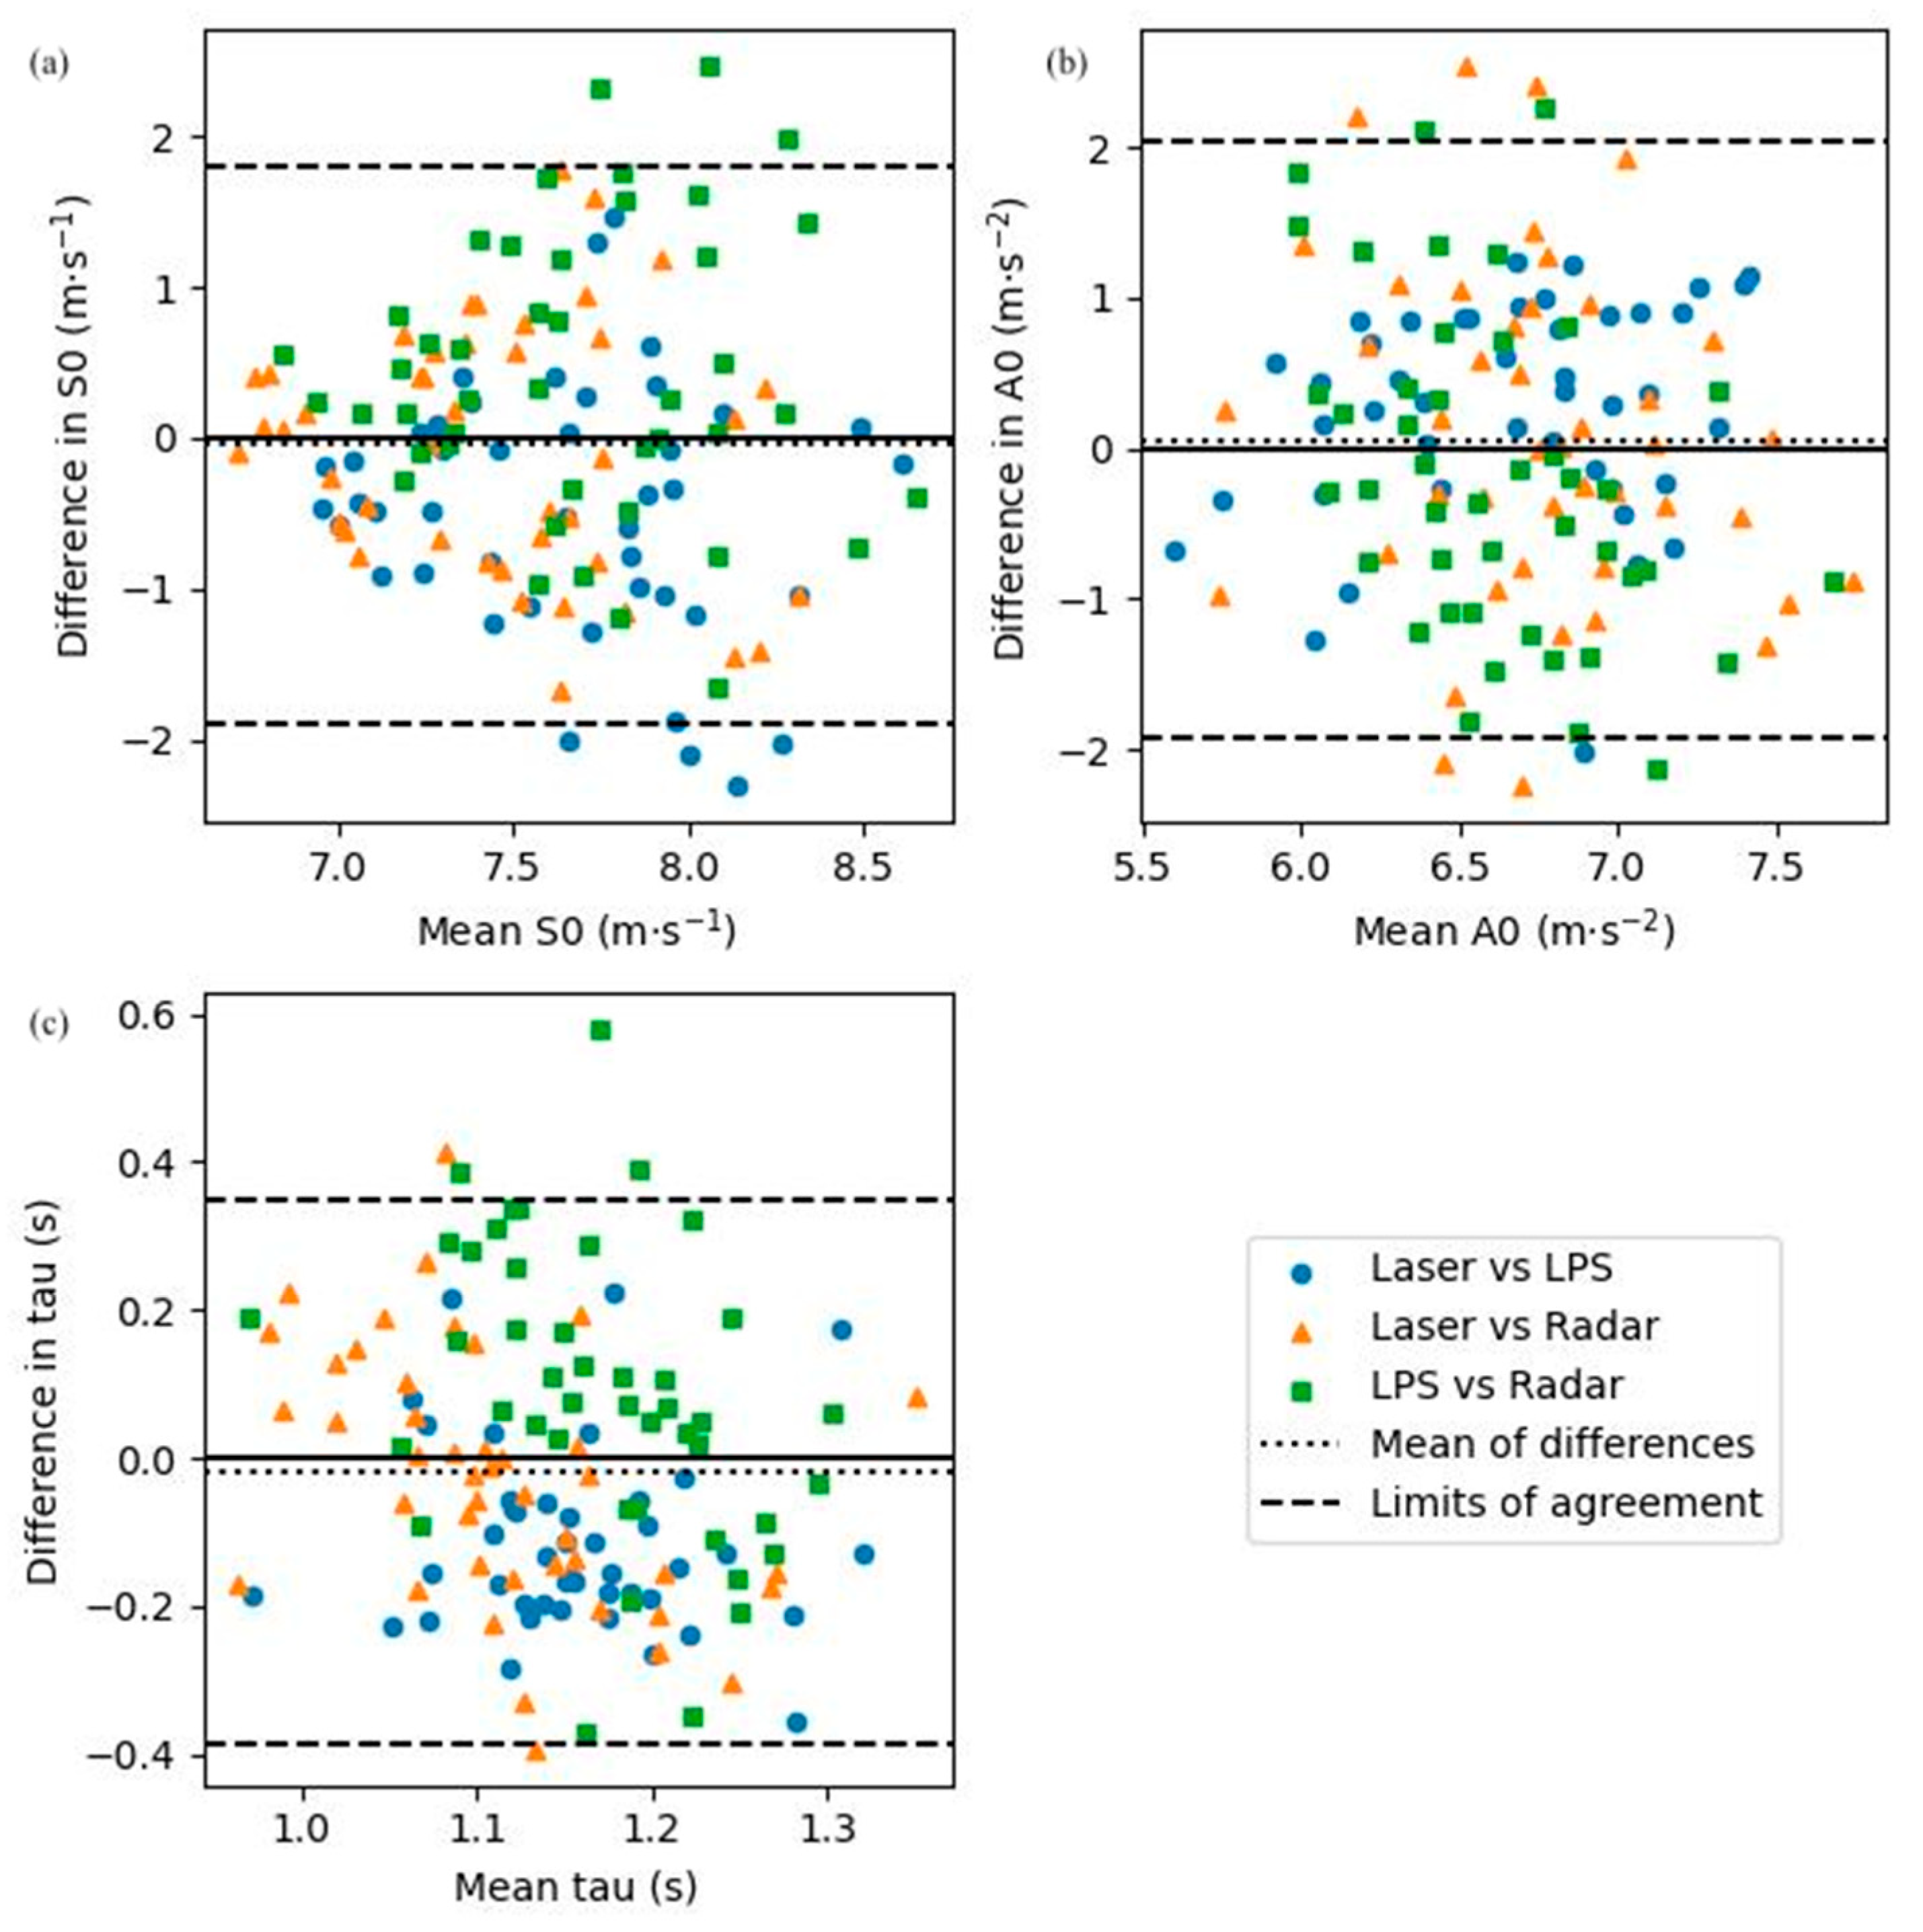
All analyses were performed using Python (version 3.9.15). Data are presented as mean ± SD. Inter-system agreement was assessed using mean bias, 95% limits of agreement (Bland–Altman method) (
Figure 2), concordance correlation coefficients (CCC), and typical error of estimate (TEE) [
20]. Inter-trial reliability was evaluated using coefficient of variation (CV), change in the mean (CM), relative CM, and standard error of measurement (SEM) [
21]. Normality of the data distributions was assessed using the Shapiro–Wilk test prior to statistical analyses.
4. Discussion
The main findings were that (i) S0 showed close agreement between laser and radar systems, whereas larger-magnitude systematic biases (≈5–6%) were observed when LPS was involved, and (ii) acceleration-related variables (A0 and Tau) exhibited larger inter-system discrepancies. In addition, all three systems demonstrated high inter-trial reliability, supporting their use for longitudinal monitoring when the same device is consistently employed.
4.1. Inter-System Agreement
Inter-system agreement analyses revealed that systematic biases were observed across field technologies. While radar and laser showed close agreement, LPS-derived S
0 values were consistently higher, resulting in relative systematic errors exceeding 5% when compared with both laser and radar. This indicates that, contrary to previous LPS-based basketball studies reporting acceptable validity for maximal sprinting speed [
14], S
0 values could not be considered interchangeable across field technologies in our context. These relative systematic errors largely exceed the 1–2% range previously reported for maximal velocity variables in outdoor sprint contexts [
8], with values ranging from 0.89% between radar and laser to 6.49% between laser and LPS and 5.26% between LPS and radar. In contrast to previous comparison studies [
8,
14,
16,
22], the three technologies cannot be considered interchangeable for the assessment of maximal velocity-related outputs during indoor basketball sprints. A plausible explanation is that the maximal velocity phase is limited over a 28 m sprint distance, which may constrain the accurate estimation of S
0 during indoor basketball sprints. Although some authors suggest that team-sport athletes reach their maximum speed earlier [
23], this short distance likely increases the influence of sampling frequency, signal processing, and modeling procedures on the estimation of S
0. In particular, the derivation of velocity from filtered positional data in LPS may lead to an overestimation of the modeled maximal velocity compared with radar- or laser-based measures, as reflected by the systematic biases observed in the present study (≈5–6%). This suggests that practitioners should either interpret LPS-derived S
0 values with caution in sprint protocols, or prioritize alternative sprint metrics more representative of basketball demands, such as early acceleration parameters or velocity reached within fixed short distances (e.g., 5–10 m).
Regarding early acceleration variables, all comparisons revealed substantially greater inter-system discrepancies than those observed for velocity-related outputs. This interpretation was further supported by the lower concordance correlation coefficients observed for A
0 and Tau compared with S
0. The relative systematic error for Tau ranged from 2.64% between laser and radar to 10.55% between laser and LPS, with intermediate values of 7.19% for the LPS–radar comparison. Similarly, the relative systematic error for A
0 ranged from 1.15% between laser and radar to 3.92% between laser and LPS. These findings are consistent with a previous study which reported markedly larger inter-system discrepancies for early acceleration variables than for maximal velocity-related parameters (up to ~13% for Tau and F
0 vs. <3% for maximal velocity metrics) [
8]. Similar limitations were also highlighted in basketball-specific investigations, where acceleration-related parameters derived from LPS showed reduced agreement and limited sensitivity compared with laser-based measures [
14]. This may partly be explained by the fact that LPS-derived velocity and acceleration signals are obtained from differentiated positional data and may undergo device-level signal processing, which can attenuate high-frequency components and affect early acceleration estimates. Given the rapid changes in velocity during the initial phase of sprinting, these signal processing constraints may substantially influence the estimation of acceleration-related mechanical outputs, thereby limiting the sensitivity and validity of such metrics when derived from LPS in short, high-intensity movements. This highlights important methodological limitations of current approaches and supports the need for alternative frameworks capable of capturing sprint mechanics under ecological conditions. From an inter-system agreement perspective, these results indicate that acceleration-related mechanical outputs are particularly sensitive to the measurement technology employed and should not be considered interchangeable across systems. In practice, this suggests that when precise assessment of early acceleration characteristics is required, radar- or laser-based measurements should be preferred over LPS-derived estimates. Conversely, LPS-based acceleration metrics may be more appropriate for within-system longitudinal monitoring rather than for cross-system comparisons or benchmarking. In addition, several methodological factors may partly explain the inter-system discrepancies observed in the present study. Differences in sampling frequency between systems likely contributed to part of the inter-system variability. However, the mono-exponential modeling approach used in the present study relies on the global shape of the center-of-mass acceleration curve rather than on instantaneous stride-level events. Consequently, the signal dynamics relevant to S
0 and Tau estimation occur at substantially lower frequencies than those required to characterize foot–ground contact events or stride kinematics.
Additional simulation analyses performed during the revision process suggested limited influence of sampling frequency differences (20–1000 Hz) on the estimation of S
0 and Tau under realistic sprint conditions
(Supplementary Material S1).
4.2. Inter-Trial Reliability
Inter-trial reliability analyses revealed low coefficients of variation for all three systems, confirming the good reliability of sprint mechanical outputs derived from LPS, radar, and laser technologies. The highest CV values were observed for A
0 and Tau (≈3.7–4.7%), whereas S
0 exhibited very low variability across systems (0.68–1.36%). Our findings are consistent with previous investigations reporting similarly low inter-trial CV values (≤5.74%) [
8]. From a practical perspective, these levels of variability suggest that all three systems are suitable for within-system longitudinal monitoring. However, caution is warranted when interpreting small changes in sprint mechanical outputs, particularly for acceleration-related variables. The higher variability observed for A
0 compared with S
0 likely reflects the greater sensitivity of early acceleration metrics to measurement noise, signal processing procedures, and sampling frequency, especially when acceleration is derived from differentiated velocity or positional data. As A
0 is estimated from the initial portion of the acceleration phase—where the rate of change in velocity is highest—even small fluctuations in the underlying signal may disproportionately affect its estimation.
4.3. Limitations
Several limitations should be acknowledged. First, no laboratory reference system (e.g., three-dimensional motion capture or force platforms) was used, and therefore the present findings represent comparisons between field-based technologies. Second, the sprint distance (28 m) may limit the development of a clear maximal velocity plateau in some athletes, which may influence the estimation of S0 and Tau. However, this sprint distance was deliberately selected to reflect the ecological constraints and court-specific demands of basketball performance. Although the absence of hardware synchronization did not affect point-by-point time-series comparisons, which were not performed in the present study, it should be acknowledged as a limitation when interpreting time-sensitive parameters such as A0 and Tau. In addition, part of the inter-system variability may reflect differences in native signal acquisition, sampling frequency, manufacturer-level processing, and fitting procedures rather than device accuracy alone. Furthermore, proprietary manufacturer-level signal processing and filtering procedures could not be fully controlled or standardized across systems and may have contributed to inter-system variability. These methodological constraints are inherent to ecological basketball performance assessment and should therefore be considered when interpreting sprint mechanical outputs derived from short indoor sprints.
4.4. Perspectives
Recent developments have proposed the estimation of individual acceleration–speed profiles (ASP) directly from continuous tracking data collected during training and competition, thereby removing the need for discrete sprint testing [
13]. Preliminary work in football and rugby suggests that these embedded ASP may offer a time-efficient and ecologically valid alternative for monitoring sprint capabilities in team-sport environments [
13,
24,
25]. To date, all investigations in basketball have been conducted under controlled linear sprint conditions. In contrast, the theoretical appeal of embedded acceleration-speed profiling lies in its ability to characterize sprint capabilities directly from tracking data collected during routine basketball activities, where accelerations are frequently initiated from rolling starts, curved trajectories, and multi-directional movement patterns. At present, no study has yet specifically validated in situ ASP methods in ecological basketball contexts. Future research should therefore move beyond linear sprint testing and evaluate in situ ASP derived from LPS data during basketball training and competition. Such investigations are necessary to determine whether embedded ASP can meaningfully capture neuromuscular sprint qualities under the ecological constraints that define basketball performance.




 ,
,