Article

Feature-Level Fusion of Surface Electromyography and Mechanomyography Signals for MVC-Normalized Shoulder Abduction Force-Level Classification in Healthy Adults

1
School of Medical Informatics Engineering, Guangzhou University of Chinese Medicine, Guangzhou 510006, China
2
School of Medical Information Engineering, Guangdong Pharmaceutical University, Guangzhou 510006, China
*
Authors to whom correspondence should be addressed.
These authors contributed equally to this work.
Sensors 2026, 26(14), 4351; https://doi.org/10.3390/s26144351
Submission received: 2 June 2026 / Revised: 20 June 2026 / Accepted: 2 July 2026 / Published: 9 July 2026
(This article belongs to the Special Issue Advanced Sensing Techniques in Biomedical Signal Processing)

Abstract

Background: Accurate recognition of upper-limb force levels is important for wearable movement monitoring and rehabilitation engineering, yet the value of combining surface electromyography (sEMG) and mechanomyography (MMG) for shoulder force classification remains incompletely characterized. Methods: Ten healthy adults performed right shoulder abduction at four maximum voluntary contraction (MVC)-normalized force levels of approximately 10%, 30%, 60%, and 90% MVC. Signals were synchronously collected from the middle deltoid at 1000 Hz and segmented using 500 ms windows with a 150 ms stride. The evaluated classifiers were logistic regression (LR), k-nearest neighbors (KNN), decision tree (DT), support vector machine with a radial basis function kernel (SVM-RBF), random forest (RF), extremely randomized trees (ET), histogram-based gradient boosting decision tree (HGBDT), and multi-layer perceptron (MLP). Models were evaluated using group-aware five-fold cross-validation at the action-trial level. Results: The dataset contained 12,231 windows from 30 action-trial groups. HGBDT achieved the best performance, with an accuracy of 0.904 ± 0.023 , macro-F1 score of 0.911 ± 0.018 , quadratic weighted Cohen’s kappa of 0.910 ± 0.038 , and mean absolute grade error of 0.137 ± 0.042 . Fusion increased macro-F1 from 0.821 ± 0.030 for sEMG-only and 0.771 ± 0.015 for MMG-only to 0.911 ± 0.018 . Conclusions: These internally validated findings support the complementary value of sEMG and MMG for MVC-normalized shoulder force-level classification in healthy adults. Subject-independent and patient-level validation is required before clinical rehabilitation use.

1. Introduction

Objective quantification of upper-limb force production is increasingly relevant to wearable movement monitoring, rehabilitation engineering, and individualized motor training, because force-level changes cannot always be captured by visual observation or coarse ordinal assessment alone [1,2]. Manual muscle testing and related ordinal scales are simple and clinically accessible, but their limited score resolution and potential inter-rater variability make it difficult to identify small changes in force generation during repeated or high-score movements [3,4]. Wearable biosignals provide quantitative measurements of muscle electrical activation, mechanical vibration, and movement-related responses during standardized tasks [5,6]. Surface electromyography (sEMG) has been widely used to characterize muscle activation and motor-unit behavior, although its amplitude and spectral features can be influenced by electrode–skin impedance, crosstalk, motion artifacts, and preprocessing choices [7,8,9,10]. Mechanomyography (MMG) provides a complementary mechanical view of muscle contraction by capturing surface vibration, contractile oscillation, and load-related changes that are not directly represented in sEMG [5,11,12].
Recent work in multimodal wearable sensing suggests that combining neuromuscular, mechanical, and movement-derived information can improve sensor-based movement and fatigue assessment [13,14,15]. In shoulder and elbow motion estimation, biosignal fusion improved the coefficient of determination by 0.041–0.053 compared with MMG-only inputs [13]. A manual-lifting study also reported high fatigue-classification accuracy when sEMG and MMG information was jointly modeled [16]. Experimental studies using MVC and submaximal loading further support MMG as a mechanical counterpart to sEMG in force-related tasks [11,12]. However, previous work has mainly addressed joint acceleration, fatigue, gesture recognition, or load-lifting behavior. Evidence remains limited on whether sEMG and MMG provide complementary information for discrete MVC-normalized shoulder-abduction force levels, particularly when single-modality and fused feature sets are compared directly.
We hypothesized that the feature-level fusion of sEMG and MMG would improve four-level MVC-normalized shoulder-abduction classification and reduce ordinal prediction error compared with either modality alone. To test this hypothesis, we benchmarked eight supervised classifiers and compared sEMG-only, MMG-only, directly concatenated, and correlation-augmented fusion feature sets. Group-aware cross-validation at the action-trial level was used to reduce leakage between overlapping windows, and class-specific errors were examined to characterize the limits of force-level separability [17,18].

2. Materials and Methods

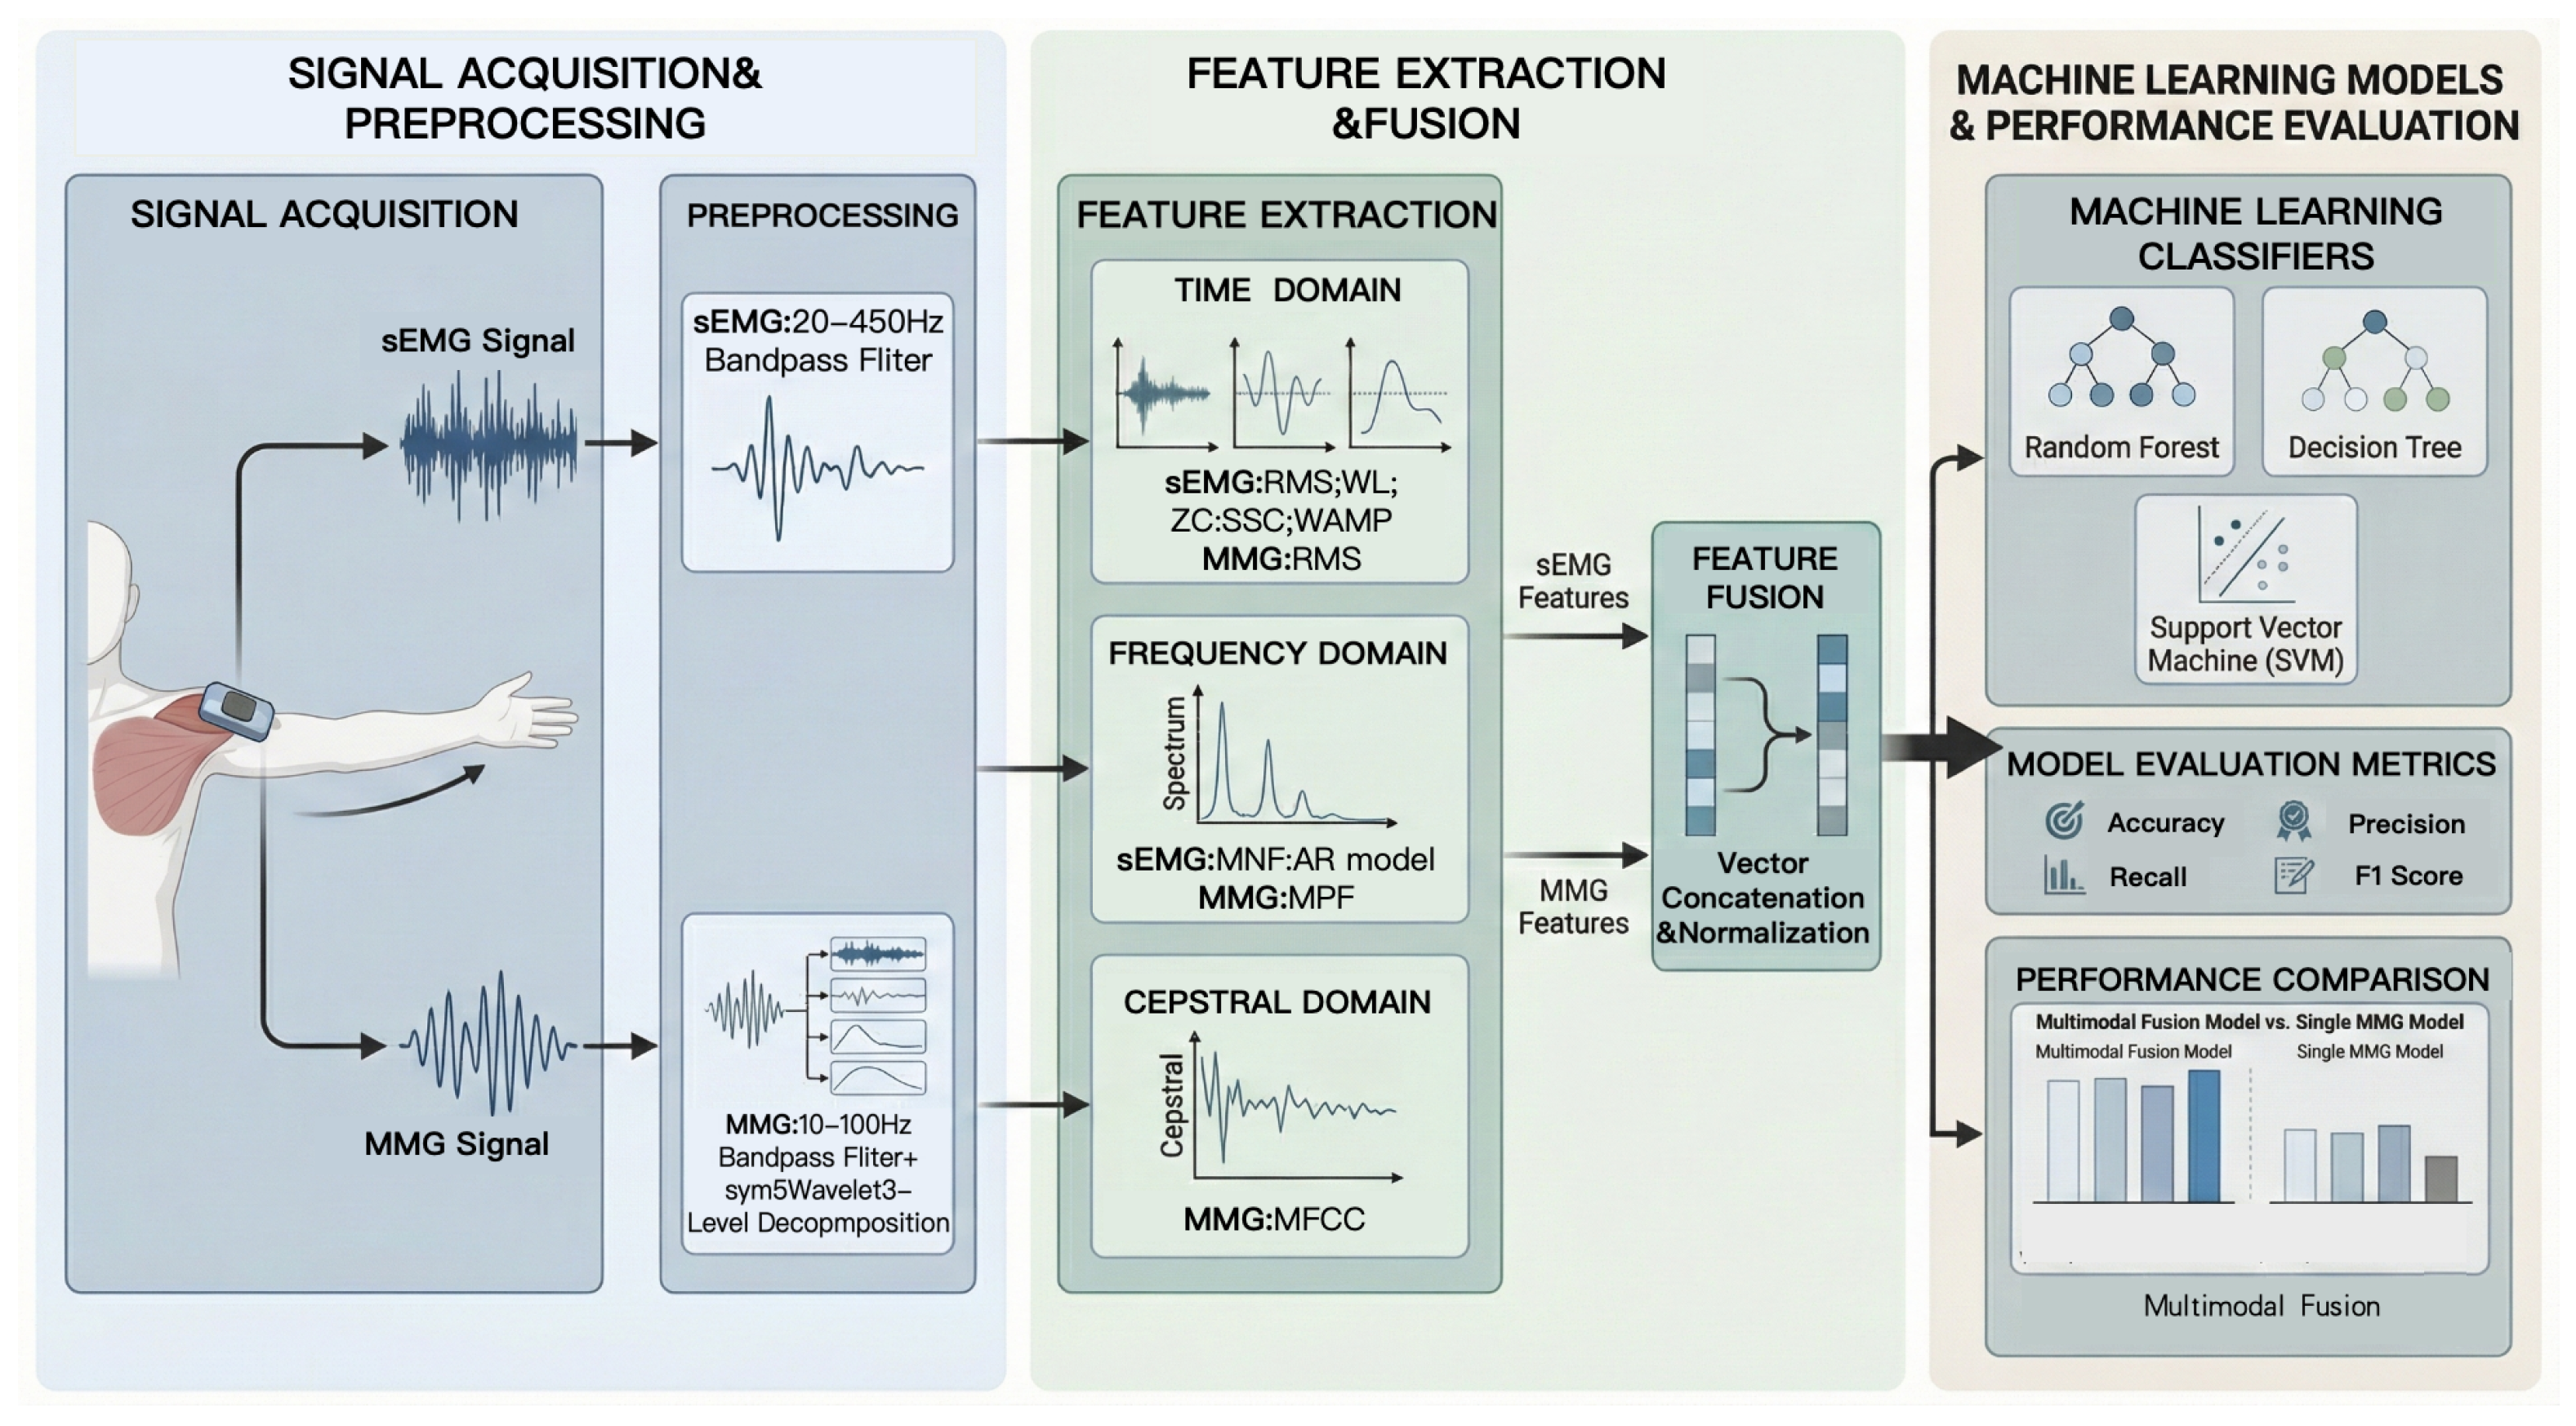
This healthy-volunteer study evaluated whether the feature-level fusion of surface electromyography (sEMG) and mechanomyography (MMG) signals could improve the classification of maximum voluntary contraction (MVC)-normalized shoulder-abduction force levels. Shoulder abduction was selected, because it is relevant to upper-limb function and rehabilitation training and permits controlled loading across relative force levels. The middle deltoid was selected as a major superficial agonist during shoulder abduction and as an accessible site for colocated noninvasive sEMG and MMG acquisition [19,20]. The overall workflow included multimodal signal acquisition, preprocessing, sliding-window feature extraction, feature-level fusion, supervised classification, group-aware validation at the action-trial level, and feature-set ablation (Figure 1).

2.1. Participants

Ten healthy adults were recruited, including six males and four females. All participants were right-handed. Their age, height, and body weight were 24.8 ± 1.9 years, 170.6 ± 8.7 cm, and 68.9 ± 6.4 kg, respectively. None reported upper-limb neuromuscular or musculoskeletal disorders. Participants were instructed to avoid fitness training, resistance exercise, and other activities that imposed substantial upper-limb loading during the week before testing. All participants were informed of the experimental procedure and signed informed consent forms before data collection. Because the experiment involved healthy adults, the labels were interpreted as MVC-normalized force-level categories rather than clinically assigned manual muscle testing (MMT) grades.

2.2. Experimental Protocol and Force-Level Labeling

Participants sat upright with the trunk maintained in a neutral position, and the right upper limb was used as the test side. Before formal acquisition, each participant practiced the shoulder-abduction task under the supervision of a rehabilitation physician. Each repetition began with the upper limb in the neutral position. The participant then abducted the arm while holding the assigned adjustable dumbbell and maintained the abducted posture for 2 s. Each movement was repeated 10 times, and each participant completed three sets. A 2 min rest interval was provided between sets to reduce fatigue-related changes in the signals.
Before formal data collection, each participant completed five shoulder-abduction trials at the maximum load achievable with the adjustable dumbbell. The maximal abducted posture was maintained for 2 s in each trial, and the mean load was used as the individual MVC reference. Target dumbbell loads were then set at approximately 10%, 30%, 60%, and 90% of this reference. These conditions were assigned to Labels 2, 3, 4, and 5, respectively (Table 1). The labels therefore represent four MVC-normalized external-load conditions under a controlled healthy-volunteer protocol and should not be interpreted as direct clinical MMT scores.

2.3. Signal Acquisition and Preprocessing

sEMG and MMG signals were recorded using a custom-developed wearable acquisition device. The sEMG channel used dry bipolar surface electrodes with a center-to-center spacing of 20 mm, an input range of ± 5 mV, a gain of 1000, and input-referred noise of no more than 5 μ V RMS. The MMG channel incorporated an ADXL355 three-axis digital microelectromechanical systems (MEMS) accelerometer (Analog Devices, Inc. Wilmington, MA, USA). According to the manufacturer’s specifications, the ADXL355 supports user-selectable ± 2 g, ± 4 g, and ± 8 g ranges, uses a 20-bit analog-to-digital converter, and has a typical sensitivity of 256,000 LSB/g in the ± 2 g range. In the present protocol, the sEMG and MMG channels were synchronously sampled from the middle deltoid at 1000 Hz using a shared timestamp. The signals were transmitted to a laptop via Bluetooth and subsequently exported for feature extraction and modeling.
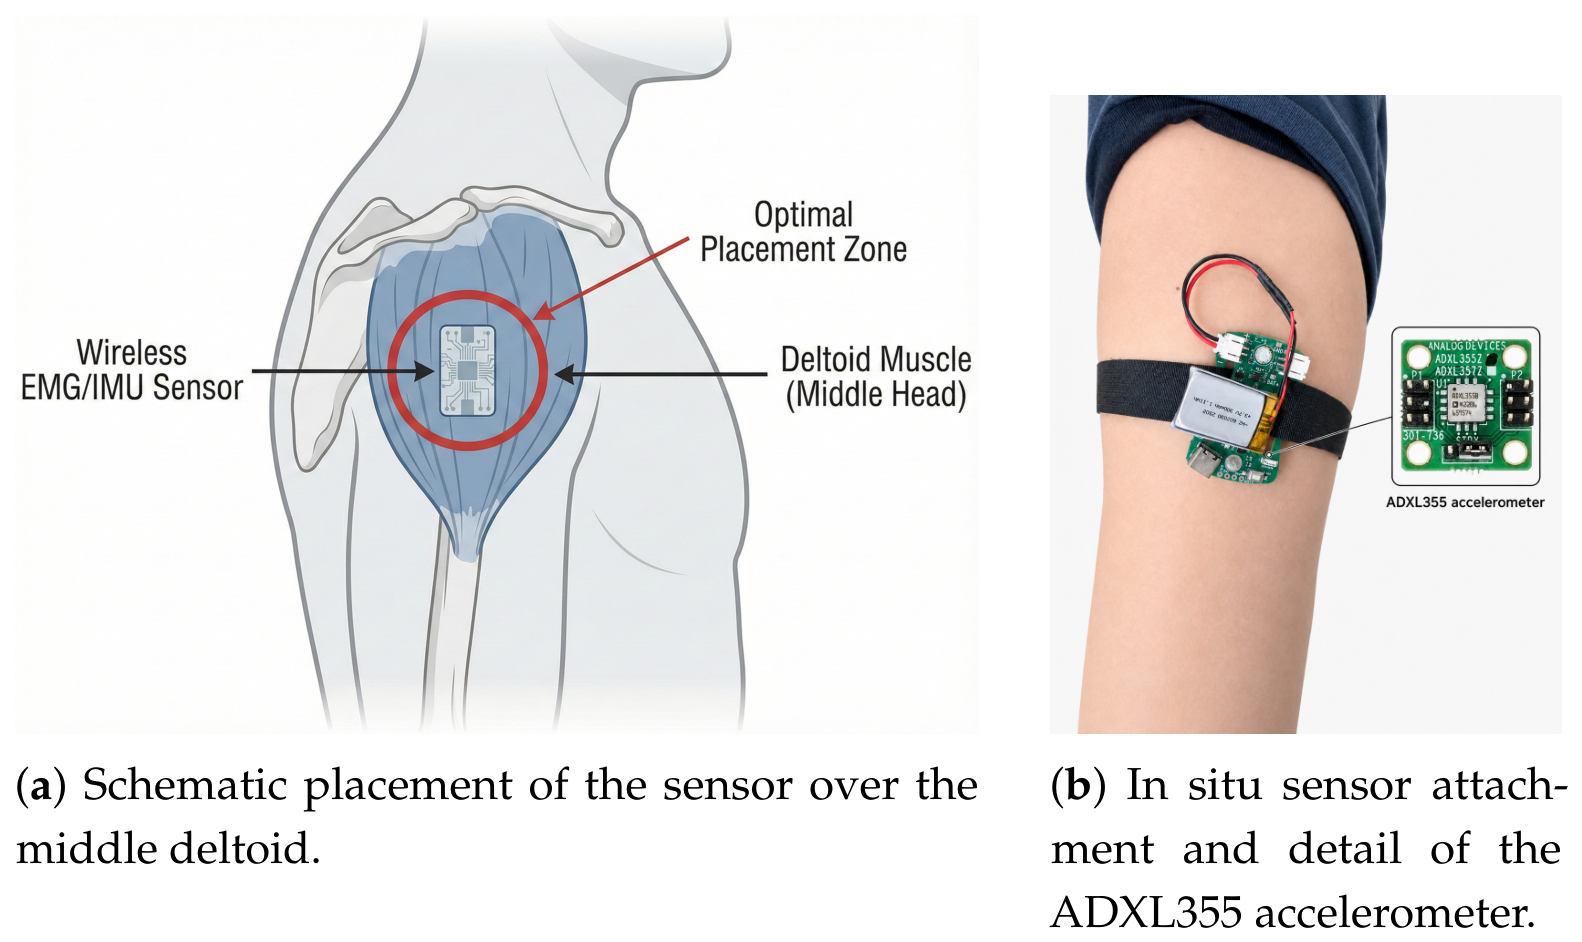
Before sensor placement, the skin surface was cleaned with alcohol wipes to reduce skin impedance. Sensor placement followed the general SENIAM recommendations for the middle deltoid [20]. The sensor was placed near the midpoint between the acromion and the lateral epicondyle of the humerus, and its longitudinal axis was aligned with the muscle-fiber direction (Figure 2).
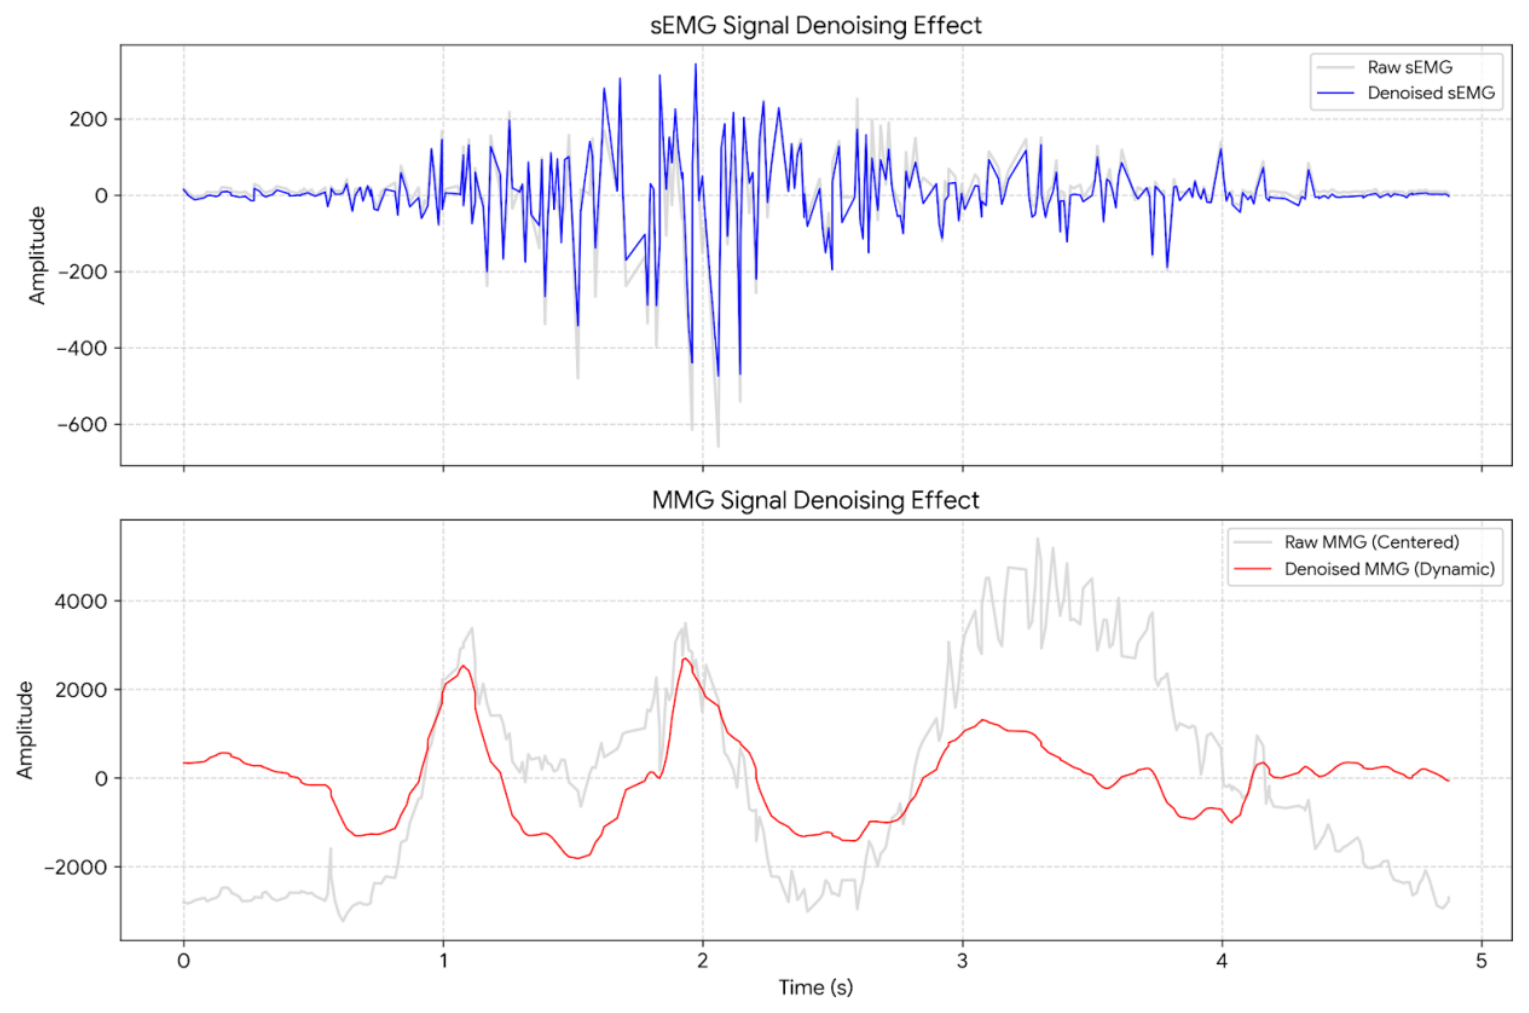
The raw signals were preprocessed before feature extraction. For MMG, a fourth-order Butterworth band-pass filter with cutoff frequencies of 10 and 100 Hz was applied. Wavelet denoising was then performed using the sym5 wavelet basis with level-3 decomposition and soft-thresholding to reduce motion artifacts while retaining mechanical vibration information. For sEMG, a fourth-order Butterworth band-pass filter with cutoff frequencies of 20 and 450 Hz was used. No separate 50-Hz power-line notch filter was applied. Figure 3 shows representative preprocessing results for the sEMG and MMG signals.

2.4. Feature Extraction and Feature-Level Fusion

Preprocessed continuous signals were segmented using a sliding-window strategy. The window length was set to 500 ms, and the stride was set to 150 ms. For each window, the predefined 26-feature set was retained for the main analysis, including 10 sEMG-derived features, 15 MMG-derived features, and one correlation-based fusion feature (Table 2). Three inertial measurement unit (IMU)-derived kinematic features in the feature table were not included, because the present study focused on sEMG-MMG feature-level fusion.
The 10 sEMG-derived features included time-domain energy and complexity features, a frequency-domain feature, and model-based features: root mean square (EMG_RMS), waveform length (EMG_WL), zero crossing (EMG_ZC), slope sign change (EMG_SSC), Willison amplitude (EMG_WAMP), mean frequency (EMG_MNF), and fourth-order autoregressive coefficients (EMG_AR1–EMG_AR4). The 15 MMG-derived features included MMG root mean square (MMG_RMS_Mech), kurtosis (MMG_Kurtosis), mean power frequency (MMG_MPF), and 12 Mel-frequency cepstral coefficients (MMG_MFCC_1–MMG_MFCC_12). The additional Fusion_Corr_MA feature was retained from the predefined feature table as a window-level correlation-based feature designed to represent local sEMG-MMG amplitude coupling.
Feature-level fusion was implemented by concatenating the sEMG-derived, MMG-derived, and correlation-based features into a unified feature vector before model training. Let F sEMG R 10 denote the sEMG feature vector and F MMG R 15 denote the MMG feature vector. The predefined 26-feature fusion vector was defined as
F fusion 26 = [ F sEMG , F MMG , F CorrMA ] R 26 ,
where F CorrMA represents the Fusion_Corr_MA feature. This window-level electromechanical coupling feature was calculated as the Pearson correlation between the time-aligned moving-average amplitude sequences of rectified sEMG and MMG:
F CorrMA = i = 1 n ( u i u ¯ ) ( v i v ¯ ) i = 1 n ( u i u ¯ ) 2 i = 1 n ( v i v ¯ ) 2 ,
where u i = MA ( | x sEMG , i | ) and v i = MA ( | x MMG , i | ) denote the paired moving-average amplitude sequences within the same 500 ms analysis window. The feature was intended to summarize local covariation between electrical activation and mechanical vibration. For scale-sensitive models, including LR, KNN, SVM-RBF, and MLP, z-score standardization was fitted only on the training folds and then applied to the corresponding validation folds. Tree-based models were trained using the extracted feature values directly.

2.5. Feature-Set Ablation Design

To examine whether the performance gain was attributable to multimodal fusion rather than a single signal source, four feature sets were compared in the ablation analysis (Table 3). The main feature set was the predefined 26-feature fusion set used in the main analysis. The 25-feature sEMG+MMG set was additionally analyzed to examine whether the correlation-based fusion feature changed model performance beyond direct concatenation of sEMG and MMG features.

2.6. Classification Models

Eight representative supervised classifiers were evaluated to compare the performance of the feature-level fusion strategy: logistic regression (LR), k-nearest neighbors (KNN), decision tree (DT), support vector machine with radial basis function kernel (SVM-RBF), random forest (RF), extremely randomized trees (ET), histogram-based gradient boosting decision tree (HGBDT), and multi-layer perceptron (MLP). These models were selected to cover linear, distance-based, single-tree, margin-based, bagging ensemble, randomized-tree ensemble, boosting ensemble, and shallow neural-network classifiers.
Hyperparameters were selected empirically through repeated preliminary comparisons before the formal evaluation. The selected parameter set was then held fixed across all five cross-validation folds.
LR was implemented with L2 regularization, C = 1.0 , class-balanced weighting, and a maximum of 5000 iterations. KNN used seven neighbors with distance weighting. DT used the Gini criterion with class-balanced weighting. SVM-RBF used C = 10 , gamma set to “scale”, and class-balanced weighting. RF and ET each used 100 trees, class-balanced weighting, and unrestricted maximum depth. HGBDT was configured with 120 boosting iterations, a learning rate of 0.05, 31 maximum leaf nodes, L2 regularization of 0.01, and early stopping. MLP used two hidden layers with 64 and 32 neurons, rectified linear unit activation, Adam optimization, L2 regularization coefficient of 0.001, adaptive learning rate, and early stopping. The random seed was set to 42 for reproducibility when applicable.

2.7. Validation Strategy and Performance Metrics

Because the feature samples were generated from overlapping sliding windows, random row-level splitting could overestimate the classification performance by placing highly correlated neighboring windows in both training and validation sets. Therefore, group-aware cross-validation at the action-trial level was used as the primary validation strategy. The action-trial identifier was retained from the analysis feature table, and all windows from the same action trial were assigned to the same fold. Five folds were used. This design evaluated recognition of unseen action trials and reduced leakage between neighboring windows. It did not ensure that all trials from one participant were restricted to a single fold.
For each fold, models were trained on the training action-trial groups and evaluated on unseen action-trial groups. The performance was summarized using accuracy, balanced accuracy, macro-precision, macro-recall, macro-F1, weighted-F1, linear weighted Cohen’s kappa, quadratic weighted Cohen’s kappa (QWK), mean absolute grade error (MAE), and within-one-grade accuracy. Weighted kappa and MAE were included, because the target labels represented ordered force-level categories. Within-one-grade accuracy was defined as the proportion of samples for which the absolute difference between the predicted and true labels was no greater than 1.


3. Results

3.1. Analysis Dataset and Label Distribution

After sliding-window segmentation and feature extraction, the analysis feature table contained 12,231 window-level samples from 30 action-trial groups. Four MVC-normalized force-level labels were included. Label 2 accounted for 2825 samples (23.10%), Label 3 for 2387 samples (19.52%), Label 4 for 3403 samples (27.82%), and Label 5 for 3616 samples (29.56%). The dataset structure is summarized in Table 4.

3.2. Comparison of Eight Classifiers Using the Predefined 26-Feature Fusion Set

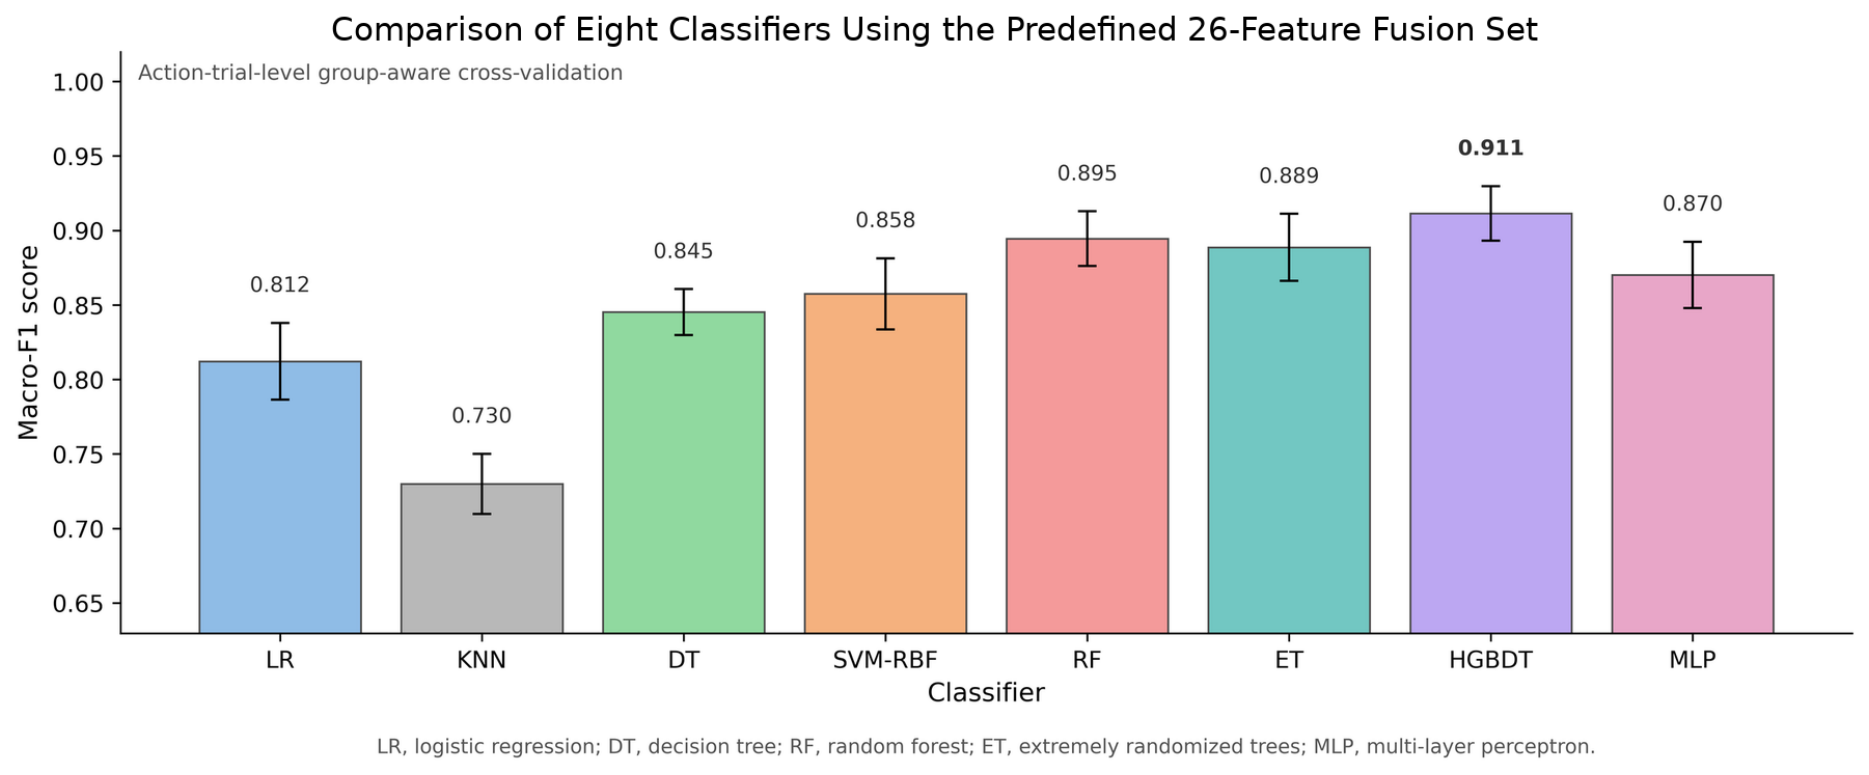
Using the predefined 26-feature fusion set, HGBDT achieved the best overall performance among the eight evaluated classifiers (Table 5 and Figure 4). Under group-aware cross-validation at the action-trial level, HGBDT achieved an accuracy of 0.904 ± 0.023 , balanced accuracy of 0.912 ± 0.017 , macro-F1 score of 0.911 ± 0.018 , QWK of 0.910 ± 0.038 , and MAE of 0.137 ± 0.042 . RF and ET achieved the next best performances, with macro-F1 scores of 0.895 ± 0.018 and 0.889 ± 0.023 , respectively. MLP achieved a macro-F1 score of 0.870 ± 0.022 , followed by SVM-RBF, DT, LR, and KNN.
The results suggest that the nonlinear ensemble models were more suitable for capturing the electromechanical feature interactions between sEMG and MMG signals than linear or distance-based baselines. HGBDT was therefore selected as the main classifier for subsequent feature-set ablation analysis and confusion-matrix evaluation.

3.3. Ablation Analysis of Single-Modality and Fusion Feature Sets

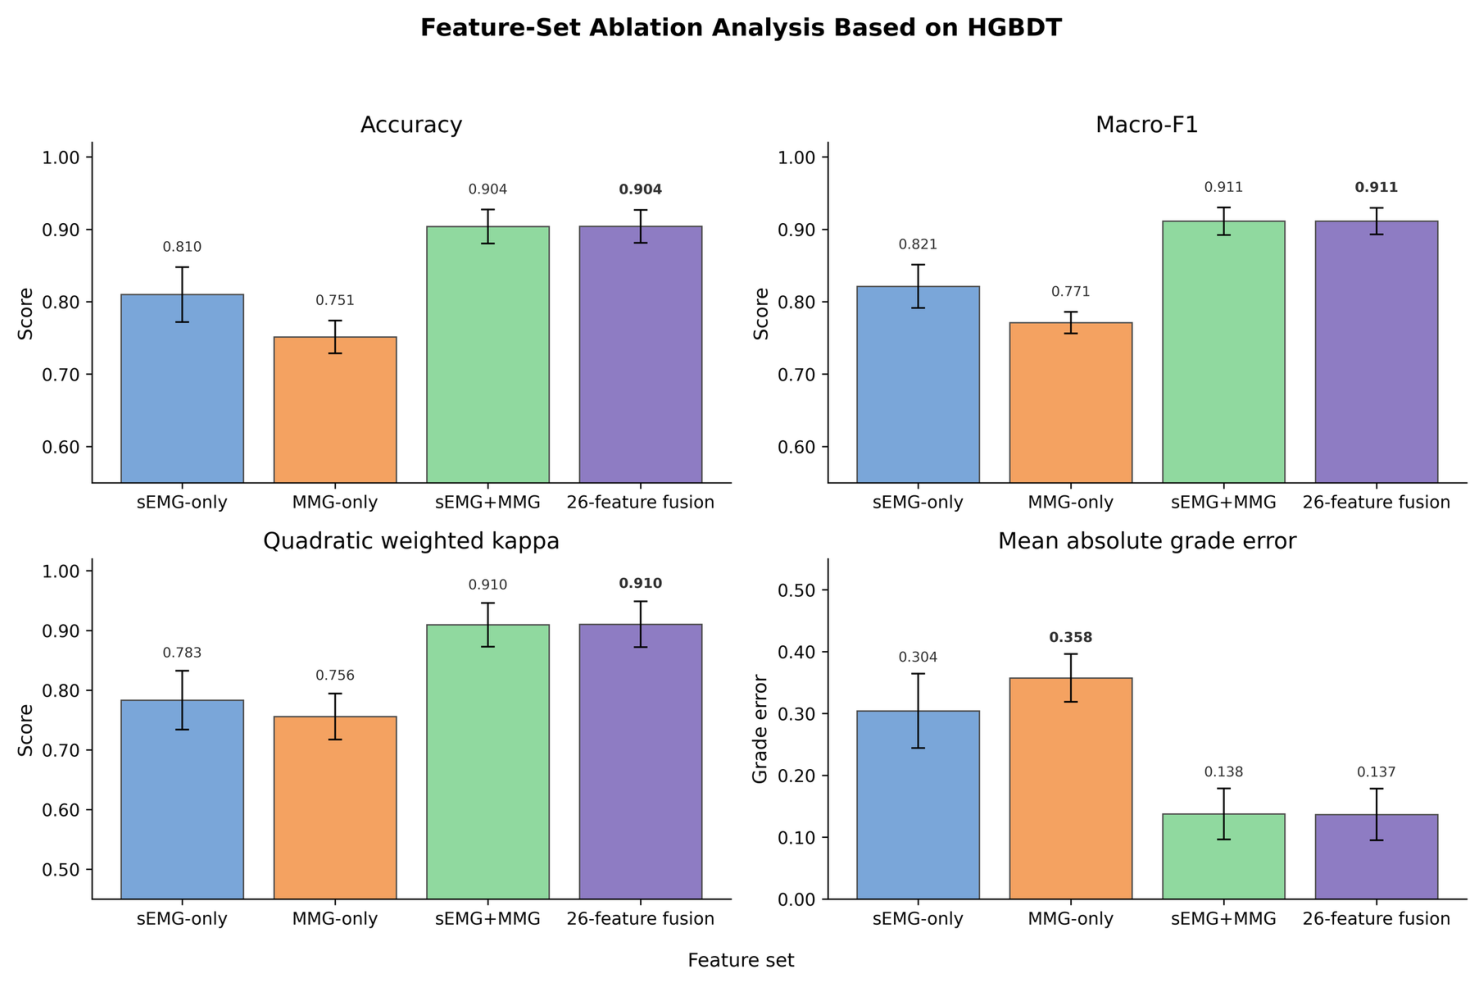
The ablation analysis showed that multimodal feature fusion improved the force-level classification compared with either single-modality input (Table 6 and Figure 5). Using HGBDT as the main classifier, the sEMG-only feature set achieved a macro-F1 score of 0.821 ± 0.030 , whereas the MMG-only feature set achieved a macro-F1 score of 0.771 ± 0.015 . Direct concatenation of sEMG and MMG features increased the macro-F1 score to 0.911 ± 0.019 . The predefined 26-feature fusion set, which additionally included Fusion_Corr_MA, achieved a macro-F1 score of 0.911 ± 0.018 , a QWK of 0.910 ± 0.038 , and an MAE of 0.137 ± 0.042 .
The improvement in macro-F1 of the predefined 26-feature fusion set was approximately 0.090 over the sEMG-only feature set and approximately 0.140 over the MMG-only feature set. The 25-feature sEMG+MMG set and the predefined 26-feature set showed nearly identical macro-F1 values, indicating that the main performance gain was associated to the complementary integration of sEMG-derived and MMG-derived features rather than to the correlation-based fusion feature alone.

3.4. Confusion Matrix and Per-Class Performance of the 26-Feature HGBDT Model

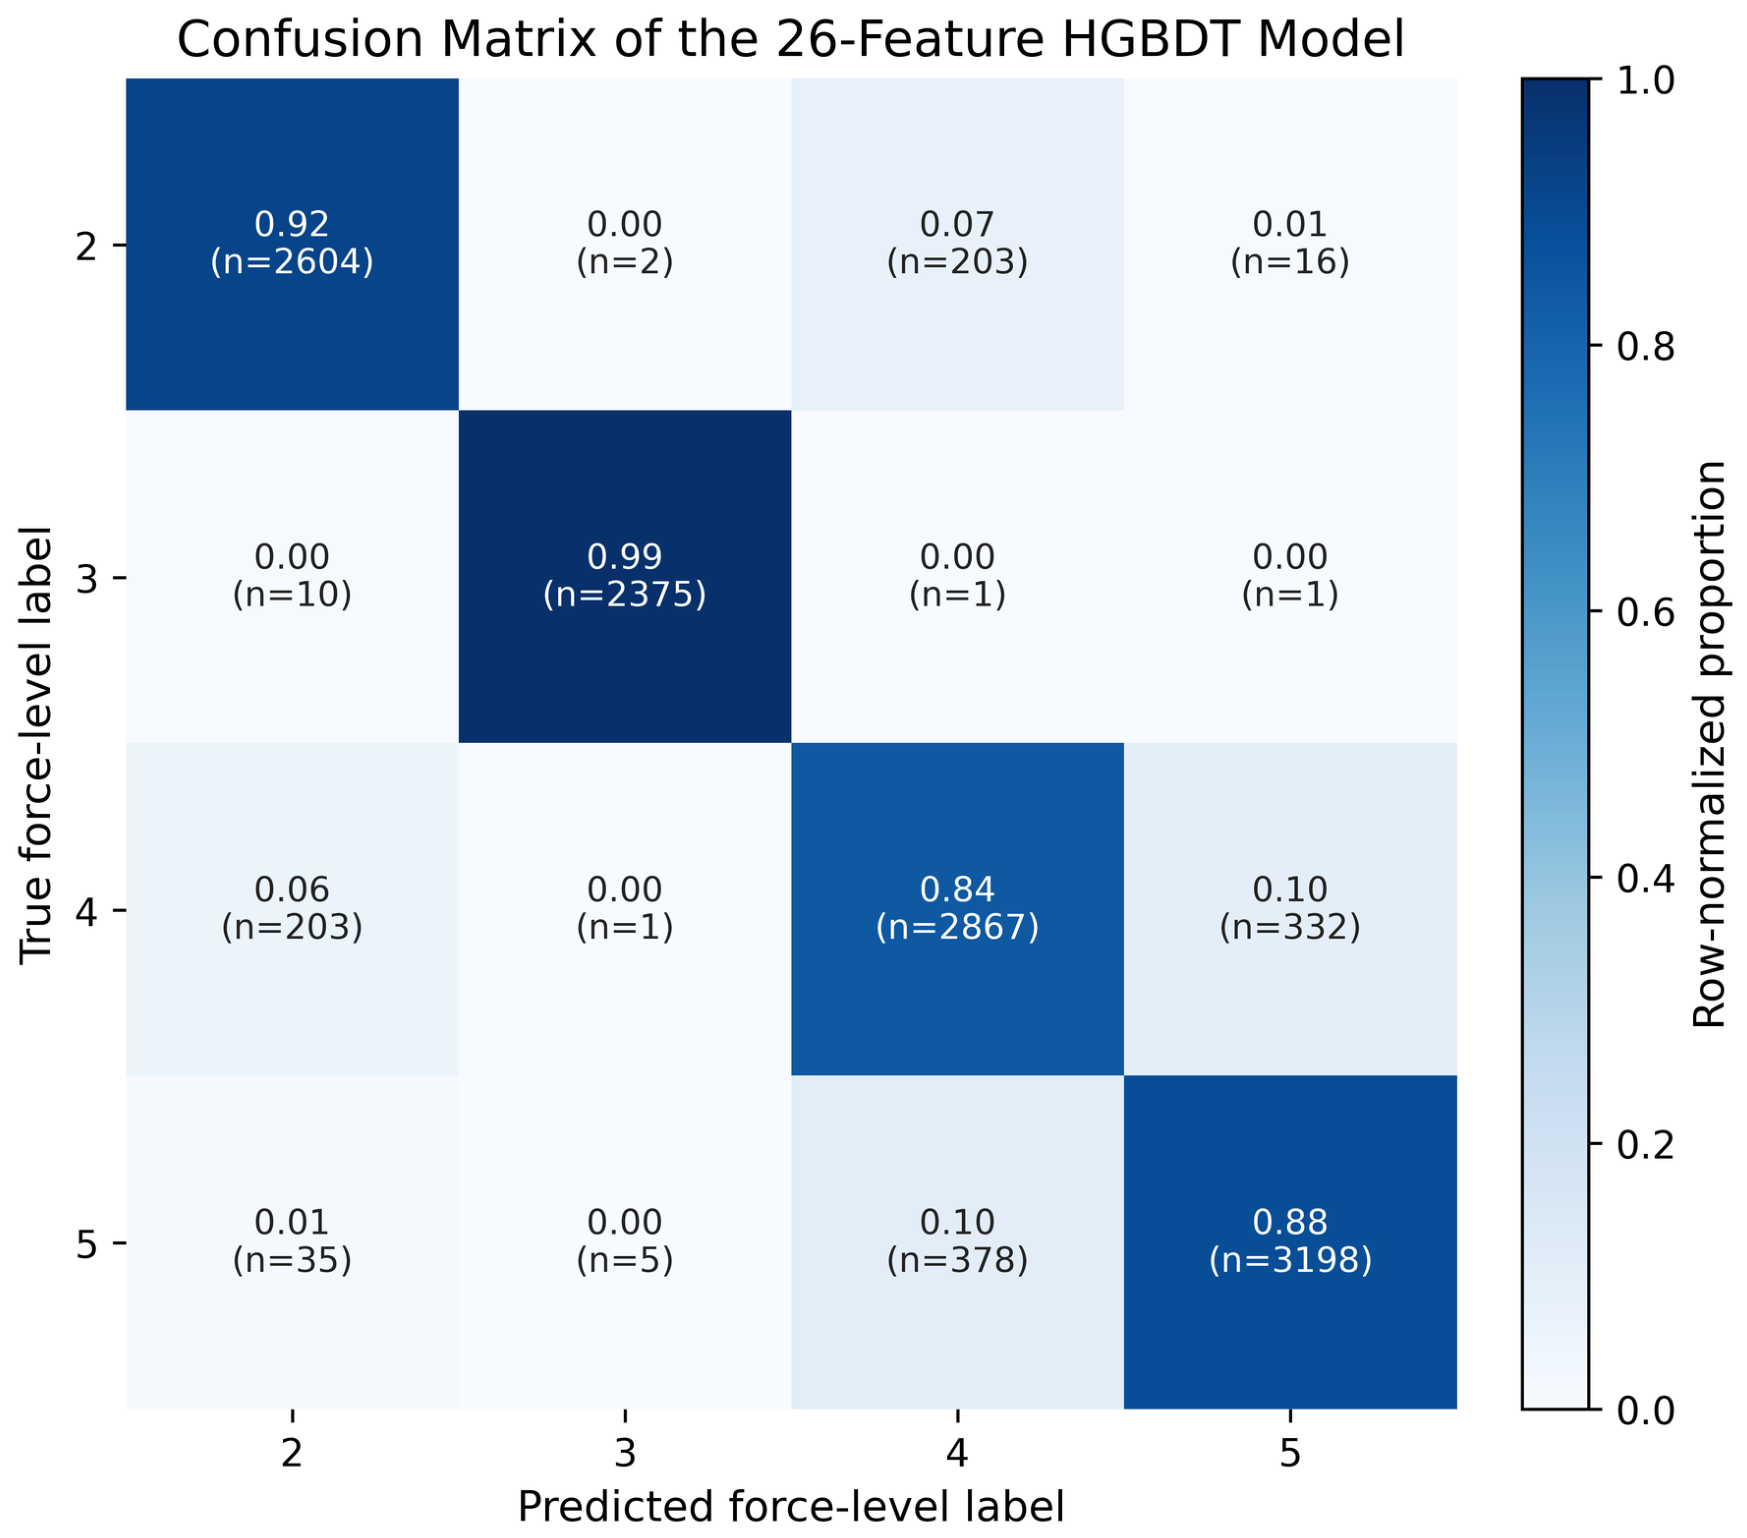
Out-of-fold predictions from the 26-feature HGBDT model were used to generate the confusion matrix and per-class performance results (Figure 6 and Table 7). The overall out-of-fold accuracy was 0.903, the balanced accuracy was 0.911, the macro-F1 score was 0.911, the QWK was 0.910, and the MAE was 0.139. The within-one-grade accuracy was 0.962, indicating that most prediction errors were within one force-level category.
Label 3 showed the highest classification stability, with a precision of 0.997, a recall of 0.995, and an F1 score of 0.996. Label 4 showed the lowest F1 score among the four labels (0.837), reflecting higher overlap between moderate-to-high and high force-level signal patterns. In the normalized confusion matrix, 9.84% of Label 4 samples were predicted as Label 5, and 10.45% of Label 5 samples were predicted as Label 4. In addition, 7.22% of Label 2 samples were predicted as Label 4, and 5.99% of Label 4 samples were predicted as Label 2. These findings suggest that the force-level separability was not uniform across labels, with the main classification difficulty concentrated around intermediate-to-high force levels and selected cross-level overlaps.

3.5. Feature-Importance Analysis

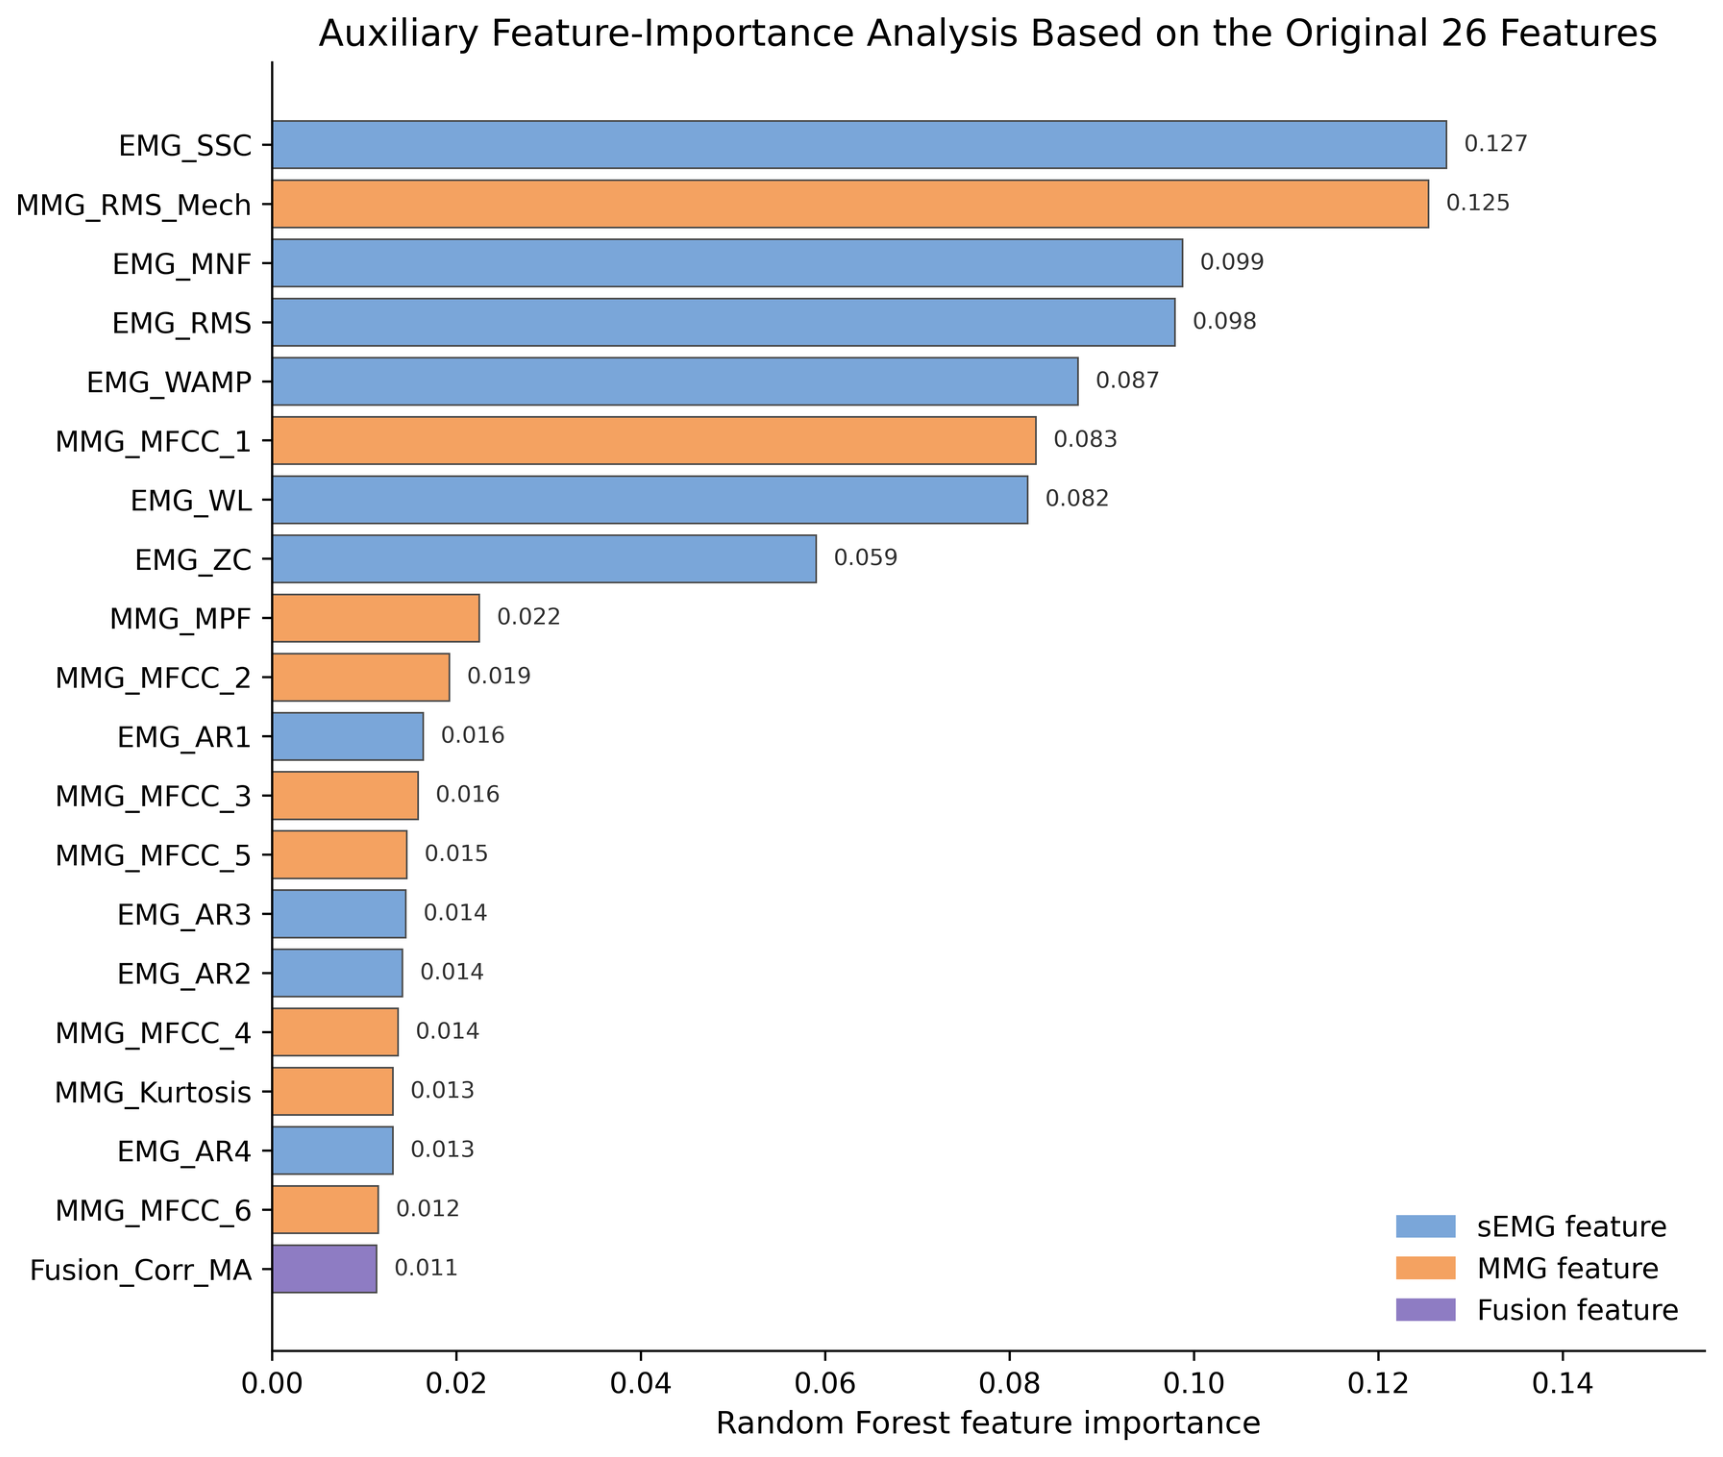
An RF-based feature-importance analysis was performed to explore the relative contribution of the predefined 26 features (Figure 7). This analysis was used only for feature interpretation and was not used to select the best classifier. The highest-ranked features included EMG_SSC (importance, 0.127), MMG_RMS_Mech (0.125), EMG_MNF (0.099), EMG_RMS (0.098), EMG_WAMP (0.087), MMG_MFCC_1 (0.083), and EMG_WL (0.082). These results indicate that both sEMG-derived and MMG-derived features contributed to force-level classification. The correlation-based Fusion_Corr_MA feature contributed modestly (0.011), further supporting that the main performance gain was primarily driven by the combined use of sEMG-derived and MMG-derived information.

4. Discussion

4.1. Principal Findings

The principal finding was that sEMG-MMG feature fusion outperformed either modality alone for four-level MVC-normalized shoulder-abduction classification under action-trial-level validation. The ablation results indicate that the improvement arose mainly from combining electrical and mechanical feature families [7,11]. Adding Fusion_Corr_MA to the directly concatenated feature set produced only a marginal numerical change. This feature should therefore be interpreted as an exploratory coupling variable rather than a major source of the observed performance gain.

4.2. Relation to Previous Wearable-Sensing Studies

Related studies have addressed different but complementary sensing targets. Correa et al. examined EMG and accelerometer-derived MMG responses during upper-limb contractions and load lifting, focusing on the signal sensitivity across loading conditions rather than force-level classification [11]. Bai et al. fused biosignals to estimate continuous shoulder and elbow rotational acceleration [13], whereas Wang et al. combined sEMG and joint-motion data for regression-based shoulder-strength assessment [21]. In contrast, the present study classifies four ordered MVC-normalized shoulder-abduction force levels and explicitly evaluates sEMG-only, MMG-only, and fused feature sets; because the tasks and validation designs differ, the reported performance values should not be compared directly.

4.3. Physiological Interpretation and Error Pattern

The higher performance of the fused feature set is physiologically plausible because sEMG and MMG reflect related but distinct aspects of voluntary muscle contraction [7,11]. sEMG features describe electrical activation, waveform complexity, and frequency-related changes, whereas the MMG features capture muscle-surface vibration and mechanical oscillation [5,8]. EMG_SSC and MMG_RMS_Mech were the two highest-ranked RF features. MMG_RMS_Mech summarizes the overall amplitude of muscle-surface vibration and may vary with fiber contraction, motor-unit recruitment, muscle stiffness, and transmission through superficial tissue. EMG_SSC quantifies the changes in waveform-slope direction and therefore reflects the complexity and frequency-related content of electrical activation. Their joint prominence supports a complementary, rather than competing, interpretation of electrical and mechanical information.
The force-level separability was not uniform. Label 3 had the fewest samples but the highest class-specific performance, making class frequency an unlikely sole explanation for its stability. Under this controlled protocol, the approximately 30% MVC condition may have produced a comparatively consistent electromechanical pattern. In contrast, some 10% MVC windows were classified as 60% MVC. Low-intensity sEMG has a smaller amplitude and may be more susceptible to baseline noise, electrode-contact variation, and inter-individual differences. Accelerometer-derived MMG may also contain soft-tissue vibration and small movement-related components. Moreover, sEMG amplitude does not remain strictly proportional to the external load across contraction intensities. These factors may cause a partial overlap between Labels 2 and 4 in the fused feature space. This interpretation is hypothesis-generating, because the present experiment was not designed to isolate the contribution of each factor [22,23].
The four force levels were inspired by the ordered logic of clinical manual muscle testing, but they were defined operationally as 10%, 30%, 60%, and 90% MVC-normalized loads. With future comparison against clinical scales and validation in patient cohorts, this approach may provide a more objective and repeatedly measurable sensor-assisted complement to ordinal strength assessment. The present labels should not be interpreted as equivalent to physician-assigned MMT grades [3,4].

4.4. Strengths, Limitations, and Future Work

A strength of this study is the combined use of an eight-classifier benchmark, feature-set ablation, ordinal metrics, and action-trial-level grouped validation [18,24]. Grouping overlapping windows by action trial reduced an important source of information leakage [17,18]. However, several limitations remain. First, only 10 healthy adults were included. The observed 90.4% accuracy is therefore an internal performance estimate for unseen action trials within this cohort and not evidence that the same accuracy will be maintained in new participants.
Second, demographic information was available for cohort description, but the de-identified window-level feature table used for modeling did not retain explicit participant identifiers. Consequently, trials from the same participant could occur in different folds, and leave-one-subject-out validation could not be performed. Subject-independent generalization requires a dataset that preserves participant-level grouping and an external cohort.
Third, the findings cannot be generalized directly to neurological patients. Weakness may reduce sEMG amplitude and MMG vibration energy, whereas spasticity may increase background activity or involuntary bursts. Abnormal synergies and cocontraction may increase the overlap between force-level distributions, and compensatory recruitment may alter the temporal and spatial patterns captured at the middle deltoid [1,2]. Dynamic and multi-angle rehabilitation movements may introduce additional kinematic and motion-related variability.
Fourth, the labels were not validated against physician-assigned MMT, handheld dynamometry, or standardized upper-limb functional scales [3,21]. Fifth, the analysis used offline feature extraction and model evaluation; so, real-time performance on wearable or embedded hardware remains untested. Finally, no separate power-line notch filter was applied, and the potential influence of residual 50-Hz interference on sEMG features cannot be excluded. Future work should preserve subject identifiers, evaluate independent participants and neurological cohorts, compare predictions with external strength measures, and test dynamic tasks and real-time deployment [6,25,26,27,28,29,30].

5. Conclusions

Feature-level fusion of sEMG and MMG improved MVC-normalized shoulder-abduction force-level classification in this healthy-adult cohort. HGBDT achieved the best internal action-trial-level performance among the eight evaluated classifiers, and the ablation analysis attributed the main gain to combining electrical and mechanical feature families. These findings support the complementary value of sEMG and MMG for sensor-based force assessment under controlled conditions. Subject-independent, patient-level, and external validation is required before clinical rehabilitation use.

Author Contributions

Conceptualization, C.Z., Y.G. and D.C.; methodology, C.Z., Y.G. and D.C.; software, C.Z. and Y.G.; validation, Y.G., X.G. and Q.W.; formal analysis, C.Z. and Y.G.; investigation, C.Z., Y.G. and J.Y. (Junyu Yao); resources, X.H. and J.Y. (Jun Yi); data curation, C.Z. and Y.G.; writing—original draft preparation, C.Z. and Y.G.; writing—review and editing, D.C., X.H. and J.Y. (Jun Yi); visualization, C.Z. and J.Y. (Junyu Yao); supervision, D.C., X.H. and J.Y. (Jun Yi); project administration, X.H.; funding acquisition, X.H. and J.Y. (Jun Yi). All authors have read and agreed to the published version of the manuscript.

Funding

This research was funded by the Guangdong Provincial Higher Education Teaching Reform Project, grant number 2024-556; the Guangzhou University of Chinese Medicine Big Data Research Center Platform Project, grant number A1-2601-25-439-127Z102; and the 2026 “Jiebang Guashuai” Project of the School of Medical Informatics Engineering, Guangzhou University of Chinese Medicine.

Institutional Review Board Statement

The study was conducted in accordance with the Declaration of Helsinki and approved by the Human Medical Experiment Ethics Committee of Guangdong Hospital of Traditional Chinese Medicine (approval number YE2024-245-01).

Informed Consent Statement

Informed consent was obtained from all subjects involved in the study.

Data Availability Statement

The data presented in this study are available from the corresponding author upon reasonable request. The data are not publicly available because they contain participant-level physiological signal records and consent-limited information.

Acknowledgments

The authors thank all volunteers who participated in the experiment.

Conflicts of Interest

The authors declare no conflicts of interest. The funders had no role in the design of the study; in the collection, analysis, or interpretation of data; in the writing of the manuscript; or in the decision to submit the results for publication.

References

  1. O’Flaherty, D.; Ali, K. Recommendations for Upper Limb Motor Recovery: An Overview of the UK and European Rehabilitation after Stroke Guidelines (2023). Healthcare 2024, 12, 1433. [Google Scholar] [CrossRef] [Scilit]
  2. Tang, Q.; Yang, X.; Sun, M.; He, M.; Sa, R.; Zhang, K.; Zhu, B.; Li, T. Research trends and hotspots of post-stroke upper limb dysfunction: A bibliometric and visualization analysis. Front. Neurol. 2024, 15, 1449729. [Google Scholar] [CrossRef] [Scilit]
  3. Naqvi, U.; Margetis, K.; Sherman, A.L. Muscle Strength Grading; StatPearls [Internet]; StatPearls Publishing: Treasure Island, FL, USA, 2025. [Google Scholar]
  4. Fan, E.; Ciesla, N.D.; Truong, A.D.; Bhoopathi, V.; Zeger, S.L.; Needham, D.M. Inter-rater reliability of manual muscle strength testing in ICU survivors and simulated patients. Intensive Care Med. 2010, 36, 1038–1043. [Google Scholar] [CrossRef] [Scilit] [PubMed]
  5. Kimoto, A.; Fujiyama, H.; Machida, M. A Wireless Multi-Layered EMG/MMG/NIRS Sensor for Muscular Activity Evaluation. Sensors 2023, 23, 1539. [Google Scholar] [CrossRef] [Scilit] [PubMed]
  6. Yan, L.; Long, Z.; Qian, J.; Lin, J.; Xie, S.Q.; Sheng, B. Rehabilitation Assessment System for Stroke Patients Based on Fusion-Type Optoelectronic Plethysmography Device and Multi-Modality Fusion Model: Design and Validation. Sensors 2024, 24, 2925. [Google Scholar] [CrossRef] [Scilit] [PubMed]
  7. Clancy, E.A.; Morin, E.L.; Hajian, G.; Merletti, R. Tutorial. Surface electromyogram (sEMG) amplitude estimation: Best practices. J. Electromyogr. Kinesiol. 2023, 72, 102807. [Google Scholar] [CrossRef] [Scilit] [PubMed]
  8. Boyer, M.; Bouyer, L.J.; Roy, J.S.; Campeau-Lecours, A. Reducing Noise, Artifacts and Interference in Single-Channel EMG Signals: A Review. Sensors 2023, 23, 2927. [Google Scholar] [CrossRef] [Scilit] [PubMed]
  9. Carvalho, C.R.; Fernández, J.M.; Del-Ama, A.J.; Barroso, F.O.; Moreno, J.C. Review of electromyography onset detection methods for real-time control of robotic exoskeletons. J. Neuroeng. Rehabil. 2023, 20, 141. [Google Scholar] [CrossRef] [Scilit] [PubMed]
  10. Bedoy, E.H.; Guirola Diaz, E.A.; Dalrymple, A.N.; Levy, I.; Hyatt, T.; Griffin, D.M.; Wittenberg, G.F.; Weber, D.J. Improving localization and measurements of M-waves using high-density surface electromyography. J. Neurophysiol. 2025, 133, 299–309. [Google Scholar] [CrossRef] [Scilit] [PubMed]
  11. Correa, M.; Projetti, M.; Siegler, I.A.; Vignais, N. Mechanomyographic Analysis for Muscle Activity Assessment during a Load-Lifting Task. Sensors 2023, 23, 7969. [Google Scholar] [CrossRef] [Scilit] [PubMed]
  12. Li, Z.; Gao, L.; Lu, W.; Wang, D.; Cao, H.; Zhang, G. Estimation of Knee Extension Force Using Mechanomyography Signals Based on GRA and ICS-SVR. Sensors 2022, 22, 4651. [Google Scholar] [CrossRef] [Scilit] [PubMed]
  13. Bai, Y.; Guan, X.; He, L.; Wang, Z.; Li, Z.; Zhu, M. Estimating Rotational Acceleration in Shoulder and Elbow Joints Using a Transformer Algorithm and a Fusion of Biosignals. Sensors 2024, 24, 1726. [Google Scholar] [CrossRef] [Scilit] [PubMed]
  14. Hwang, S.; Kwon, N.; Lee, D.; Kim, J.; Yang, S.; Youn, I.; Moon, H.J.; Sung, J.K.; Han, S. A Multimodal Fatigue Detection System Using sEMG and IMU Signals with a Hybrid CNN-LSTM-Attention Model. Sensors 2025, 25, 3309. [Google Scholar] [CrossRef] [Scilit] [PubMed]
  15. Bai, A.; Song, H.; Wu, Y.; Dong, S.; Feng, G.; Jin, H. Sliding-Window CNN + Channel-Time Attention Transformer Network Trained with Inertial Measurement Units and Surface Electromyography Data for the Prediction of Muscle Activation and Motion Dynamics Leveraging IMU-Only Wearables for Home-Based Shoulder Rehabilitation. Sensors 2025, 25, 1275. [Google Scholar] [CrossRef] [Scilit] [PubMed]
  16. Wang, Z.; Guan, X.; Li, D.; Jiang, C.; Bai, Y.; Yang, D.; He, L. Study on Muscle Fatigue Classification for Manual Lifting by Fusing sEMG and MMG Signals. Sensors 2025, 25, 5023. [Google Scholar] [CrossRef] [Scilit] [PubMed]
  17. Chan, H.T.J.; Šimić, I.; Veas, E. Explainability and importance estimate of time series classifier via embedded neural network. Sci. Rep. 2025, 15, 34515. [Google Scholar] [CrossRef] [Scilit] [PubMed]
  18. Alturayeif, N.; Hassine, J. Data leakage detection in machine learning code: Transfer learning, active learning, or low-shot prompting? PeerJ Comput. Sci. 2025, 11, e2730. [Google Scholar] [CrossRef] [Scilit] [PubMed]
  19. Wickham, J.; Pizzari, T.; Stansfeld, K.; Burnside, A.; Watson, L. Quantifying “normal” shoulder muscle activity during abduction. J. Electromyogr. Kinesiol. 2010, 20, 212–222. [Google Scholar] [CrossRef] [Scilit] [PubMed]
  20. SENIAM. Recommendations for Sensor Locations and Placement Procedures. Surface ElectroMyoGraphy for the Non-Invasive Assessment of Muscles. 2026. Available online: http://www.seniam.org (accessed on 19 June 2026).
  21. Wang, S.; Lai, W.; Zhang, Y.; Yao, J.; Gou, X.; Ye, H.; Yi, J.; Cao, D. Design of upper limb muscle strength assessment system based on surface electromyography signals and joint motion. Front. Neurol. 2024, 15, 1470759. [Google Scholar] [CrossRef] [Scilit] [PubMed]
  22. Oliveira, J.H.; Gomes, J.S.; Bauer, P.; Pezarat-Correia, P.; Vaz, J.R. Force fluctuations regulation and the role of neurophysiological mechanisms throughout different isometric contraction intensities. Sci. Rep. 2025, 15, 28442. [Google Scholar] [CrossRef] [Scilit] [PubMed]
  23. Rossato, J.; Avrillon, S.; Tucker, K.; Farina, D.; Hug, F. The volitional control of individual motor units is constrained within low-dimensional neural manifolds by common inputs. J. Neurosci. 2024, 44, e0702242024. [Google Scholar] [CrossRef] [Scilit] [PubMed]
  24. Rainio, O.; Teuho, J.; Klén, R. Evaluation metrics and statistical tests for machine learning. Sci. Rep. 2024, 14, 6086. [Google Scholar] [CrossRef] [Scilit] [PubMed]
  25. Zhou, W.; Fu, D.; Duan, Z.; Wang, J.; Zhou, L.; Guo, L. Achieving precision assessment of functional clinical scores for upper extremity using IMU-Based wearable devices and deep learning methods. J. Neuroeng. Rehabil. 2025, 22, 84. [Google Scholar] [CrossRef] [Scilit] [PubMed]
  26. Wang, S.; Wu, X.; Lai, W.; Yao, J.; Gou, X.; Ye, H.; Yi, J.; Cao, D. Rehabilitation evaluation method and application for upper limb post-stroke based on improved DTW. Biomed. Signal Process. Control 2025, 106, 107775. [Google Scholar] [CrossRef] [Scilit]
  27. Jin, Y.; Alvarez, J.T.; Suitor, E.L.; Swaminathan, K.; Chin, A.; Civici, U.S.; Nuckols, R.W.; Howe, R.D.; Walsh, C.J. Estimation of joint torque in dynamic activities using wearable A-mode ultrasound. Nat. Commun. 2024, 15, 5756. [Google Scholar] [CrossRef] [Scilit] [PubMed]
  28. Favata, A.; Gallart-Agut, R.; van Noort, L.; Exposito-Escudero, J.; Medina-Cantillo, J.; Torras, C.; Natera-de Benito, D.; Font-Llagunes, J.M.; Pàmies-Vilà, R. IMU-based kinematic analysis to enhance upper limb motor function assessment in neuromuscular diseases. J. Neuroeng. Rehabil. 2025, 22, 63. [Google Scholar] [CrossRef] [Scilit] [PubMed]
  29. Zhang, T.; Guo, H.; Yan, S.; Weng, D.; Wang, J.; Zhang, H. FatigueFormer: Static-Temporal Feature Fusion for Robust sEMG-Based Muscle Fatigue Recognition. arXiv 2026, arXiv:2603.26841. [Google Scholar]
  30. Wang, R.; Zhu, X.; Chen, A.; Xu, J.; Winterbottom, L.; Nilsen, D.M.; Stein, J.; Ciocarlie, M. ReactEMG: Zero-Shot, Low-Latency Intent Detection via sEMG. arXiv 2025, arXiv:2506.19815. [Google Scholar]
Figure 1. Overall workflow for multimodal signal acquisition, preprocessing, feature extraction, feature-level fusion, machine-learning classification, and performance evaluation.
Sensors 26 04351 g001
Figure 2. Sensor placement and hardware used for shoulder-abduction signal acquisition. The schematic shows the recommended middle-deltoid placement region, and the de-identified photograph shows the practical attachment of the custom-developed wearable acquisition device and its ADXL355 accelerometer.
Sensors 26 04351 g002
Figure 3. Representative preprocessing results for sEMG and MMG signals. The upper panel compares raw sEMG with the signal after 20–450 Hz band-pass filtering. The lower panel compares centered raw MMG with MMG after 10–100 Hz band-pass filtering and sym5 wavelet soft-threshold denoising.
Sensors 26 04351 g003
Figure 4. Comparison of eight classifiers using the predefined 26-feature fusion set under group-aware cross-validation at the action-trial level. Bars indicate mean macro-F1 scores, and error bars indicate standard deviations across folds. LR, logistic regression; KNN, k-nearest neighbors; DT, decision tree; SVM-RBF, support vector machine with radial basis function kernel; RF, random forest; ET, extremely randomized trees; HGBDT, histogram-based gradient boosting decision tree; MLP, multi-layer perceptron.
Sensors 26 04351 g004
Figure 5. Ablation analysis of single-modality and fusion feature sets using HGBDT under group-aware cross-validation at the action-trial level. Bars indicate mean performance values, and error bars indicate standard deviations across folds.
Sensors 26 04351 g005
Figure 6. Normalized confusion matrix of the HGBDT model using the predefined 26-feature fusion set. Values represent row-normalized proportions, and the number in parentheses indicates the corresponding sample count.
Sensors 26 04351 g006
Figure 7. RF-based feature-importance analysis for the predefined 26-feature set. The analysis was used to explore feature contribution rather than to determine the best classifier.
Sensors 26 04351 g007
Table 1. Operational definition of MVC-normalized force-level labels.
LabelApproximate MVC LevelInterpretation in This Study
210% MVCLow force-level condition
330% MVCLow-to-moderate force-level condition
460% MVCModerate-to-high force-level condition
590% MVCHigh force-level condition
Table 2. Predefined 26-feature set used for the main analysis.
SourceFeature GroupFeature Variables
sEMGTime-domain amplitude and complexityEMG_RMS, EMG_WL, EMG_ZC, EMG_SSC, EMG_WAMP
sEMGFrequency and autoregressive featuresEMG_MNF, EMG_AR1–EMG_AR4
MMGTime- and frequency-domain featuresMMG_RMS_Mech, MMG_Kurtosis, MMG_MPF
MMGCepstral-domain featuresMMG_MFCC_1–MMG_MFCC_12
FusionCorrelation-based coupling featureFusion_Corr_MA
Table 3. Feature sets used in the ablation analysis.
Feature SetNumber of FeaturesIncluded Information
sEMG-only10sEMG time-domain, frequency-domain, and AR features
MMG-only15MMG time-domain, frequency-domain, and MFCC features
sEMG+MMG25Direct concatenation of sEMG-only and MMG-only features
sEMG+MMG+Fusion_Corr_MA26sEMG+MMG features plus Fusion_Corr_MA
Table 4. Dataset structure used for model development and validation.
ItemValue
Window-level samples used for analysis12,231
Action-trial groups30
Force-level labels2, 3, 4, and 5
Label 2 samples2825 (23.10%)
Label 3 samples2387 (19.52%)
Label 4 samples3403 (27.82%)
Label 5 samples3616 (29.56%)
sEMG-derived features10
MMG-derived features15
Correlation-based fusion feature1
Predefined feature set used in main analysis26 features
IMU-derived features included in main analysisNo
Table 5. Performance comparison of eight classifiers using the predefined 26-feature fusion set.
ClassifierAccuracyBalanced AccuracyMacro-F1QWKMAE
LR 0.797 ± 0.033 0.814 ± 0.026 0.812 ± 0.026 0.812 ± 0.055 0.290 ± 0.060
KNN 0.709 ± 0.027 0.737 ± 0.018 0.730 ± 0.020 0.648 ± 0.049 0.467 ± 0.046
DT 0.834 ± 0.021 0.846 ± 0.014 0.845 ± 0.015 0.830 ± 0.037 0.246 ± 0.036
SVM-RBF 0.845 ± 0.030 0.859 ± 0.024 0.858 ± 0.024 0.848 ± 0.050 0.224 ± 0.053
RF 0.886 ± 0.023 0.897 ± 0.017 0.895 ± 0.018 0.883 ± 0.042 0.169 ± 0.044
ET 0.879 ± 0.028 0.891 ± 0.021 0.889 ± 0.023 0.879 ± 0.047 0.178 ± 0.051
HGBDT 0 . 904 ± 0 . 023 0 . 912 ± 0 . 017 0 . 911 ± 0 . 018 0 . 910 ± 0 . 038 0 . 137 ± 0 . 042
MLP 0.859 ± 0.028 0.871 ± 0.023 0.870 ± 0.022 0.866 ± 0.045 0.201 ± 0.048
Table 6. Feature-set ablation analysis using HGBDT under group-aware cross-validation at the action-trial level.
Feature SetFeaturesAccuracyBalanced AccuracyMacro-F1QWKMAE
sEMG-only10 0.810 ± 0.038 0.823 ± 0.029 0.821 ± 0.030 0.783 ± 0.049 0.304 ± 0.060
MMG-only15 0.751 ± 0.023 0.775 ± 0.014 0.771 ± 0.015 0.756 ± 0.039 0.358 ± 0.039
sEMG+MMG25 0.904 ± 0.023 0.912 ± 0.018 0.911 ± 0.019 0.910 ± 0.037 0.138 ± 0.041
sEMG+MMG+Fusion_Corr_MA26 0 . 904 ± 0 . 023 0 . 912 ± 0 . 017 0 . 911 ± 0 . 018 0 . 910 ± 0 . 038 0 . 137 ± 0 . 042
Table 7. Per-class performance of the 26-feature HGBDT model based on out-of-fold predictions.
LabelPrecisionRecallF1-ScoreSupport
20.9130.9220.9172825
30.9970.9950.9962387
40.8310.8420.8373403
50.9020.8840.8933616
Macro average0.9110.9110.91112,231
Weighted average0.9030.9030.90312,231
Disclaimer/Publisher’s Note: The statements, opinions and data contained in all publications are solely those of the individual author(s) and contributor(s) and not of MDPI and/or the editor(s). MDPI and/or the editor(s) disclaim responsibility for any injury to people or property resulting from any ideas, methods, instructions or products referred to in the content.