1. Introduction
Underwater acoustic sensing is crucial for maritime surveillance, navigation, and reconnaissance, yet the dynamic and unpredictable ocean environment presents significant challenges to accurate sensing and analysis [
1,
2]. Passive sound navigation and ranging (sonar) is a widely employed technique in such conditions. It functions by receiving naturally emitted underwater sounds without transmitting signals, avoiding environmental disturbances and eliminating the risk of detection associated with active systems [
3]. Due to its stealth properties, passive sonar is considered suitable for sensitive underwater applications, particularly military missions that require strict concealment [
4].
Various acoustic analysis tasks have been explored in underwater environments, including vessel identification, marine mammal sound detection, acoustic target recognition, and target localization [
5,
6,
7,
8,
9]. Across these studies, a consistent finding is that underwater acoustic signals exhibit substantial variabilities influenced by factors, such as depth, temperature, surface conditions and ambient biological or geological noise [
5,
6,
7,
8,
9]. These variabilities cause signals from the same target class to differ significantly under different environmental conditions, making analysis highly challenging [
10]. Thus, they become particularly problematic in novelty detection whose goal is to determine whether an incoming signal corresponds to either a known target or an unknown acoustic event. This is because environmental effects can distort known signals to the point that they resemble unknown inputs, thereby blurring the boundary between known and unknown patterns. Consequently, conventional novelty detection approaches often struggle to maintain robust performance in realistic underwater conditions.
To mitigate this limitation, several reconstruction-based novelty detection methods have been developed, showing promise in identifying previously unseen inputs [
11]. These methods determine whether an input corresponds to a known or unknown class by measuring its deviation from the training data distribution. A stacked autoencoder was introduced to enable both the detection of unknown inputs and the classification of known categories [
12]. However, these techniques still suffer from overlapping reconstruction error distributions between known and unknown samples, leading to unstable decision boundaries for novelty detection. Additionally, distributional shifts caused by environmental variability frequently lead neural network classifiers to assign overly confident predictions to unknown inputs, making it even more difficult to reliably distinguish unfamiliar signals from known classes. The deterministic nature of these models further limits their robustness in such highly variable environments.
Notably, the environmental variability observed in underwater acoustics can be interpreted as a distributional shift: even signals from known targets may deviate significantly from the training distribution due to recording conditions. This property suggests that the novelty detection problem in underwater environments naturally aligns with the framework of out-of-distribution (OOD) detection, which aims to identify inputs that fall outside the distribution learned from known classes. By framing the novelty detection as an OOD detection problem, it becomes possible to leverage an established OOD technique designed to handle distributional shifts and mitigate the overconfidence issue commonly observed in neural network classifiers.
To incorporate this OOD perspective into our study, we first define the datasets for the novelty detection task.
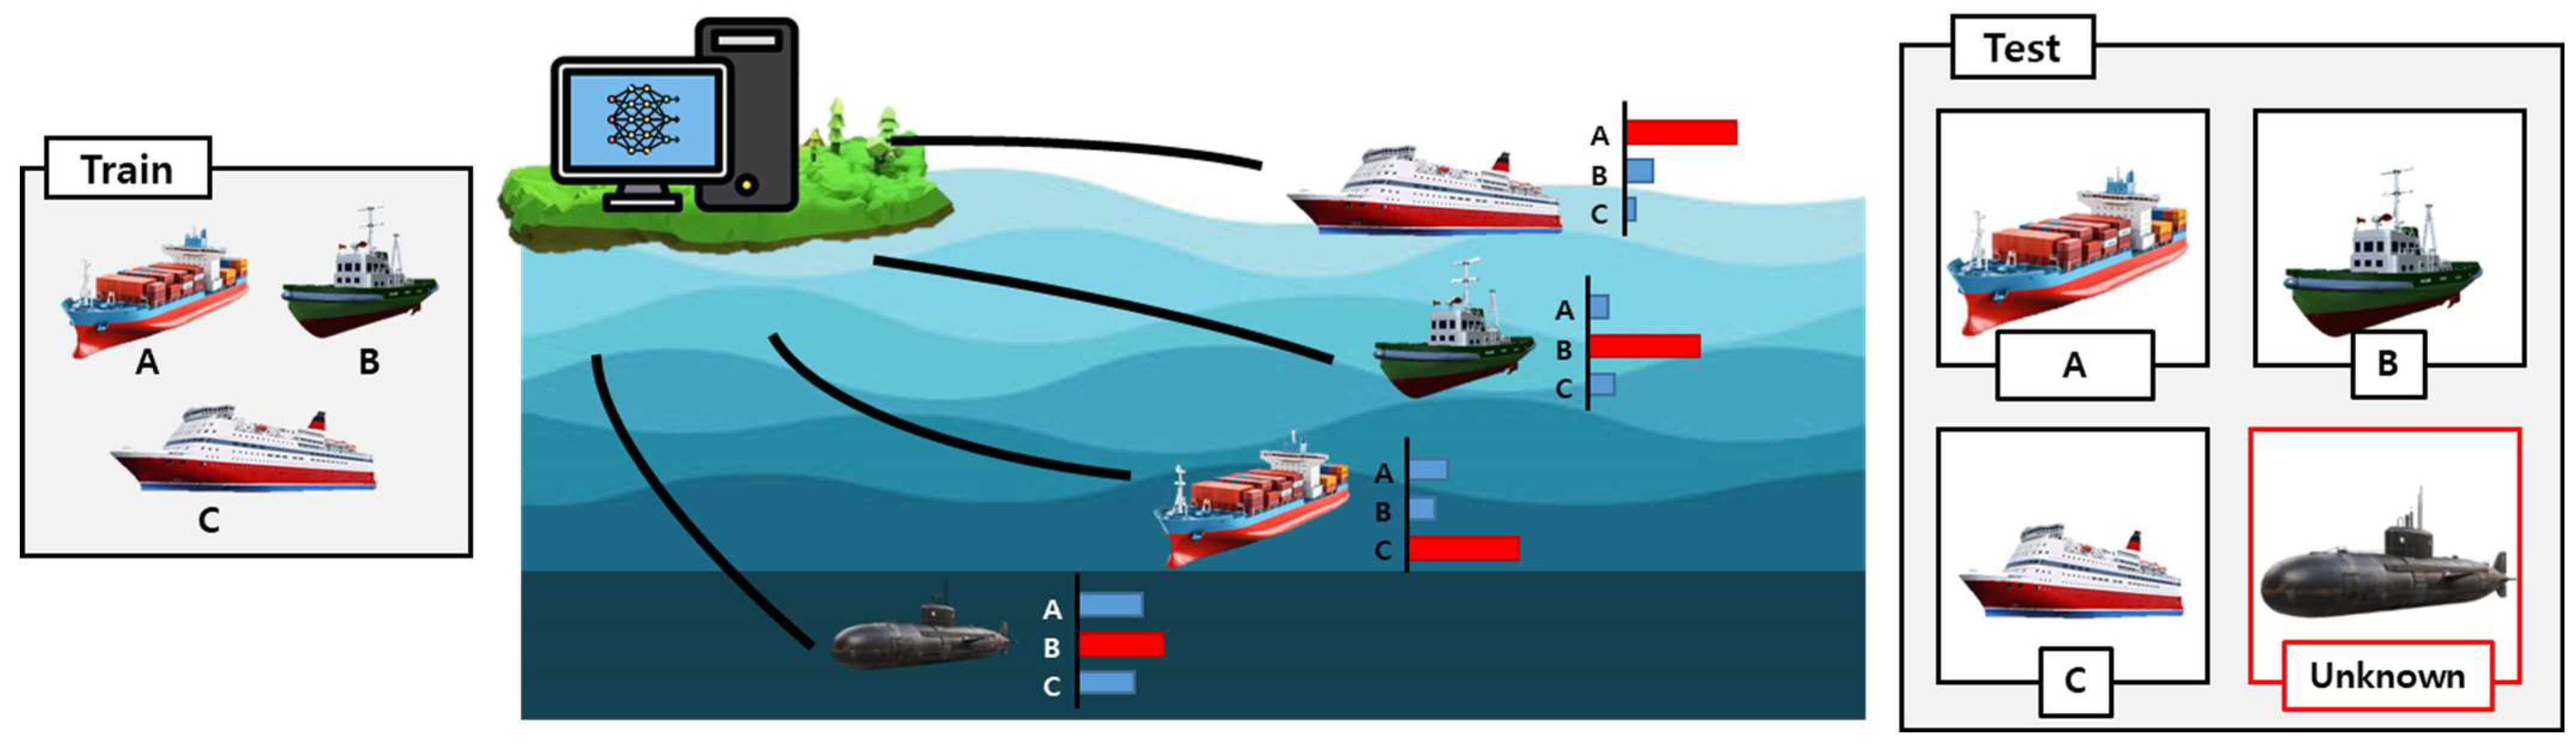
Figure 1 illustrates an overview of the novelty detection in the underwater acoustic environment. As shown in the figure, the underwater acoustic dataset consists of multiple vessel classes. The novelty detection task is formulated by withholding one class label during training and treating it as an unknown target during evaluation. A novelty detection model is trained exclusively on the remaining known classes to learn their acoustic characteristics under diverse environmental conditions. During evaluation, the withheld class appears as an unknown acoustic event, requiring the model to distinguish it from the known classes despite potential environmental distortions. This setup reflects realistic underwater sensing scenarios in which previously unobserved vessels or anomalous acoustic sources may emerge, and it provides a structured framework for assessing the model’s ability to detect unknown signals in the OOD framework.
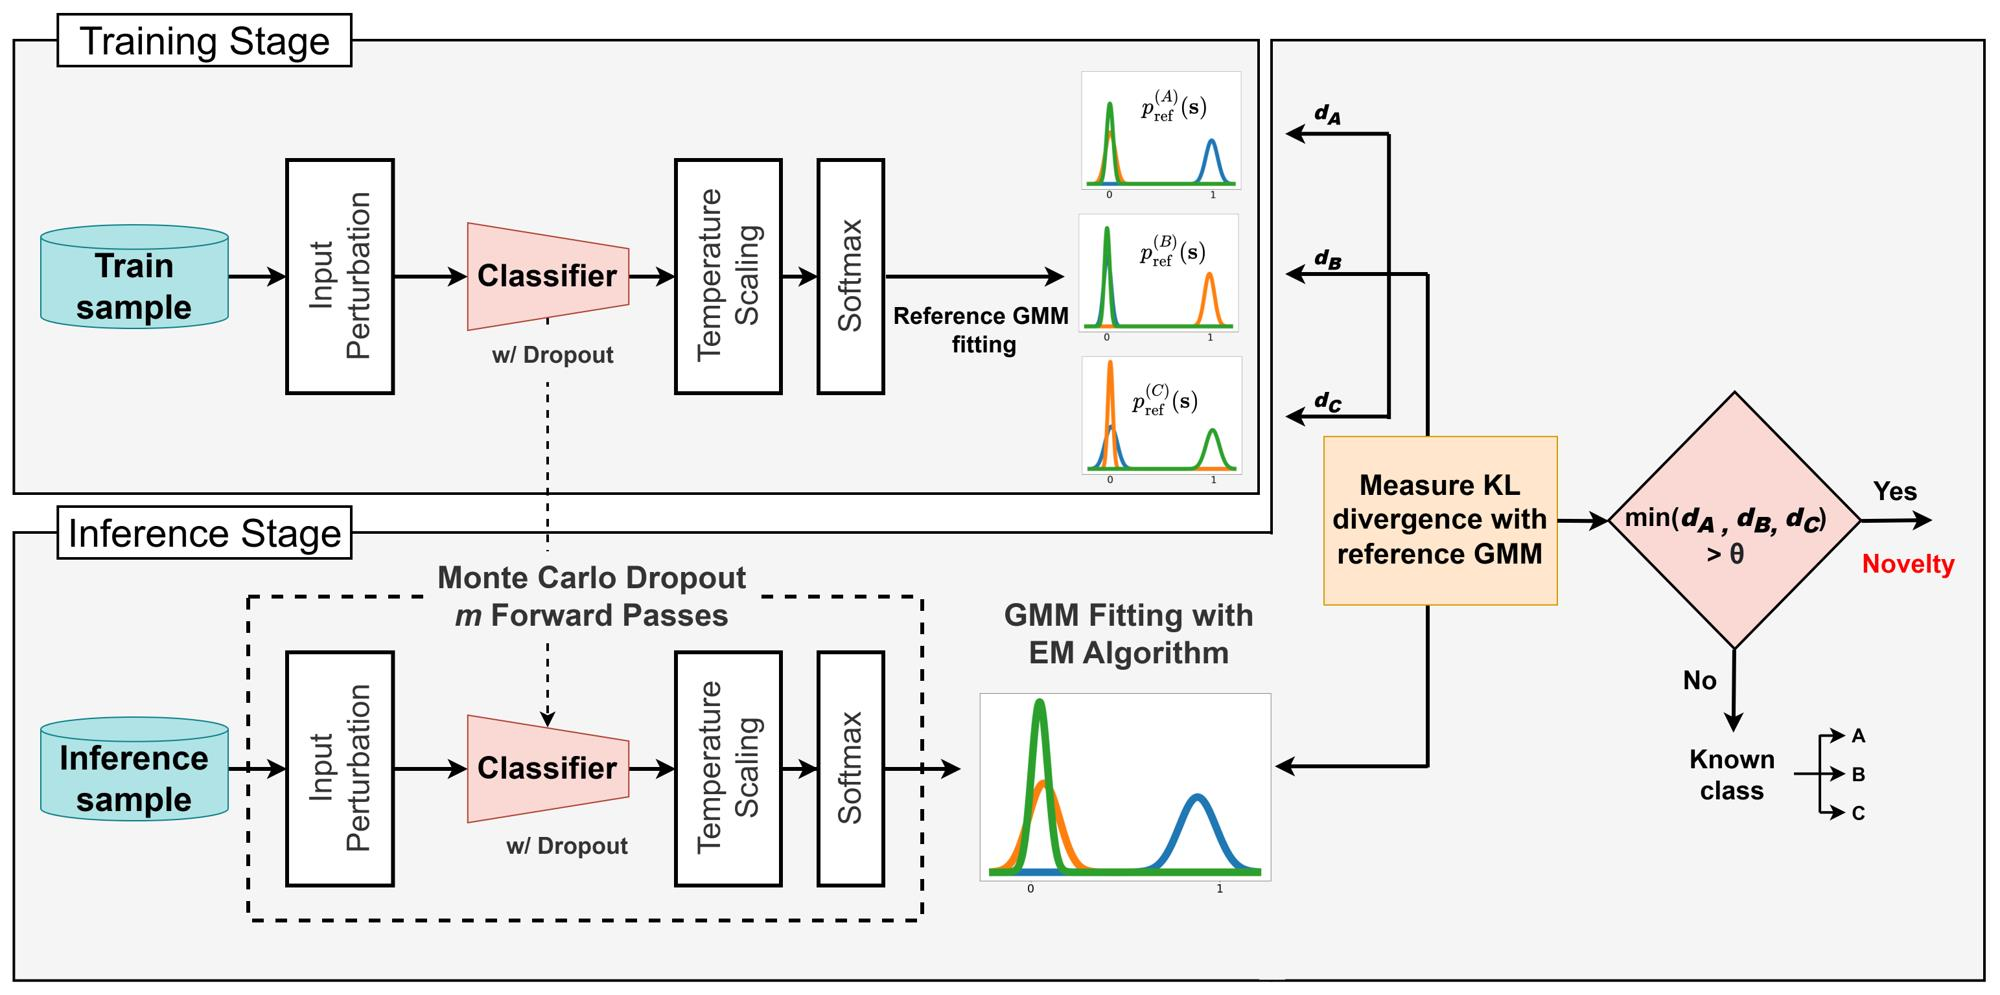
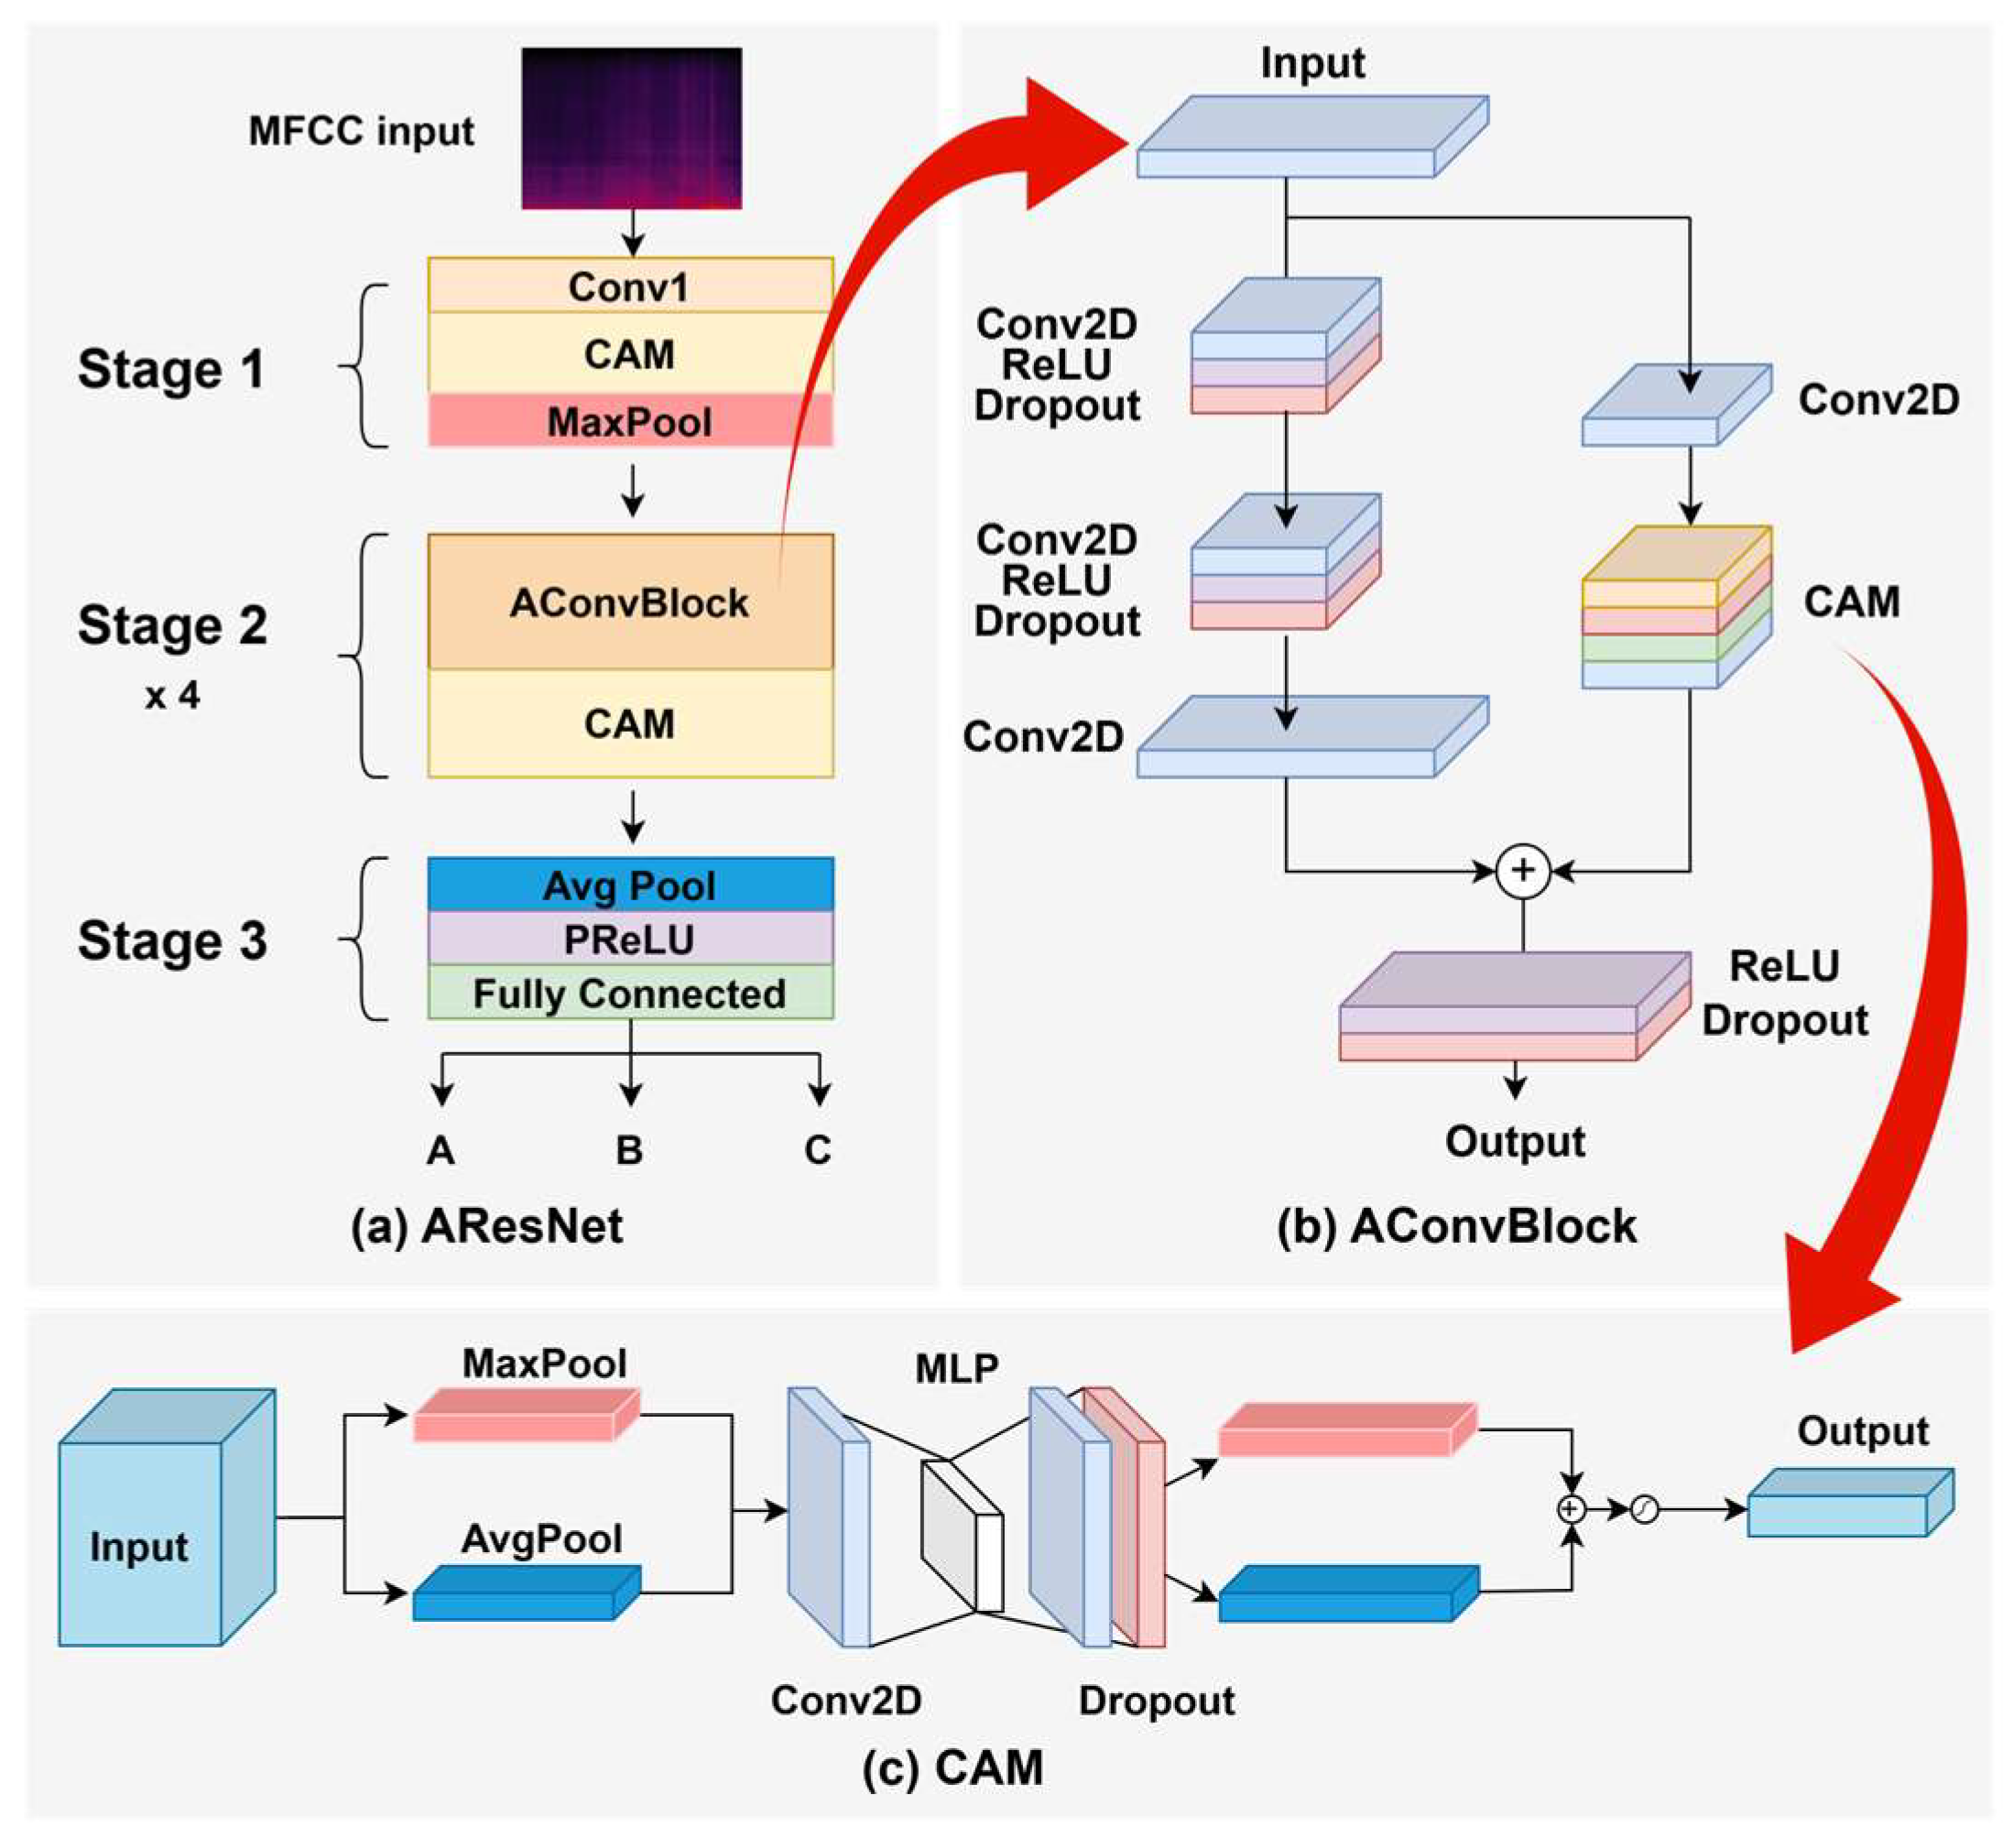
Next, we propose a novelty detection framework for underwater acoustic environments that integrates ODIN and MC dropout to enhance the separability between known and unknown distributions and to overcome the limitations of deterministic models. ODIN mitigates the overconfidence issue by applying temperature scaling and input perturbation, improving the discrimination between known and unknown samples through calibrated softmax probabilities [
13]. However, while ODIN effectively reduces overconfidence, it alone is insufficient to capture uncertainty in ambiguous cases. To address this limitation, MC dropout is incorporated, performing multiple stochastic forward passes to estimate predictive uncertainty and generate a calibrated softmax distribution [
14]. By combining ODIN’s softmax calibration with MC dropout’s stochastic sampling, the proposed framework is expected to enhance the separability between known and unknown distributions while overcoming the constraints of deterministic prediction. This integration enables more accurate and robust novelty detection in complex underwater acoustic environments.
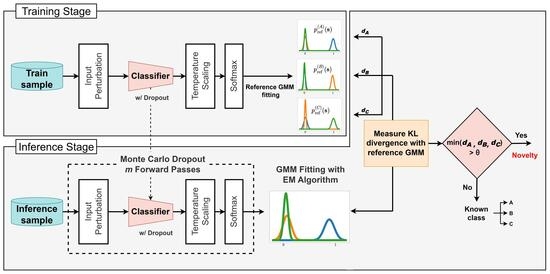
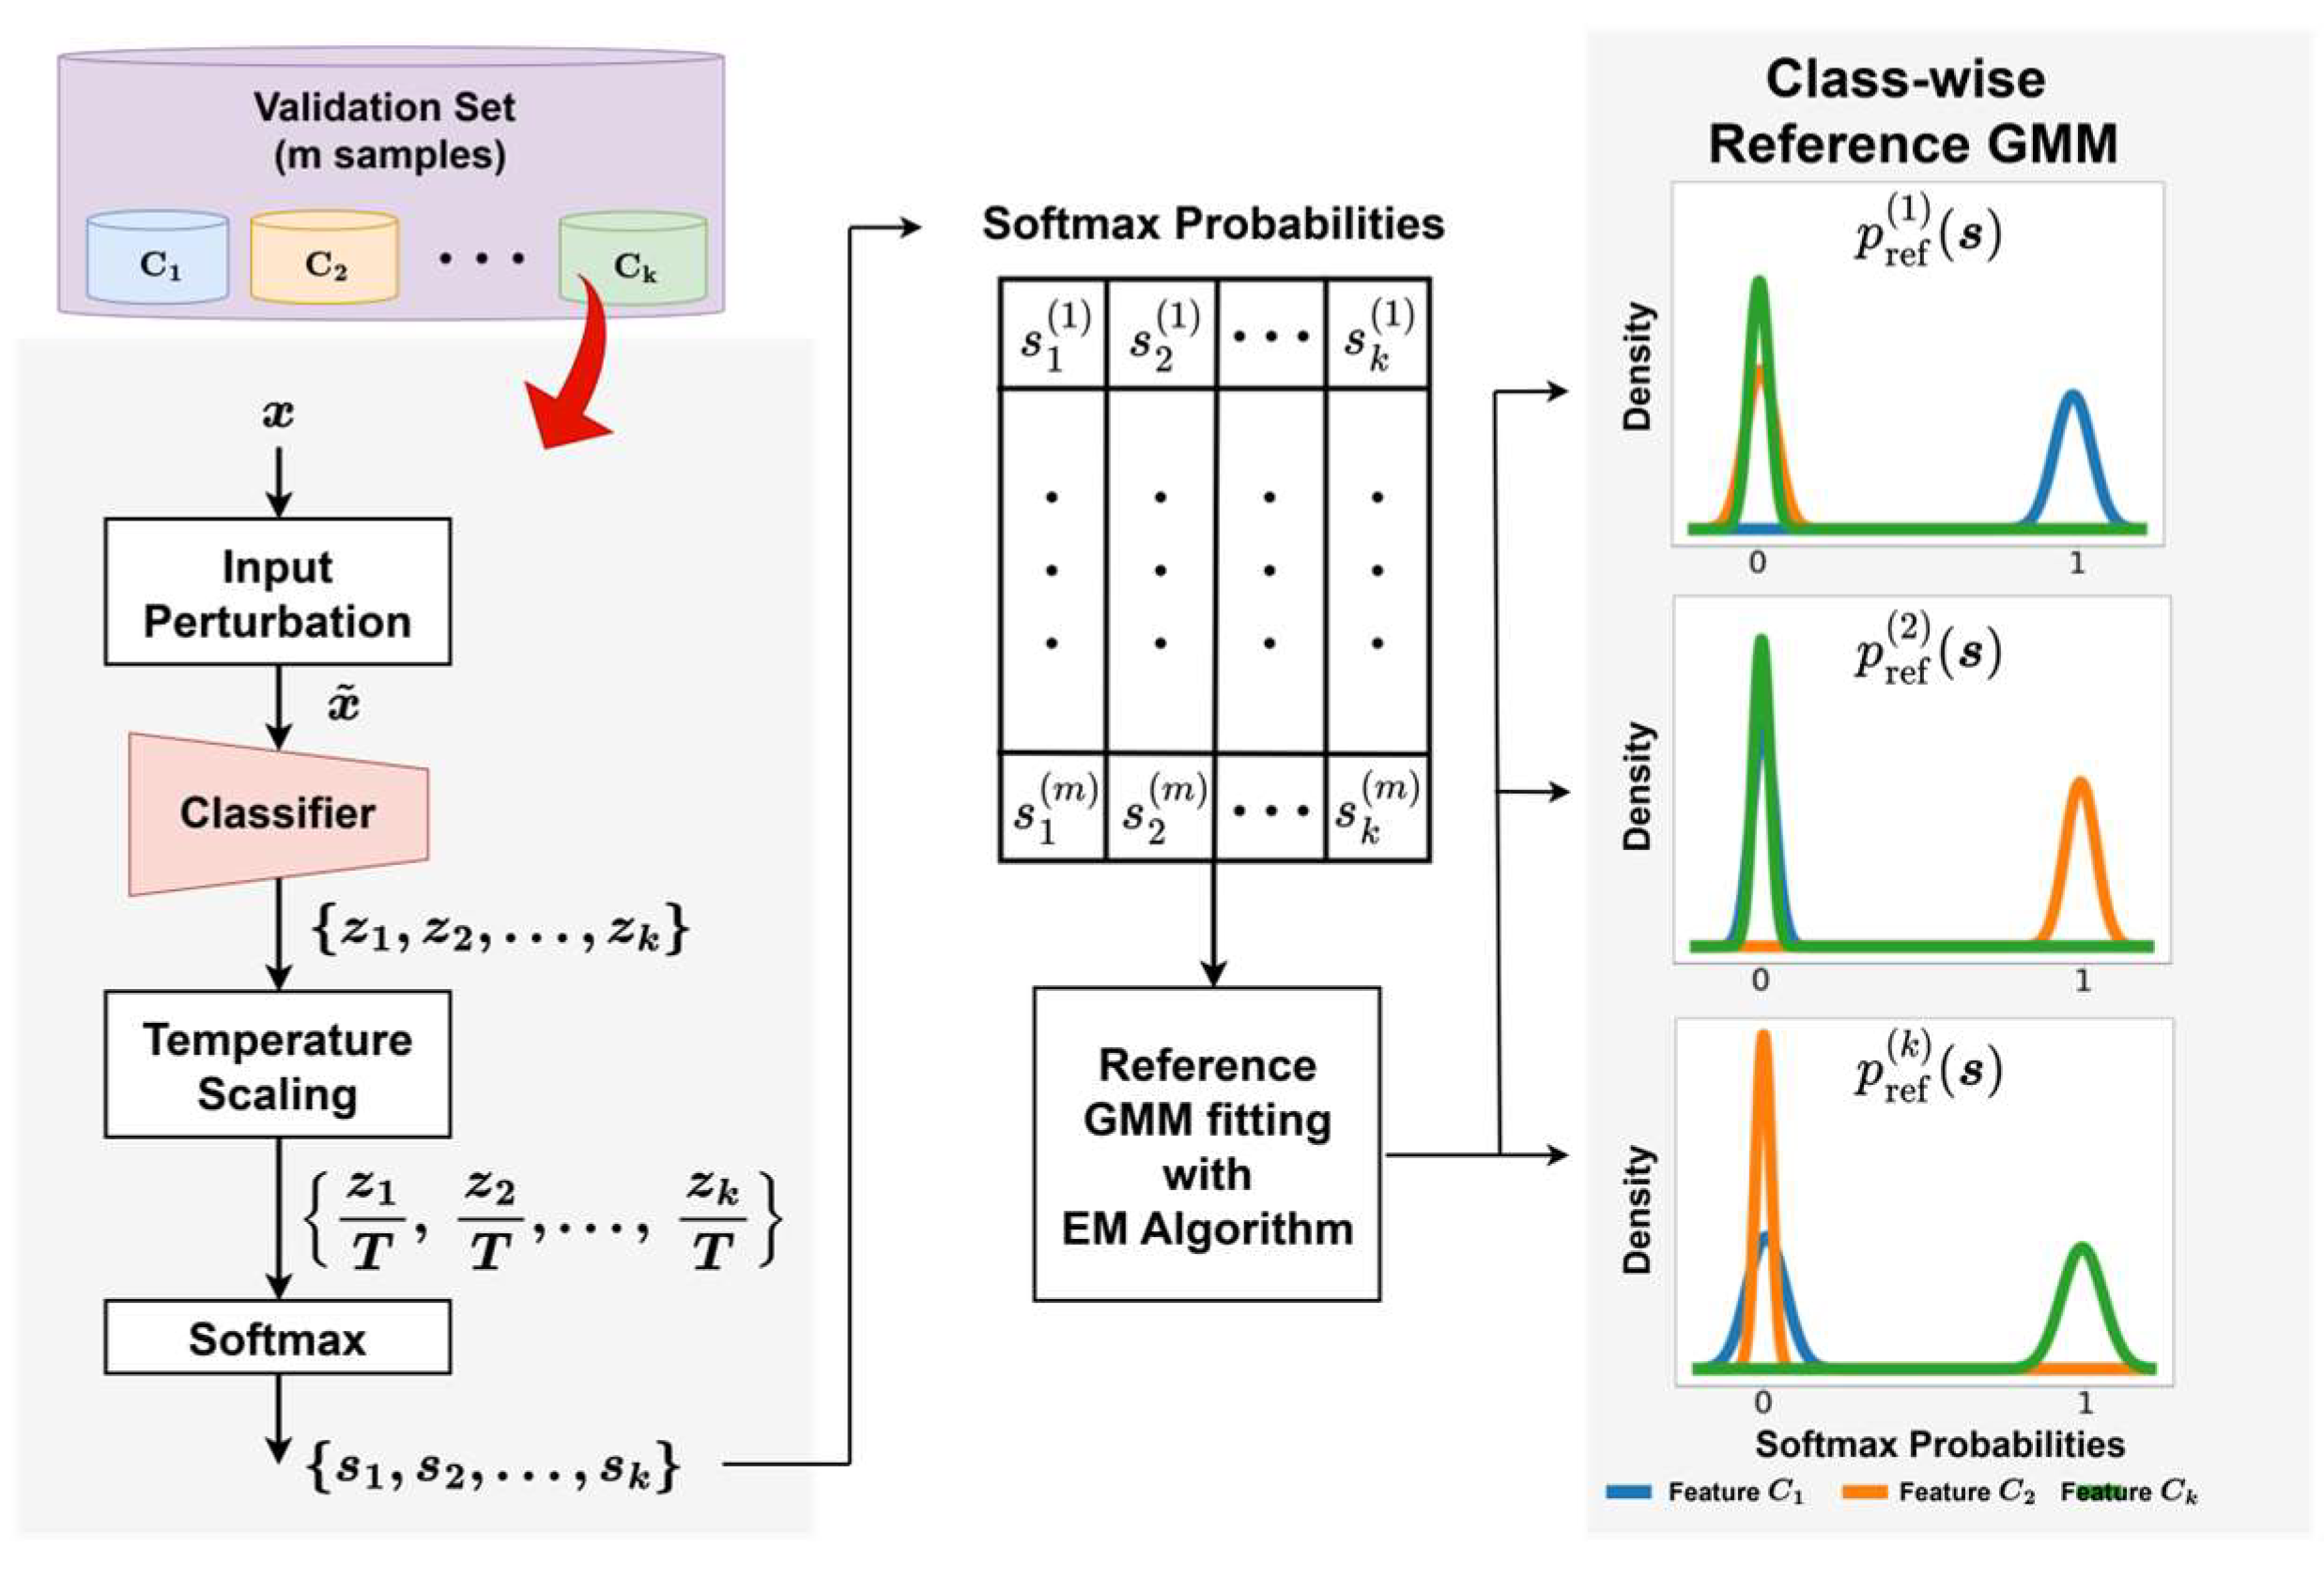
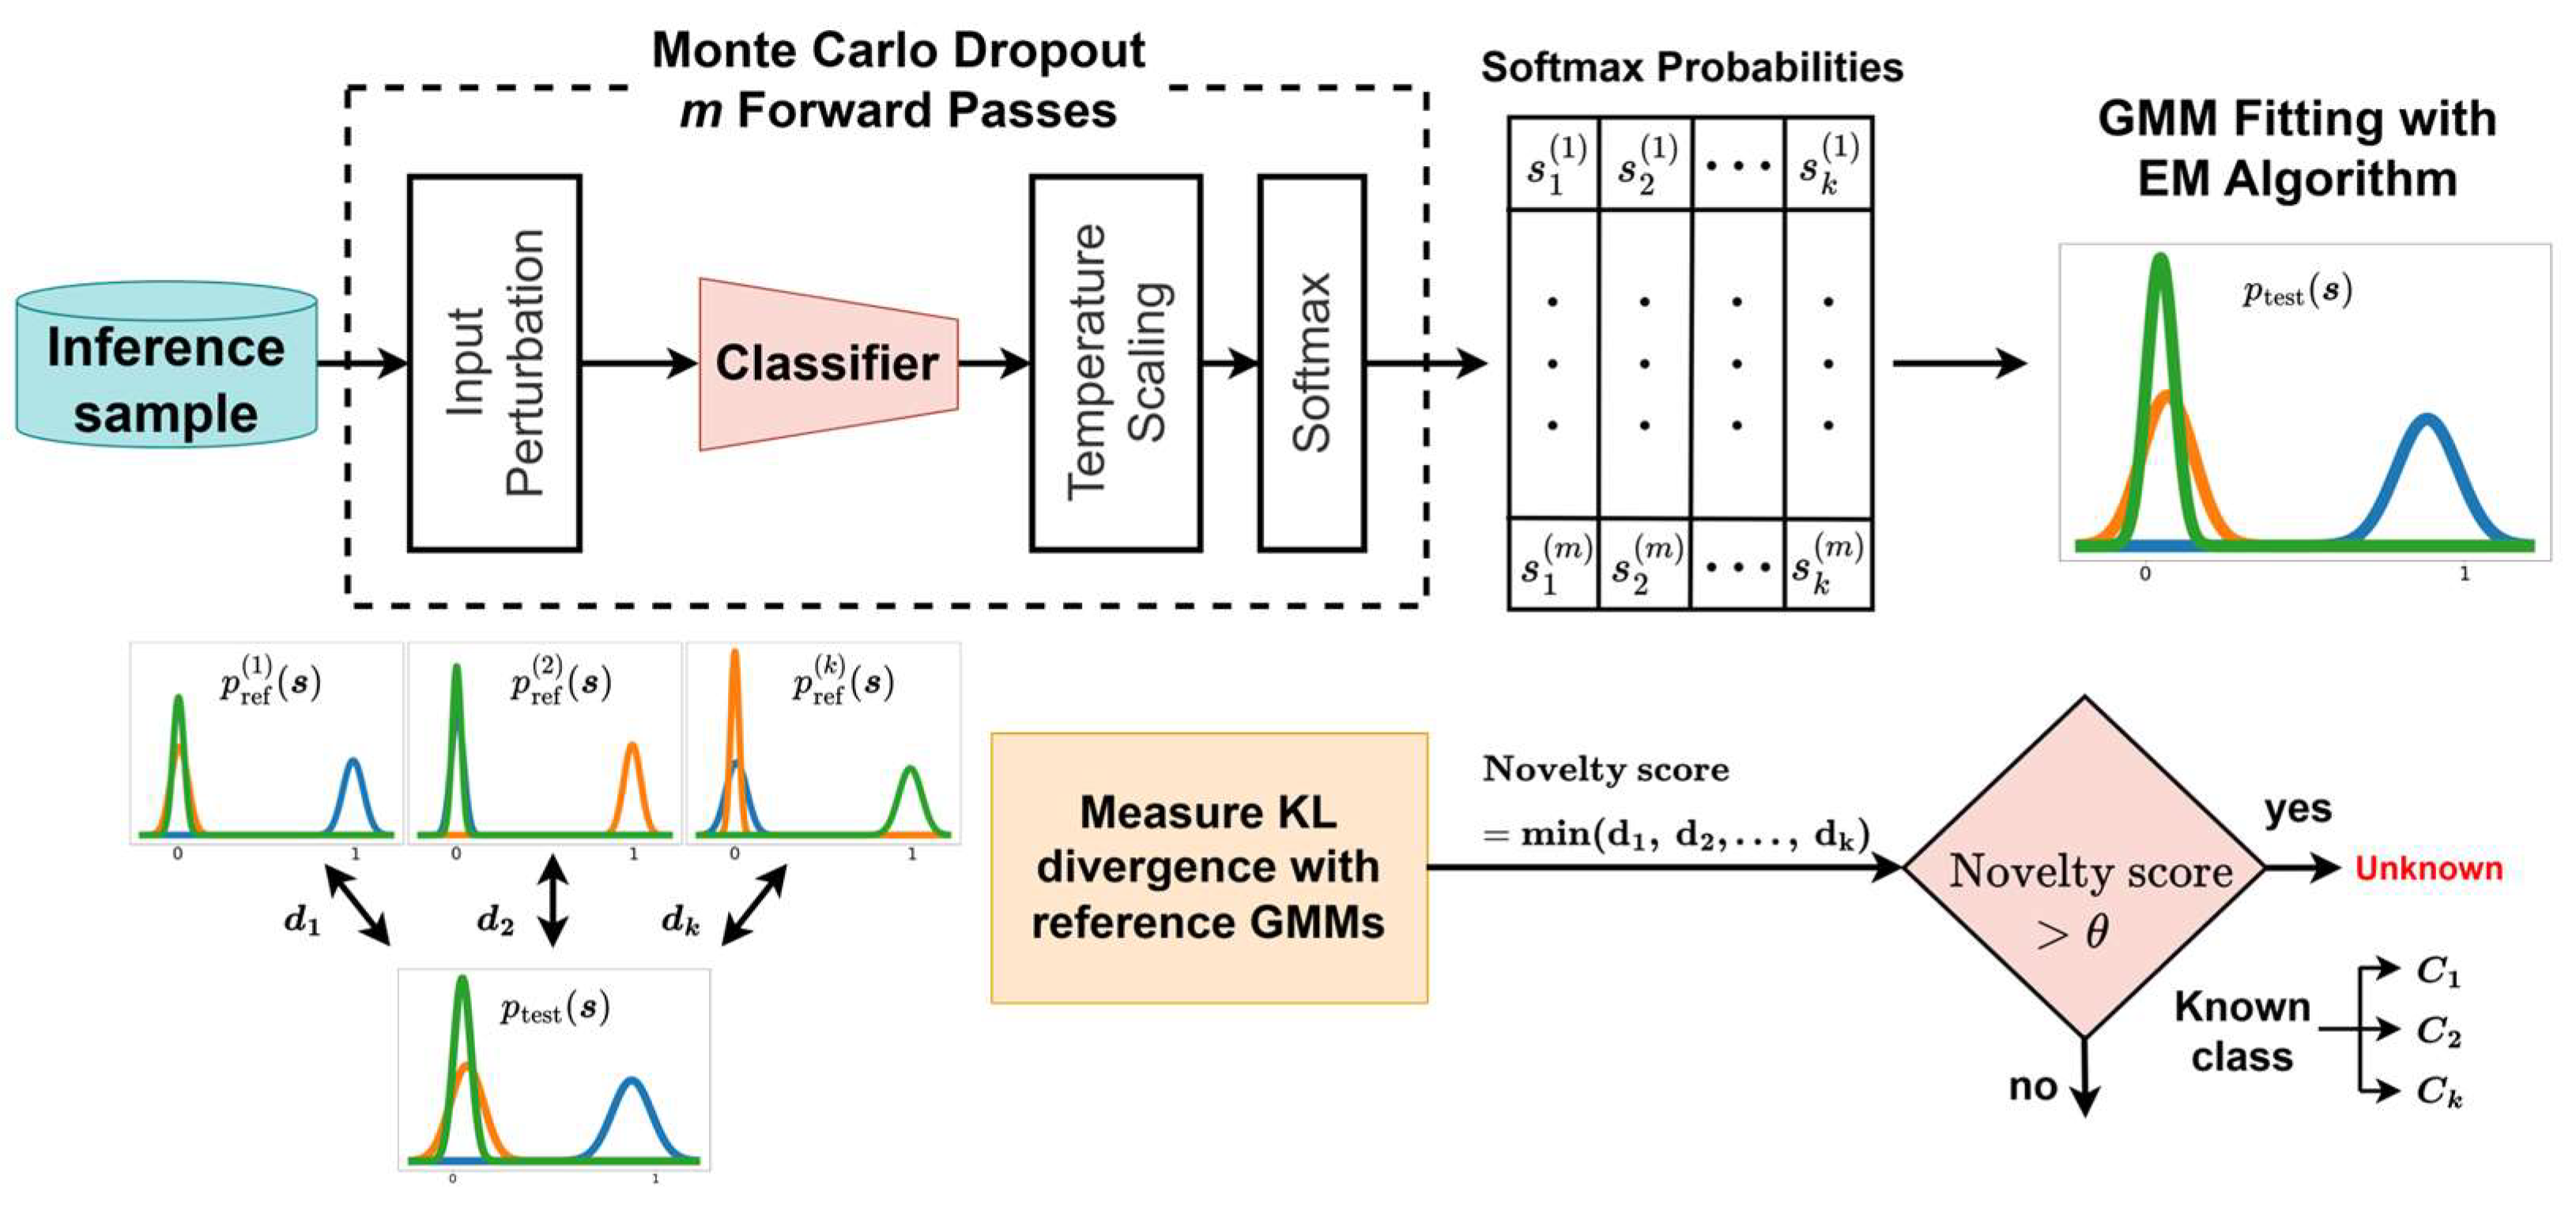
Building upon the calibrated softmax distributions produced by ODIN and MC dropout, the proposed framework incorporated a distribution-based scoring mechanism that compares the distributions of test samples with class-specific reference distributions. Specifically, a Gaussian mixture model (GMM) is fitted to ODIN-calibrated softmax representations of correctly classified samples from known classes, establishing a statistical baseline for measuring the deviation of test samples from known class distributions. During inference, ODIN and MC dropout are applied to each test sample to generate a sample-specific calibrated softmax distribution, which is subsequently compared with the reference GMM. The KL divergence is used to quantify the discrepancy between the two distributions. The resulting distance is then utilized as a novelty score to determine whether the test sample belongs to a known class or represents an unknown input. The main contributions of this study are as follows:
This study integrates ODIN and MC dropout for underwater acoustic novelty detection: to the best of our knowledge, this represents the first attempt to combine these two techniques in this domain.
An uncertainty-aware confidence modeling: we proposed an approach that leverages ODIN-calibrated softmax responses and MC dropout-based stochastic sampling across multiple forward passes to capture predictive uncertainty.
Improved discrimination under underwater variability: the integrated framework to enhance the discrimination between known and unknown acoustic samples, thereby improving the robustness of underwater acoustic sensing and enabling more reliable, environment-adaptive sensing performance under significant underwater variability.
The remainder of this paper is structured as follows.
Section 2 reviews related work on underwater acoustic target recognition and novelty detection techniques.
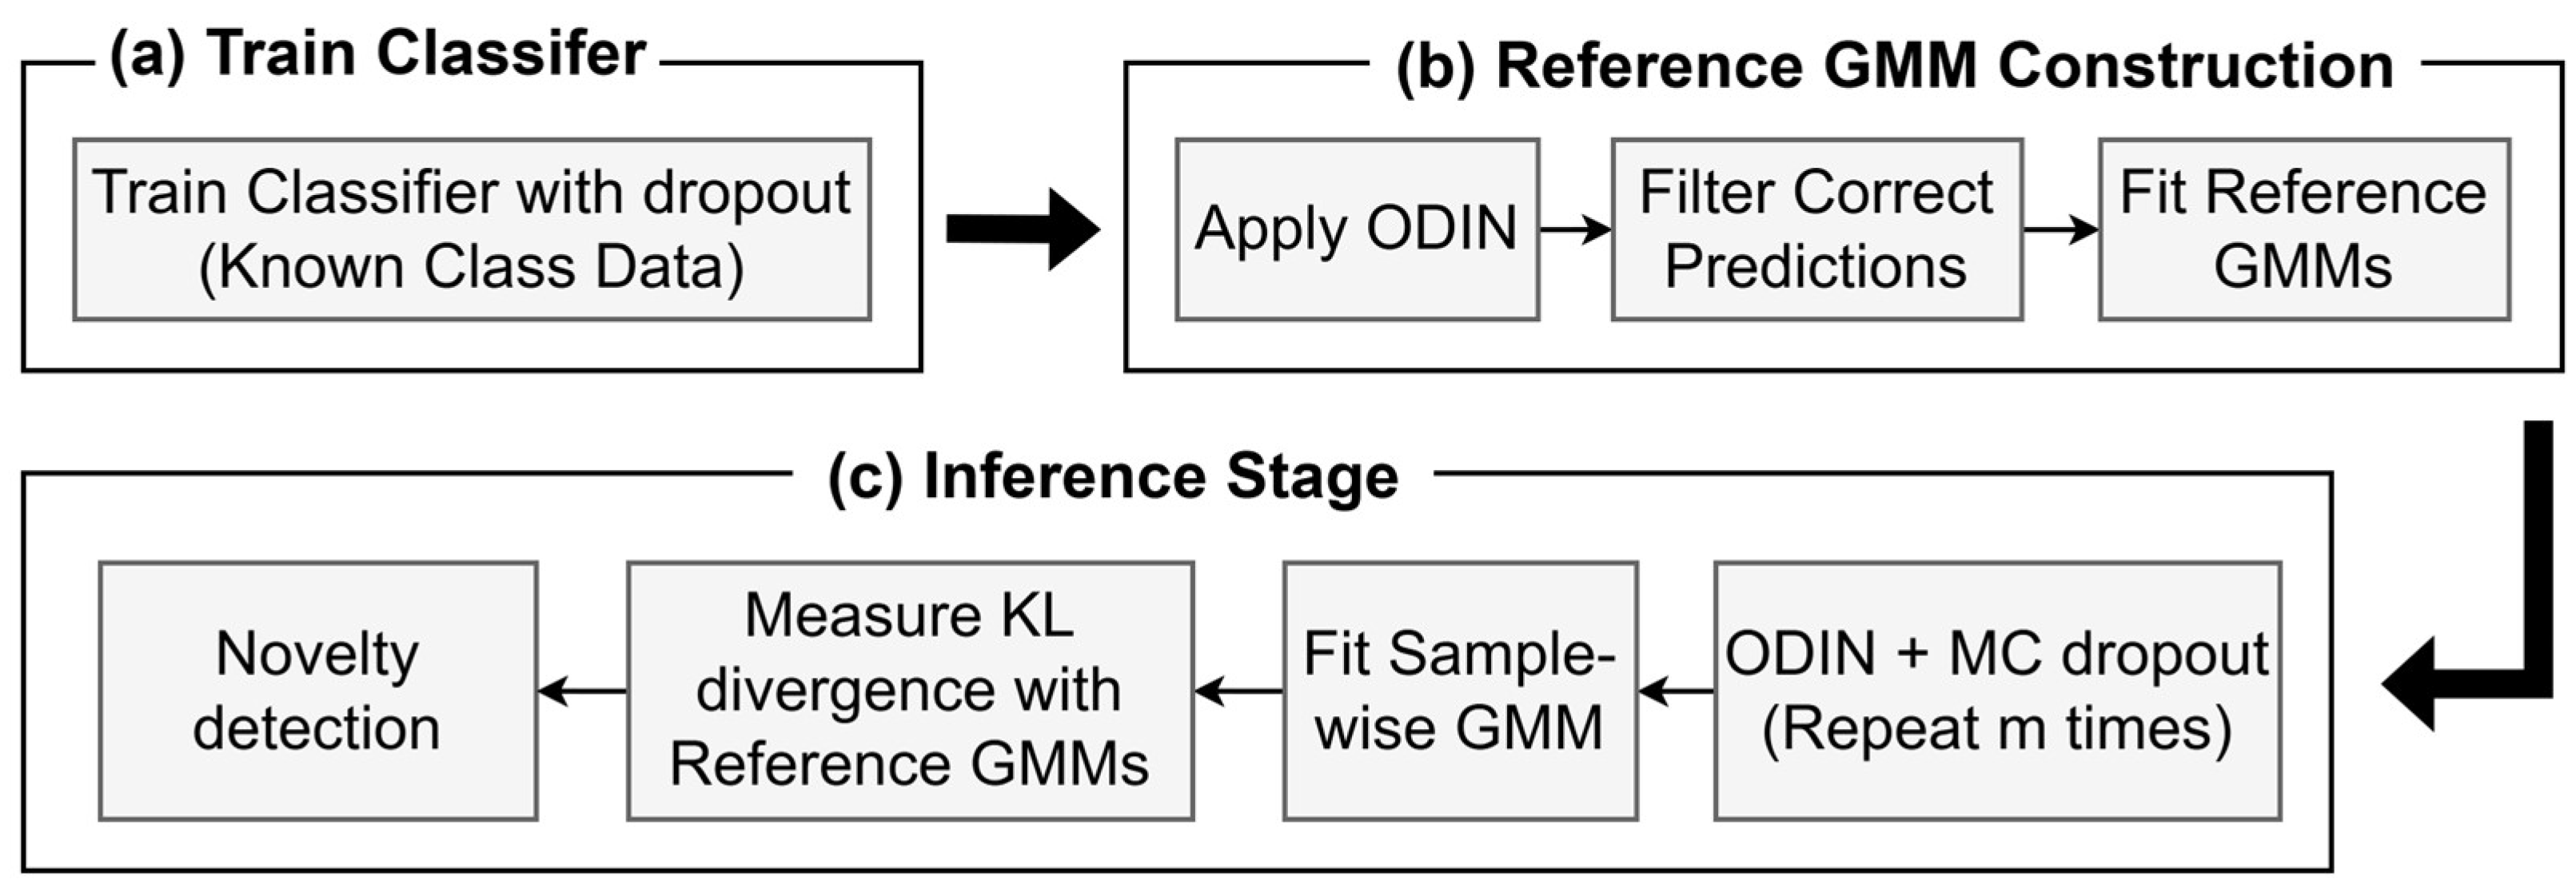
Section 3 presents the proposed framework that integrates ODIN and MC dropout to improve softmax calibration. It describes classifier training, construction of class-wise GMMs, modeling of test sample softmax distributions using ODIN and MC dropout, and computation of novelty scores via a distributional distance metric.
Section 4 outlines the dataset, hyperparameter settings, and evaluation metrics.
Section 5 reports and analyzes experimental results. Finally,
Section 6 concludes the study with future directions for robust underwater acoustic novelty detection.
4. Experimental Setup
4.1. Dataset
In this study, the DeepShip dataset was used to conduct novelty detection experiments in underwater acoustic environments [
34]. DeepShip comprises passive sonar recordings collected under various maritime conditions and provides labeled acoustic signals for vessel classification. The acoustic signals were acquired using an IcListen AF hydrophone deployed at a depth of approximately 141–147 m, with an original sampling rate of 32 kHz [
34]. The dataset contains four vessel classes representing multiple vessel types and diverse background noise conditions, making it well-suited for supervised learning-based target recognition and novelty detection tasks.
To evaluate the generalizability of the proposed framework across different maritime environments, we additionally utilized the ShipsEar dataset [
35]. ShipsEar contains of ship-radiated noise recordings collected from the Spanish Atlantic coast using a digitalHyd SR-1 recorder with a sampling rate of 52,734 Hz. This dataset includes recordings from shallow waters in port environments, offering a distinct acoustic domain with different background noise characteristics distinct from those of DeepShip.
A 10-fold cross-validation procedure was performed. For each fold, the dataset was randomly partitioned into training, validation, and test sets, preserving class proportions. All recordings were resampled at a rate of 8 kHz to maintain consistency across samples, and each audio file—originally varying durations—was segmented into non-overlapping 10 s clips.
Table 2 presents an overview of the data partition using the first fold as a representative example, including the number of recording sessions and segmented samples for each vessel class.
For feature extraction, MFCCs are computed to characterize the acoustic properties of the input signals. A total of 60 MFCCs are extracted using 60 Mel filters to partition the frequency spectrum. A 2048-point fast Fourier transform is applied with a window length of 2048 samples to capture temporal variations in the signal. To preserve temporal continuity between frames, a hop length of 512 samples is used, enabling partial frame overlap and improving feature representation.
One of the labeled classes was reserved as the unknown category for evaluation, while the remaining classes were used for model training. The validation set was employed to construct the reference GMM by first applying ODIN calibration and then fitting GMMs to the resulting softmax probabilities. The test set was reserved exclusively for inference and for evaluating the performance of the proposed novelty detection framework.
4.2. Hyperparameter Configurations for MC Dropout and ODIN
At the inference stage, MC dropout was applied with varying numbers of stochastic forward passes, specifically 2, 3, 5, 10, 20, 50, and 100. These configurations were selected to evaluate how effectively the variability of unknown samples could be captured and distinguished from the behavior of known classes.
ODIN settings were also varied, with input perturbation magnitudes set to 0.0001, 0.001, 0.01, and 0.1, and temperature scaling values set to 1, 5, 10, 50, and 100. These configurations enabled a comparative analysis of different parameter settings. All experimental conditions were applied consistently across tests to ensure a fair, reproducible, and reliable evaluation of the proposed novelty detection framework.
4.3. Evaluation Metrics
Performance was evaluated using four metrics: area under the receiver operating characteristic curve (AUROC), false positive rate at 95% true positive rate (FPR@95%TPR), area under the precision-recall curve (AUPR) of ID as positive class (AUPR In), and AUPR of OOD as positive class (AUPR Out) [
36,
37,
38]. These metrics collectively assessed the model’s capability to distinguish between known and unknown classes across varying decision thresholds.
The AUROC metric evaluates novelty detection performance by quantifying how effectively a model distinguishes between known and unknown classes across all possible decision thresholds. It represents the probability that an unknown sample receives a higher novelty score than a known sample. The ROC curve plots the TPR against the FPR, and a larger area under the curve indicates stronger separation capability for unknown classes. An AUROC value near 0.5 corresponds to random performance, whereas a value approaching 1 signifies superior discriminative ability.
FPR at 95% TPR measures the false positive rate when the TPR is fixed at 95%, indicating how frequently known samples are incorrectly classified as unknown while maintaining a high TPR for unknown samples. This metric is essential for assessing a model’s ability to distinguish unknown inputs from known ones without excessive misclassification of ID data. Lower FPR values correspond to better performance, as they indicate fewer misclassified ID samples. FPR is defined as
where the false positive (FP) denotes the number of known samples that are incorrectly classified as unknown, whereas the true negative (TN) represents the number of unknown samples that are correctly identified as unknown.
AUPR provides a complementary assessment of detection performance, particularly in scenarios with class imbalance. It is calculated as the area under the precision-recall curve using a discrete approximation. AUPR is evaluated in two forms: AUPR In and AUPR Out. AUPR In treats known data as the positive class and measures the model’s ability to correctly identify known samples while avoiding misclassification of unknown data. In contrast, AUPR Out treats unknown data as the positive class and evaluates the model’s effectiveness in detecting novel or unseen inputs. In both cases, a higher AUPR value indicates greater precision and consistency for the corresponding positive class, reflecting superior detection performance. Unlike AUROC, which evaluates both positive and negative classes equally, AUPR focuses specifically on the performance of a designated positive class. Therefore, in situations where the proportions of known and unknown data are unbalanced, AUPR serves as a more reliable indicator of the model’s precision and recall for the class of interest.
5. Performance Analysis
This section presents a detailed analysis of the proposed ODIN+MC dropout framework for novelty detection. Its effectiveness is evaluated by comparing it with established baselines: a hierarchical LSTM autoencoder–based method (LAE-HI), MC dropout, MSP and ODIN, where LAE-HI is used as a reconstruction-based baseline to provide a complementary perspective on novelty detection. MC Dropout is used as an uncertainty-based baseline to isolate the contribution of the proposed distributional scoring mechanism from the benefits of uncertainty estimation alone [
14]. It estimates uncertainty by performing multiple stochastic forward passes with dropout activated at a test time and computing confidence scores from the resulting predictive distribution, without applying the proposed GMM-based divergence scoring. MSP serves as a simple baseline that uses the highest softmax output as a confidence score, assuming that unknown samples yield lower maximum probabilities [
36]. ODIN improves on MSP by incorporating input perturbation and temperature scaling to compute confidence scores from calibrated softmax probabilities, thereby mitigating the overconfidence commonly observed in neural networks [
13]. In the proposed framework, the confidence score is defined as the KL divergence between the test sample’s modeled distribution and its corresponding reference GMM, quantifying the degree of deviation from the known class behavior.
The proposed method, which integrates ODIN with MC dropout and evaluates novelty scores using KL divergence, generally outperforms the LAE-HI, MC dropout, MSP and ODIN baselines across all evaluation metrics (
Table 3). Although the magnitude of improvement varies across novelty labels, consistent performance enhancement is observed across all categories. Substantial improvements over all baselines is achieved; for example, the area under the receiver operating characteristic (AUROC) improves by 30.9% relative to LAE-HI. Notably, the method delivers marked improvements in OOD-focused metrics. When Cargo is treated as the unknown class, the area under the precision-recall curve (AUPR) Out increases from 0.2477 to 0.5223, and the false positive rate at 95 true positive rate (FPR@95TPR) decreases by up to 27.16%, indicating a substantially lower false-alarm rate under high-recall operating conditions. This improvement indicates that adopting an OOD detection perspective effectively leverages the inherent variability of underwater acoustic environments, enabling more robust discrimination between known and unknown patterns.
Moreover, the proposed approach outperforms MC dropout by 9.5% and ODIN by 5.39% in AUROC on average, while AUPR Out increases by 11.6% and 7.06%, respectively. This demonstrates that integrating MC dropout with ODIN provides complementary benefits, enhancing the separability between known and unknown signals. Despite the heterogeneous acoustic characteristics across novelty labels, the proposed method consistently improves performance across all metrics, and the lowest AUROC variance across cross-validation folds further highlights its strong generalizability and the stabilizing contribution of MC dropout in reliable novelty detection.
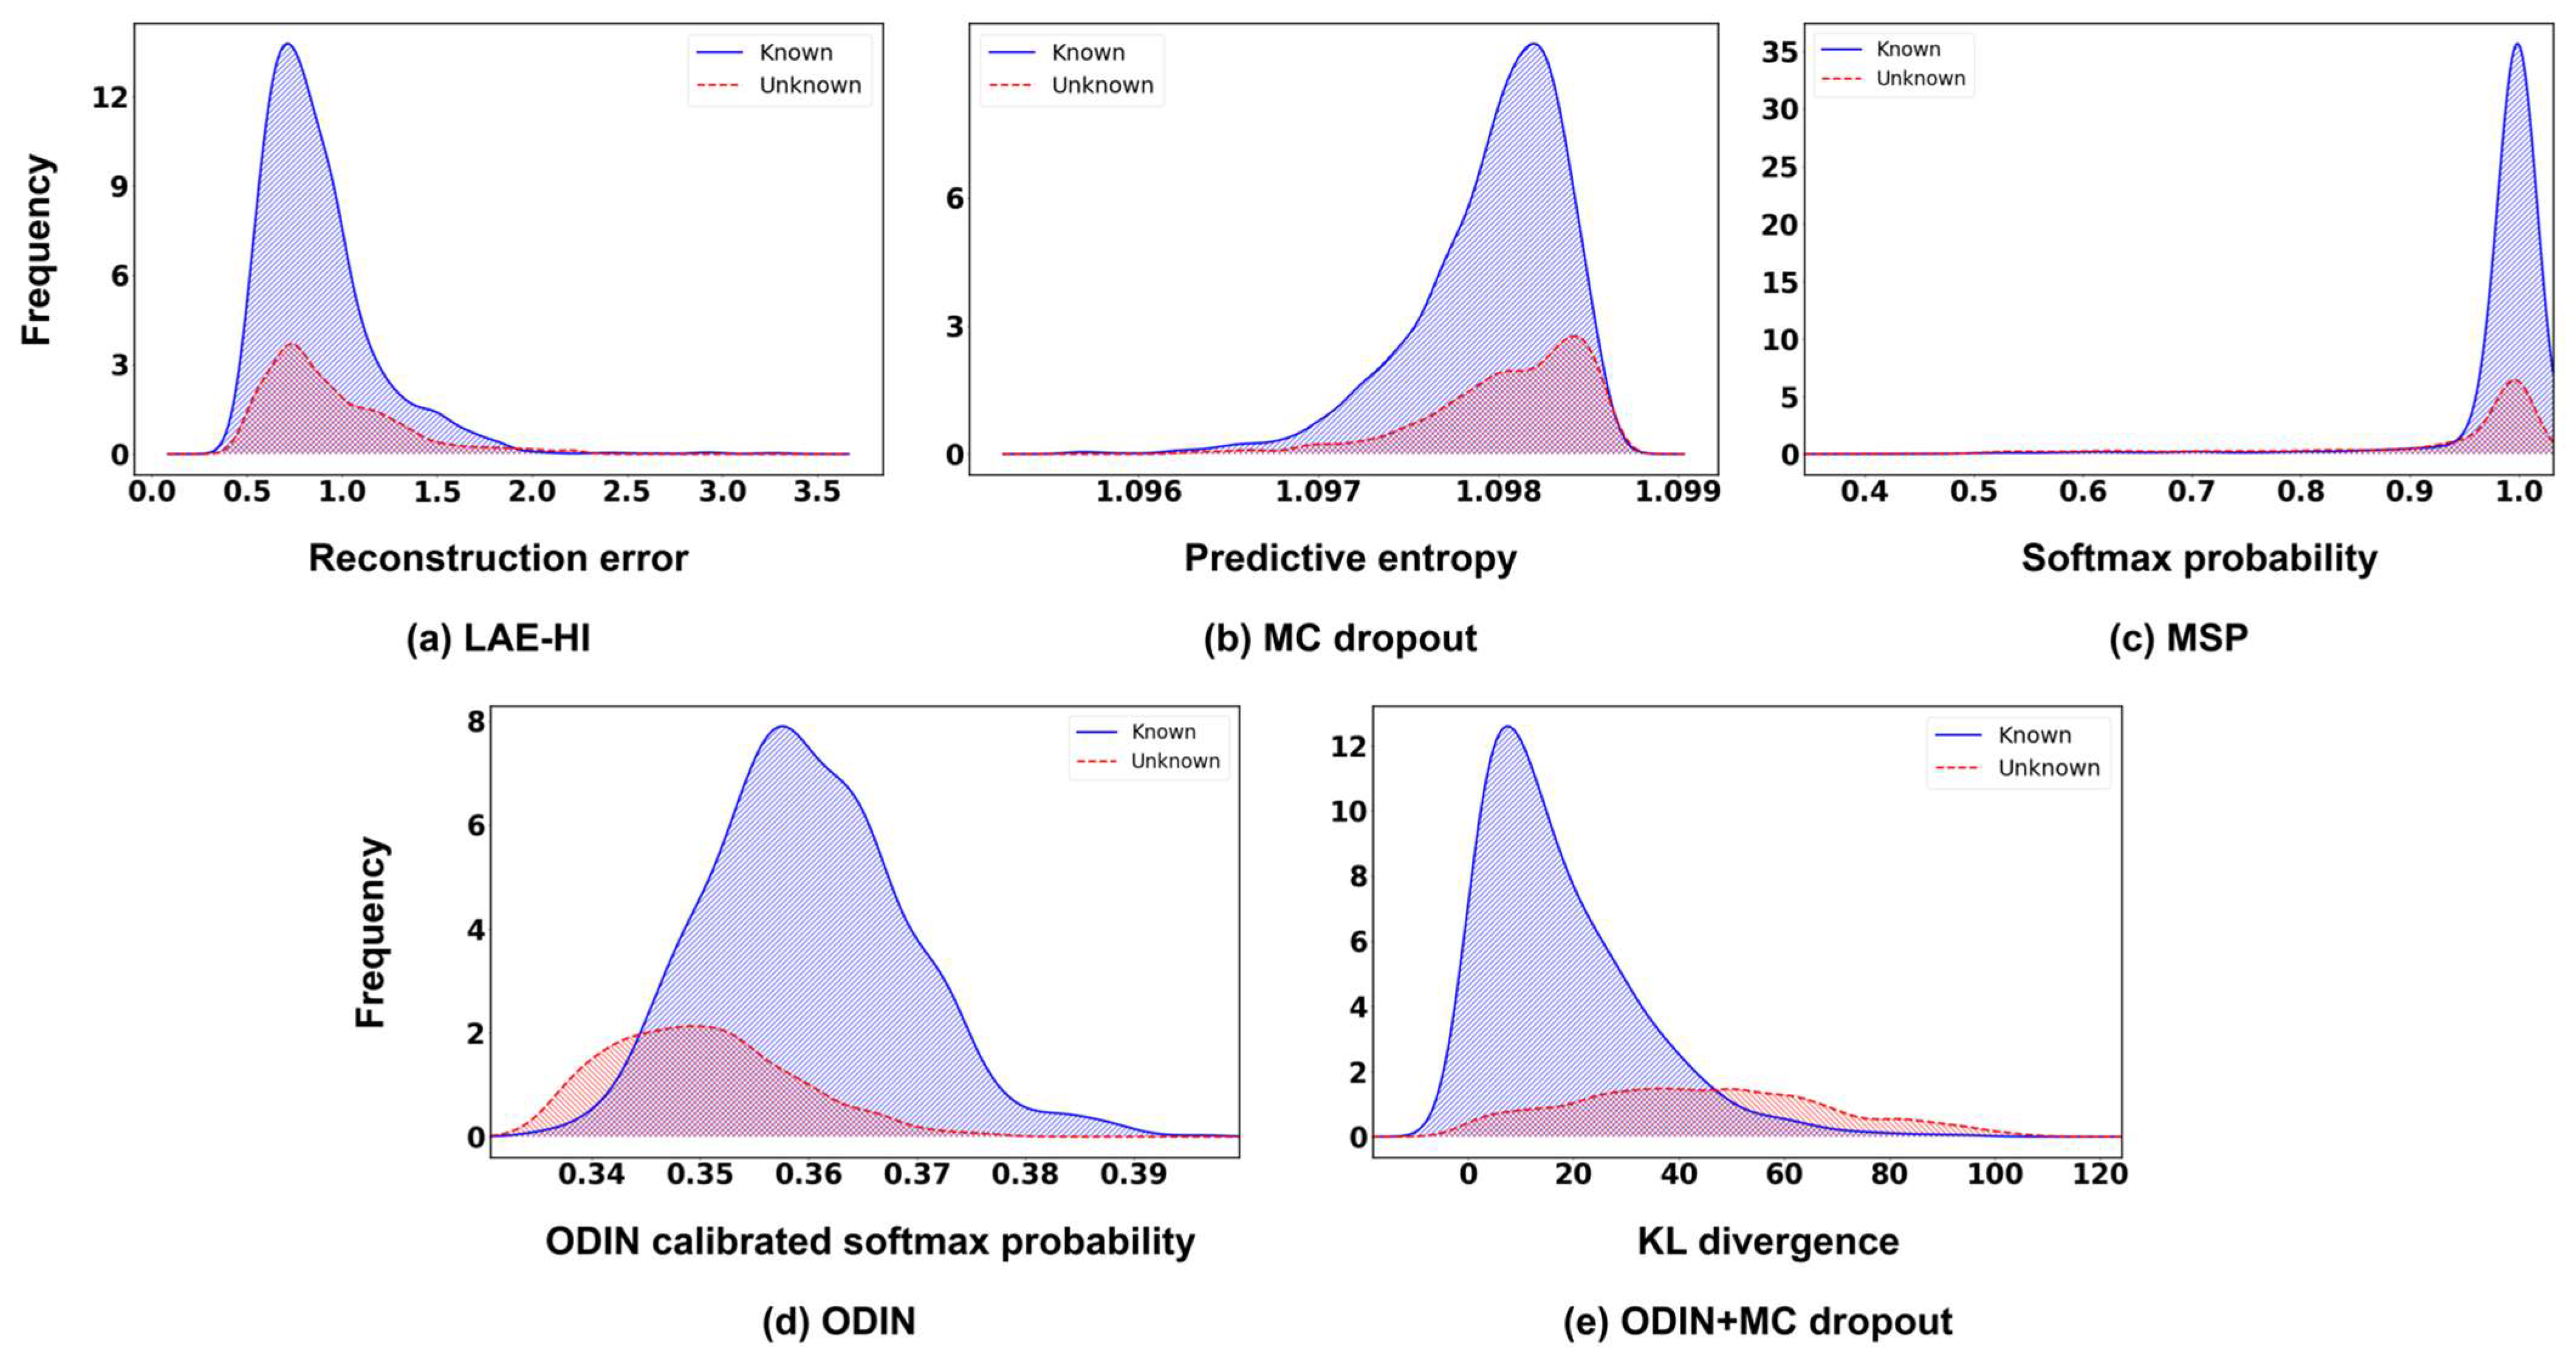
Figure 6 compares the novelty score distributions of known and unknown classes for the baseline methods and the proposed ODIN+MC dropout framework using the DeepShip dataset. In this experiment, ODIN was configured with a temperature of
and a perturbed magnitude of
. The proposed framework used a dropout rate of 0.3 and 100 stochastic forward passes during inference.
As depicted in
Figure 6a, the LAE-HI exhibits substantial overlap between the known and unknown distributions, both forming broad distribution and weakly separated reconstruction-error profiles. This indicates that LAE-HI has a limited ability to capture the structural differences required to distinguish unseen patterns. A similar limitation appears in MC dropout shown in
Figure 6b, where it produces uncertainty distributions with widely spread and highly overlapping. Although the unknown samples shift slightly toward higher uncertainty values, the large variance of both distributions makes it difficult to establish a clear and stable threshold based solely on stochastic uncertainty. The MSP method yields confidence score distributions that overlap heavily, with both known and unknown samples concentrated near the upper bound, as indicated in
Figure 6c. This indicates excessive model overconfidence and complicates threshold-based discrimination. ODIN mitigates this limitation by calibrating predictions through temperature scaling and input perturbation, thereby improving the separation between known and unknown samples (
Figure 6d). However, the two distributions remain similar in overall shape, both exhibiting symmetric bell-shaped curves centered around intermediate confidence values, which limits the effectiveness of threshold-based discrimination.
In contrast, the proposed ODIN+MC dropout method produces confidence score distributions with markedly improved separability. The confidence scores of known classes form a distinct and narrow peak concentrated around low KL divergence values, exhibiting a slightly long-tailed but asymmetric distribution that remains tightly bounded on the lower end. This right-skewed pattern indicates that most known samples are assigned low divergence values with only a few extending into higher regions, which minimizes overlap with the unknown distribution and facilitates a more stable threshold boundary. Conversely, the confidence scores of the unknown class are more broadly distributed and shifted toward higher divergence regions, leading to minimal overlap with the known-class distribution. This pronounced structural distinction between the two distributions facilitates more stable and reliable threshold determination for novelty detection.
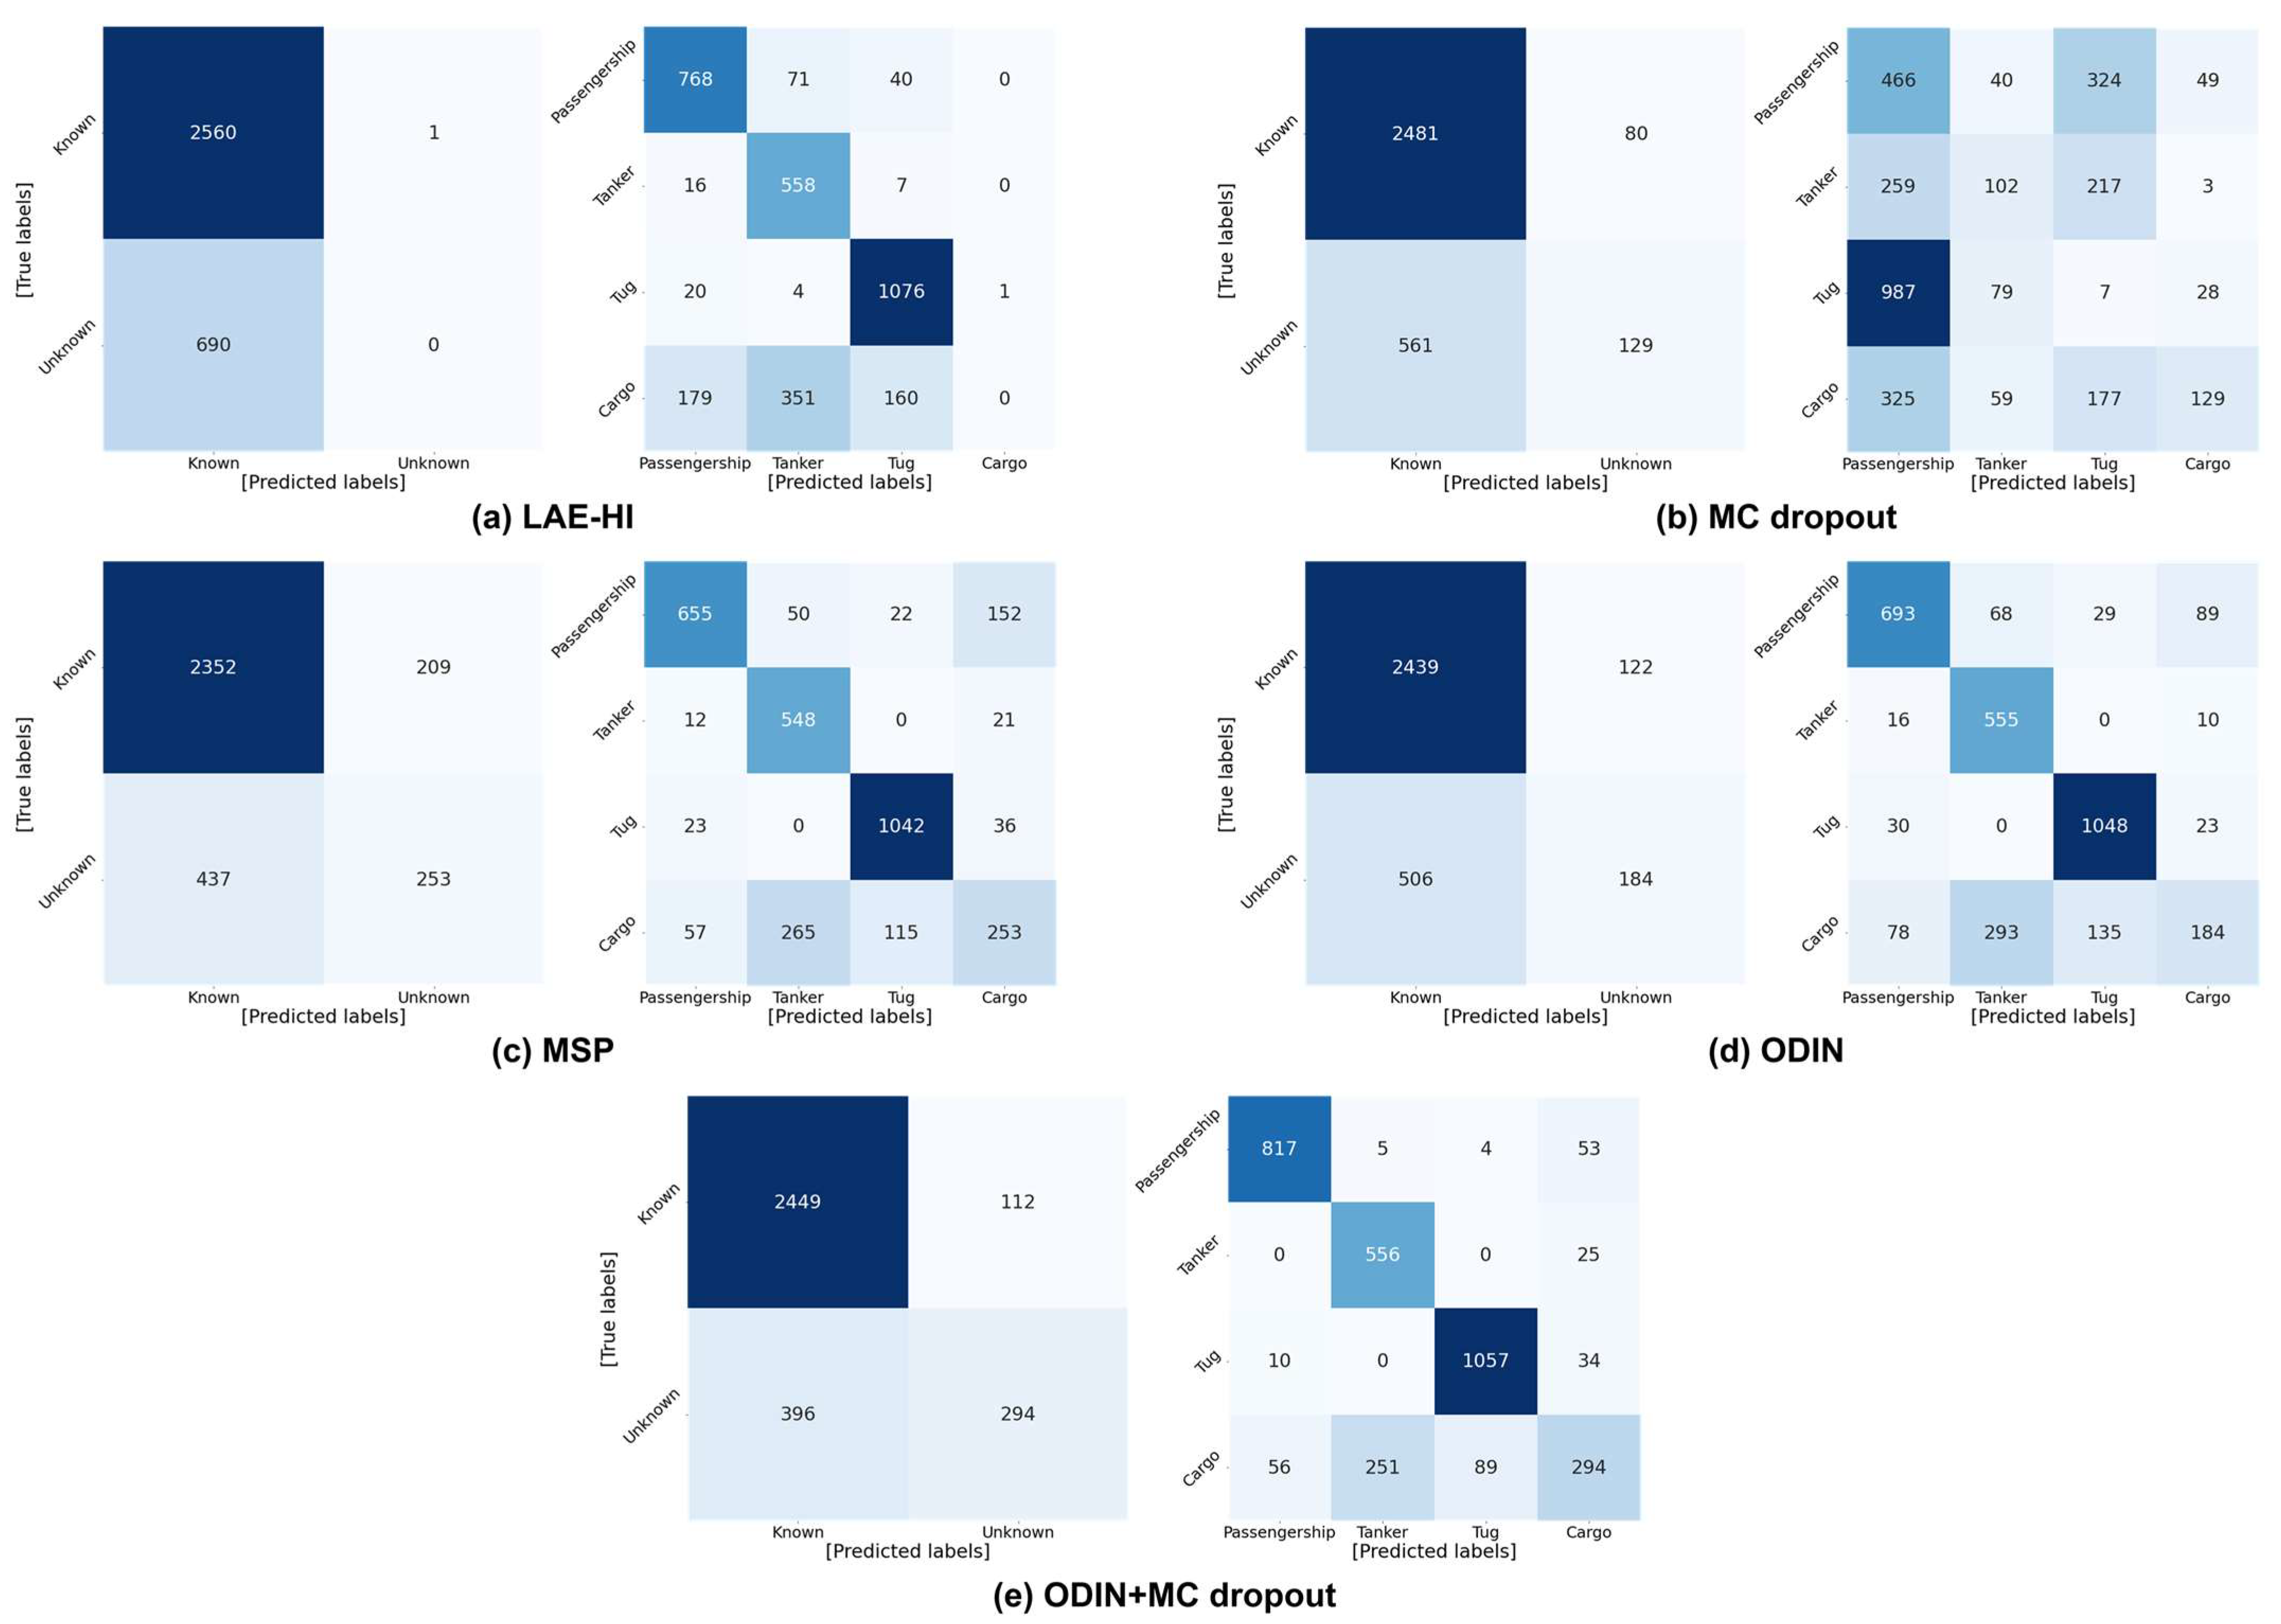
In real-time novelty detection scenarios, a threshold must be determined to decide whether an input belongs to a known or unknown class. In this work, the threshold was selected at the point where FPR@95TPR is minimized, and novelty detection was evaluated using binary and multi-class confusion matrices. The experimental settings specify the novelty label as Cargo, a temperature scaling factor of 100, and an input perturbation magnitude of 0.01. The resulting binary and multi-class confusion matrices for all evaluated methods are presented in
Figure 7, illustrating the comparative performance of each approach under these conditions.
Although LAE-HI provides strong classification performance for known classes, it entirely fails to identify unknown samples. This indicates that the conventional novelty detection approach is ineffective at correctly classifying unknown inputs as unknown. MC dropout offers enhanced binary-detection performance compared to LAE-HI, increasing the number of unknown samples correctly identified unknown samples from 0 to 129. However, its multi-class accuracy degrades from 0.610 to 0.213, due to the influence of predictive entropy, making it less reliable for distinguishing known classes.
MSP, which relies on softmax confidence, achieves a reasonable level of multi-class accuracy (0.768) while improving unknown detection, but it still misclassifies a noticeable proportion of known samples as unknown, resulting in a binary accuracy of 0.801 and limiting its reliability. ODIN achieves slightly higher binary accuracy (0.807) but lower multi-class accuracy (0.763), indicating that it is more conservative in labeling inputs as unknown. Finally, the proposed MC dropout+ODIN approach integrates the strengths of both uncertainty estimation and calibrated softmax responses, achieving the best performance across all metrics. It not only achieves the highest binary accuracy (0.844) and F1 score (0.906) for unknown detection but also maintains strong classification performance for known classes, as evidenced by the multi-class accuracy of 0.838. These results confirm that the proposed method offers the most balanced and robust performance for novelty detection and accurate classification of known classes.
5.1. Analysis of ODIN Effect
This subsection examines the influence of ODIN calibration on enhancing novelty detection within the proposed framework. To isolate the effect of each component, the temperature parameter and perturbation magnitude are varied independently, and their impact on the separability between known and unknown softmax distributions is analyzed. This ablation study evaluates the individual contributions of temperature scaling and input perturbation to confidence calibration and class separability, as well as their combined effect on the performance of divergence-based novelty scoring.
The distributional characteristics of known and unknown samples are analyzed by visualizing their confidence score histograms under different parameter settings. These comparisons illustrate the individual effects of temperature scaling and input perturbation, as well as the combined impact of both techniques, clarifying their respective and joint contributions to the effectiveness of the proposed novelty detection framework.
5.1.1. Impact of Temperature Scaling on Performance and Distribution
To examine the effect of temperature scaling, the input perturbation magnitude is fixed at 0 while the temperature scaling factor is varied. This configuration isolates the influence of temperature on the softmax output distribution and its subsequent impact on novelty detection performance.
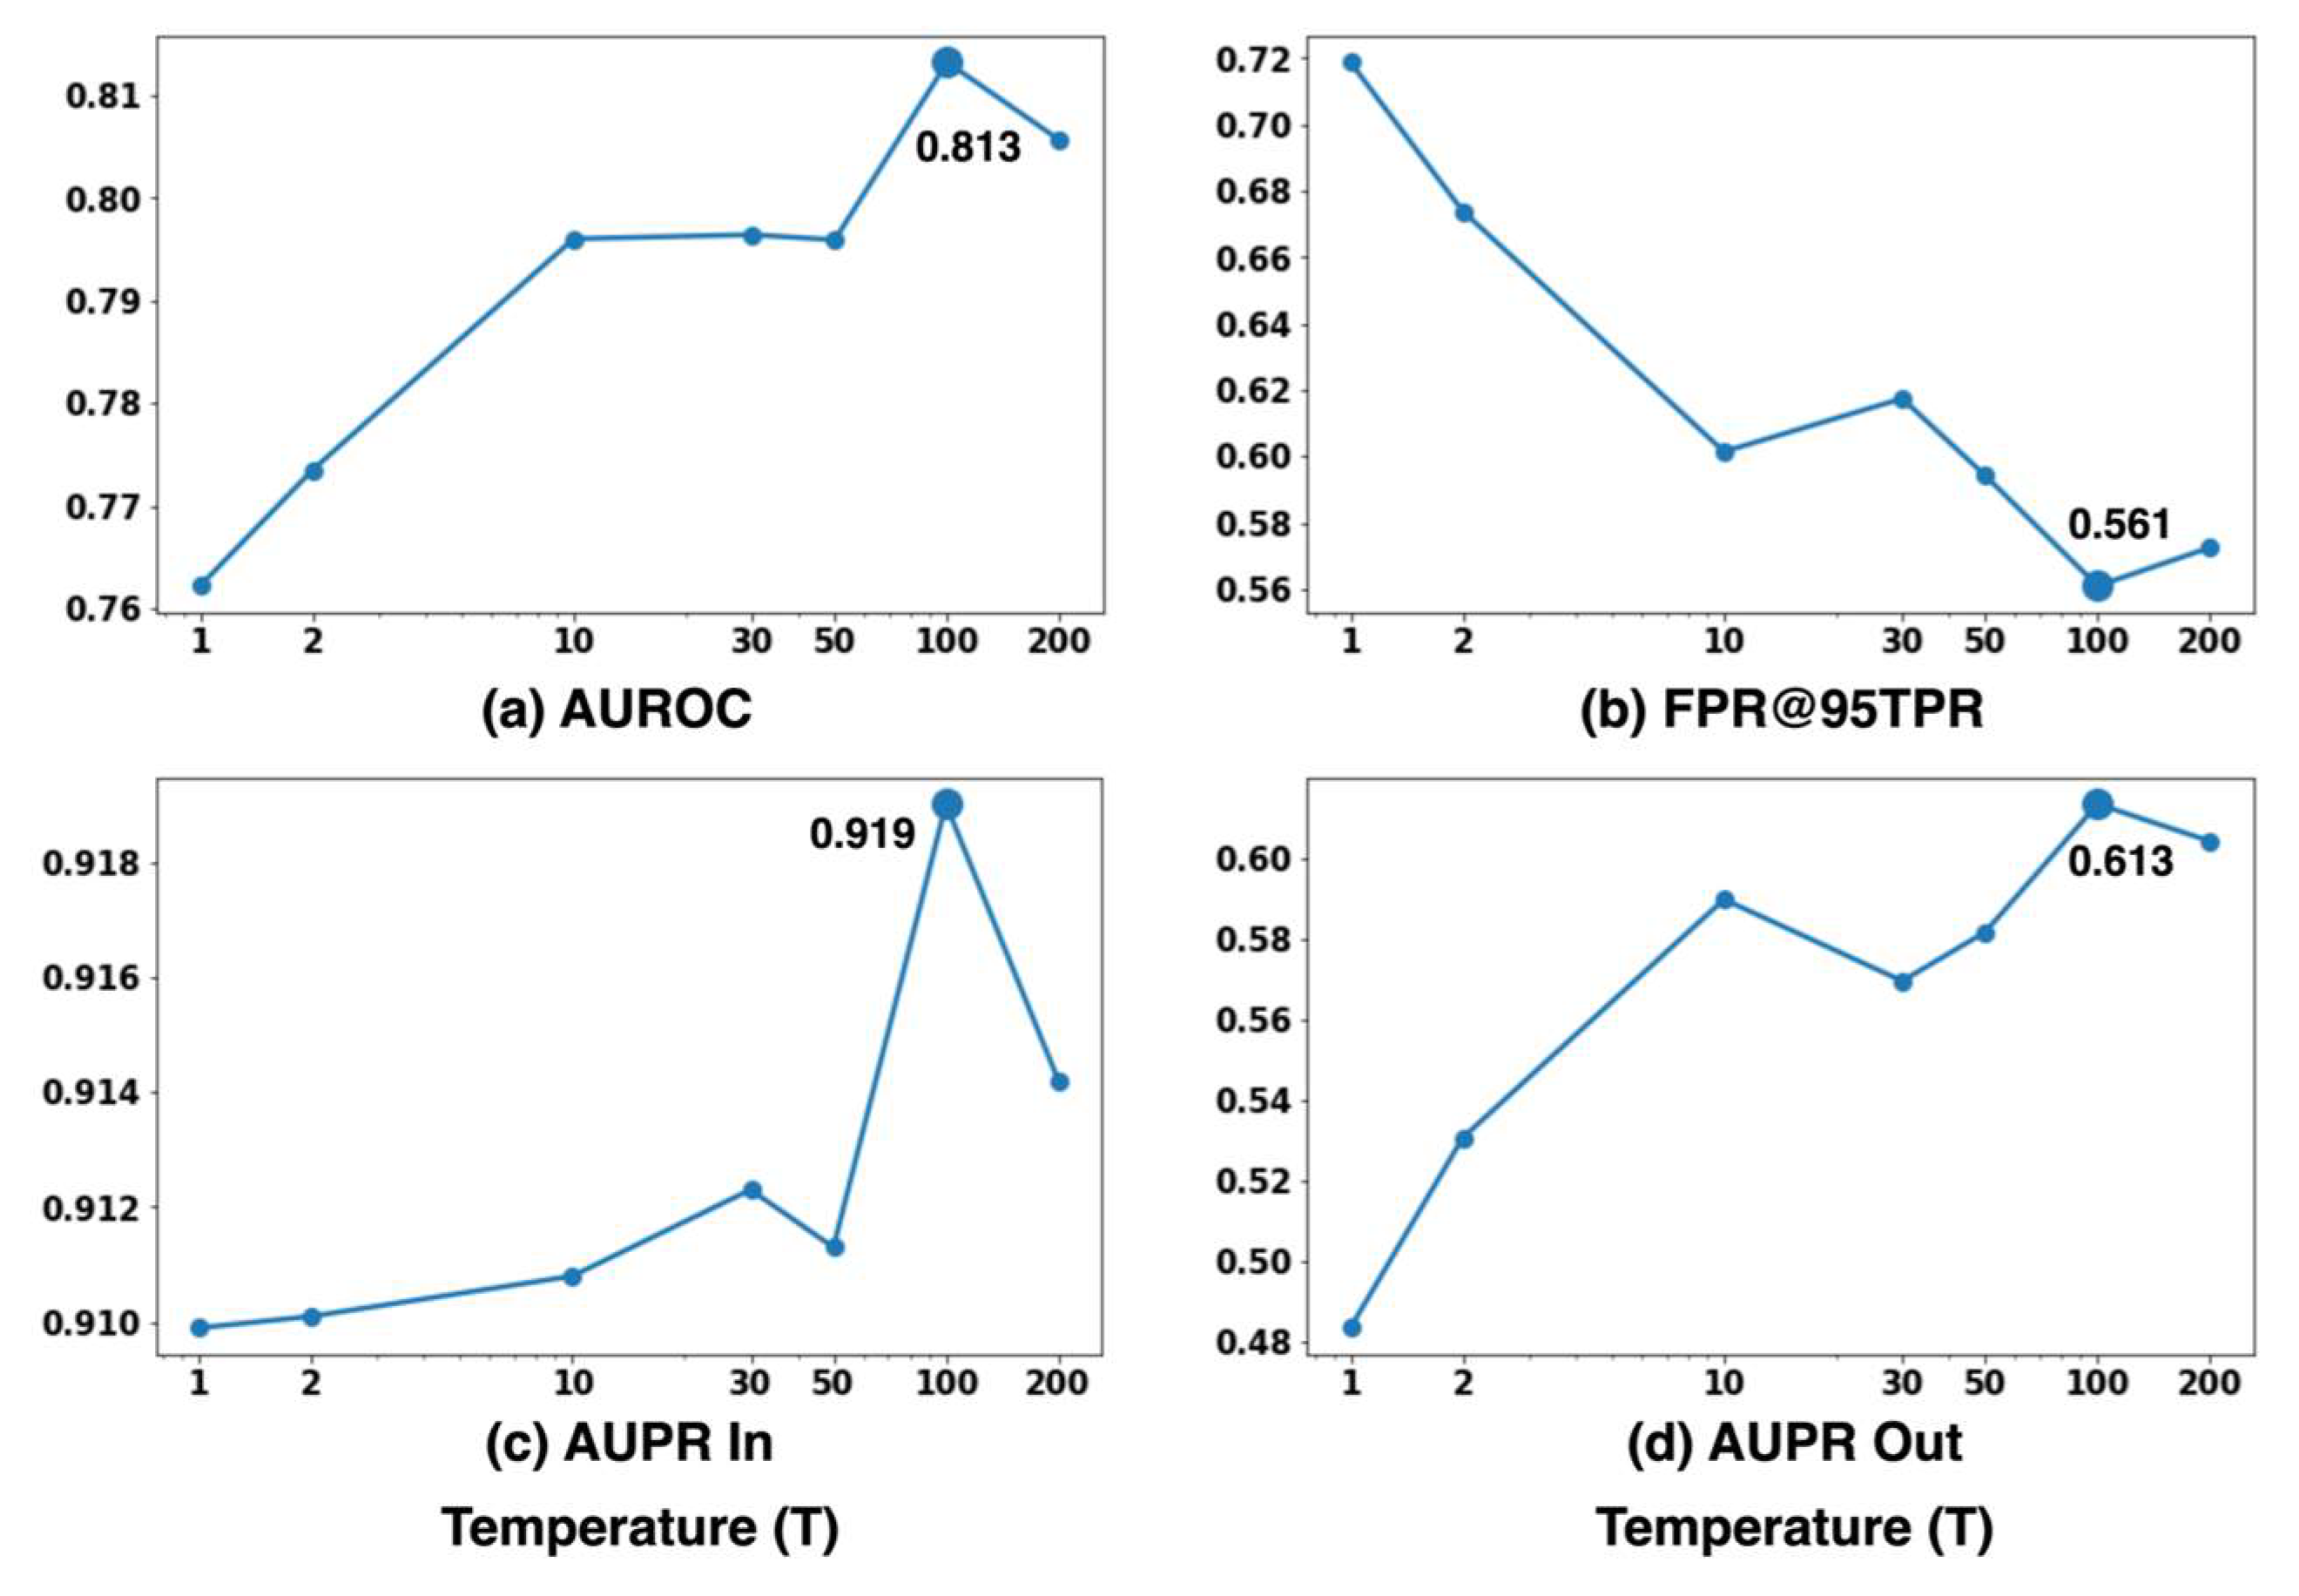
Figure 8 illustrates the effect of temperature scaling on novelty detection performance using the proposed ODIN+MC dropout method. The AUROC value increases consistently with temperature, reaching its maximum of 0.813 at
, after which a slight performance decline is observed. Similarly, FPR@95TPR decreases as temperature rises, with the lowest value obtained at
, indicating improved reliability in distinguishing between known and unknown samples. The AUPR In also shows a notable improvement at
, peaking at
, demonstrating a more favorable precision-recall balance for known-class detection. Lastly, AUPR Out increases with temperature and attains its highest value of 0.613 at
before experiencing a minor reduction.
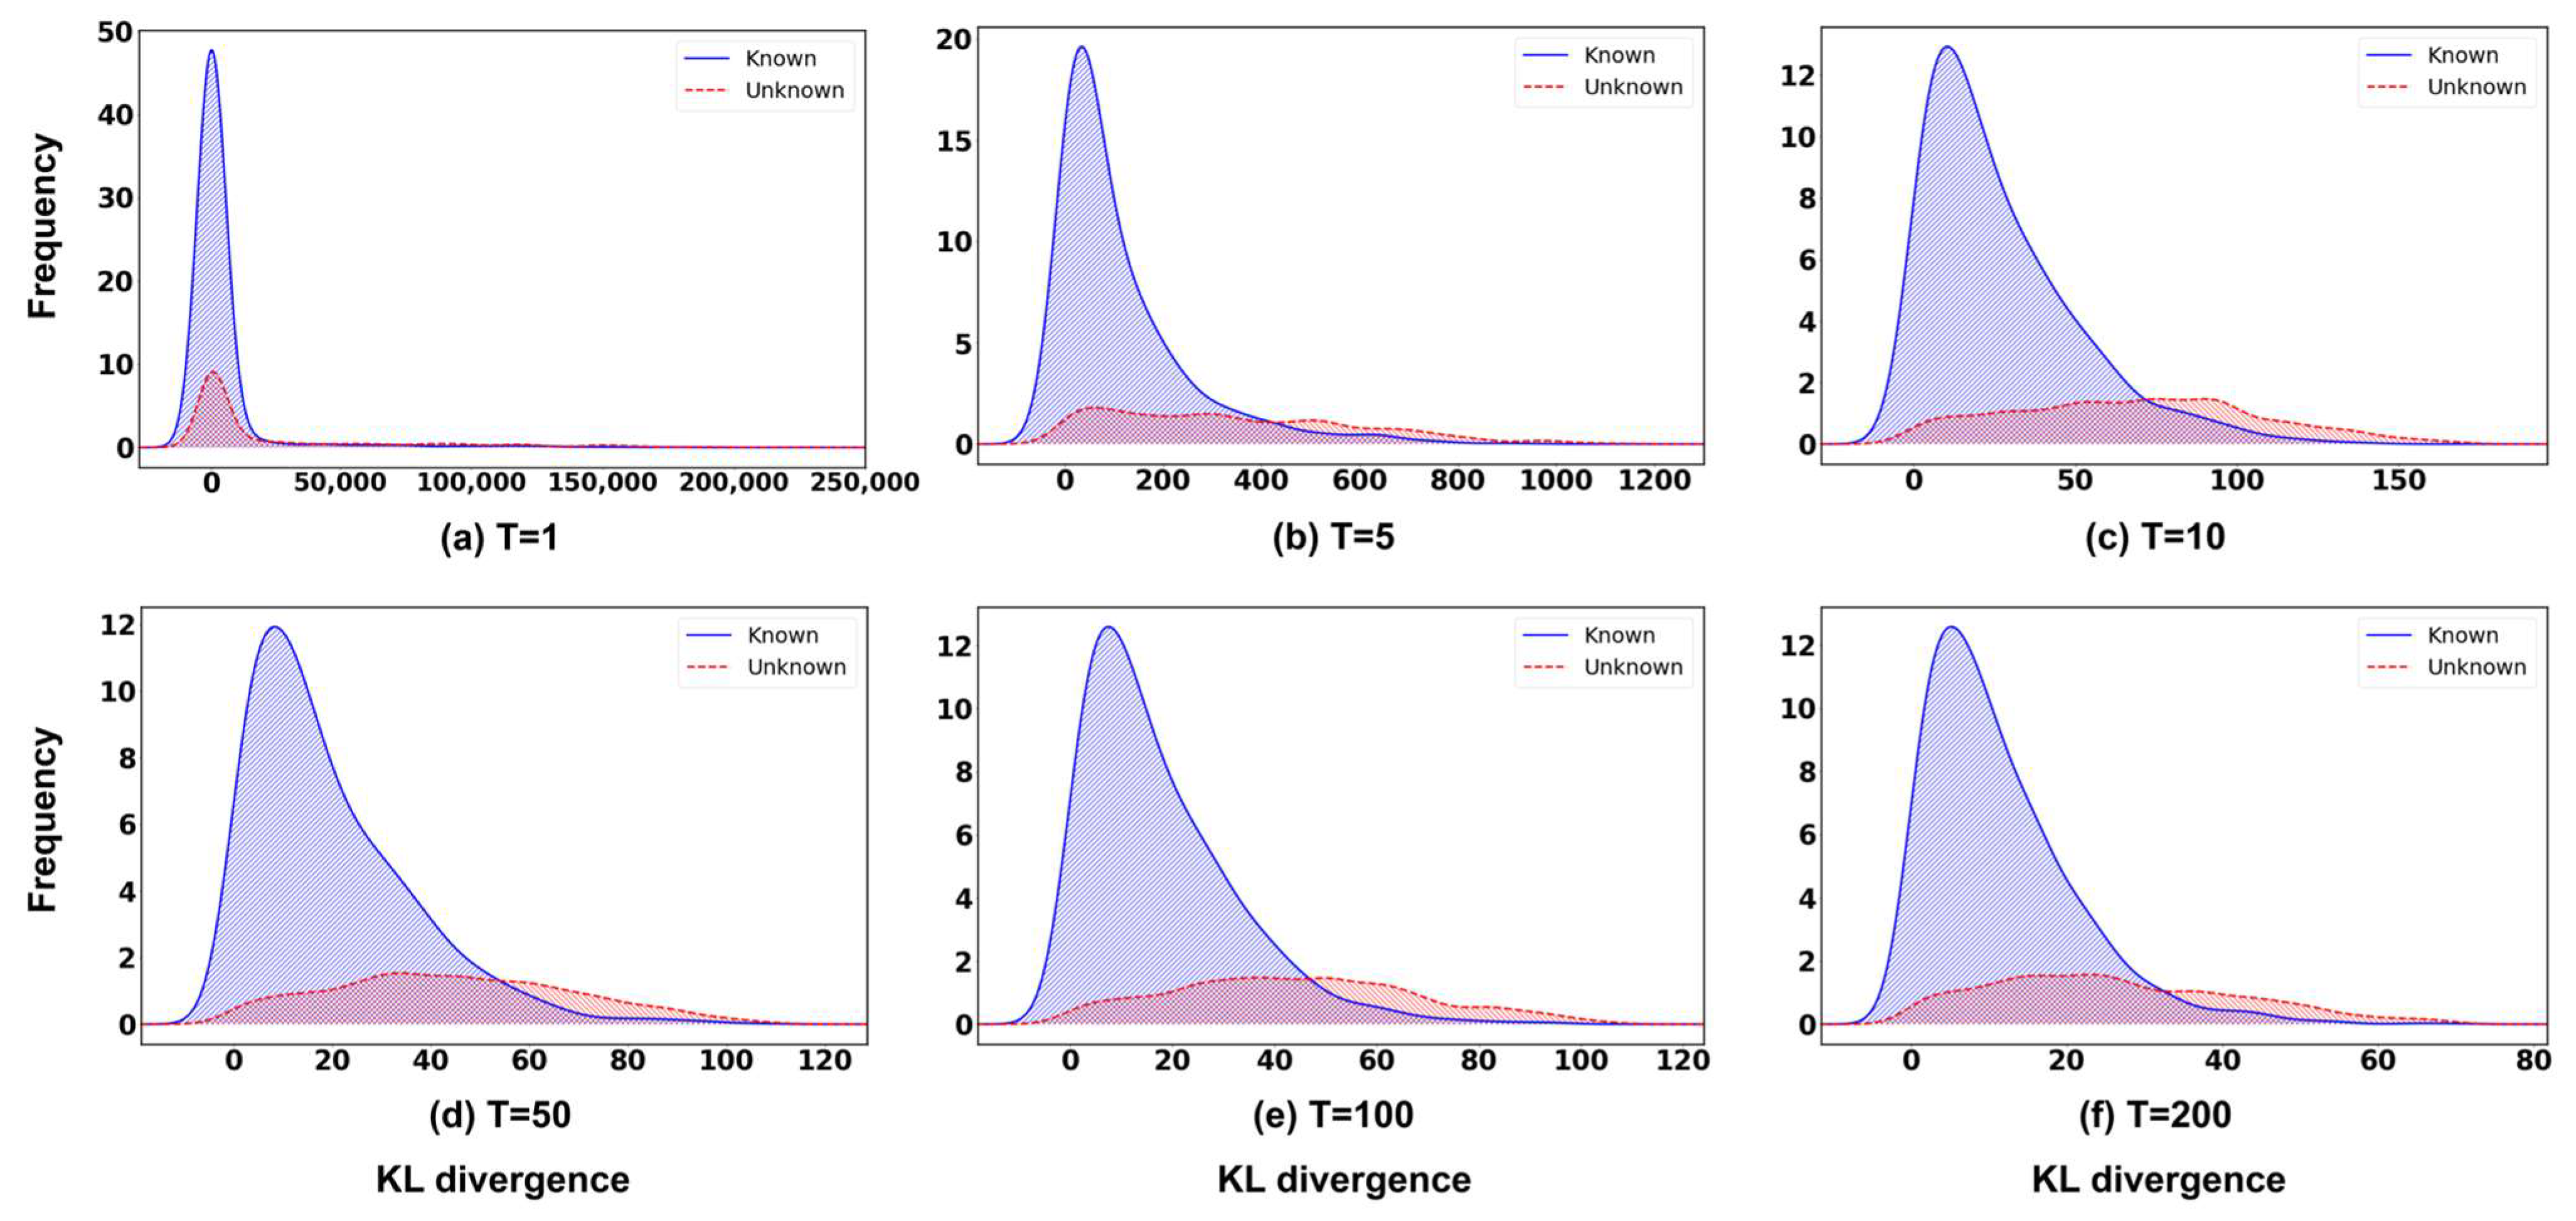
Figure 9 illustrate the influence of temperature scaling on the confidence score distributions for known and unknown samples. At lower temperature values, both distributions are densely concentrated near zero, indicating overconfident predictions and poor separability between known and unknown data. As the temperature increases, the confidence scores of known samples shift toward lower divergence values, while the scores of unknown samples become more widely dispersed across a broader range. The most distinct distributional separation is observed at
, where the overlap between the two distributions is minimized. Beyond this temperature, the overlap increases once more. These results indicate that moderate temperature scaling effectively mitigates model overconfidence and enhances the contrast between known and unknown confidence patterns, improving novelty detection performance. However, when
becomes excessively large, the separation degrades slightly, likely due to the over-smoothing effect imposed on the softmax outputs.
These findings collectively demonstrate that temperature scaling effectively reduces the overconfidence tendency of neural networks, even in underwater acoustic environments. Specifically, a temperature value around consistently provides stable and well-calibrated confidence estimation across all evaluation metrics, confirming that ODIN’s temperature scaling mechanism functions as intended within the proposed ODIN+MC dropout framework.
5.1.2. Impact of Perturbation Magnitude on Performance and Distribution
To examine the effect of input perturbation, the temperature scaling factor is fixed at , while the perturbation magnitude is varied. This configuration isolates the influence of gradient-based input perturbation on the softmax confidence distributions and its subsequent impact on novelty detection performance.
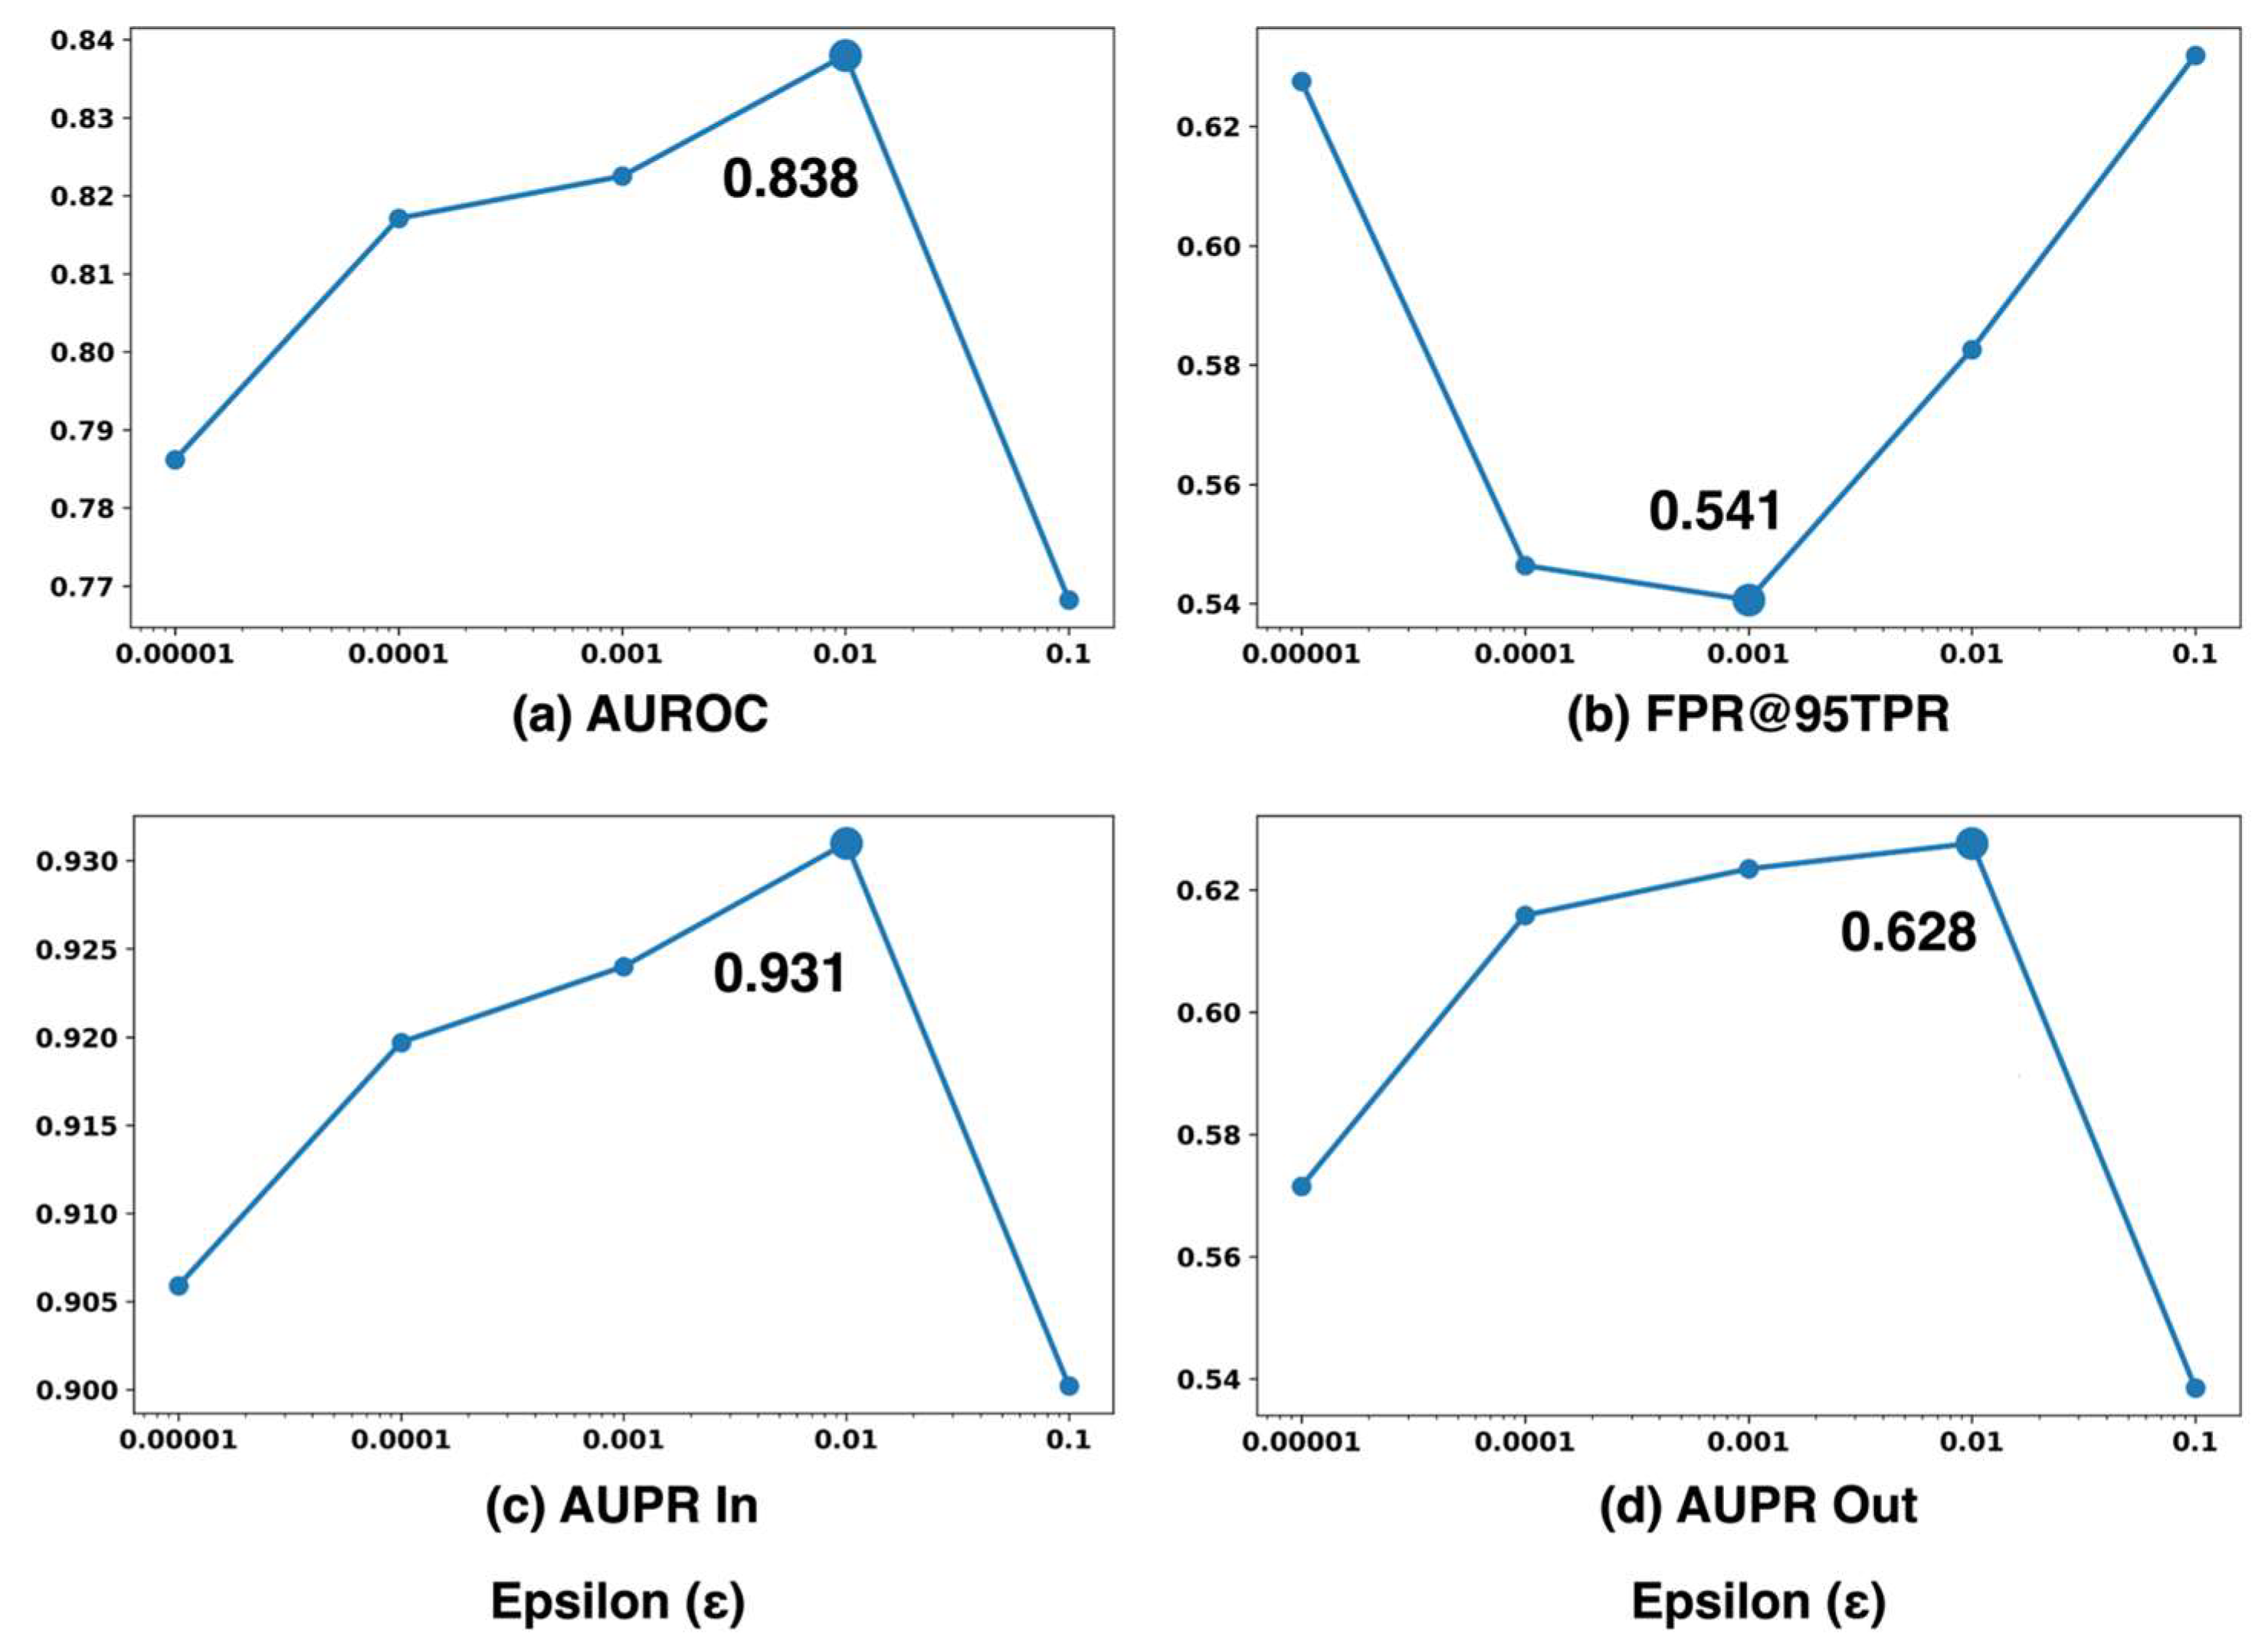
Figure 10 shows novelty detection performance for different perturbation when Cargo is the novelty label. As shown in the figure, AUROC increases consistently as
rises from
to
, reaching its maximum value of 0.838 at
(
Figure 10). Beyond this point, performance begins to decline, suggesting that excessively large perturbations introduce unnecessary distortion to the input data. AUPR In and AUPR Out exhibit similar trends, achieving peak values of 0.931 and 0.628, respectively, at
. These results indicate that a perturbation magnitude of 0.01 provides the optimal balance, enhancing both the separability and calibration of confidence scores for effective novelty detection.
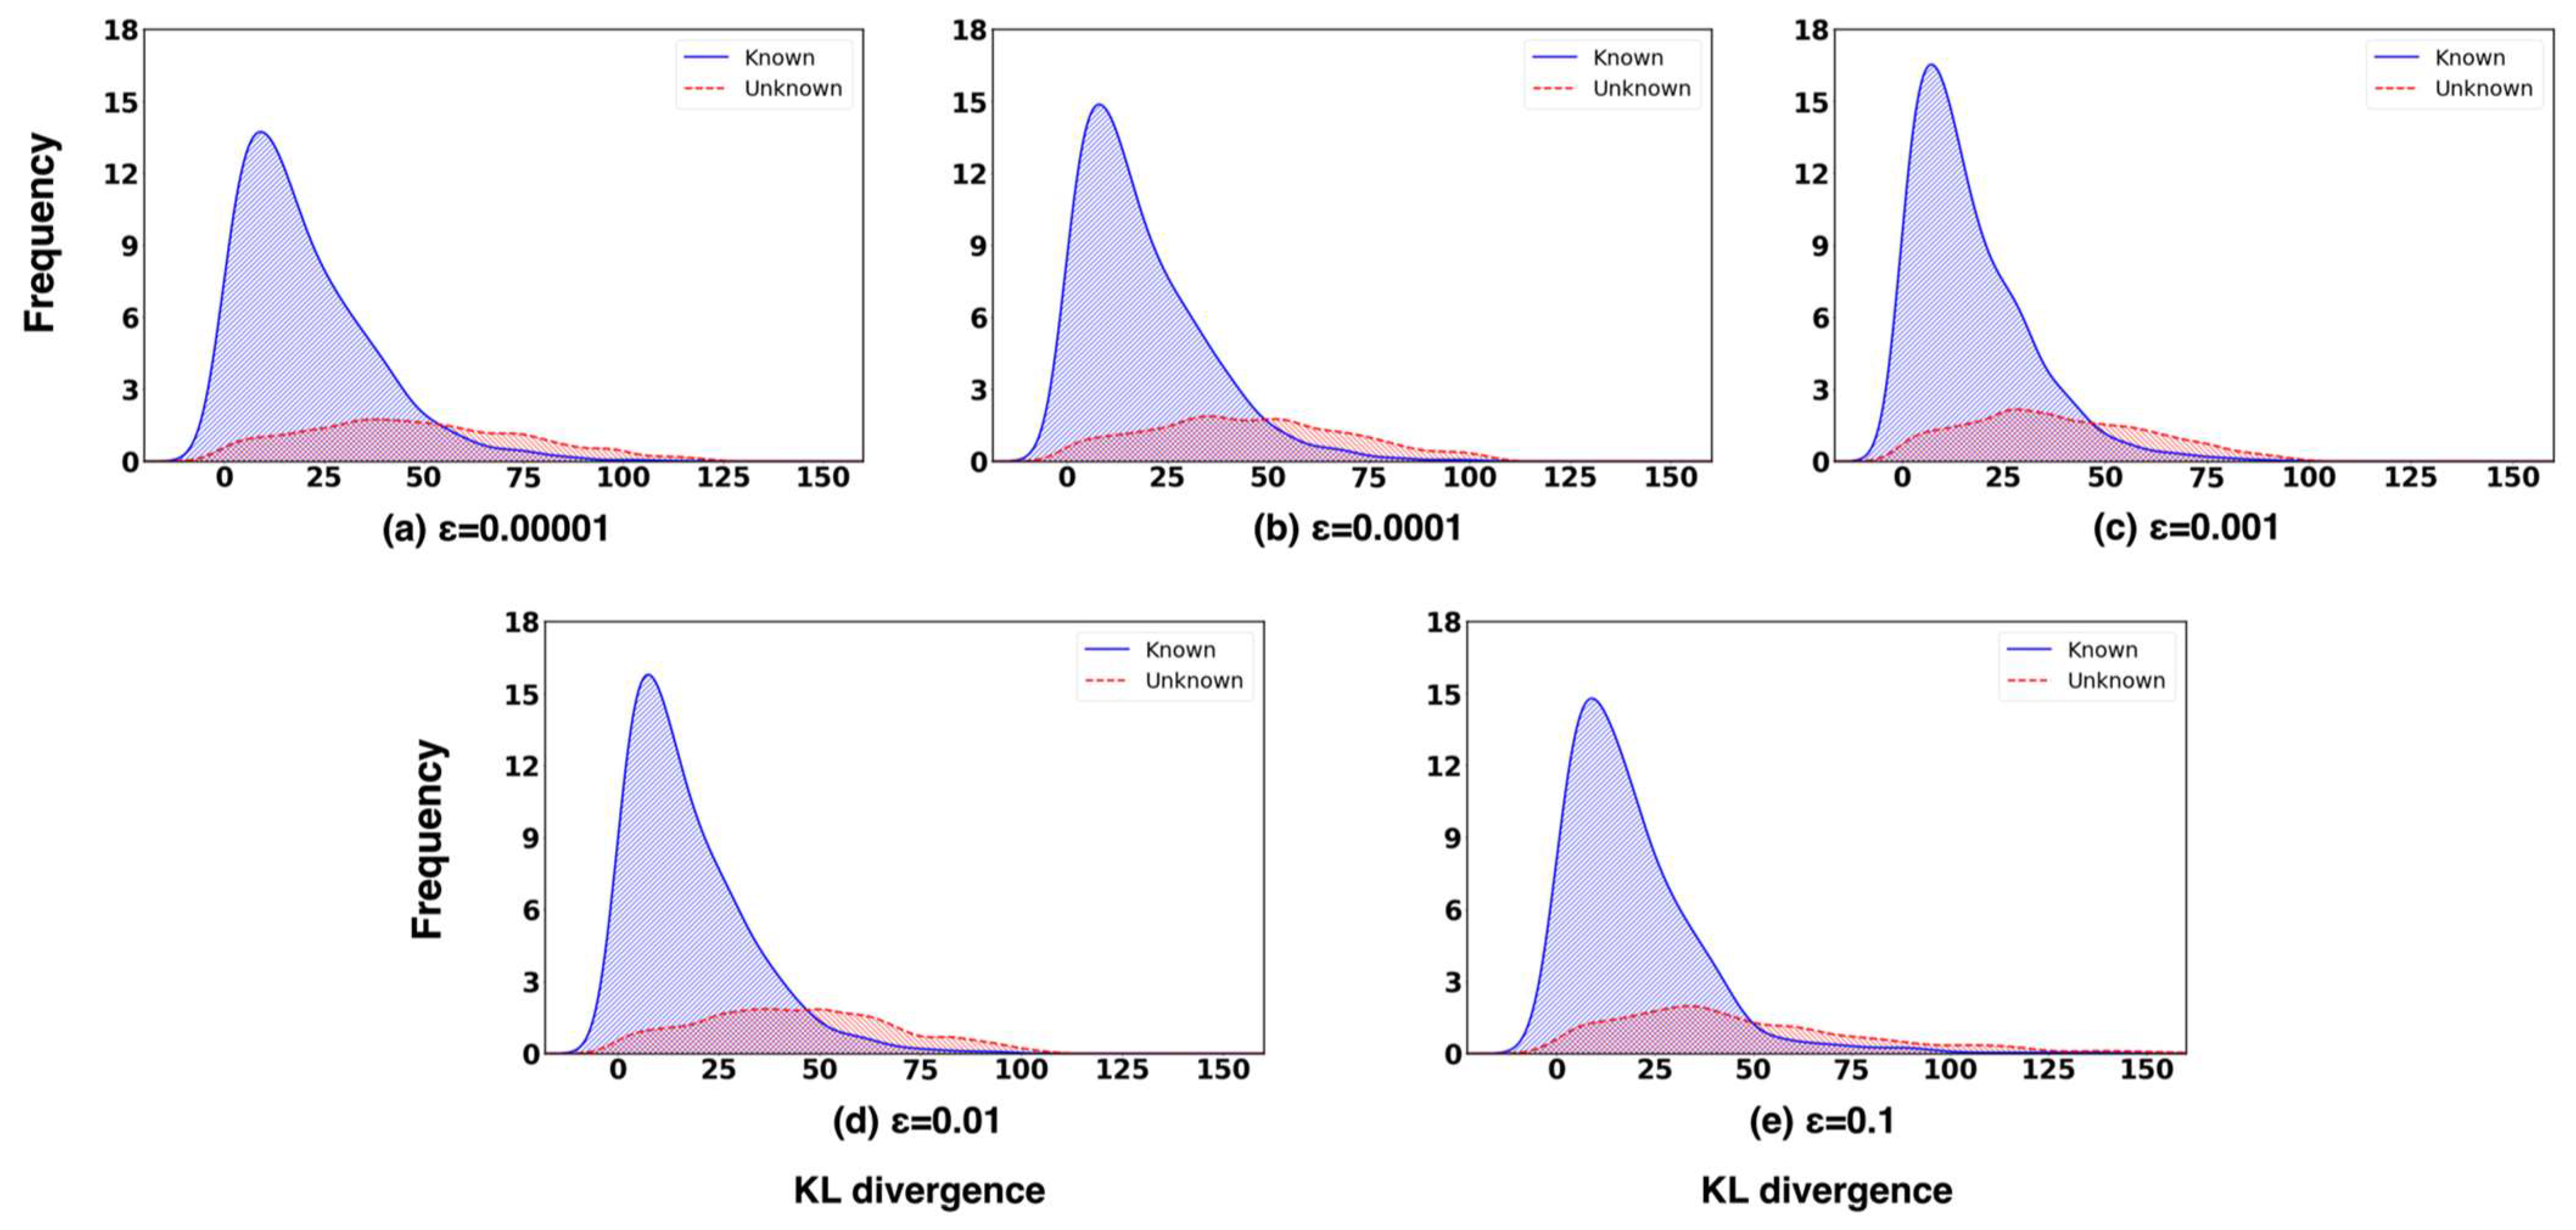
Figure 11 presents the confidence score distributions of known and unknown classes across different perturbation magnitudes
. Each subplot corresponds to a specific
value, where the distributions of known and unknown samples are depicted in blue and red, respectively. As the
value increases from
to
, the overlap between the confidence score distributions of known and unknown samples gradually decreases, indicating improved separability. At
, the overlap reaches its minimum, and the region exclusively occupied by unknown samples becomes the widest. This distinct unknown-only region demonstrates that the model assigns clearly differentiated confidence scores to unknown inputs, enabling more reliable and consistent rejection decisions.
The FPR@95TPR exhibits a distinct trend compared to the other evaluation metrics. It decreases steadily as increases, reaching its minimum value at , but begins to rise again once > 0.01. Interestingly, although performance slightly declines at for this specific metric, the overall improvements observed in AUROC, AUPR In, and AUPR Out compensate for this reduction. These results suggest that small perturbations effectively reduce false positives, but their benefit diminishes when the perturbation strength becomes excessively large.
Overall, it was observed that yielded optimal performance across most evaluation metrics. These results highlight the importance of carefully tuning to achieve an appropriate balance between robustness and confidence sensitivity within the proposed ODIN+MC dropout framework.
Beyond , the overlap between the known and unknown confidence score distributions begins to increase again, while the unknown-only region becomes narrower. This behavior indicates that excessive perturbation distorts input features, diminishing the model’s ability to distinguish unknown samples effectively. Consequently, the confidence scores become less stable, and the separation between known and unknown classes weakens, leading to reduced novelty detection reliability.
These observations confirm that appropriately tuned levels of input perturbation not only reduce distributional overlap but also enhance separability by expanding the region exclusively occupied by unknown samples. This structural improvement within the confidence score space reinforces the effectiveness of the proposed ODIN+MC dropout framework in novelty detection.
5.2. Analysis of MC Dropout Effect
The contribution of MC dropout is examined by varying the number of stochastic forward passes performed during inference, where . For each configuration, ODIN-calibrated softmax outputs are obtained and used to fit a sample-specific GMM, which is subsequently compared with the class-wise reference GMMs to compute divergence-based OOD scores.
To isolate the effect of
on performance, all other parameters are held constant: the temperature scaling factor is fixed at
, the input perturbation magnitude at
, the dropout rate at 0.3, and the novelty class is set to Cargo.
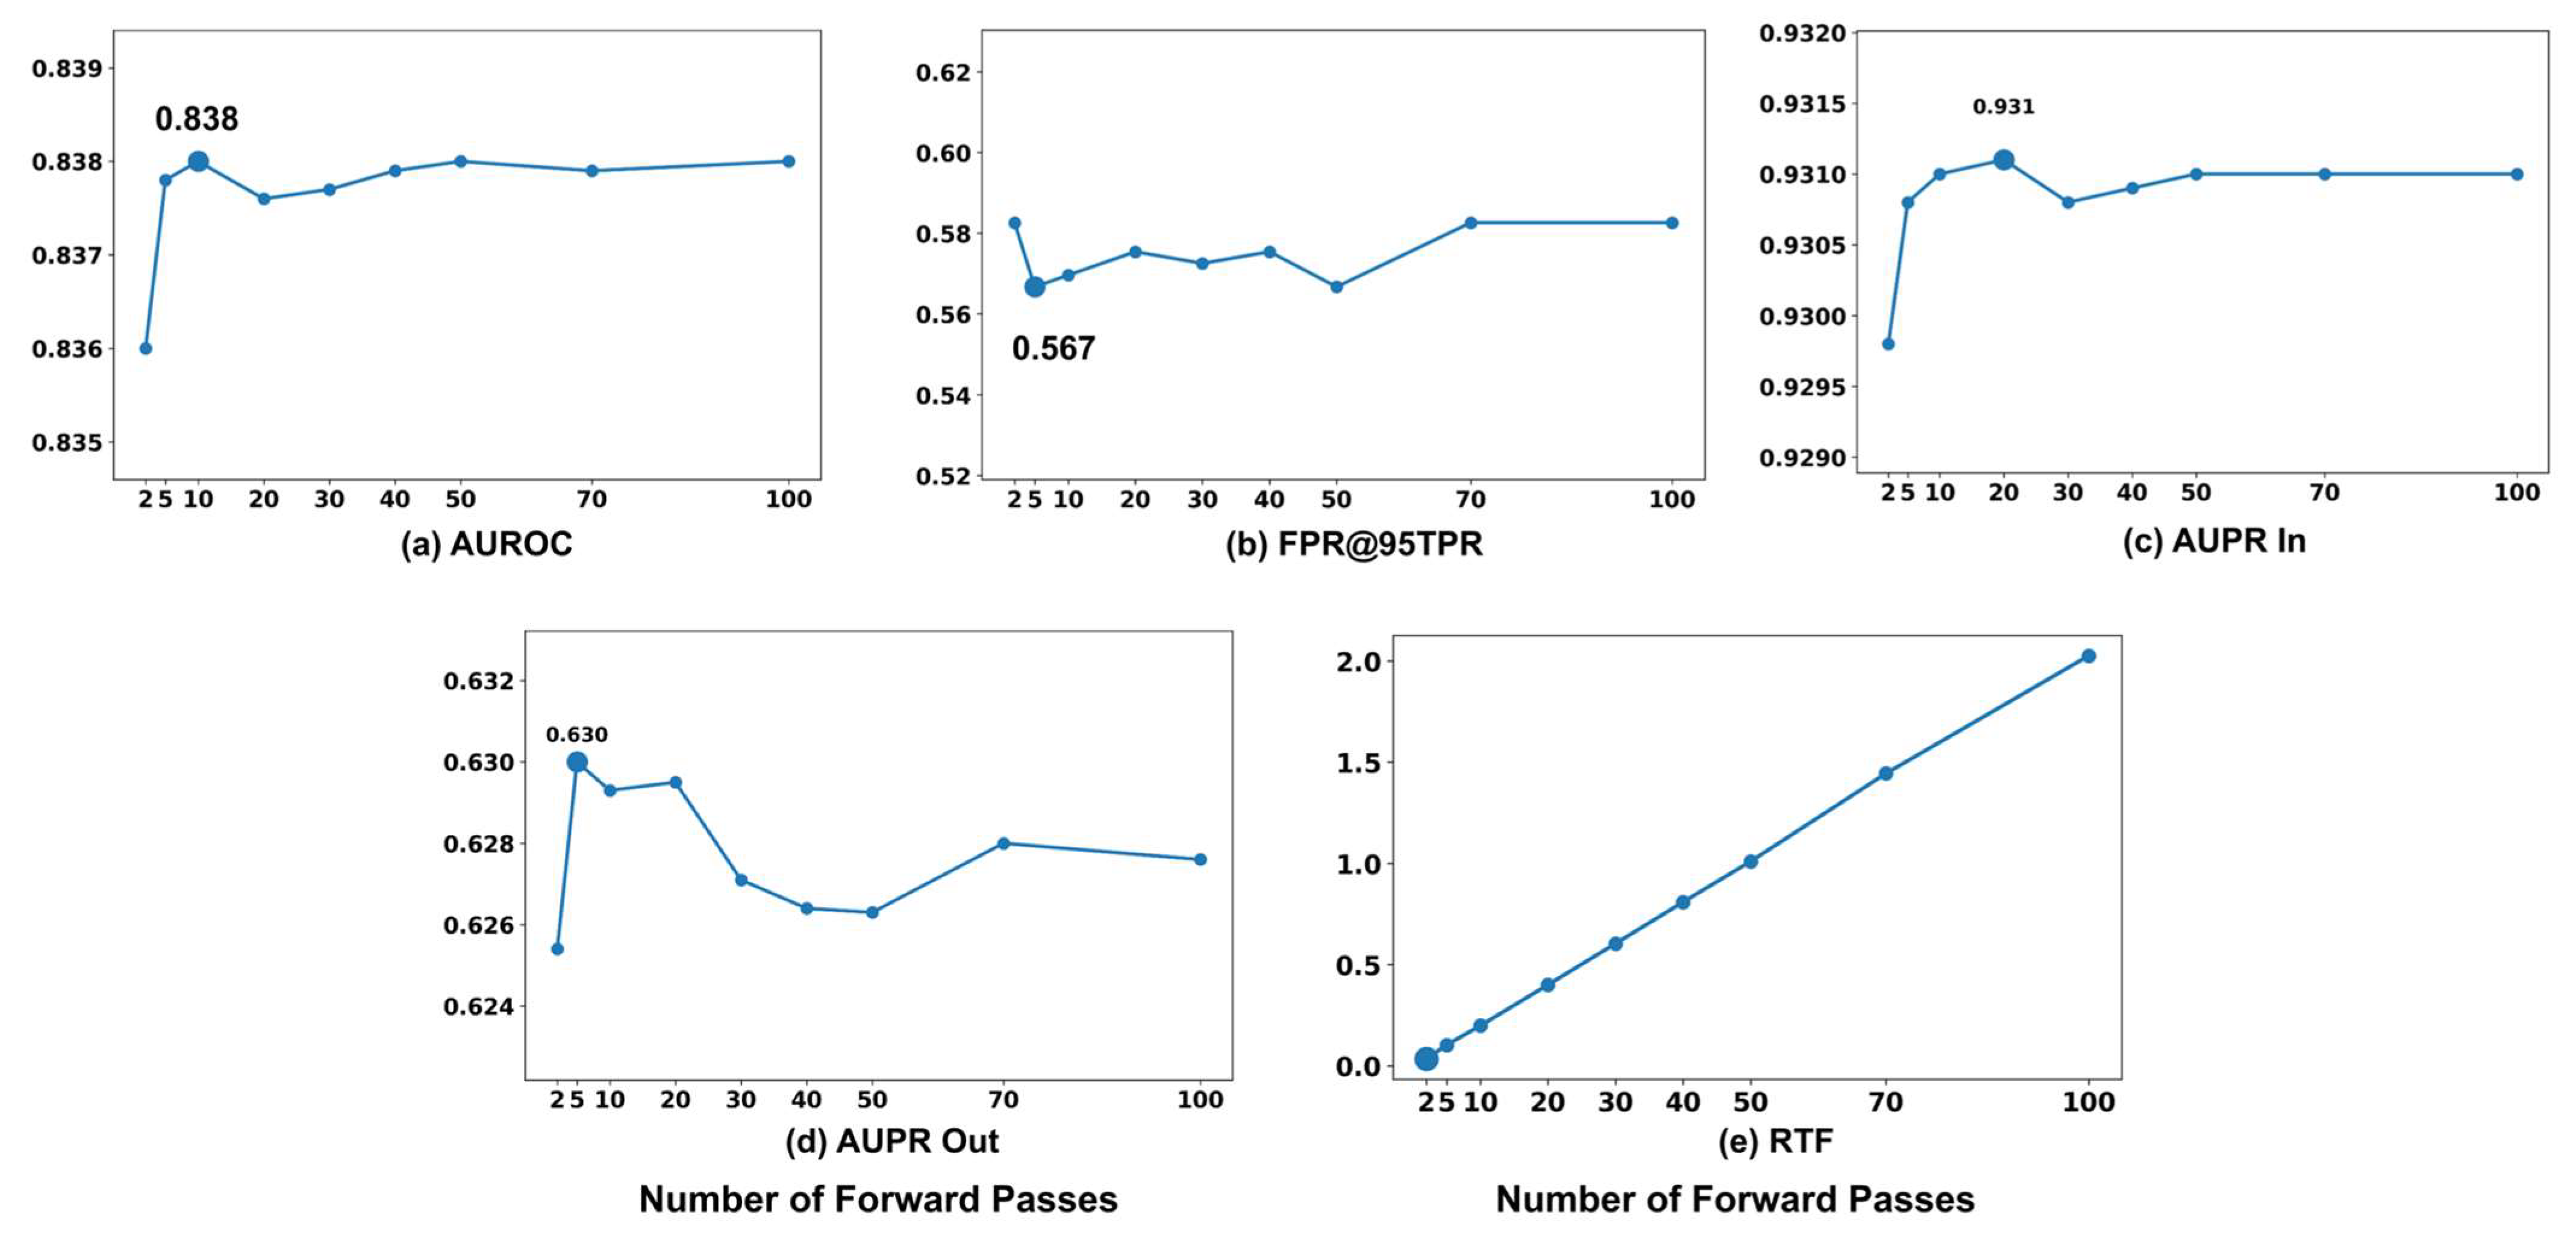
Figure 1 illustrates the impact of the number of forward passes
used in MC dropout on novelty detection performance. The parameter
is varied over
. AUROC increases sharply as
rises from 2 to 10, reaching its peak value of 0.838 at
. Beyond this point, further increases in
result in negligible performance changes, with only minor fluctuations observed. AUPR In follows a similar pattern, stabilizing after achieving its maximum value of 0.9311 at
. As shown in the figure, FPR@95TPR decreases steadily as
increases from 2 to
, reaching its minimum value of 0.567, after which minor oscillations are observed with further increases in
. This trend indicates that a relatively small number of forward passes is generally sufficient to minimize false positives. AUPR Out exhibits a similar pattern, peaking at
and gradually declining thereafter, likely due to over-smoothing effects in confidence distributions when
is large.
To explicitly evaluate the performance-complexity trade-off,
Figure 12e presents the real time factor (RTF) as a function of
. As clearly illustrated, the RTF exhibits a strict linear increase with the number of stochastic forward passes. While the detection metrics saturate relatively early, the computational cost continues to grow linearly. For instance, increasing
to 100 drastically inflates the RTF to over 2.0 without yielding meaningful performance improvements compared to lower values. Based on this trade-off analysis, selecting a moderate number of forward passes is recommended to achieve robust uncertainty estimation while maintaining a low RTF suitable for practical deployment.
These findings indicate that increasing improves performance up to a certain threshold, beyond which the benefits plateau. The performance gain from using more than stochastic samples is marginal across most metrics, suggesting that a moderate number of forward passes is sufficient to capture reliable stochastic features while maintaining computational efficiency. This demonstrates the effectiveness and robustness of the MC dropout-based framework in modeling confidence distributions for reliable novelty detection.
To examine how the structure of test-time GMMs changes with different numbers of forward passes, a direct comparison is made with the corresponding class-wise reference GMMs.
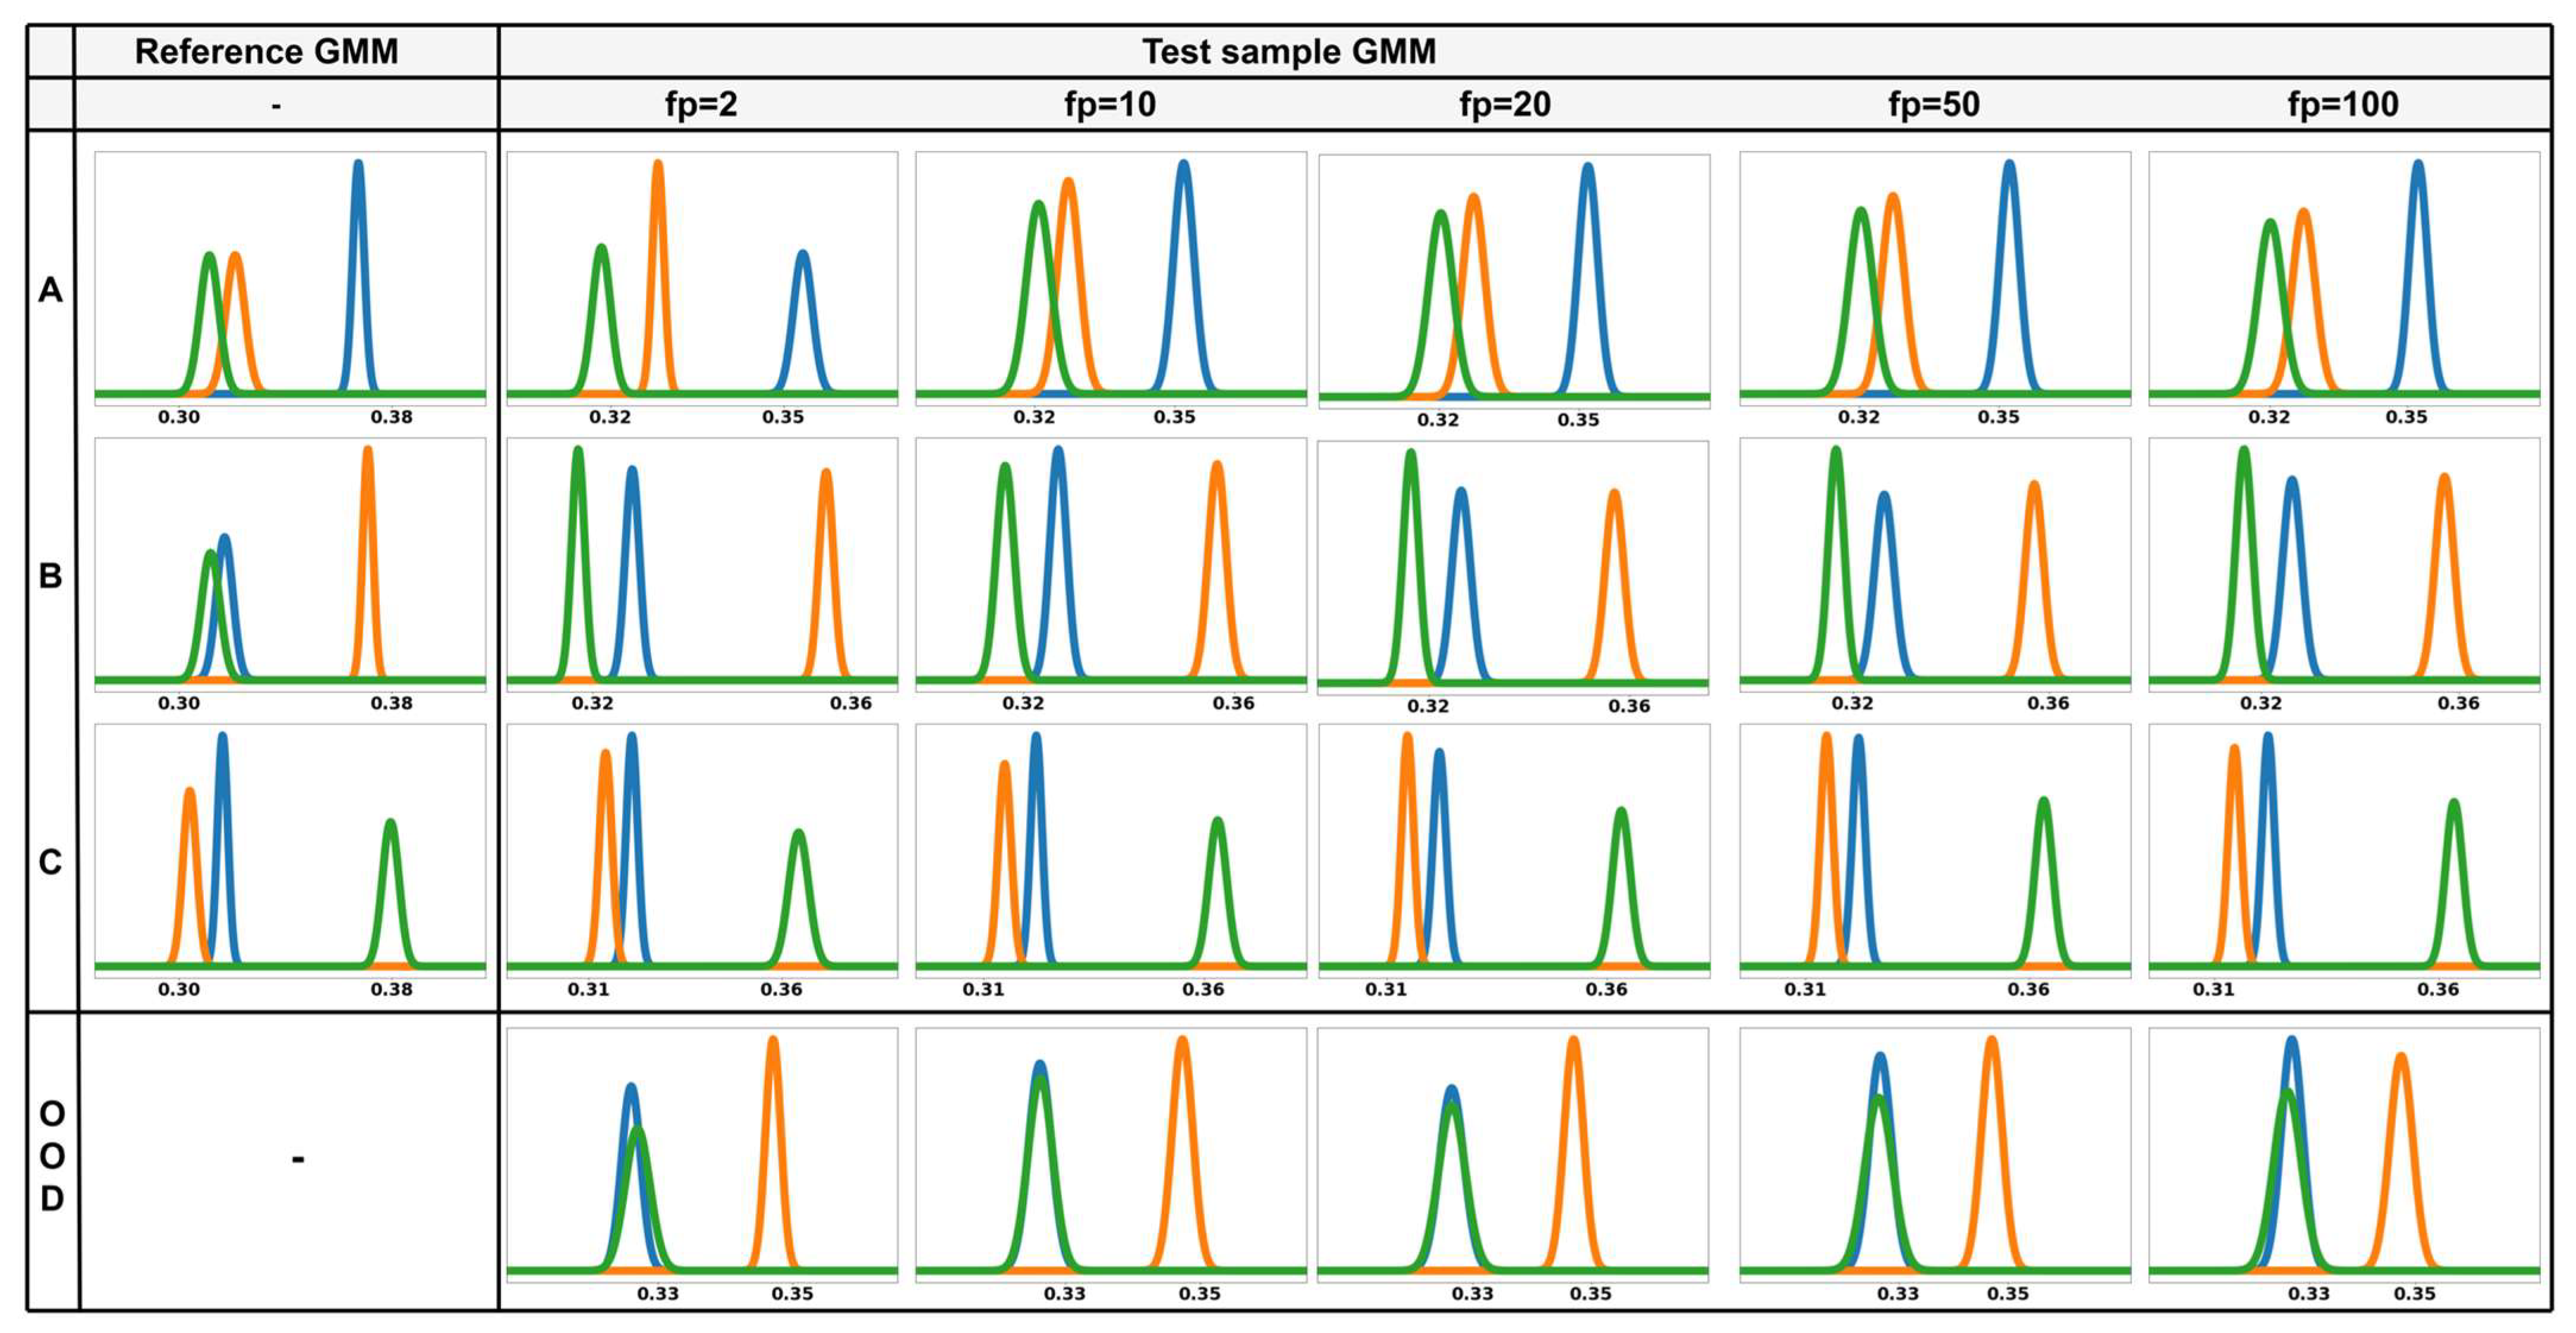
Figure 13 presents these comparison results. The leftmost column displays the reference GMM constructed during training for each class, while the remaining columns illustrate the test-time GMMs obtained by varying the number of forward passes with
. Each row corresponds to a distinct known class, and each plot represents the ODIN-calibrated confidence score distributions.
When , the test-time GMMs deviate significantly from their corresponding reference structures. The distributions appear misaligned, and the class-wise peaks often display asymmetry or irregular shaping. This discrepancy indicates that with only a few stochastic forward passes, the test GMM lacks sufficient expressiveness and stability to accurately approximate the reference distribution, leading to reduced reliability in confidence estimation.
As increases, the test-time GMMs progressively align with the structure of the reference GMMs. Beginning at , the peak locations and variances closely match those of the reference distributions, indicating improved fidelity in confidence modeling. This structural convergence enhances the correspondence between the test and reference distributions, allowing for more accurate computation of KL divergence-based novelty scores. However, beyond , the performance improvements become negligible, while computational cost continues to rise, suggesting that excessively large values are inefficient for practical implementation.
These results demonstrate that MC dropout plays a crucial role in improving the structural alignment between test-time GMM and reference distributions. A sufficiently large number of stochastic forward passes enables the test GMMs to more accurately capture the calibrated confidence patterns learned during training, enhancing the precision of novelty detection. However, as performance gains plateau beyond , selecting an appropriate number of forward passes is essential to achieve an optimal balance between distributional stability and computational efficiency.
5.3. Additional Experiments on the ShipsEar Dataset
We conducted an additional evaluation using the ShipsEar dataset to further validate the generalizability and robustness of the proposed framework. The experimental setup, including preprocessing and the One-vs-Rest protocol, remained consistent with the DeepShip experiments.
Table 4 summarizes the novelty detection performance on the ShipsEar dataset. Despite the distributional shift and different in acoustic characteristics from DeepShip, the proposed ODIN+MC dropout framework achieves superior overall performance compared to the baselines. Regarding average AUROC, our method achieves 0.6042, significantly outperforming LAE-HI (0.4930), MC dropout (0.5379), MSP (0.5575), and ODIN (0.5680). Notably, the proposed method consistently improves in AUROC across all four labels.
However, the FPR@95TPR results exhibit class-dependent variability, with ODIN+MC dropout outperforming the baselines for classes A and B, while indicating comparable or higher FPR values for classes C and D. This variation is significantly attributable to the limited dataset size and the inherent imbalance in ShipsEar, which restricts the model’s ability to learn tightly bounded representations for certain classes. Consequently, threshold-based metrics such as FPR@95TPR become more sensitive to class-specific distributional noise, reflecting the dataset’s structural constraints rather than limitations of the proposed framework.
AUPR-Out results show that, although ODIN+MC dropout does not yield the highest score for every individual label and exhibits some label-wise variability, it achieves the highest average score (0.3849) among all methods. This indicates that the proposed framework provides more stable and reliable OOD detection performance when considered across all labels.
Overall, although the ShipsEar dataset’s limited scale and variability introduce performance fluctuations across labels, the consistent improvements in AUROC and the superior average AUPR-Out demonstrate the strength of the proposed method. These results highlight that integrating ODIN with MC dropout provides meaningful robustness gains even in challenging low-resource underwater acoustic environments, reinforcing the method’s practical value and generalization capability.
6. Conclusions
This study proposed a novelty detection framework that integrates MC dropout with ODIN to enhance detection performance in underwater acoustic sensing environments. By modeling ODIN-calibrated confidence score distributions with GMMs, the framework enabled divergence-based scoring that quantified structural deviations from known class behavior. The method achieved consistent improvements over LAE-HI, MC dropout, MSP and ODIN baselines across all novelty labels. Compared with LAE-HI, AUROC increased by 30.9%, and further improvements were observed over OOD-detection-based baselines, with the increase of 9.5% over MC dropout, 6.1% over MSP, and 5.4% over ODIN, alongside consistent reductions in FPR@95TPR and increases in both AUPR metrics. These results demonstrated that combining MC dropout with ODIN effectively mitigated overconfidence and distributional variability, thereby enhancing the model’s ability to separate known and unknown signals. By addressing these limitations, the proposed framework achieved more reliable novelty detection in highly variable underwater acoustic sensing environments.
Ablation experiments confirmed that temperature scaling and input perturbation contributed distinctly to confidence calibration, with and yielding optimal score separability. Increasing the number of MC dropout forward passes improved the stability and alignment of test-time GMMs with reference distributions, although performance gains saturated around , beyond which computational cost outweighed the benefits. Additionally, evaluation on the ShipsEar dataset further demonstrated the generalizability of the proposed framework, indicating consistent improvements across varying acoustic conditions and sensing environments.
While these results indicate promising generalization to a different dataset, they do not guarantee robustness in scenarios where the same known classes appear across datasets but exhibit substantial acoustic variability. Therefore, future work could include evaluation across datasets that share identical known classes but are collected under varying acoustic conditions, allowing assessment of cross-domain consistency and further enhancing the method’s adaptability for practical sensing scenarios.
Future work may also focus on improving distributional separability and reducing computational overhead. Since ODIN combined with uncertainty-based scoring, indicated clear benefits in this study, and ODIN already leverages gradient information through gradient-oriented regularization methods such as GradOrth may further enhance the distinction between known and unknown distributions [
18]. Moreover, the increased computational burden imposed by multiple stochastic forward passes limits real-time applicability for continuous underwater monitoring, underscoring the need for more efficient uncertainty estimation strategies suitable for long-term sensing operations.