
A Weld Pool Morphology Acquisition and Visualization System Based on an In Situ Calibrated Analytical Solution and Virtual Reality


Abstract
1. Introduction
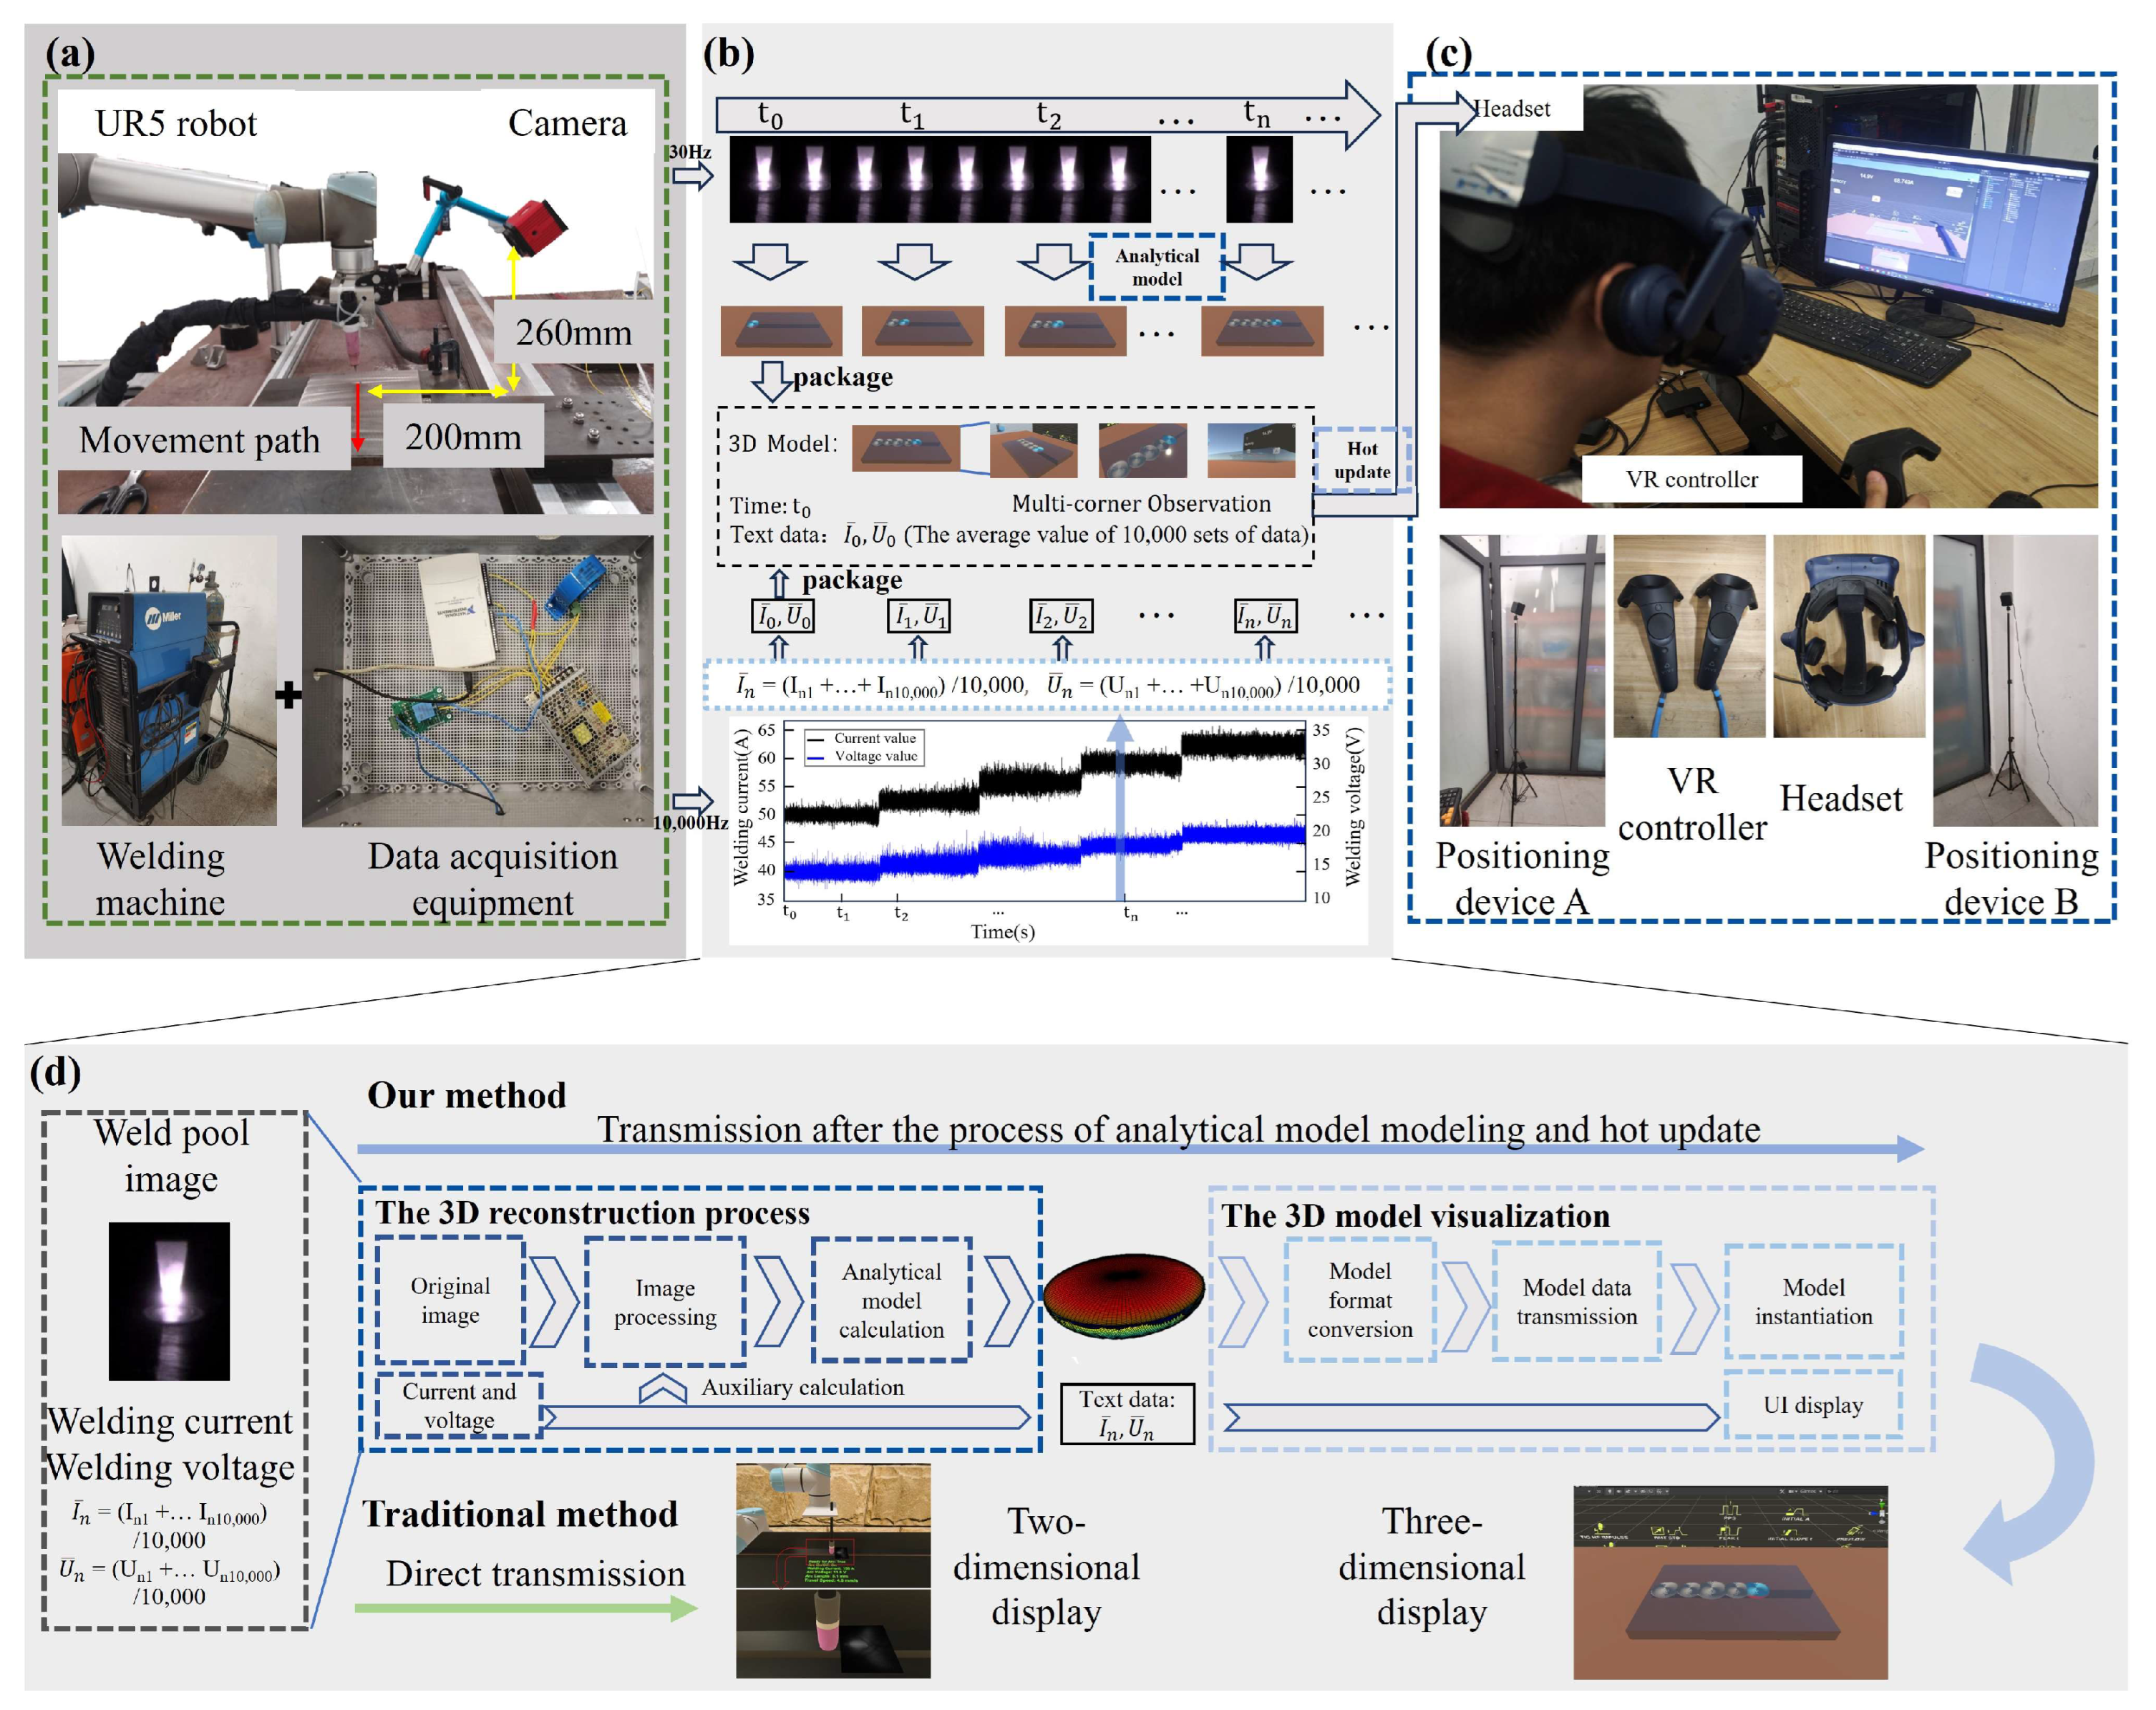
2. System Design
3. The 3D Reconstruction Process and Model Visualization
3.1. The 3D Reconstruction Process
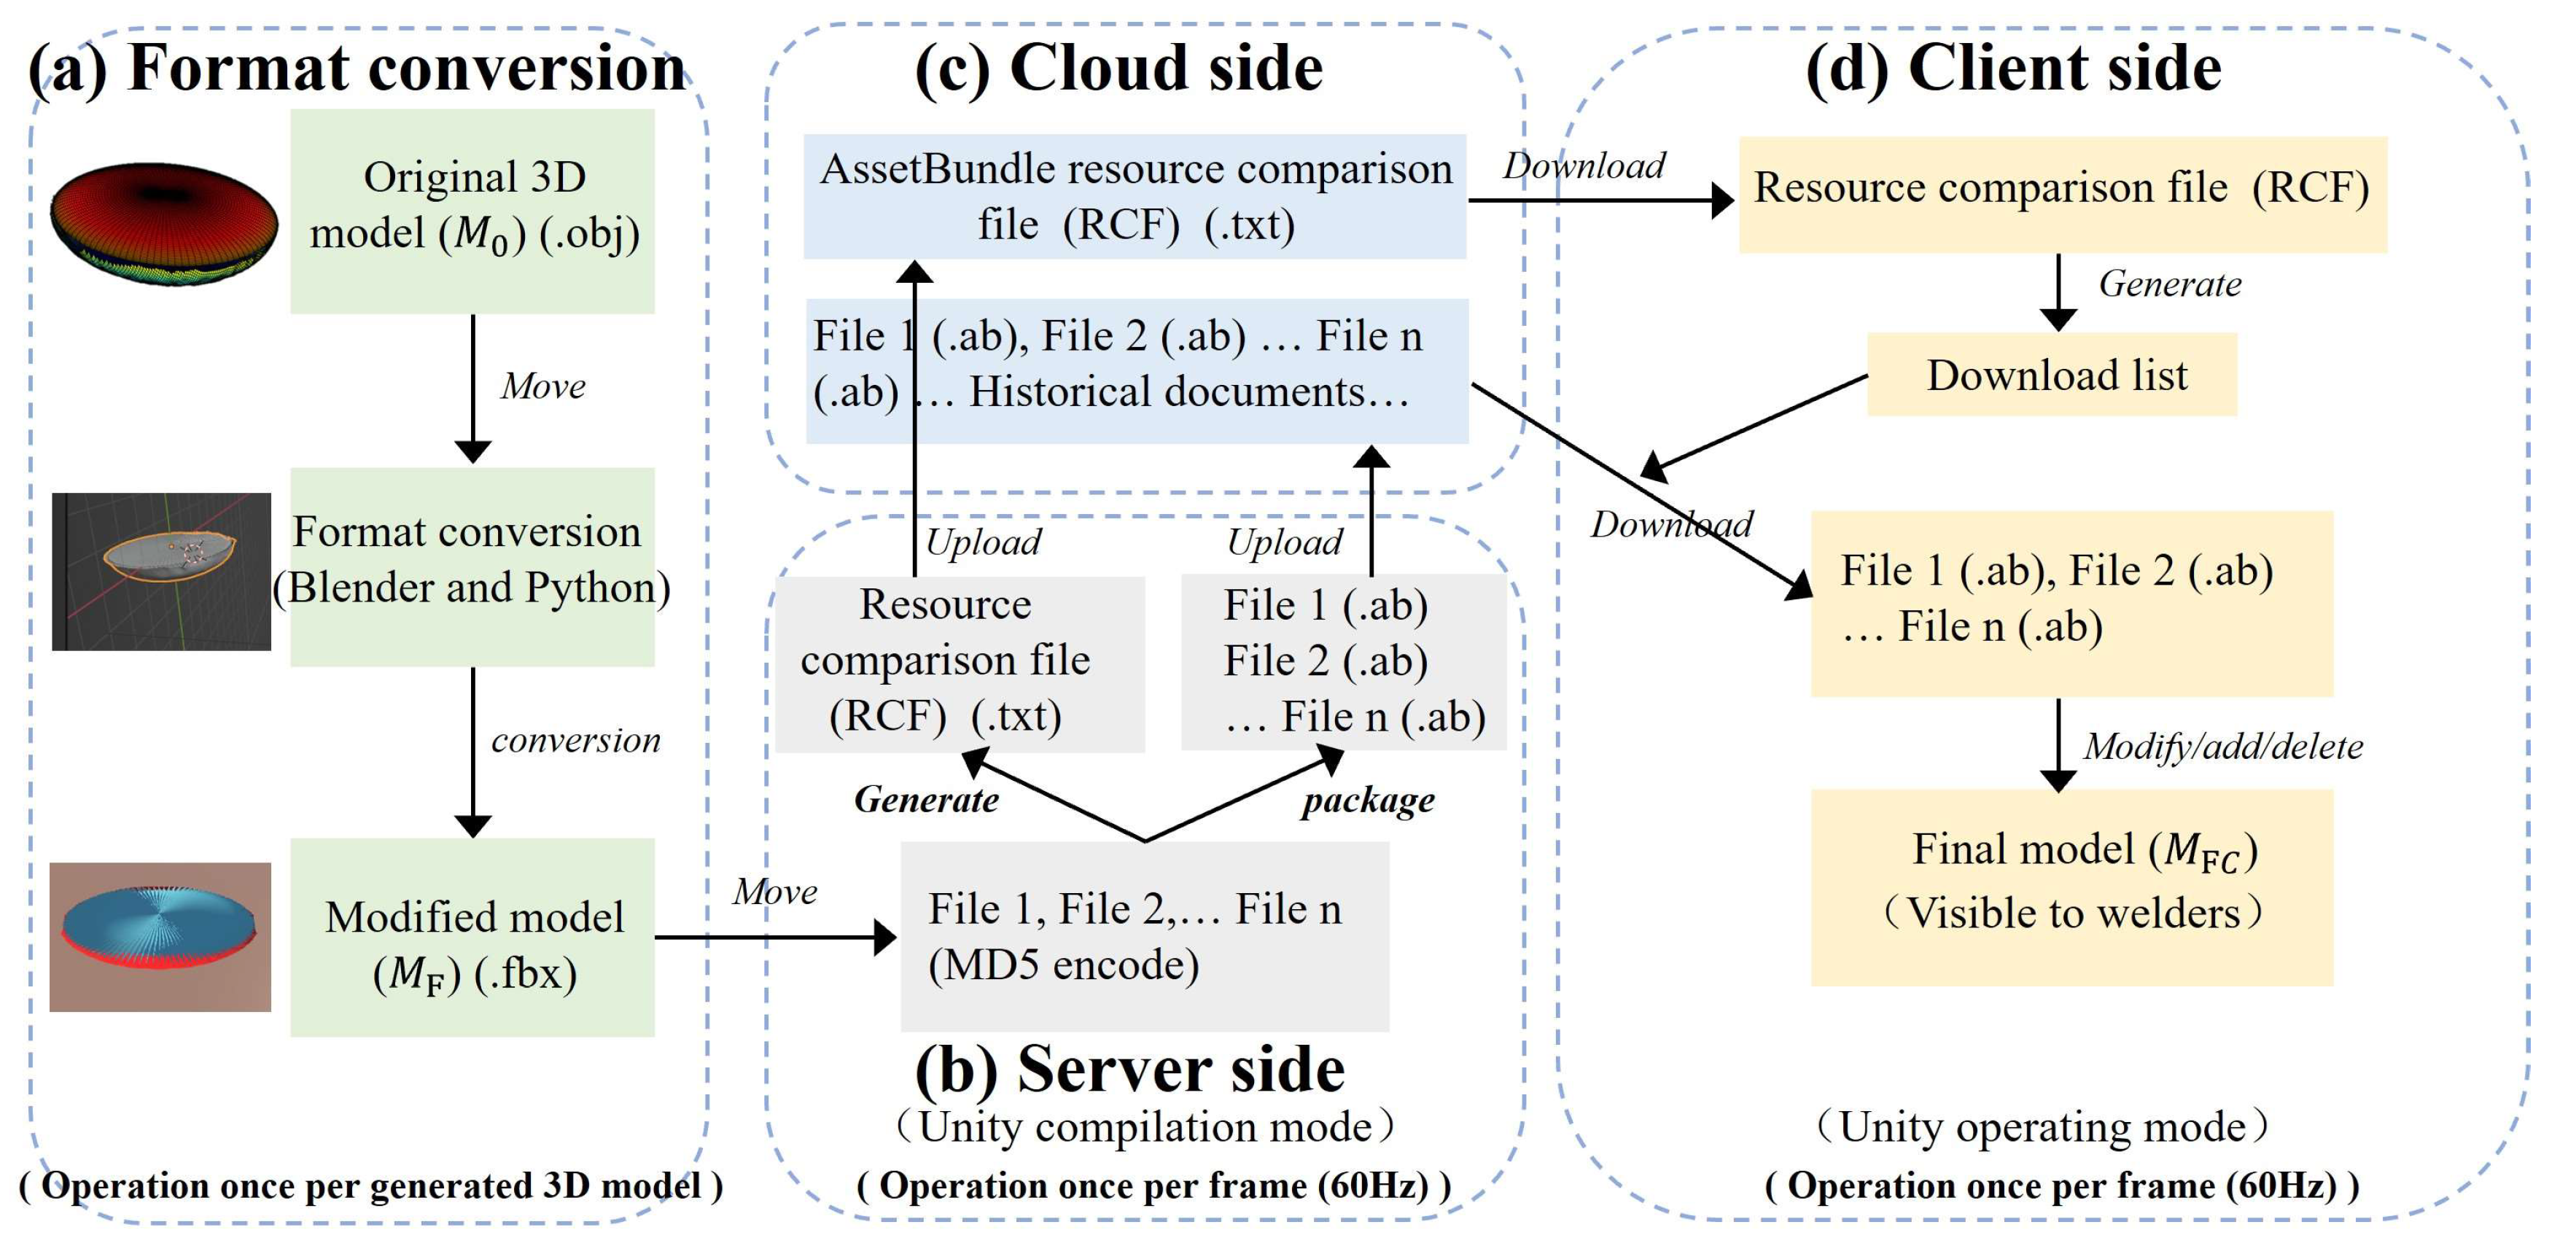
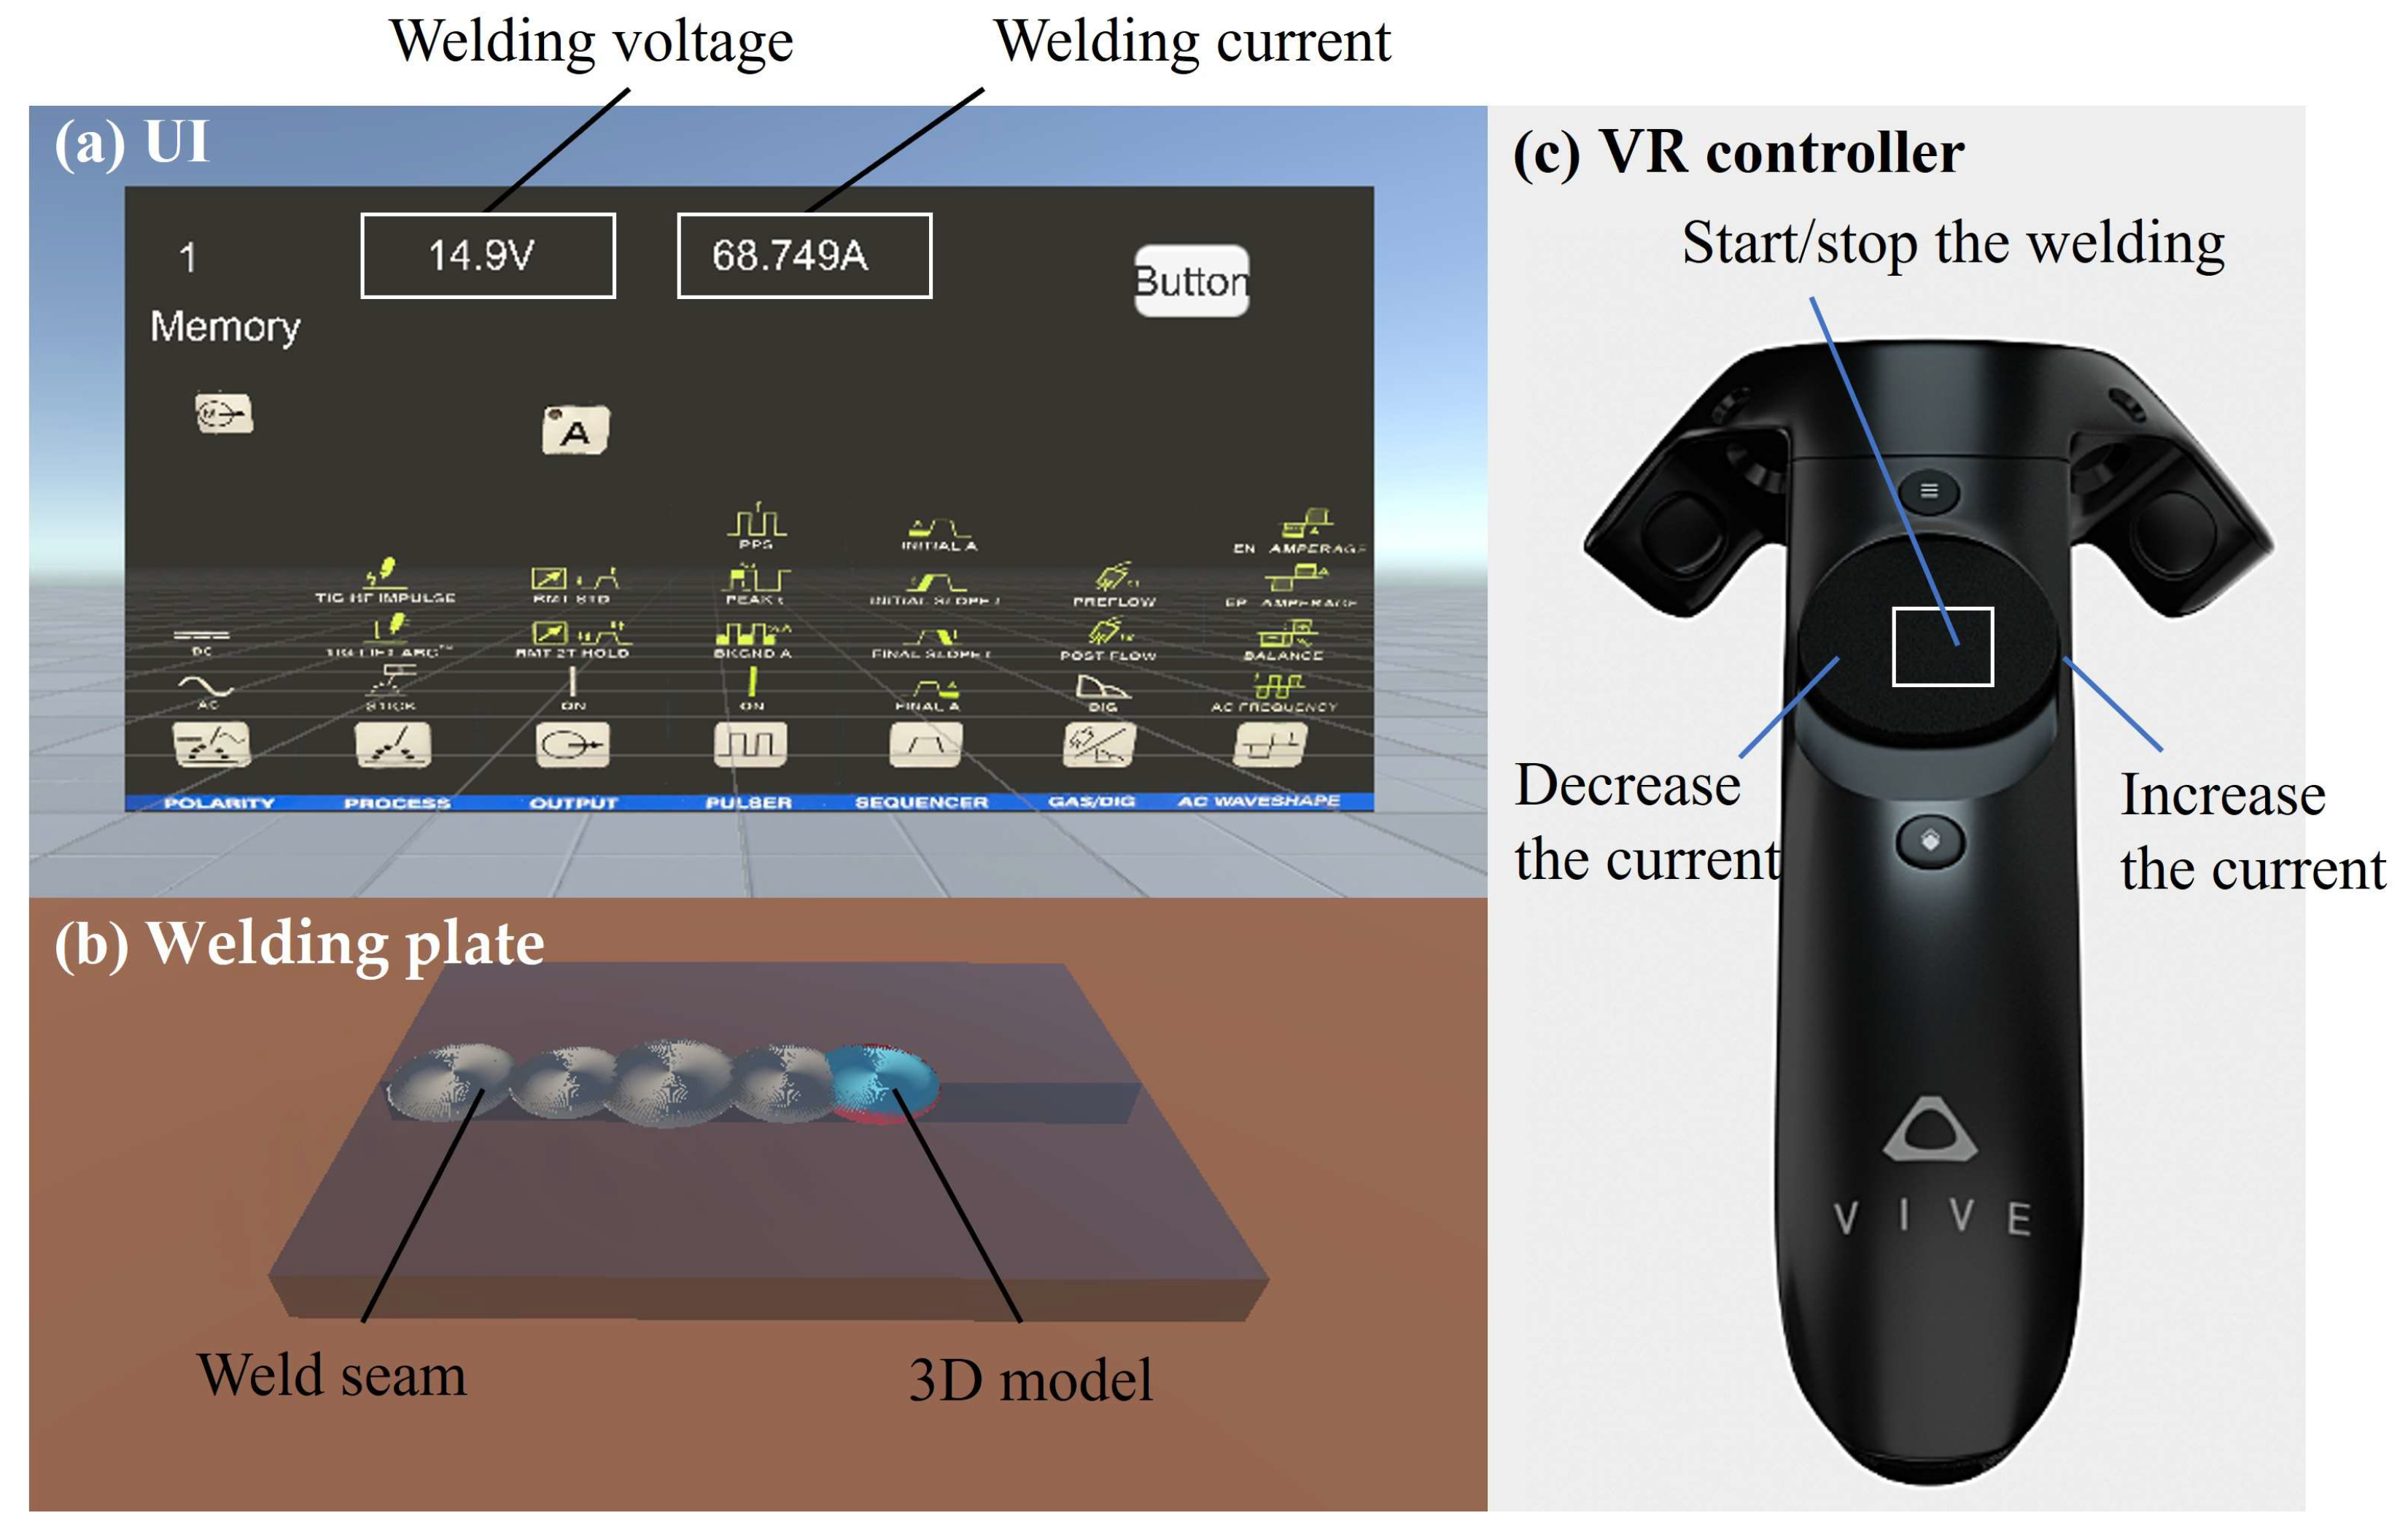
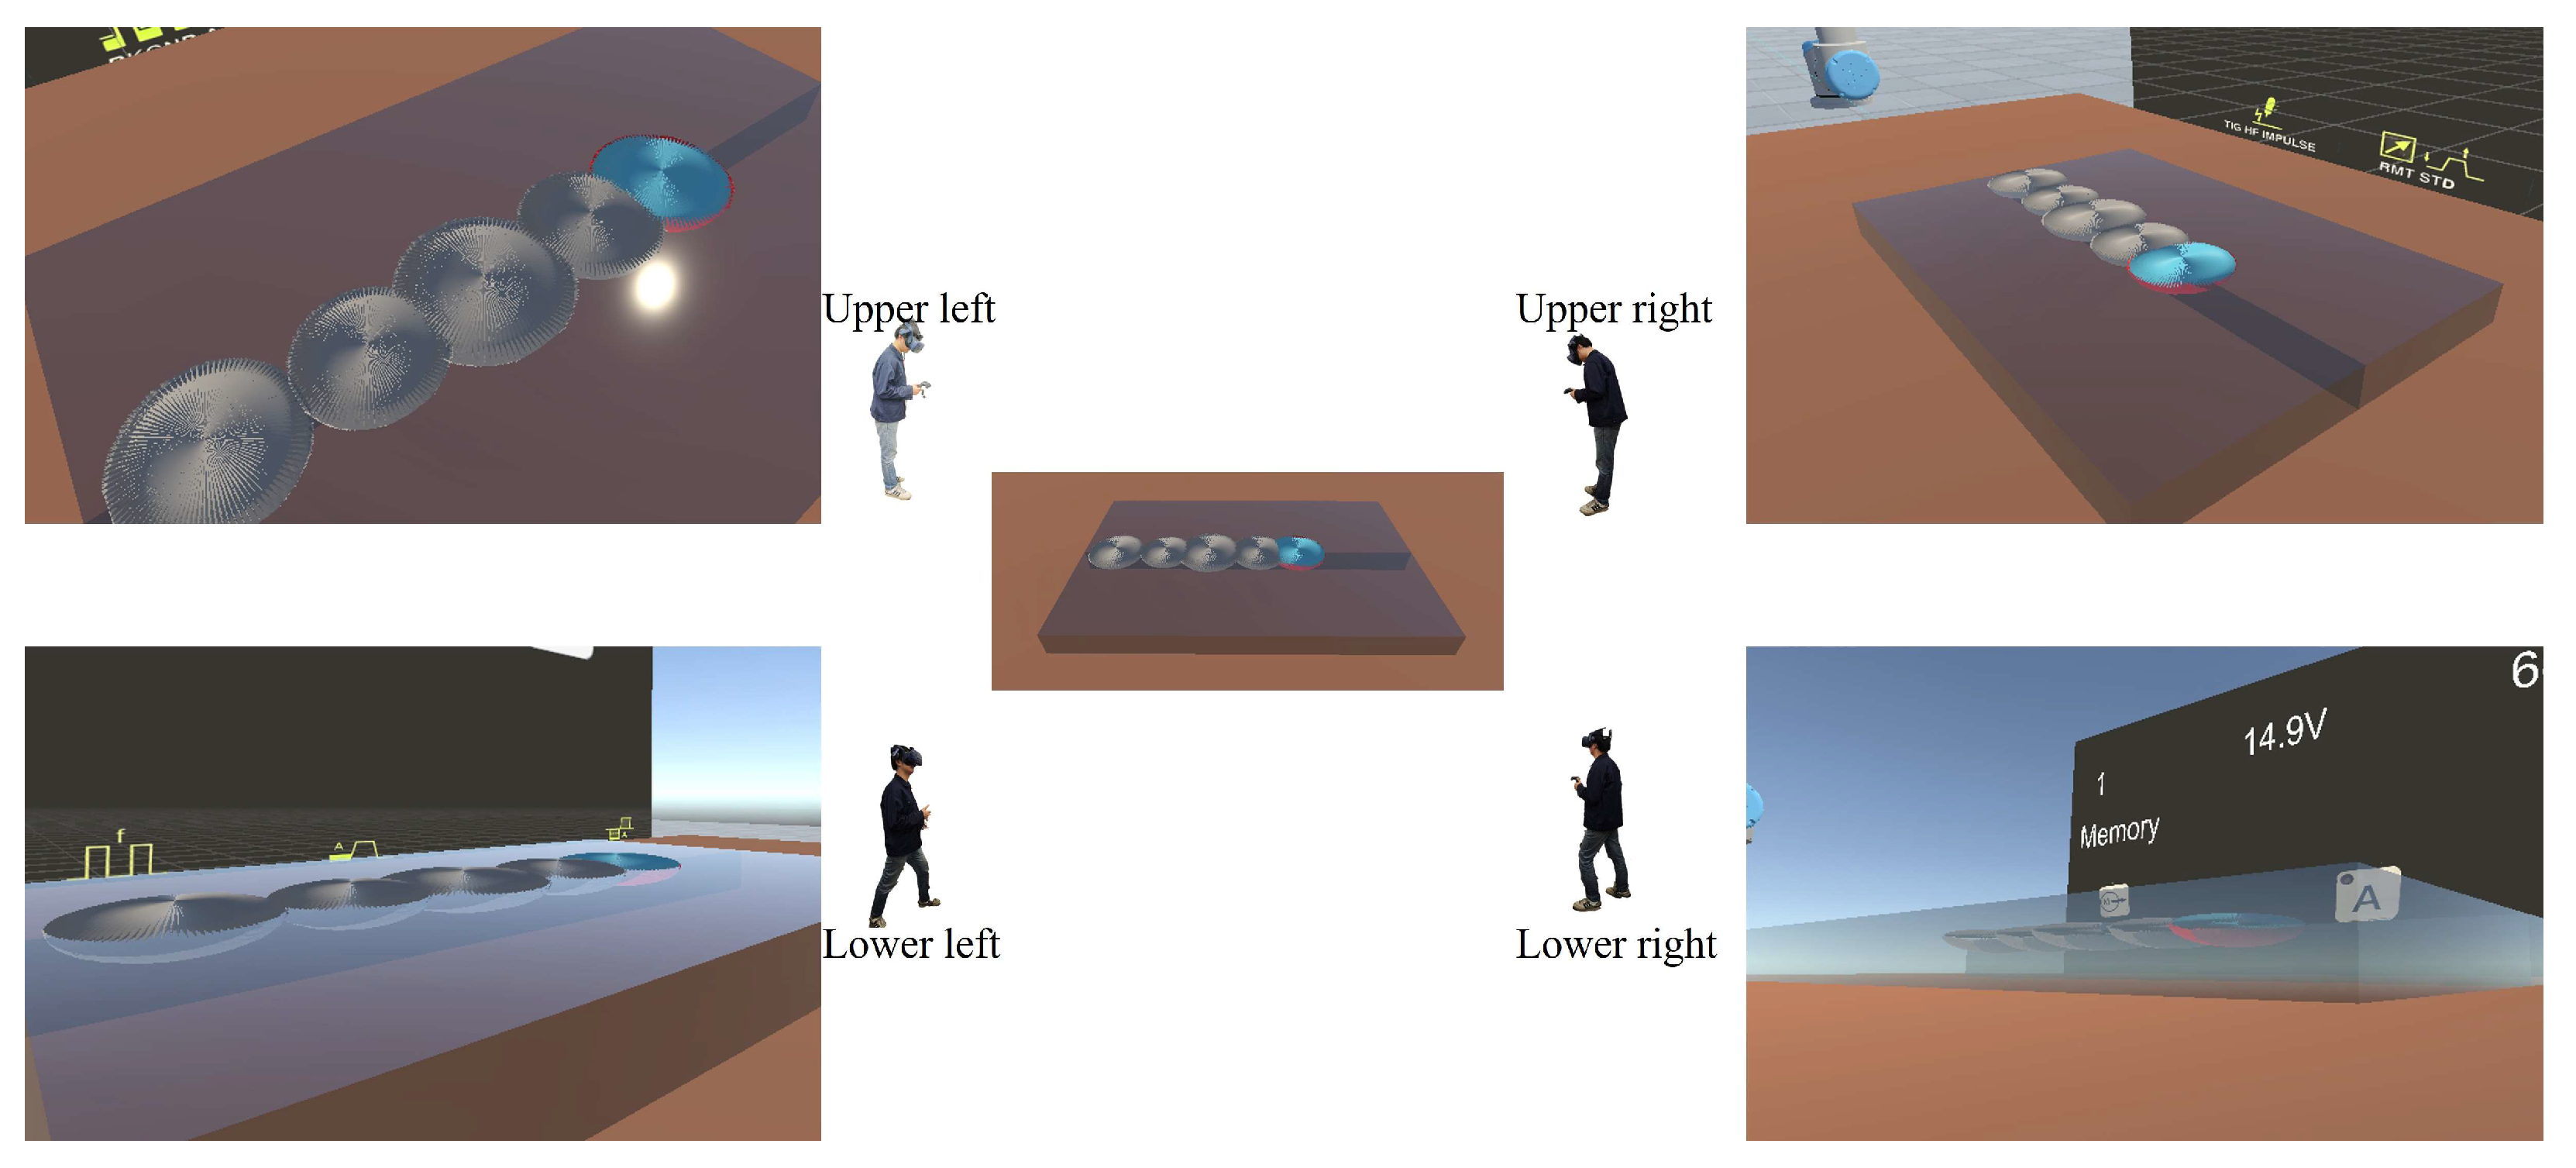
3.2. The 3D Model Visualization
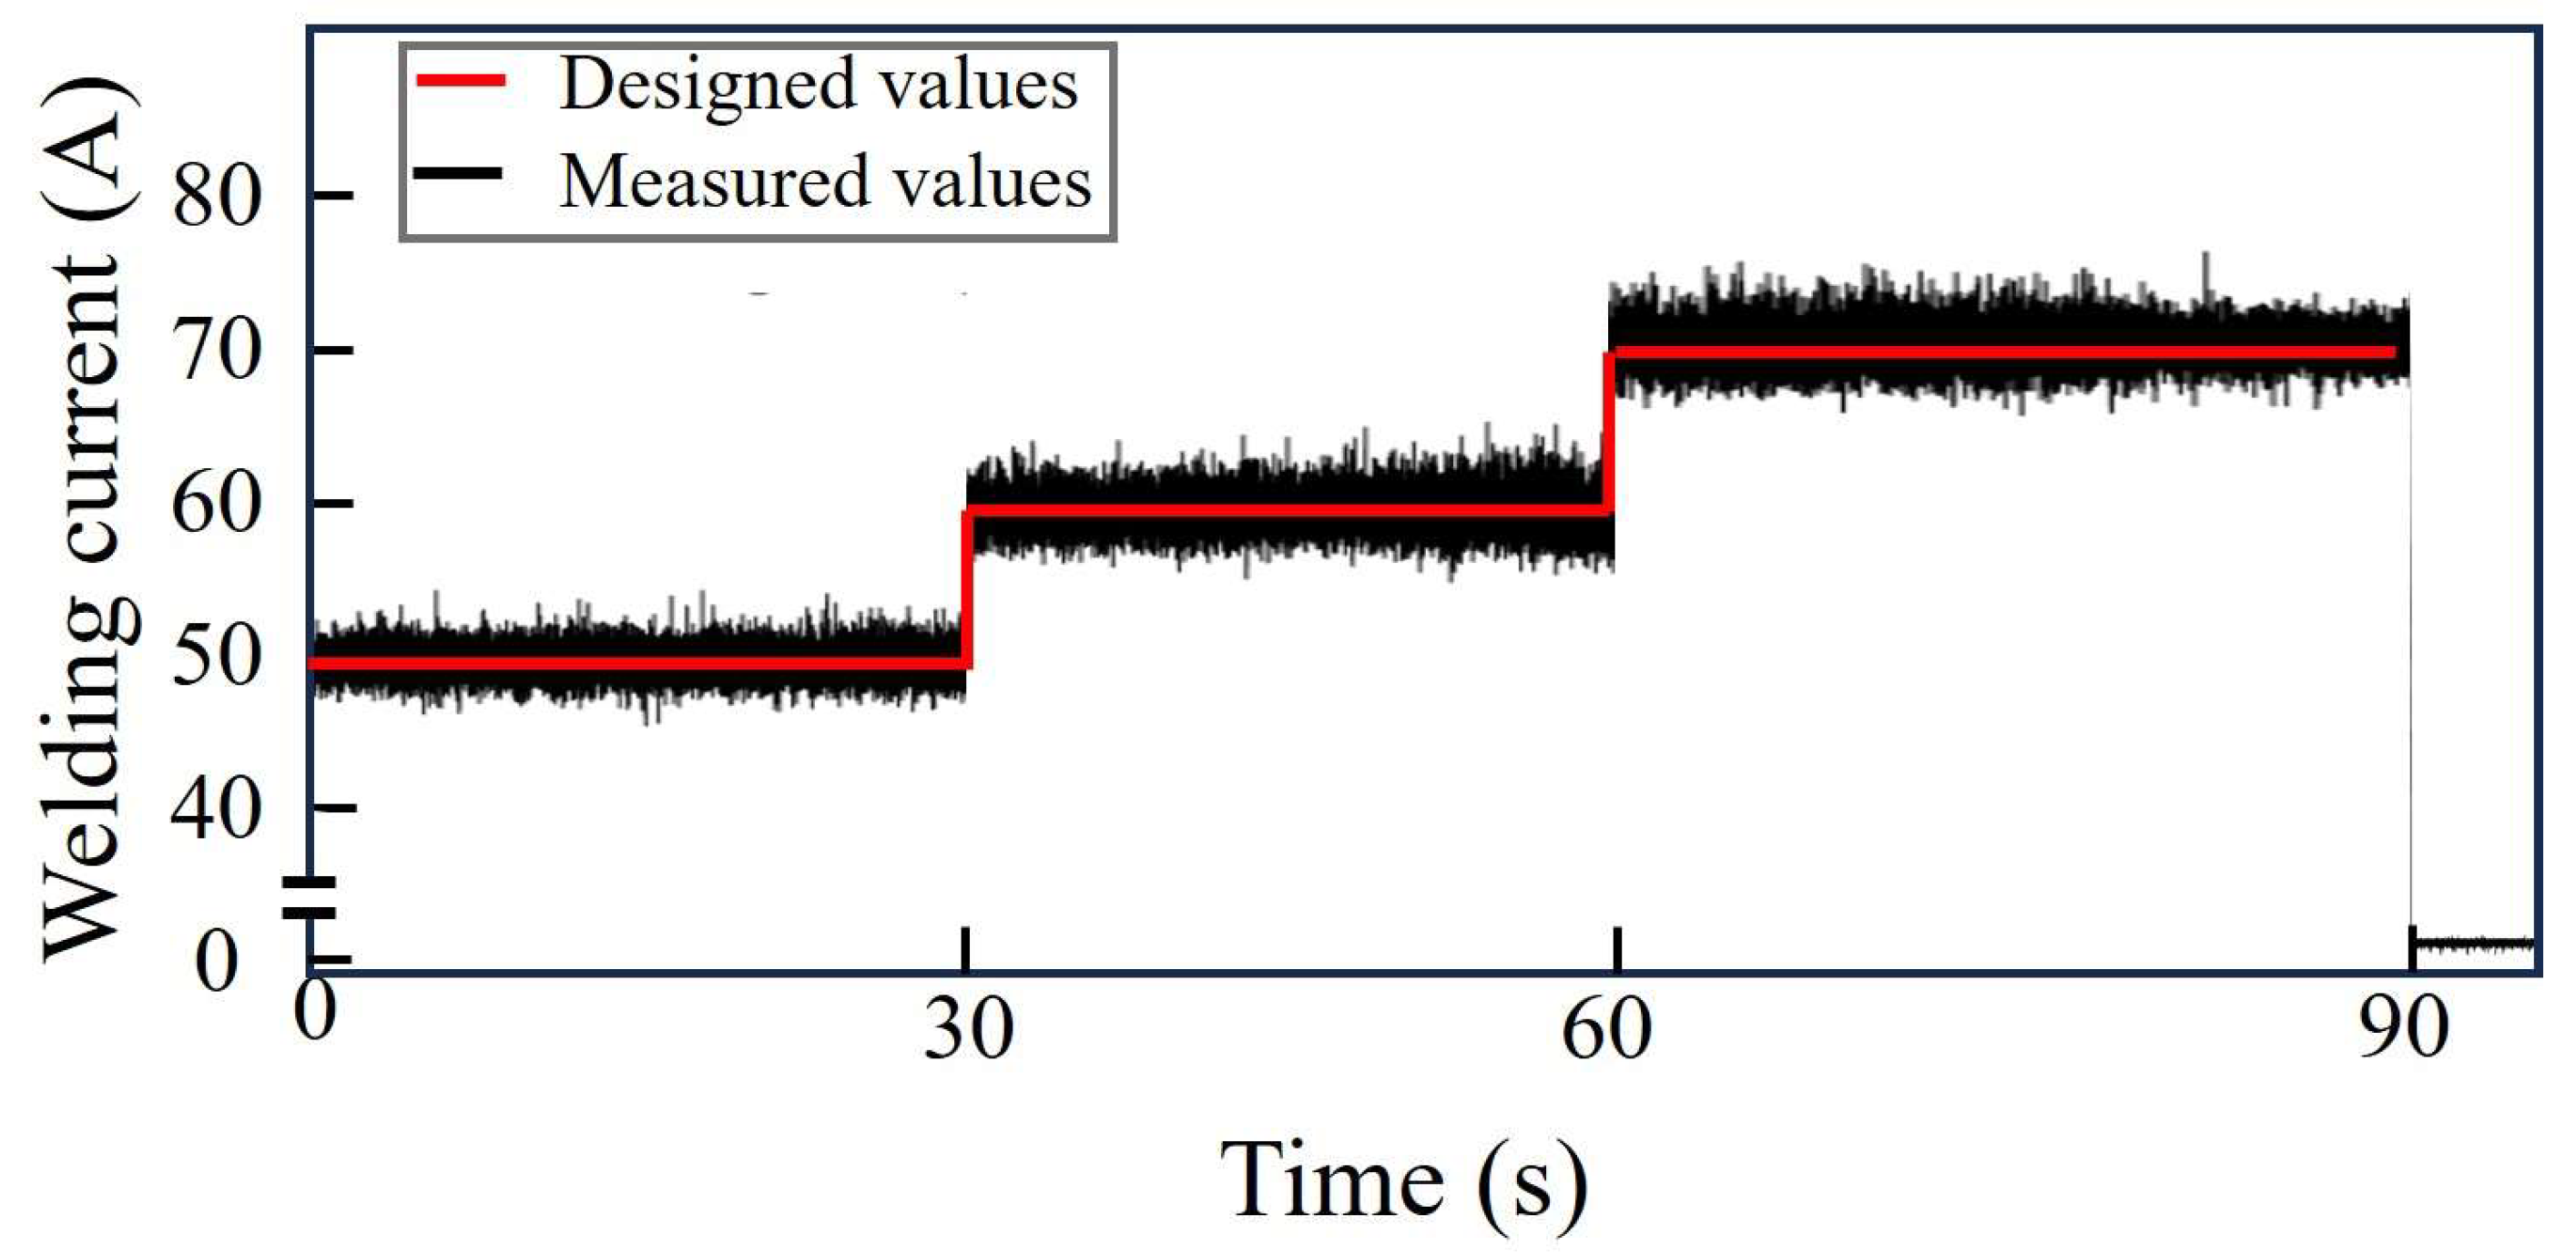
4. Experiment
5. Discussion
6. Conclusions
- (1)
- The system has successfully applied the existing welding analytical model in practice and optimized the algorithms of the image processing and analytical model calculations in order to achieve the requirements of real-time feedback. In real welding experiments, it has been proved that the error in the welding diameter is 0.8% at the minimum, and the average value is 8.54%. The welding experiments have proven the feasibility of the analytical model and the necessity of calibrating the heat source distribution coefficient.
- (2)
- The hot-update technology is used to transmit the three-dimensional model to the virtual environment, including the conversion of the model format before transmission, the use of the AssetBundle technology to package the resource files during the transmission process, and the instantiation of the model in the virtual environment. Experiments have proved that this process is completely feasible and has no impact on the accuracy of the model. The overall transmission time is 2 s, which is mainly due to the limitations of the hardware devices.
Author Contributions
Funding
Institutional Review Board Statement
Informed Consent Statement
Data Availability Statement
Conflicts of Interest
References
- Liu, W.; Chen, M.; Zhu, K.; Wang, L.; Chen, H.; Lu, H. Online monitoring and penetration recognition in all-position TIG welding of nuclear power pipeline. J. Manuf. Process. 2023, 108, 889–902. [Google Scholar] [CrossRef]
- Shukla, A.; Karki, H. Application of robotics in offshore oil and gas industry—A review Part II. Robot. Auton. Syst. 2016, 75, 508–524. [Google Scholar] [CrossRef]
- Feng, J.; Wang, H.; Zhang, B.; Wang, T. Research status and prospect of space welding technology. Trans. China Weld. Inst. 2015, 36, 107–112. [Google Scholar]
- Hedayati, H.; Walker, M.; Szafir, D. Improving Collocated Robot Teleoperation with Augmented Reality. In Proceedings of the 2018 ACM/IEEE International Conference on Human-Robot Interaction, Chicago, IL, USA, 5–8 March 2018; ACM: Chicago, IL, USA, 2018; pp. 78–86. [Google Scholar]
- Liu, Y.-C.; Khong, M.-H.; Ou, T.-W. Nonlinear bilateral teleoperators with non-collocated remote controller over delayed network. Mechatronics 2017, 45, 25–36. [Google Scholar] [CrossRef]
- Liu, Y.K.; Zhang, Y.M. Model-Based Predictive Control of Weld Penetration in Gas Tungsten Arc Welding. IEEE Trans. Contr Syst. Technol. 2014, 22, 955–966. [Google Scholar] [CrossRef]
- Cheng, Y.; Chen, S.; Xiao, J.; Zhang, Y. Dynamic estimation of joint penetration by deep learning from welding pool image. Sci. Technol. Weld. Join. 2021, 26, 279–285. [Google Scholar] [CrossRef]
- Zhang, W.; Fan, L.; Guo, Y.; Liu, W.; Ding, C. Narrow gap welding seam deflection correction study based on passive vision. Ind. Robot. 2024, 51, 479–489. [Google Scholar] [CrossRef]
- Mao, Z. Development of a melt pool characteristics detection platform based on multi-information fusion of temperature fields and photodiode signals in plasma arc welding. J. Intell. Manuf. 2025, 36, 2017–2037. [Google Scholar] [CrossRef]
- Lv, N.; Xu, Y.; Li, S.; Yu, X.; Chen, S. Automated control of welding penetration based on audio sensing technology. J. Mater. Process. Technol. 2017, 250, 81–98. [Google Scholar] [CrossRef]
- Wu, S.; Gao, H.; Zhang, W.; Zhang, Y. Real-time estimation of weld penetration using welding pool surface based calibration. In Proceedings of the IECON 2016—42nd Annual Conference of the IEEE Industrial Electronics Society, Florence, Italy, 24–27 October 2016; IEEE: Florence, Italy, 2016; pp. 294–299. [Google Scholar]
- Wang, B.; Hu, S.J.; Sun, L.; Freiheit, T. Intelligent welding system technologies: State-of-the-art review and perspectives. J. Manuf. Syst. 2020, 56, 373–391. [Google Scholar] [CrossRef]
- Cai, W.; Wang, J.; Jiang, P.; Cao, L.; Mi, G.; Zhou, Q. Application of sensing techniques and artificial intelligence-based methods to laser welding real-time monitoring: A critical review of recent literature. J. Manuf. Syst. 2020, 57, 1–18. [Google Scholar] [CrossRef]
- Li, B.; Xu, Z.; Gao, F.; Cao, Y.; Dong, Q. 3D Reconstruction of High Reflective Welding Surface Based on Binocular Structured Light Stereo Vision. Machines 2022, 10, 159. [Google Scholar] [CrossRef]
- Gu, Z.; Chen, J.; Wu, C. Three-Dimensional Reconstruction of Welding Pool Surface by Binocular Vision. Chin. J. Mech. Eng. 2021, 34, 47. [Google Scholar] [CrossRef]
- Kumar Katheria, S.; Kumar, D.; Ali Khan, T.; Kumar Singh, M. Reality based skills development approach in welding technology: An overview. Mater. Today Proc. 2021, 47, 7184–7188. [Google Scholar] [CrossRef]
- Chan, V.S.; Haron, H.N.H.; Isham, M.I.B.M.; Mohamed, F.B. VR and AR virtual welding for psychomotor skills: A systematic review. Multimed. Tools Appl. 2022, 81, 12459–12493. [Google Scholar] [CrossRef]
- Grieves, M.; Vickers, J. Digital Twin: Mitigating Unpredictable, Undesirable Emergent Behavior in Complex Systems. In Transdisciplinary Perspectives on Complex Systems; Kahlen, F.-J., Flumerfelt, S., Alves, A., Eds.; Springer International Publishing: Cham, Switzerland, 2017; pp. 85–113. [Google Scholar]
- Tao, F.; Zhang, H.; Liu, A.; Nee, A.Y.C. Digital Twin in Industry: State-of-the-Art. IEEE Trans. Ind. Inform. 2019, 15, 2405–2415. [Google Scholar] [CrossRef]
- Wang, Q.; Jiao, W.; Zhang, Y. Deep learning-empowered digital twin for visualized weld joint growth monitoring and penetration control. J. Manuf. Syst. 2020, 57, 429–439. [Google Scholar] [CrossRef]
- Chen, S.J.; Huang, N.; Liu, Y.K.; Zhang, Y.M. Machine assisted manual torch operation: System design, response modeling, and speed control. J. Intell. Manuf. 2015, 28, 1249–1258. [Google Scholar] [CrossRef]
- Li, L.D.; Cheng, F.J.; Wu, S.J. An LSTM-based measurement method of 3D weld pool surface in GTAW. Measurement 2021, 171, 108809. [Google Scholar] [CrossRef]
- Gao, X.; Liang, Z.M.; Zhang, X.M.; Wang, L.W.; Yang, X. Penetration state recognition based on stereo vision in GMAW process by deep learning. J. Manuf. Process. 2023, 89, 349–361. [Google Scholar] [CrossRef]
- Fronius: Virtual Welding: Welder Training of the Future. 2018. Available online: https://www.fronius.com/en-us/usa/welding-technology/our-expertise/welding-education/virtual-welding (accessed on 20 December 2018).
- Miller Live Arc Welding Performance Management System for GMAW & FCAW Applications. 2018. Available online: https://www.millerwelds.com/equipment/training-solutions/trainingequipment/livearc-elding-performance-management-system-m00803 (accessed on 26 December 2018).
- American Welding Society. Measurement of Calibrated Recursive Analytic in the Gas Tungsten Arc Welding pool Model. Weld. J. 2018, 97, 108–119. [Google Scholar] [CrossRef]
- Eagar, T.W.; Tsai, N.S. Temperature fields produced by traveling distributed heat sources. Weld. J. 1983, 62, 346–355. [Google Scholar]
- Wu, S.; Gao, H.; Zhang, W.; Zhang, Y.M. Analytic Welding pool Model Calibrated by Measurements—Part 2: Verification and Robustness. Weld. J. 2017, 96, 250–257. [Google Scholar]


| ID | (W) | (mm) | ||
|---|---|---|---|---|
| 1 | 500 | 0.2 | 0.2 | 2.8 |
| 2 | 500 | 0.2 | 0.4 | |
| … | … | … | … | … |
| 448 | 700 | 5.0 | 0.8 | 0 |
| 449 | 700 | 5.0 | 1.2 | 0 |
| 450 | 700 | 5.0 | 1.2 | 0 |
| Input Parameters | Set Values |
|---|---|
| Initial welding temperature (°C) | 0 |
| Density ρ (kg·mm−3) | 8.03 × 10⁻⁶ |
| Specific heat capacity c (J·kg·K−1) | 500 |
| Thermal conductivity λ (W·mm·K−1) | 16.2 × 10⁻³ |
| Thermal diffusivity a (mm2·s−1) | 4.035 |
| Volumetric expansion coefficients αv (K−1) | 4.5 × 10⁻⁵ |
| Melting point (°C) | 1400 |
| ID | Time (s) | Welding Current (I) (A) | Welding Heat Input (Q) (W) | Diameter from Calculation () (mm) | Heat Source Parameters () |
|---|---|---|---|---|---|
| I | 0–30 | 50 | 500 | 2.11 | (2.020, 0.743) |
| 30–60 | 60 | 600 | 2.70 | (2.008, 0.696) | |
| 60–90 | 70 | 700 | 3.37 | (2.445, 0.701) | |
| II | 0–30 | 50 | 500 | 2.14 | (1.998, 0.693) |
| 30–60 | 60 | 600 | 2.73 | (1.992, 0.695) | |
| 60–90 | 50 | 500 | 2.95 | (0.493, 0.200) | |
| III | 0–30 | 70 | 700 | 3.63 | (2.224, 0.697) |
| 30–60 | 60 | 600 | 3.46 | (1.475, 0.69) | |
| 60–90 | 70 | 700 | 3.93 | (1.873, 0.746) | |
| IV | 0–30 | 70 | 700 | 3.49 | (2.350, 0.702) |
| 30–60 | 50 | 500 | 2.98 | (0.493, 0.200) | |
| 60–90 | 60 | 600 | 3.40 | (1.535, 0.693) | |
| V | 0–30 | 70 | 700 | 3.71 | (2.145, 0.697) |
| 30–60 | 60 | 600 | 3.46 | (1.535, 0.693) | |
| 60–90 | 60 | 600 | 3.41 | (1.526, 0.689) |
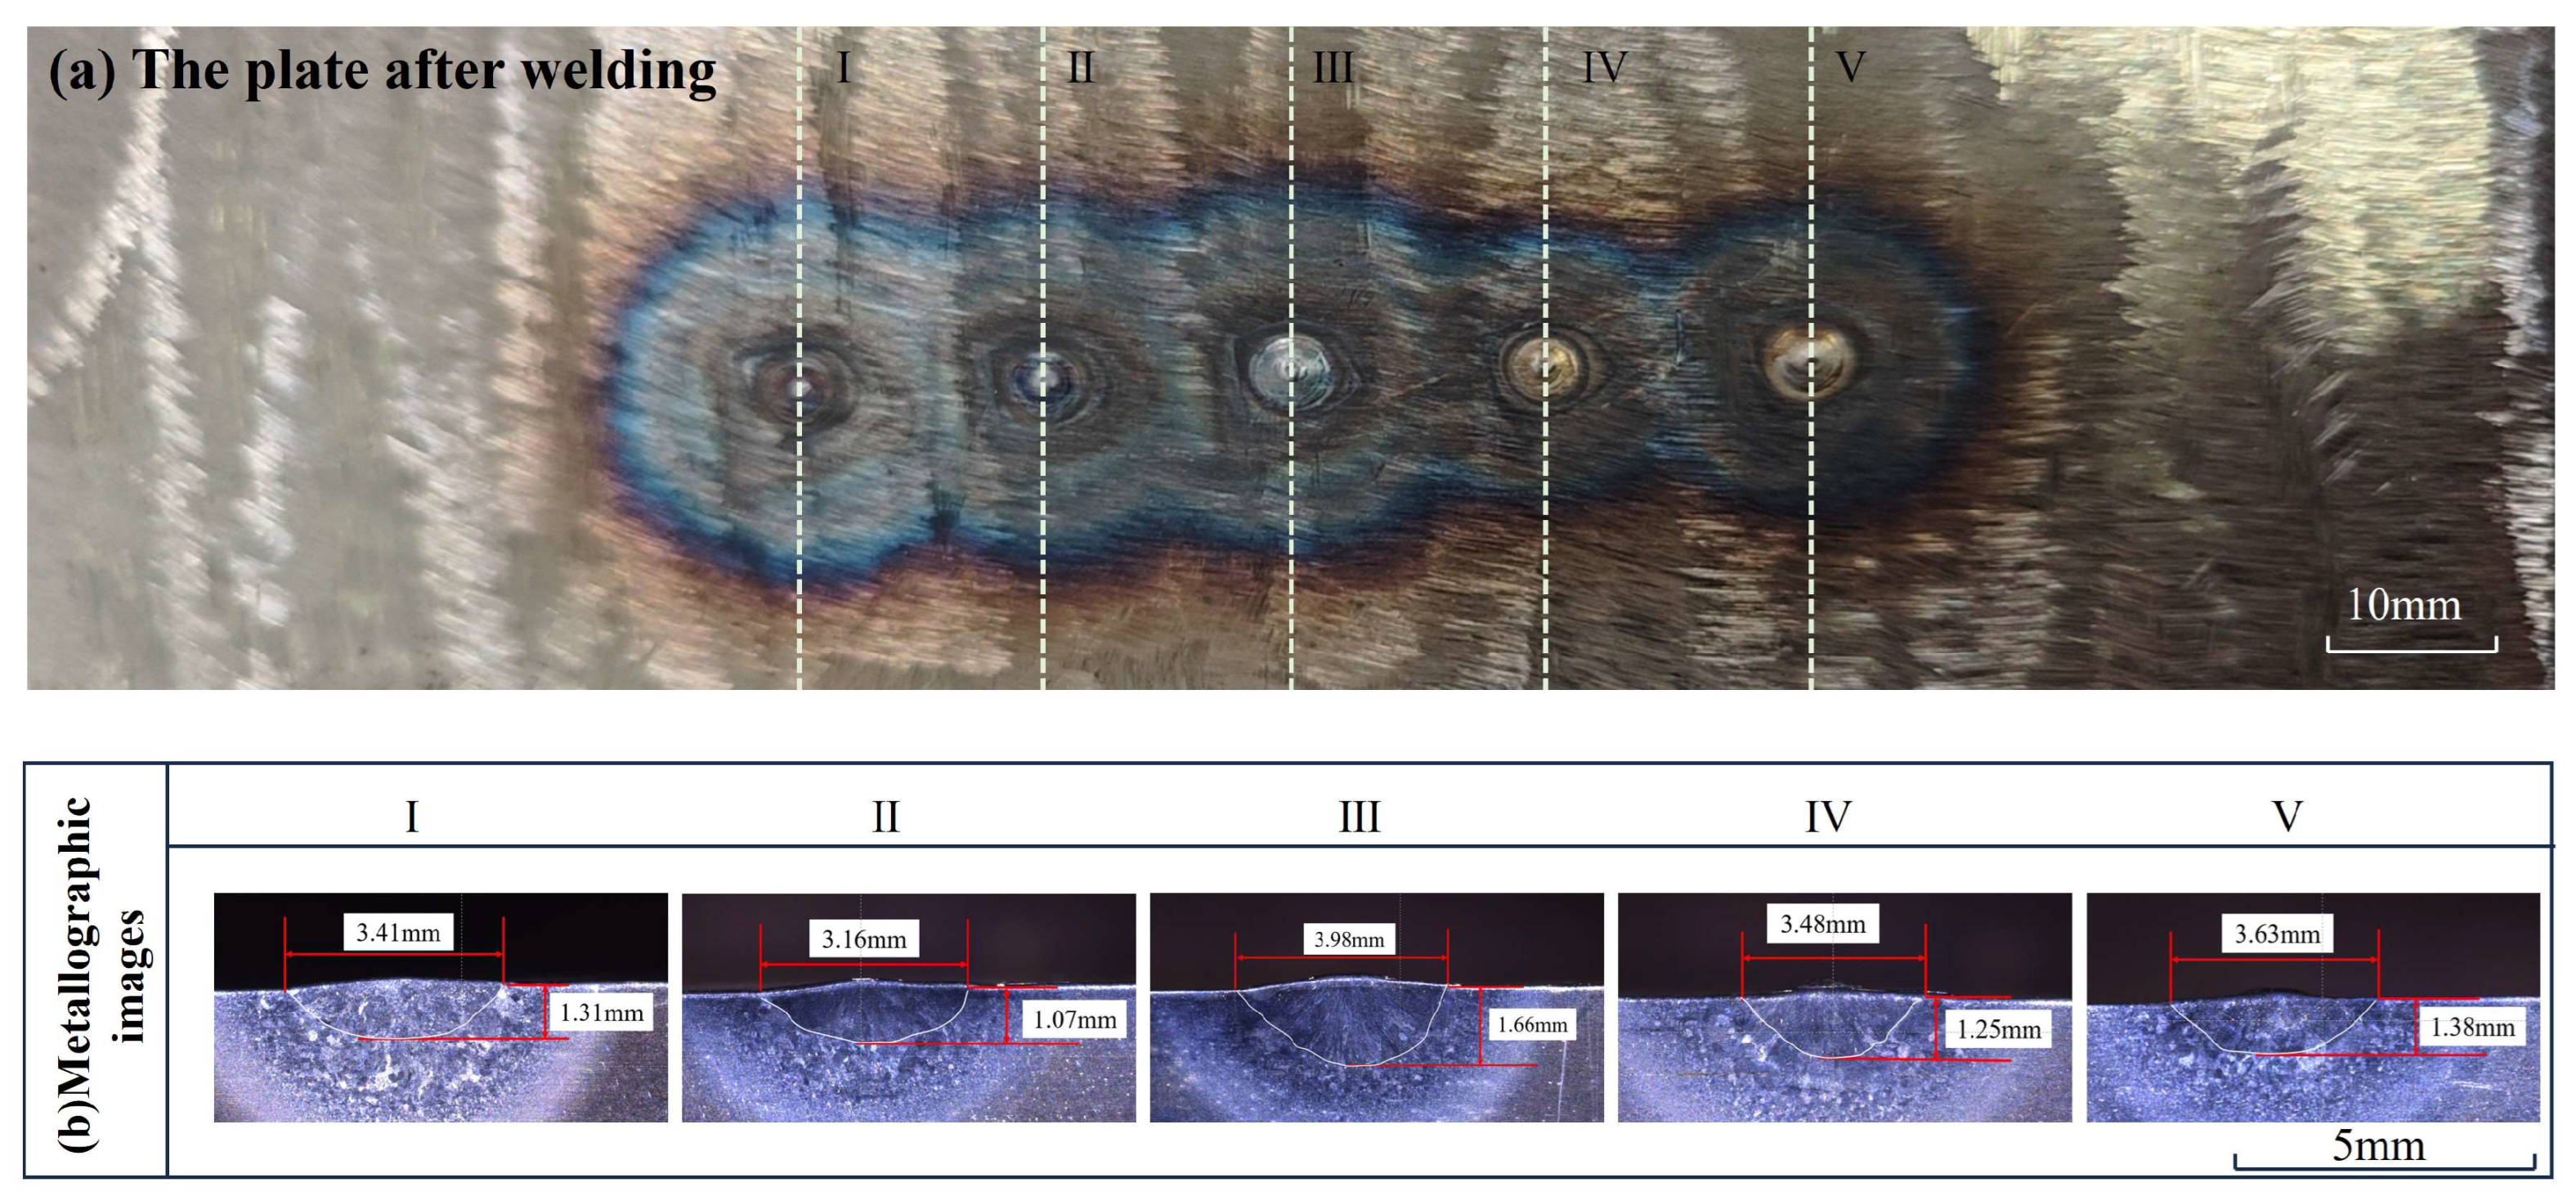
| ID | Diameter from Metallography (d) (mm) | Diameter from Calculation () (mm) | Error of Diameter (%) | Welding Depth from Metallography () (mm) | Welding Depth from Calculation () (mm) | Error of Welding Depth (%) |
|---|---|---|---|---|---|---|
| I | 3.41 | 4.24 | 24.3 | 1.31 | 1.68 | 28.2 |
| II | 3.16 | 2.96 | 6.3 | 1.07 | 1.39 | 30.0 |
| III | 3.98 | 4.32 | 7.9 | 1.66 | 1.88 | 13.3 |
| IV | 3.48 | 3.60 | 3.4 | 1.25 | 1.59 | 27.2 |
| V | 3.63 | 3.60 | 0.8 | 1.38 | 1.68 | 21.7 |
Disclaimer/Publisher’s Note: The statements, opinions and data contained in all publications are solely those of the individual author(s) and contributor(s) and not of MDPI and/or the editor(s). MDPI and/or the editor(s) disclaim responsibility for any injury to people or property resulting from any ideas, methods, instructions or products referred to in the content. |
© 2025 by the authors. Licensee MDPI, Basel, Switzerland. This article is an open access article distributed under the terms and conditions of the Creative Commons Attribution (CC BY) license (https://creativecommons.org/licenses/by/4.0/).
Share and Cite
Niu, Y.; Wu, S.; Cheng, F.; Wang, Z. A Weld Pool Morphology Acquisition and Visualization System Based on an In Situ Calibrated Analytical Solution and Virtual Reality. Sensors 2025, 25, 2711. https://doi.org/10.3390/s25092711
Niu Y, Wu S, Cheng F, Wang Z. A Weld Pool Morphology Acquisition and Visualization System Based on an In Situ Calibrated Analytical Solution and Virtual Reality. Sensors. 2025; 25(9):2711. https://doi.org/10.3390/s25092711
Chicago/Turabian StyleNiu, Yecun, Shaojie Wu, Fangjie Cheng, and Zhijiang Wang. 2025. "A Weld Pool Morphology Acquisition and Visualization System Based on an In Situ Calibrated Analytical Solution and Virtual Reality" Sensors 25, no. 9: 2711. https://doi.org/10.3390/s25092711
APA StyleNiu, Y., Wu, S., Cheng, F., & Wang, Z. (2025). A Weld Pool Morphology Acquisition and Visualization System Based on an In Situ Calibrated Analytical Solution and Virtual Reality. Sensors, 25(9), 2711. https://doi.org/10.3390/s25092711