1. Introduction
Contemporary remote sensing technology provides a vast array of information regarding Earth’s surface observations, including high-resolution satellite images and synthetic aperture radar (SAR) data [
1,
2]. These datasets not only facilitate global-scale ecological monitoring but also support various fields such as forests resource surveys, urban planning, and climate change research [
3,
4,
5]. Accurate mapping of vegetation cover is particularly crucial in tasks such as ecological protection, agricultural monitoring, disaster early warning, and infrastructure development [
6,
7,
8,
9]. Consequently, obtaining high-quality, real-time remote sensing data is essential for ensuring the accuracy of vegetation cover mapping. The continuous innovation in remote sensing technology has significantly enhanced the precision of vegetation cover mapping [
10]. Alongside the ongoing optimization of remote sensing sensors, data processing algorithms, and deep learning techniques [
11,
12,
13], the capabilities for acquiring and processing remote sensing data have been markedly improved, leading to substantial advancements in the accuracy of vegetation cover mapping.
Several key machine learning algorithms are widely used in the classification processing of remote sensing images, including support vector machine (SVM) [
14], random forest (RF) [
15], and K-nearest neighbor (KNN) [
16]. Support vector machines (SVMs) excel in finding optimal hyperplanes for data classification, particularly in linearly separable scenarios, but struggle with noisy and imbalanced datasets in remote sensing. Random forests (RFs) mitigate overfitting by aggregating multiple decision trees, ensuring stable predictions, yet they may underperform with high-dimensional data due to irrelevant feature selection. K-nearest neighbor (KNN) is simple and intuitive but suffers from high computational complexity with large datasets, making it inefficient for extensive remote sensing data. These limitations hinder their direct and efficient application in such contexts.
In remote sensing image classification, deep learning has achieved remarkable progress, offering significant advantages over traditional methods. It excels at extracting complex, high-level features from large datasets, demonstrates superior feature selection accuracy, and effectively handles noise with strong adaptive capabilities. It is worth noting that in recent years, the field of deep learning has been developing rapidly and changing day by day, and its application in the classification of vegetation cover has become more widespread, becoming the mainstream research and application method in this field [
17,
18,
19]. Convolutional neural network (CNN), a popular neural network, has seen widespread usage in remote sensing categorization. The research of Teja Kattenborn et al. showed that CNN’s ability to exploit spatial patterns particularly enhances the value of very high spatial resolution data, especially in the vegetation remote sensing domain [
20]. Xiankun Sun et al. coupled CNN with SVM for an empirical investigation of volcanic ash cloud categorization for the Moderate Resolution Imaging Spectrometer (RSI) [
21]. Linshu Hu et al. introduced a CNN-based method for volcanic ash cloud classification, utilizing an end-to-end IE neural network to tackle the scarcity of labeled data in low-light remote sensing. Results showed that RSCNN surpasses traditional IE techniques, achieving a higher structural similarity index and peak signal-to-noise ratio [
22]. But CNN mainly relies on local receptive fields, making it difficult to capture global contextual information in images, while land cover classification in remote sensing images often relies on global spatial relationships [
23]. Since the birth of the Transformer [
24], it has gradually emerged among many models due to its powerful sequence modeling capability and simultaneous perception of the global information of the input sequence. It utilizes the attention mechanism to establish global dependencies between inputs and outputs, while positional encoding effectively addresses the challenge of representing sequence elements’ relative or absolute positional relationships. In 2020, Google proposed the Vision Transformer (ViT) [
25], which is a milestone for the application of the Transformer in computer vision, successfully integrating the Transformer architecture into the image classification model. Hong et al. introduced a new backbone network, SpectralFormal, that mines spectral local sequence information from nearby bands of hyperspectral pictures to build component spectral embeddings [
26]. Meiqiao Bi et al. proposed ViT-CL, a Vision Transformer (ViT)-based model integrated with supervised contrastive learning, extending the self-supervised contrastive approach to a fully supervised framework. This method leverages label information in the embedding space of remote sensing images (RSIs), enhancing robustness against common image corruptions [
27]. However, multispectral remote sensing data contain multiple spectral bands, and ViT may not be able to fully utilize this additional spectral information.
Multilayer Perceptron (MLP) and Recurrent Neural Networks (RNNs) have achieved good results in remote sensing image classification. MLP is the classical nonparametric machine learning method and the most widely used neural network for time series data prediction, aiming to learn the pixel-level nonlinear spectral feature space. IR Widiasari et al. predicted flood events based on rainfall time series data and water level using MLP networks [
28]. Z Meng suggested a spectral–spatial MLP (SS-MLP) architecture that employs matrix transpositions and MLPs for spectral and spatial perception in the global receptive field, capturing long-term relationships and extracting more discriminative spectral–spatial characteristics [
29]. Ce Zhang et al. proposed an integrated classifier MLP-CNN from the complementary results obtained from CNN based on deep spatial feature representation and MLP based on spectral discrimination [
30].
Recurrent neural networks (RNNs) have shown significant potential in analyzing and processing time-series data from multispectral remote sensing images. C. Qi et al. proposed the use of a long-short-term memory network model (LSTM) to invert key water parameters in the Taihu Lake region [
31]. As a variant of RNN, LSTM effectively addresses the gradient vanishing problem by incorporating memory units in each hidden layer neuron, enabling controlled storage of time-series information. Each unit utilizes adjustable gates—forget gate, input gate, candidate gate, and output gate—to determine which past and present information to retain or discard, granting the RNN network long-term memory capabilities. G. Wu et al. proposed a new three-dimensional Softmax-guided bi-directional GRU network (TDS-BiGRU) for HSI classification [
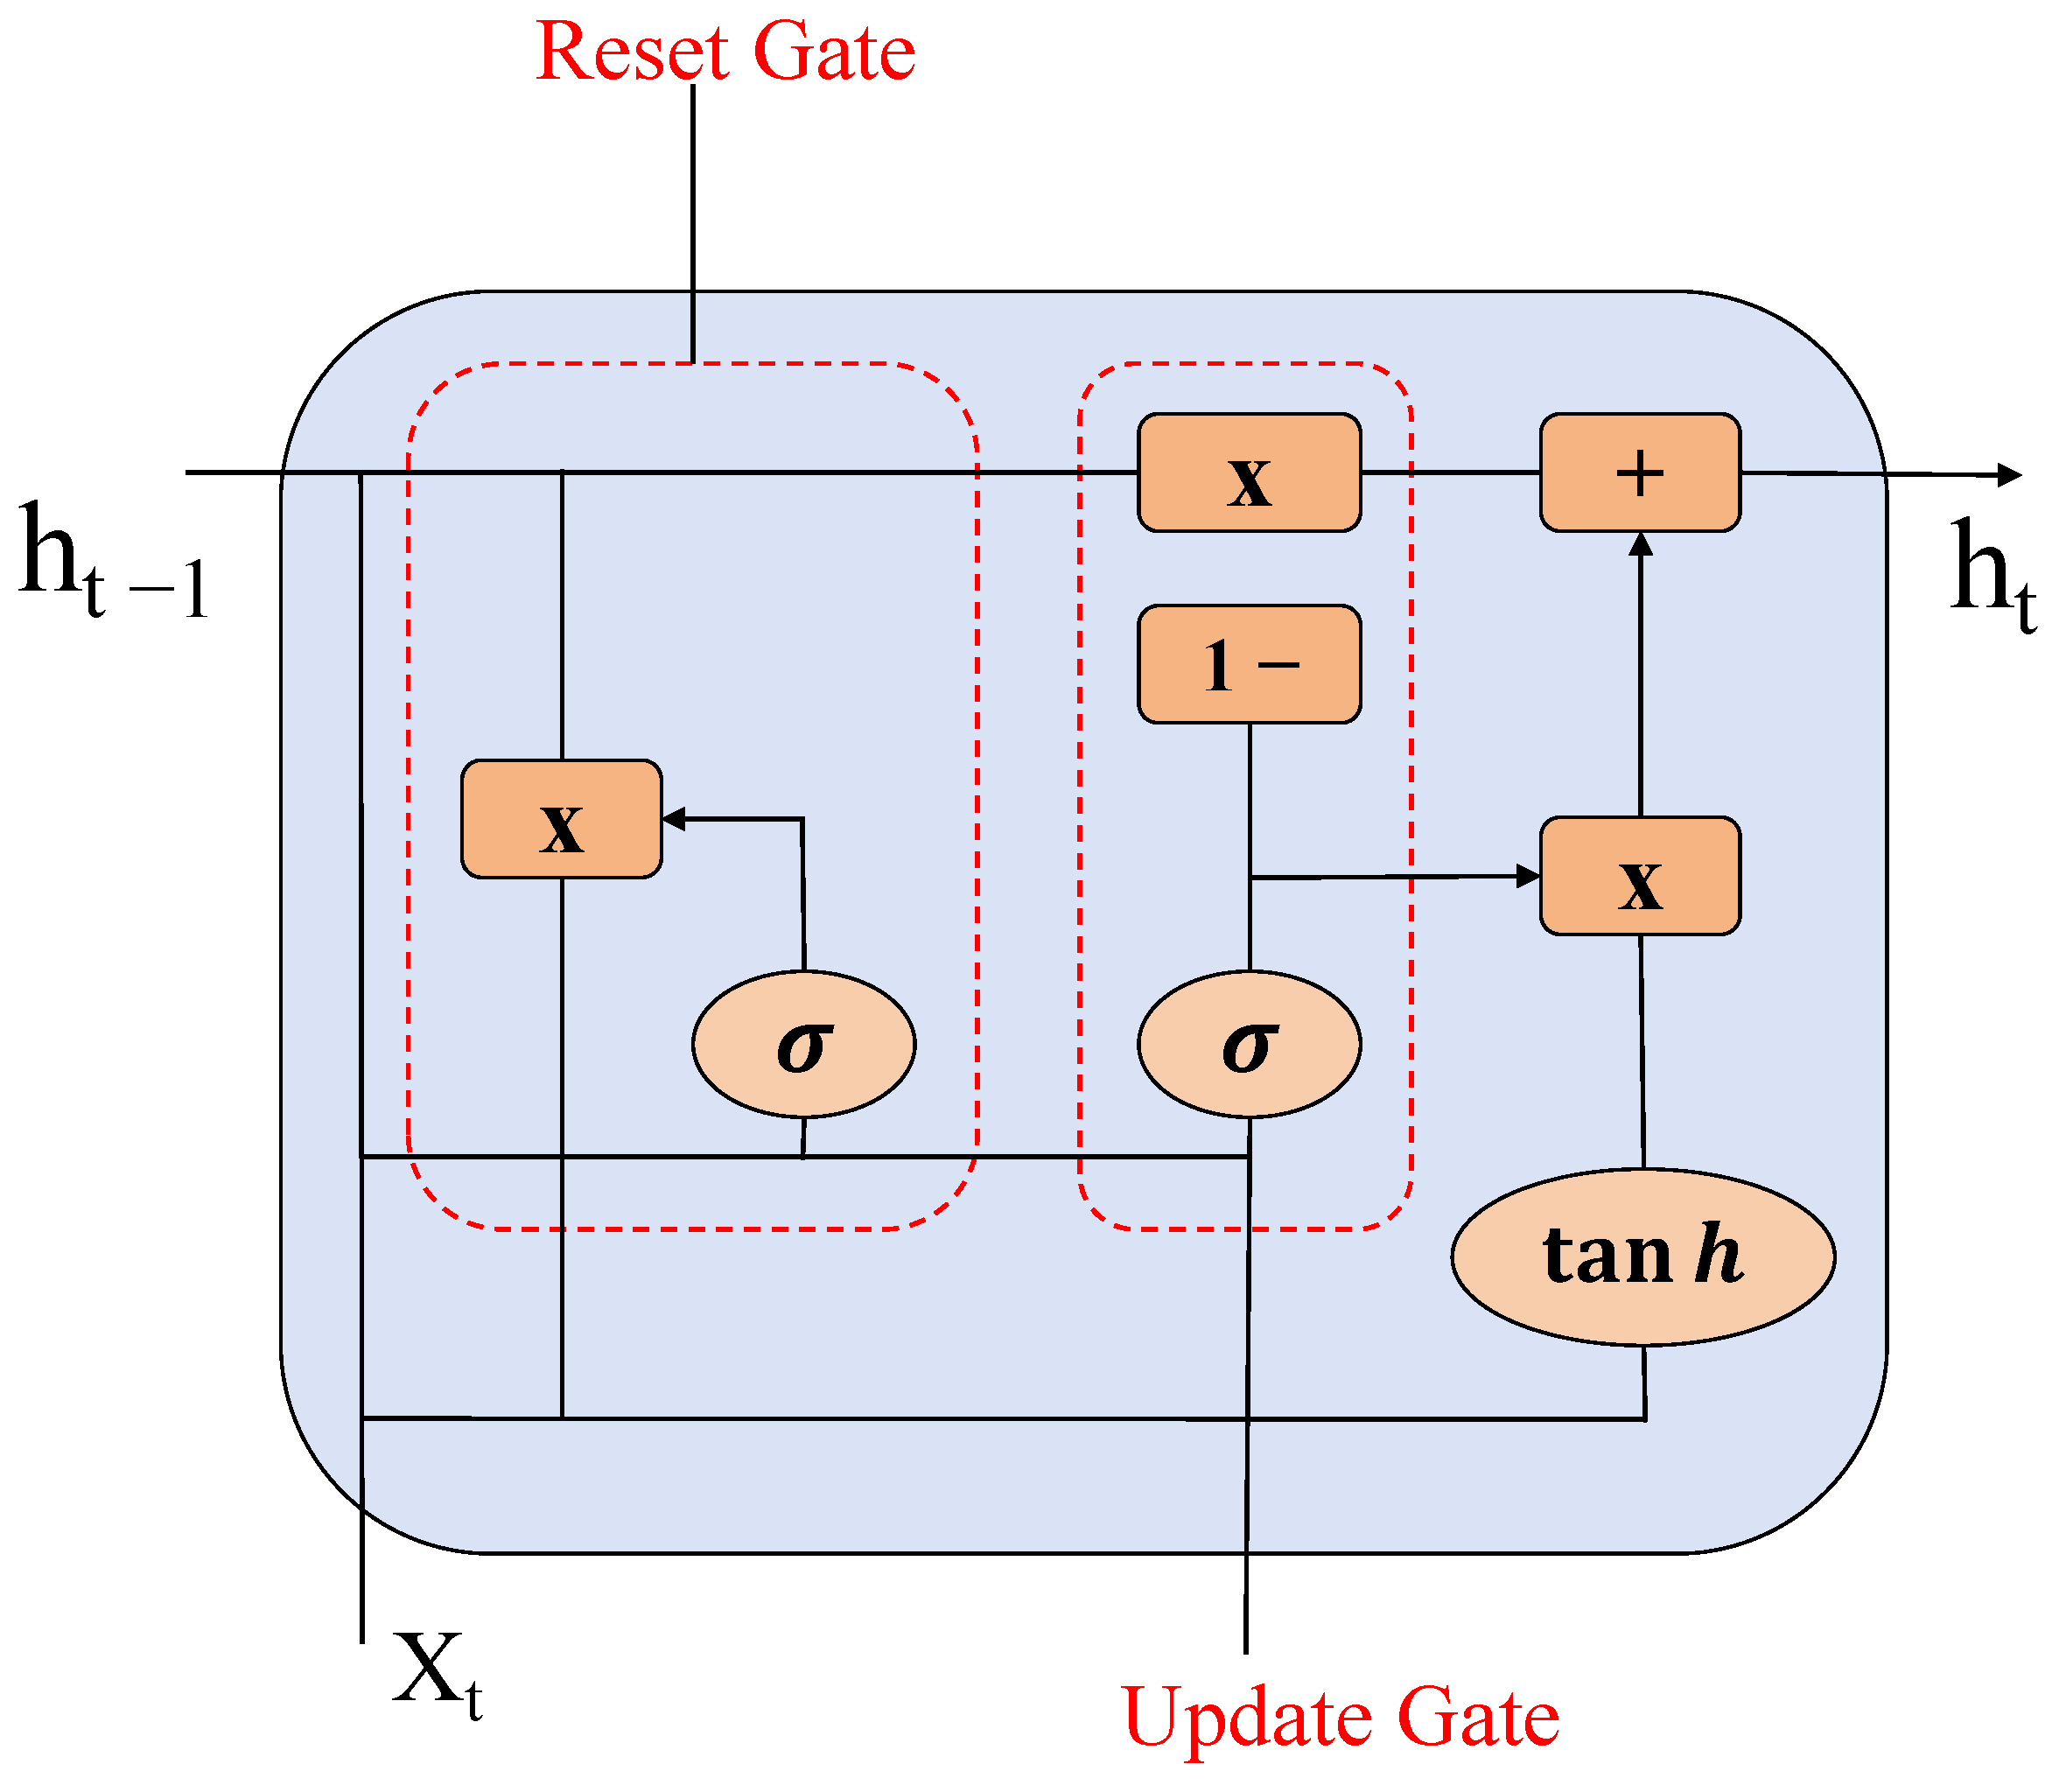
32]. The processing time can be significantly reduced by utilizing bi-directional GRU for sequence data. Both GRU and LSTM are variants of RNN; GRU, as a variant of LSTM, synthesizes the forget gate and input gate into a single update gate. It likewise mixes cell states and hidden states, plus a few other modifications. The final model is simpler than the standard LSTM model and is also a very popular variant [
33].
However, MLP and RNN have certain limitations in multispectral remote sensing image classification [
34,
35]. MLP processes spectral bands independently, failing to capture their intrinsic connections and synergistic information, which can lead to misclassification or low accuracy in multispectral analysis. For instance, it struggles to integrate correlations between bands reflecting vegetation’s water and chlorophyll content. Similarly, RNN, designed for sequence classification, is limited in extracting spatial information from images. Multispectral remote sensing images contain rich spatial details, such as feature shapes, textures, and neighboring pixel relationships. However, RNN struggles to leverage these spatial differences, making it challenging to accurately classify closely adjacent features with similar spectral characteristics, such as buildings and roads.
In recent years, many scholars have proposed a number of combined model approaches to further improve the accuracy of vegetation cover. DuF et al. introduced an efficient MLP-assisted CNN network with local–global feature fusion for hyperspectral image classification (EMACN) [
36]. For the study of the fusion of MLP and RNN, K Wei et al. proposed a multilayer perceptron (MLP)-dominated gate fusion network (MGFNet) [
37]. A well-designed MGF module then combines multimodal characteristics through controlled fusion stages and channel attention, employing the MLP as a gate to make use of complementary information and eliminate duplicate data.
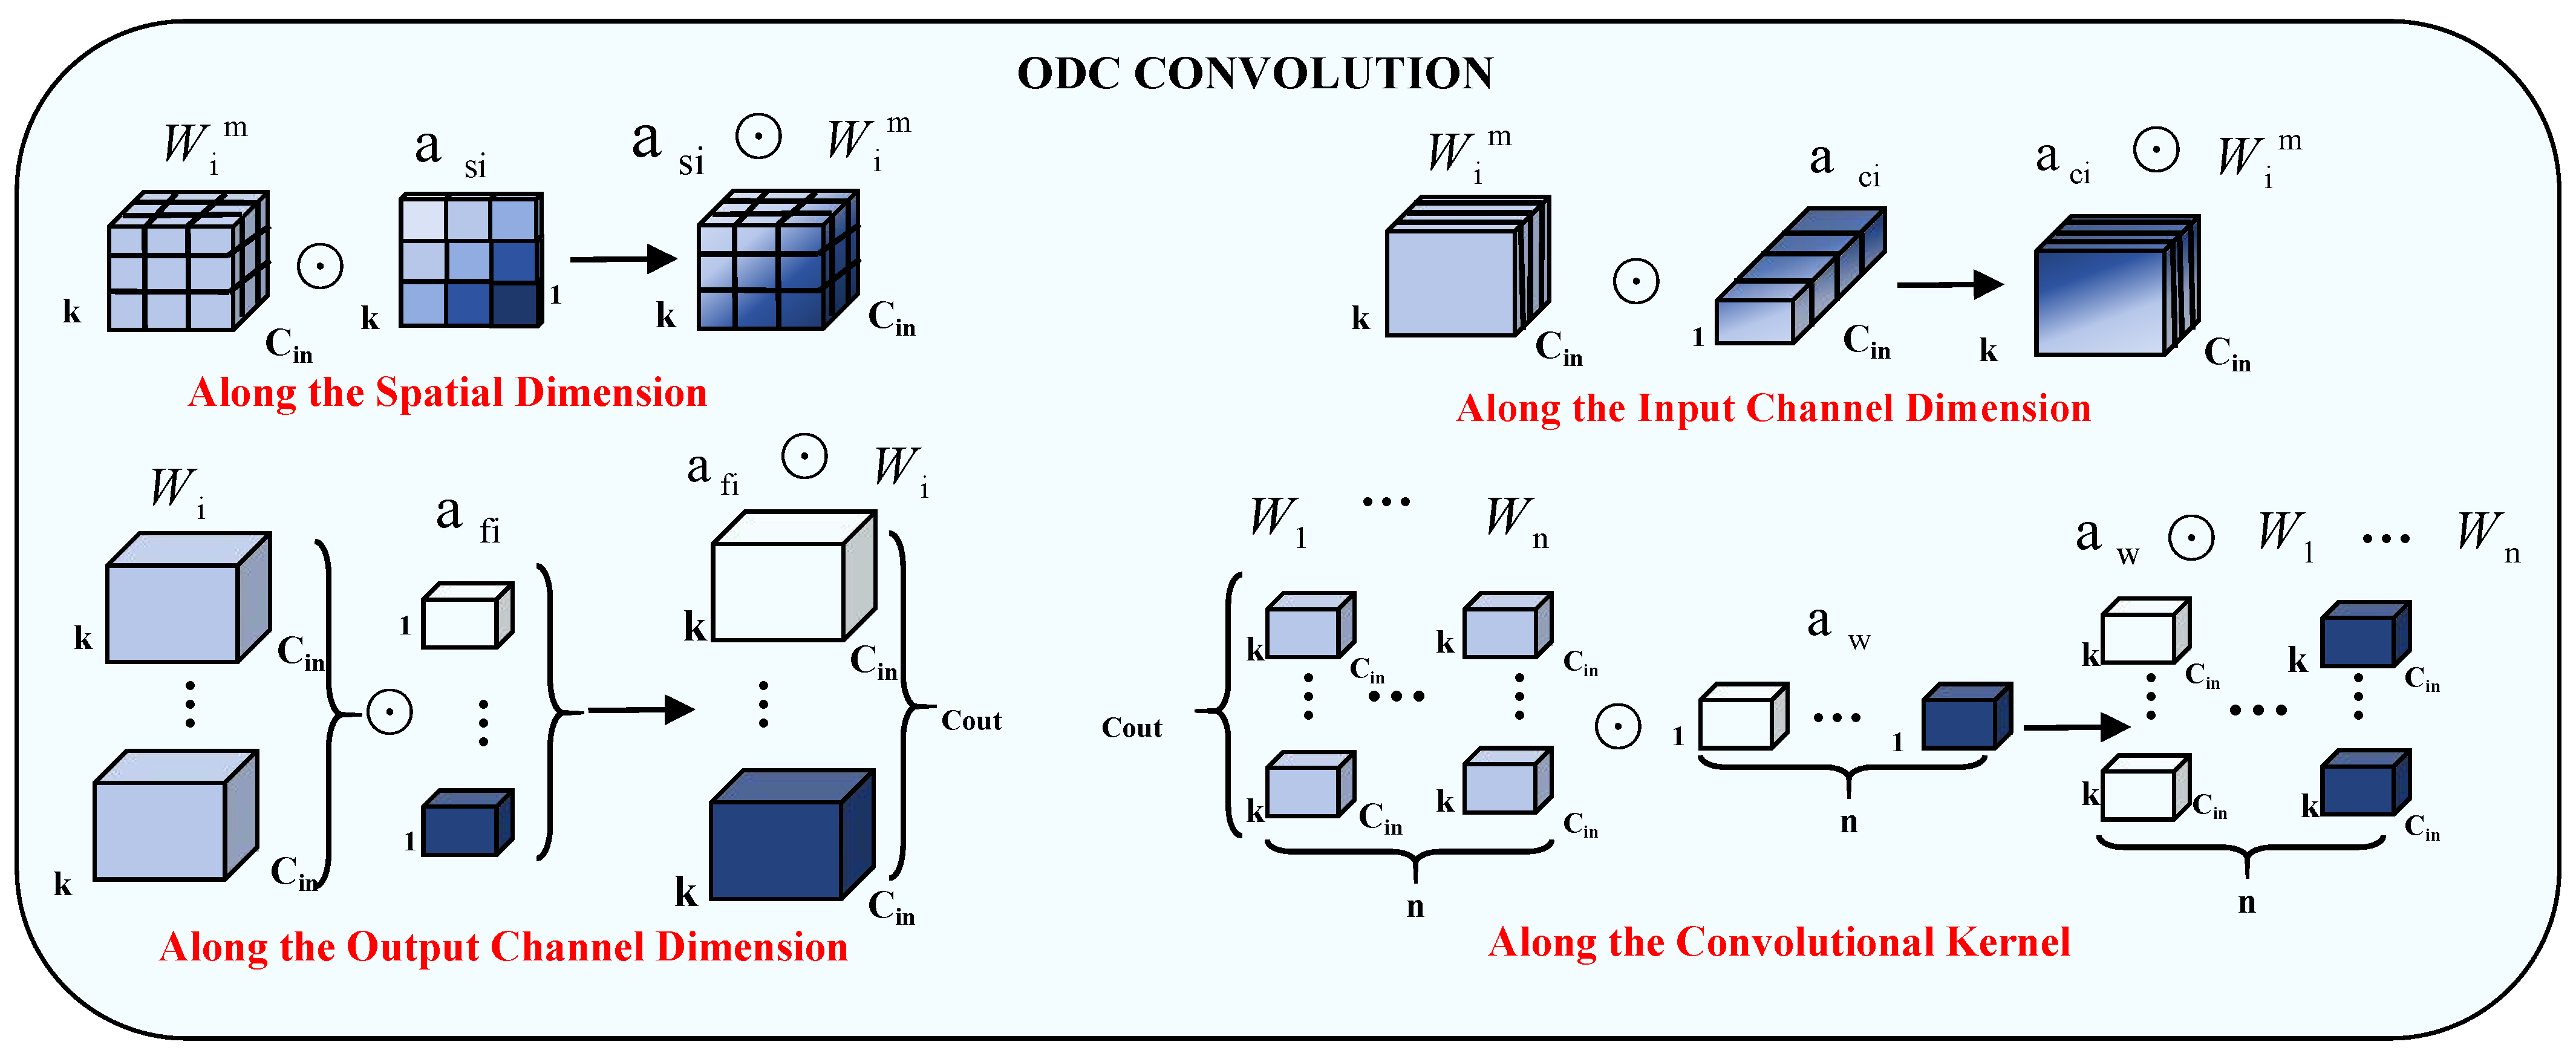
This paper proposes LO-MLPRNN to improve multispectral image pixel classification by better leveraging contextual information. In the LO-MLPRNN network framework, the band information of hyperspectral images is processed by the parallel fusion of ODC and LSK modules, and the resulting parallel features are fused. Then, the features extracted by the GRU are further mapped to the high-dimensional feature space through the fully connected layer, and the nonlinear characteristics are strengthened by the sigmoid function. Finally, the classification layer is used to achieve fine multispectral image classification.
The main contributions of this paper are:
- (1)
A multispectral remote sensing image classification model fusing MLP and RNN is proposed, where the powerful nonlinear mapping of MLP is combined with RNN’s ability to process sequence context and long-term dependence. This combination can more comprehensively extract the data features, taking into account the spectral and spatial sequence features to accurately identify the features in remote sensing image analysis.
- (2)
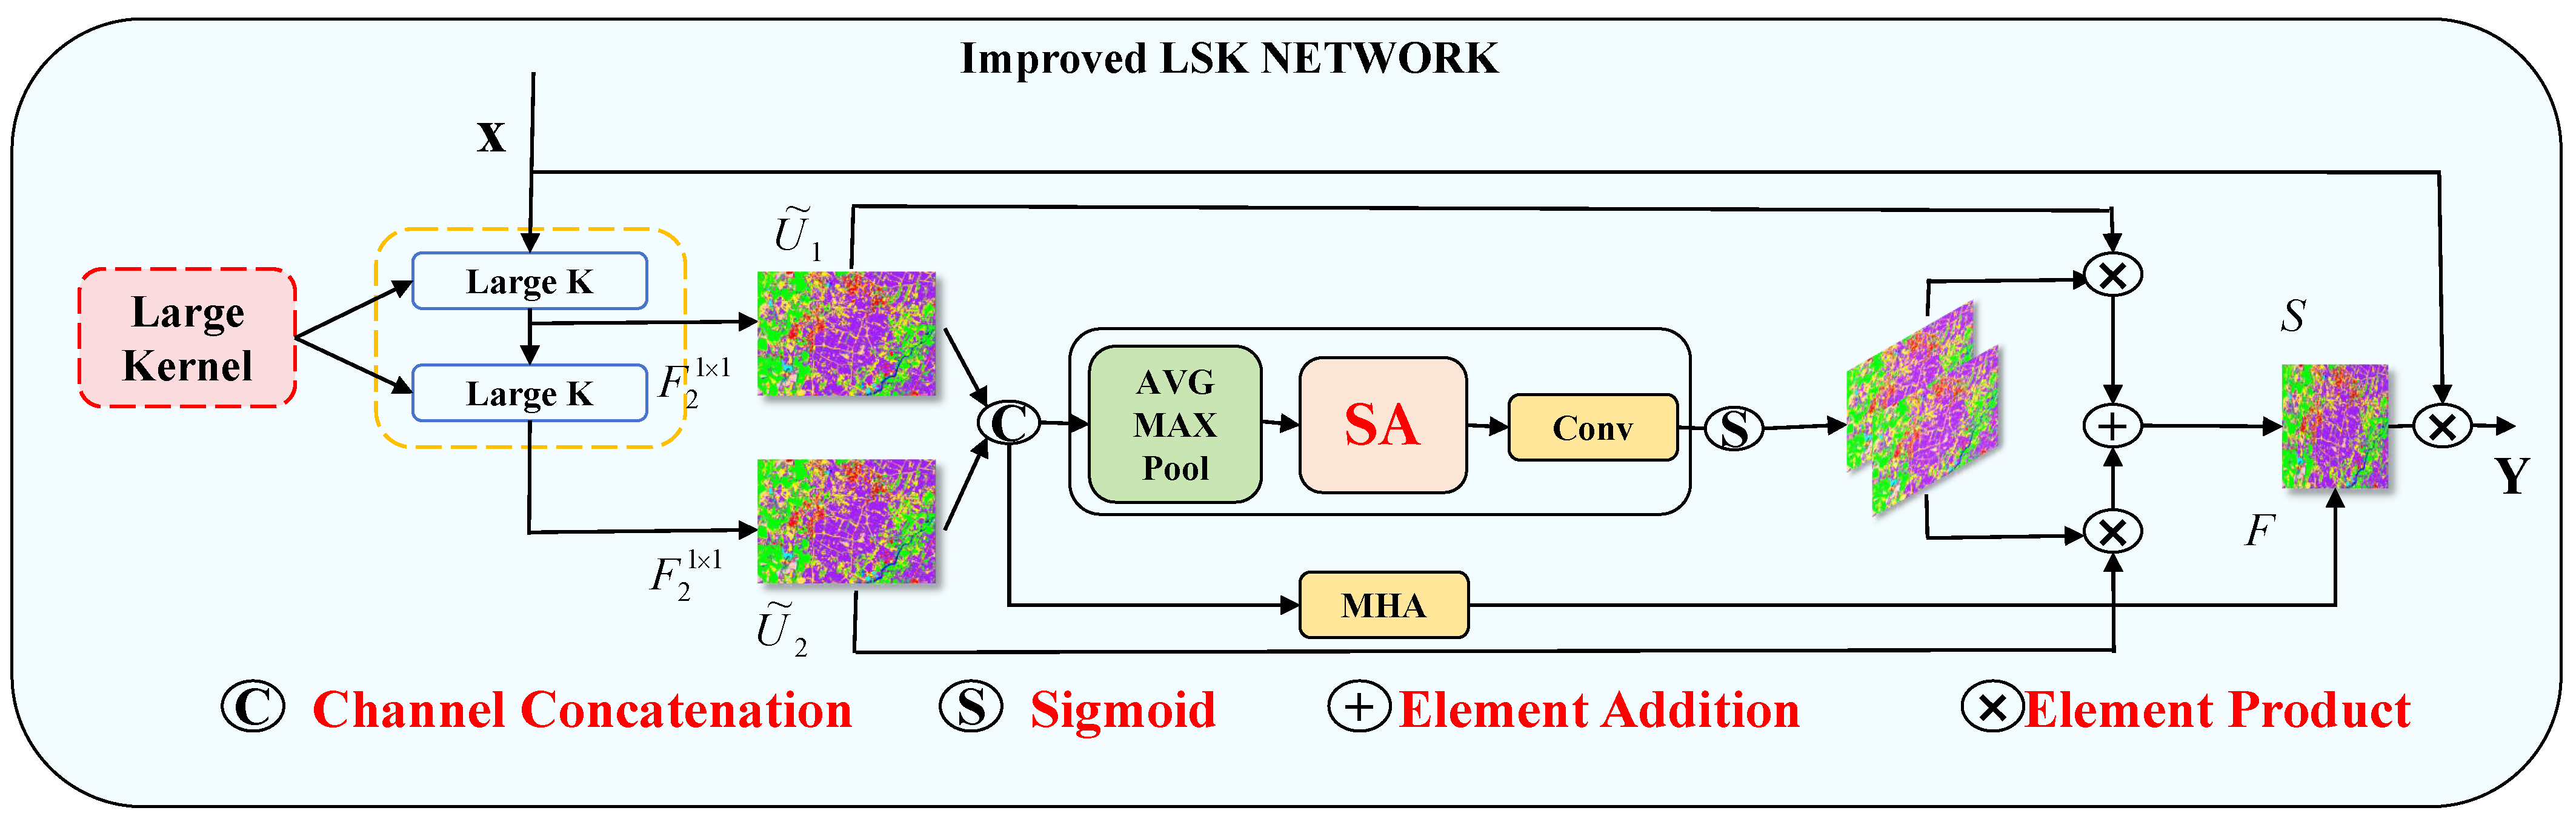
From the perspective of multi-feature fusion perception, we propose the MLPRNN network architecture that introduces LSK and ODC. At the same time, we incorporate the multi-head attention mechanism in the LSK module. The two modules fully incorporate the spatial and channel positional associations while allowing the lexical features to have richer expressions for better pixel-level image classification, with a comprehensive classification accuracy of up to 99.43%.
- (3)
The dynamic change analysis of vegetation utilization in the study area was carried out, focusing on the changes in the distribution area of forests and sugarcane during the period of 2019–2023. Changes in forest cover and crop acreage can visualize the relationship between regional economic development and ecological diversity conservation.
This manuscript is organized into several sections.
Section 2, titled “section: Materials and methods”, will delineate the materials utilized in the study area, the image processing techniques employed, and the network framework established.
Section 3, section: Experiments and Results, will provide a comprehensive account of the experimental procedures conducted and the subsequent interpretation of the results obtained.
Section 4, section: Discuss, will critically analyze both the strengths and limitations of the experiments undertaken. Lastly,
Section 5, section: Conclusions, will encapsulate the experiments and findings presented in this paper while offering recommendations for future research endeavors.
3. Results
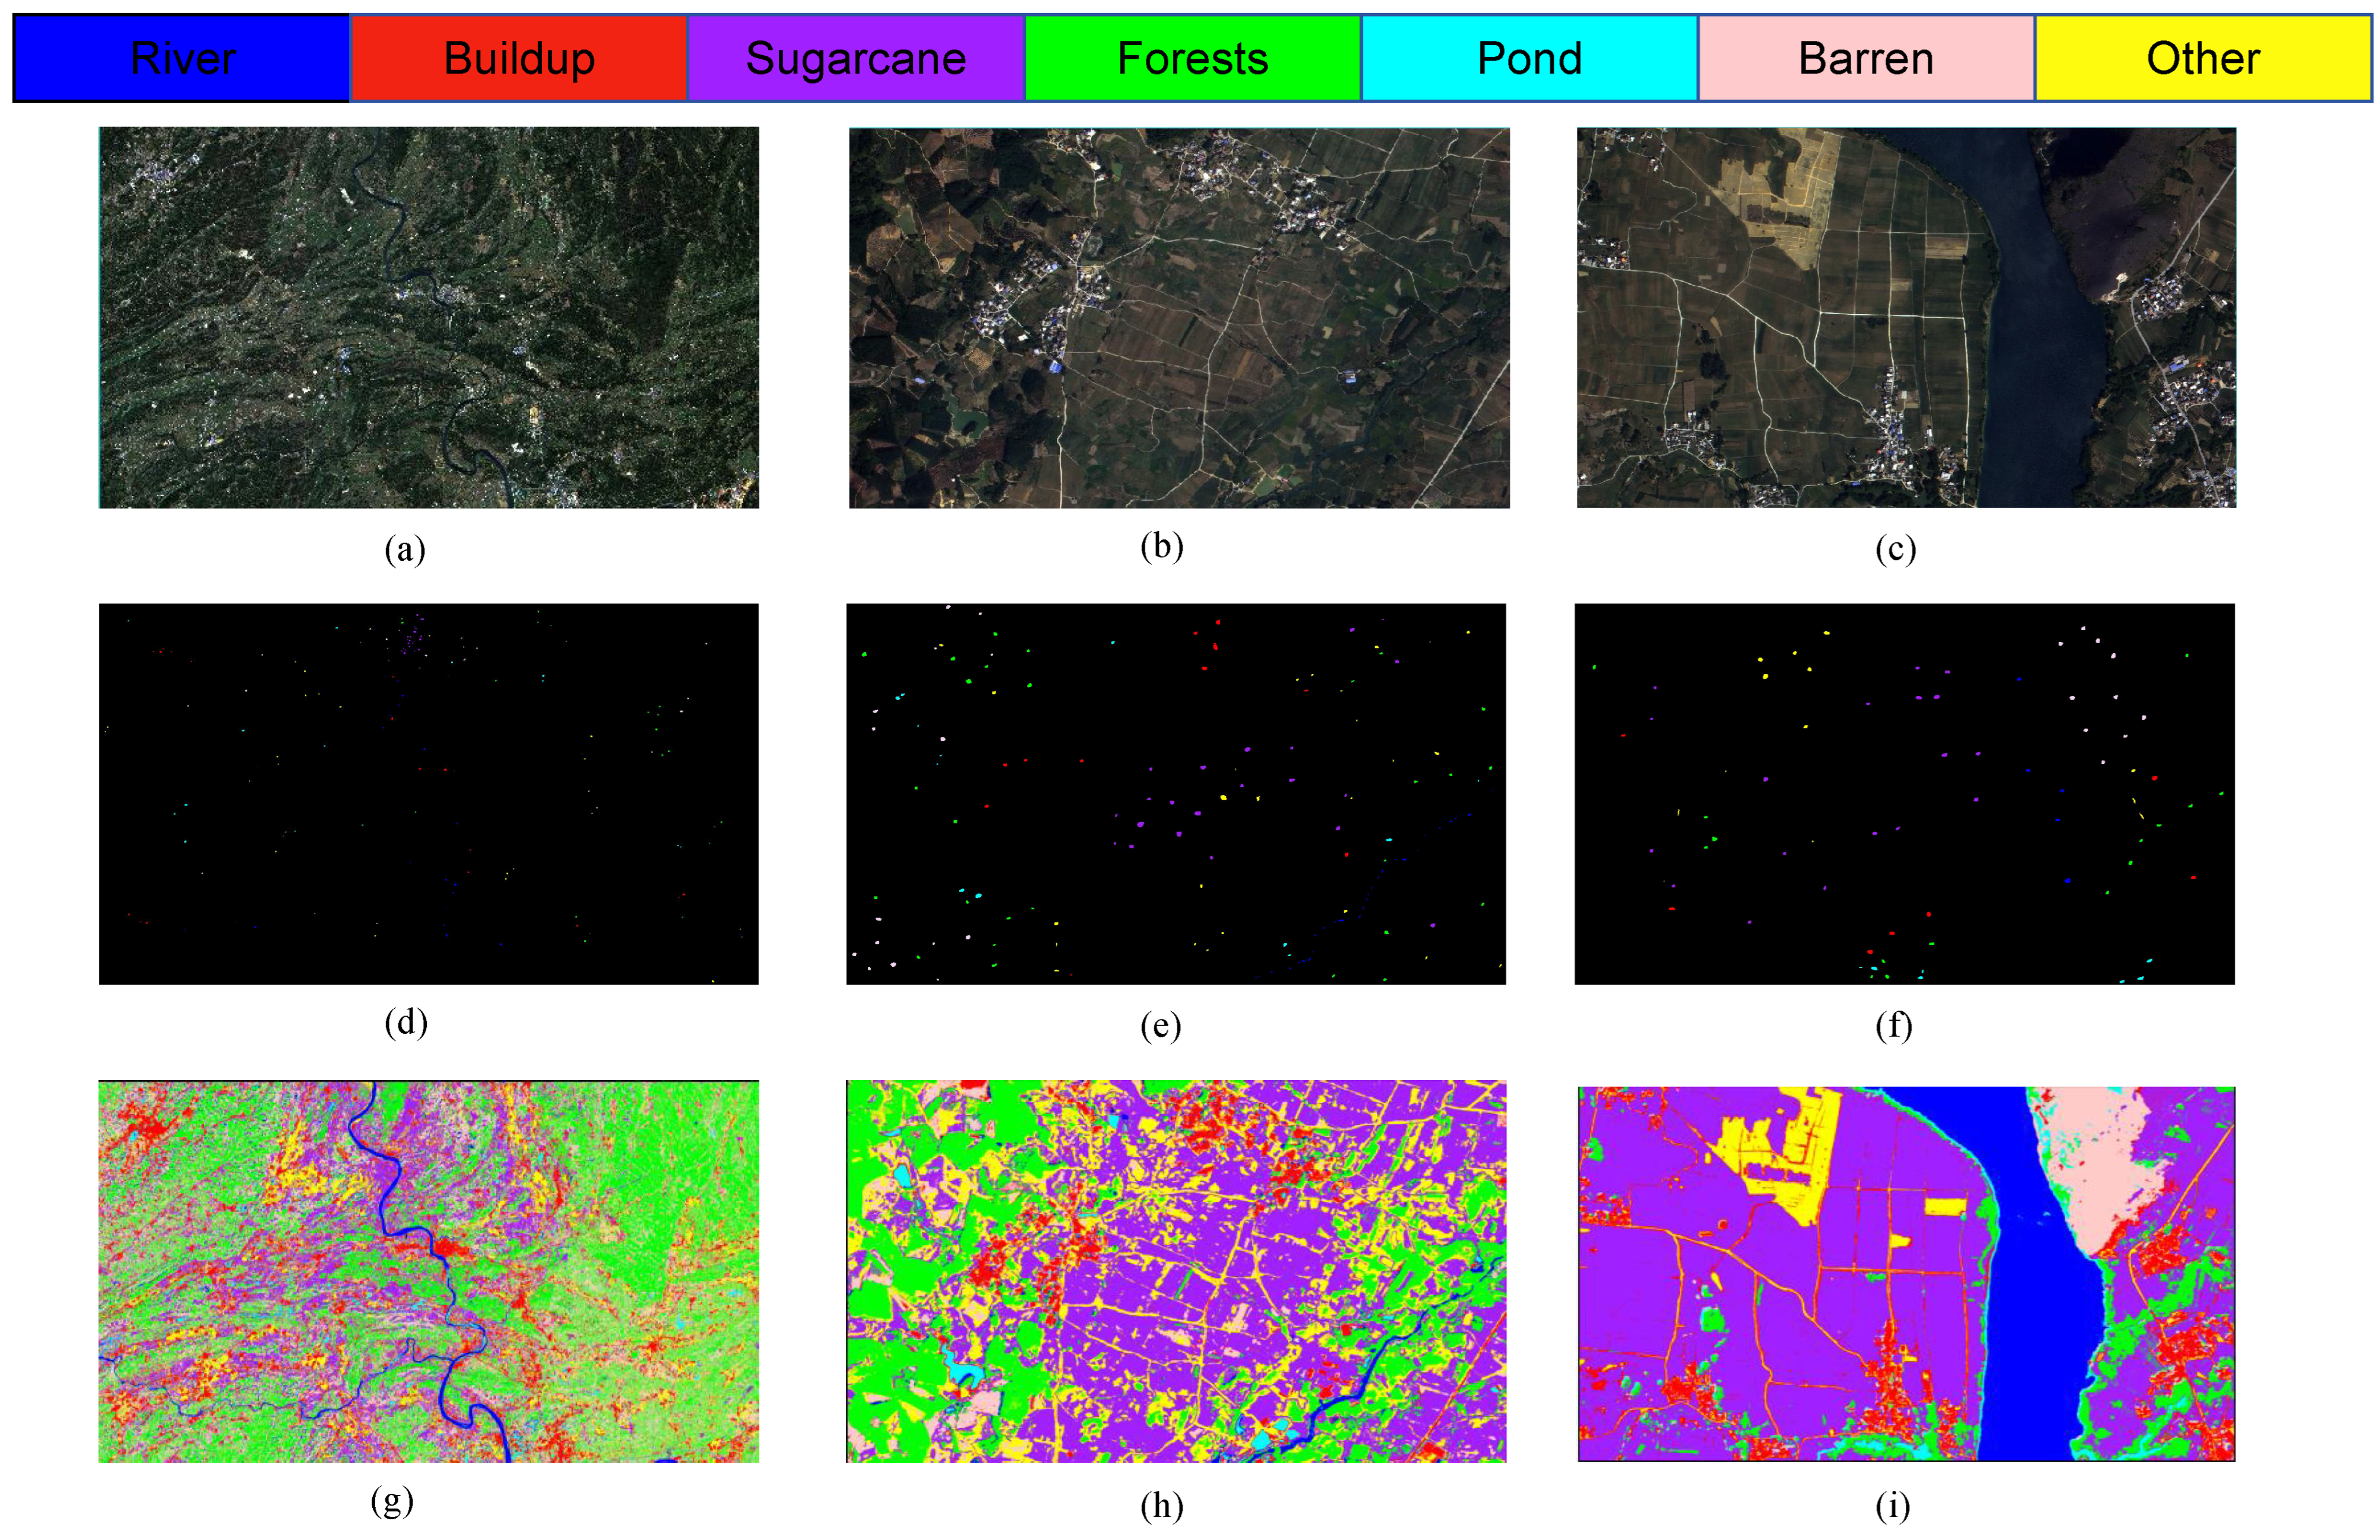
In order to demonstrate the performance of the model more intuitively,
Figure 7 shows the original images of the study area, partial ROI labels of ground truth values, and the classification images of the model proposed in this study. In this experiment, the ROI labels of the study area were obtained through field investigations and expert experience on high-resolution GF-2 and Sentinel-2 remote sensing images. The specific sample values are shown in
Table 1.
3.1. Ablation Experiment
To assess the efficacy of the network architecture proposed in this study, ablation experiments were performed utilizing the datasets from the S1 and S2 study areas. The results pertaining to the GF-2 dataset are presented in
Table 2. The OA achieved by the combination of MLP and RNN alone is 97.40%, indicating satisfactory performance. This outcome can be attributed to the dataset’s four-band imagery, which facilitates enhanced feature learning and maintains a higher level of accuracy. The ODC module does not significantly alter the overall accuracy, yielding an OA of 97.24%. The attention mechanism inherent to the ODC may not effectively capture the intricate relationships among the input features of the MLPRNN across time series, thereby limiting its capacity to enhance feature representation and improve accuracy substantially.
In contrast, the introduction of LSK alone results in an OA of 98.99%, alongside improvements in the Average Accuracy (AA) and Kappa statistics, suggesting that LSK effectively addresses the challenges posed by complex sequences. However, the addition of LSK, which employs multiple attention heads, may inadvertently lead to an overemphasis on specific local features, resulting in a slight decline in accuracy, with an OA of 98.88%. The combination of ODC with an unimproved LSK yields an OA of 97.76%, with all validation metrics showing enhancement compared to the MLPRNN, thereby demonstrating the synergistic benefits of this combination for improving image classification performance.
The fully integrated LO-MLPRNN was subsequently evaluated, achieving an OA of 99.11%, which represents a 1.71% improvement over the MLPRNN. The AA reached 99.01%, reflecting a 2.17% enhancement, while the Kappa statistic increased to 0.9892, an improvement of 0.0205, thereby indicating superior performance.
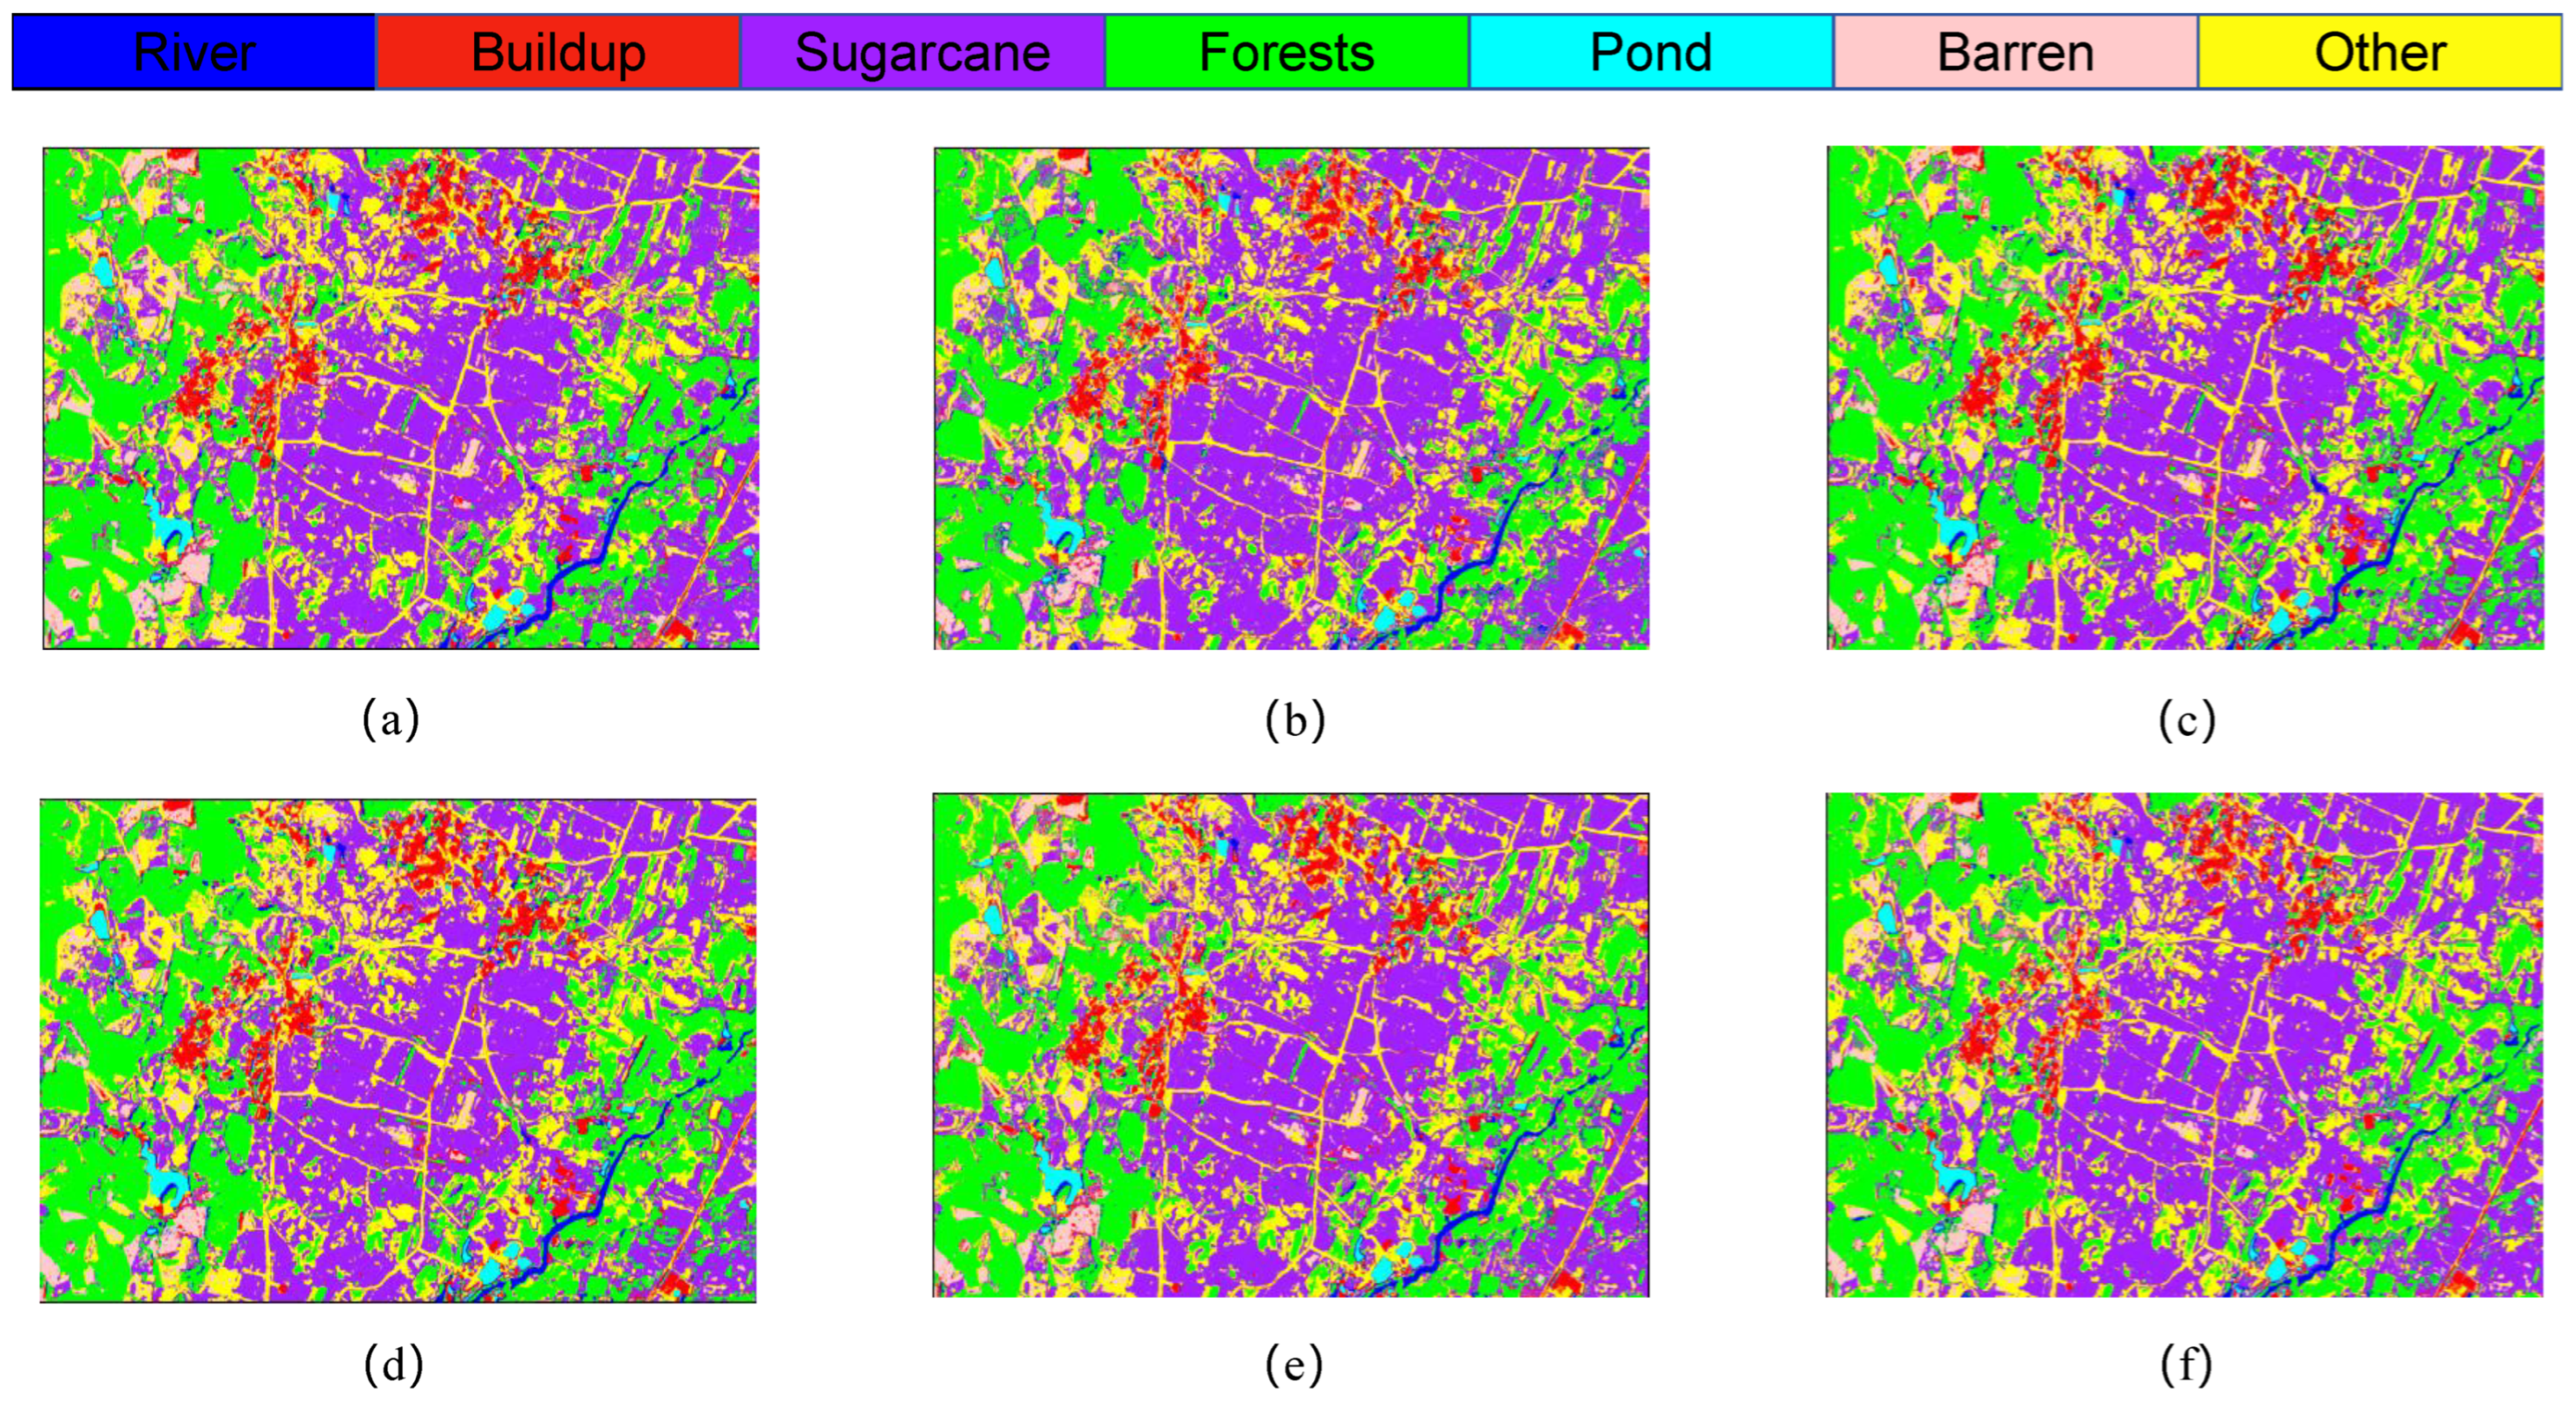
Figure 8 presents the classification outcomes for various combinations of module pairs applied to the GF-2 study area dataset, which includes categories such as forests, sugarcane, and barren land. Comparing
Figure 8a, it is observed that the inclusion of the ODC module alongside the LSK module enhances the accuracy of sugarcane classification. However, when the LSK and ODC modules are integrated in parallel, the classification results depicted in plots
Figure 8c,d do not achieve the same level of accuracy in identifying built-up areas as plot
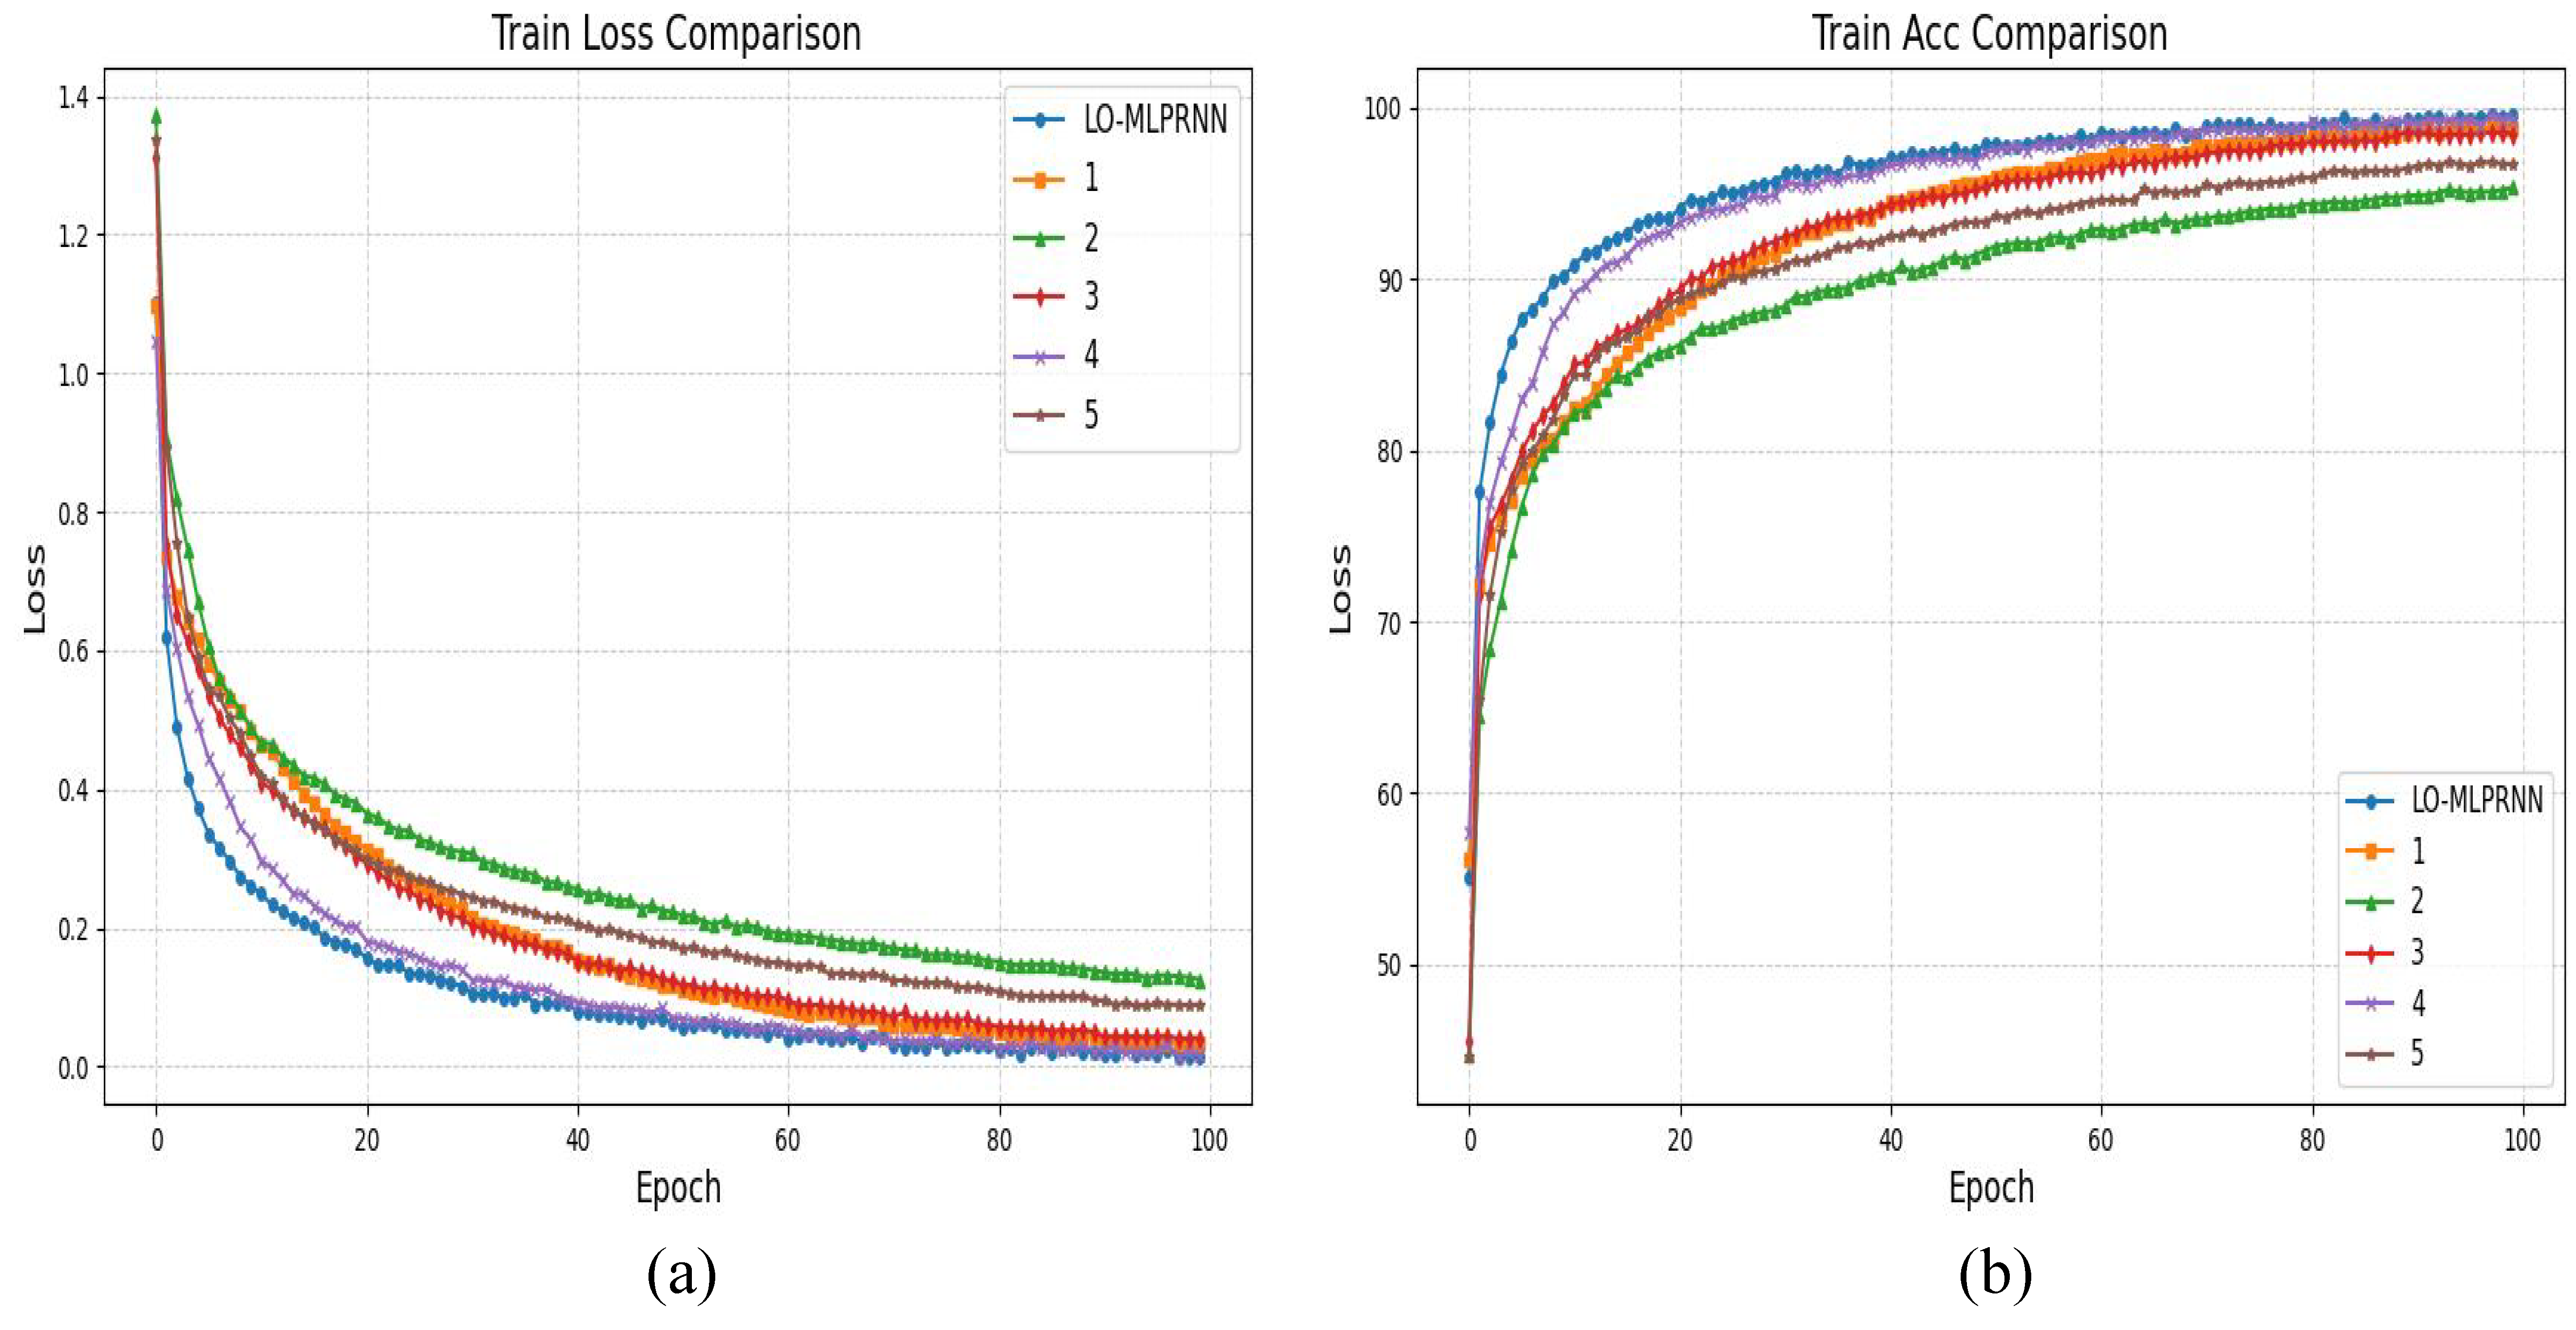
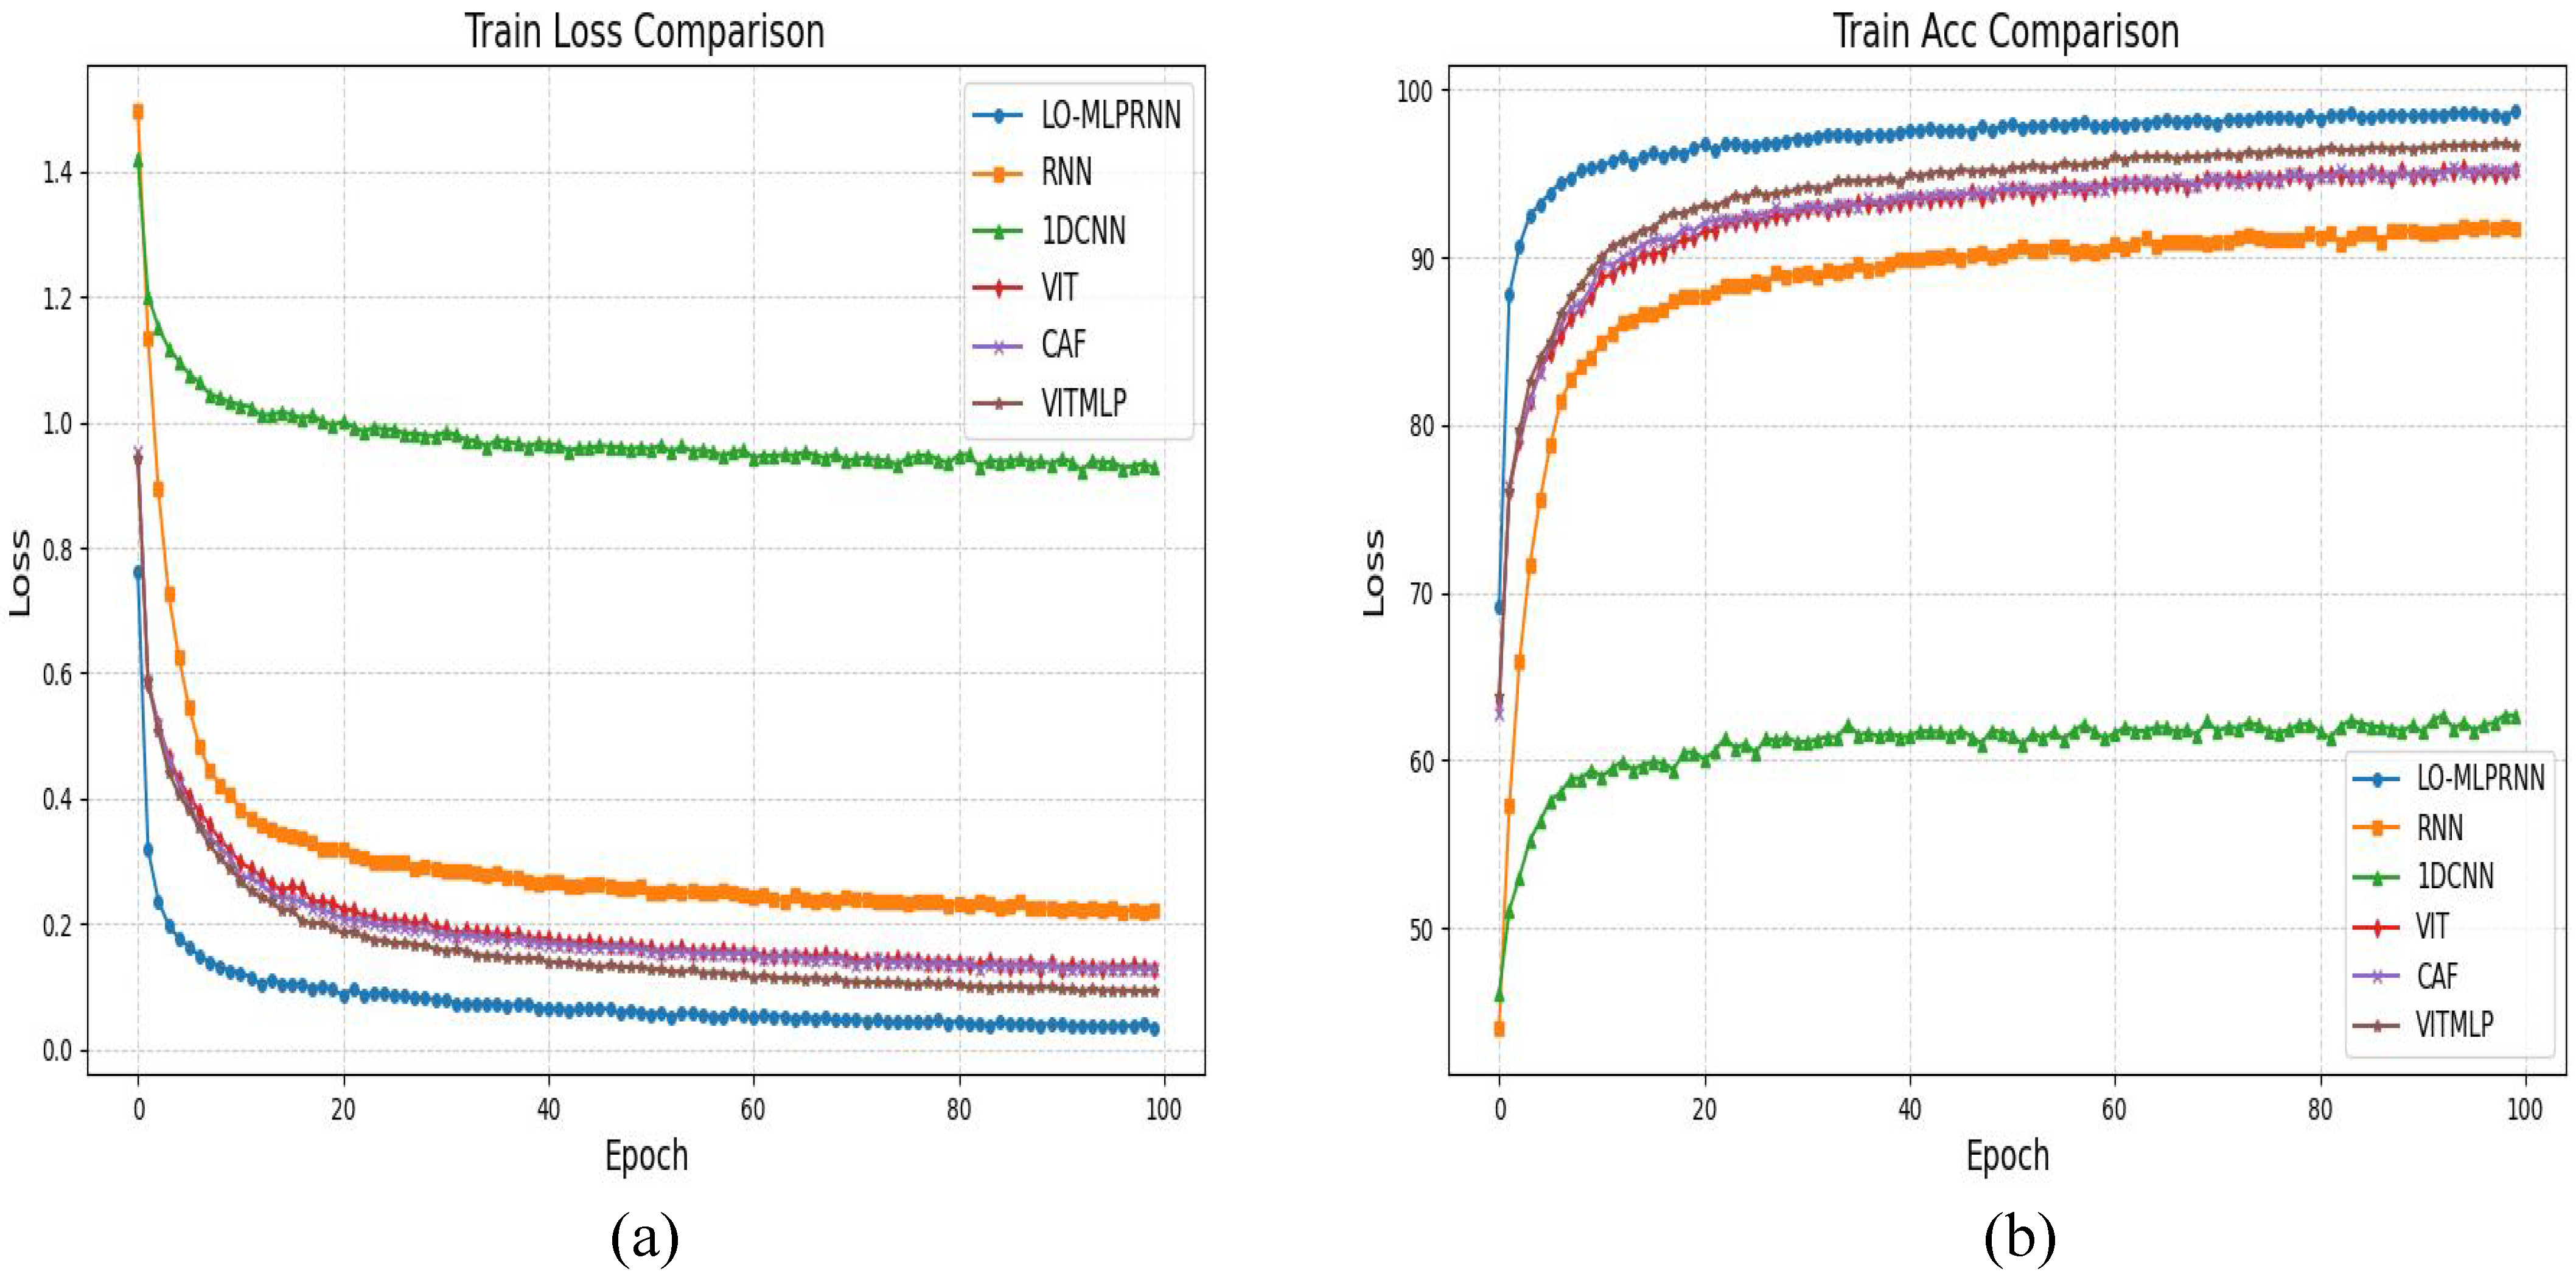
Figure 8e. Notably, the comprehensive LO-MLPRNN model demonstrates superior discriminative capabilities compared to any other module combination. The primary challenge in classifying this region arises from the overlap between barren land and sugarcane; nevertheless, the complete LO-MLPRNN model exhibits the most effective performance, characterized by significant denoising capabilities. The changes in loss function and accuracy with the number of iterations during the training process are shown in
Figure 9.
The experimental findings pertaining to the Sentinel-2 dataset are presented in
Table 3. Following the expansion of both the study area and the number of spectral bands, the overall accuracy (OA)of the MLPRNN was recorded at 92.93%. This result suggests that an increase in the number of bands necessitates a more intricate model architecture to effectively manage the data, as there exists a notable correlation among the 12-band dataset that may hinder the simple model’s ability to extract and learn essential features. As additional modules are incorporated, there is a corresponding enhancement in accuracy. Notably, the accuracy of the MLPRNN when integrated with multi-head attention exhibits a substantial improvement, achieving an OA of 98.62%, an average accuracy (AA) of 98.63%, and a Kappa coefficient of 98.39%. This underscores the advantages of employing multi-head attention in the classification of multi-band remote sensing imagery. Ultimately, after the integration of all modules, the OA reached 99.43%, reflecting a 6.4% increase compared to the baseline MLPRNN, with both AA and Kappa also demonstrating significant improvements.
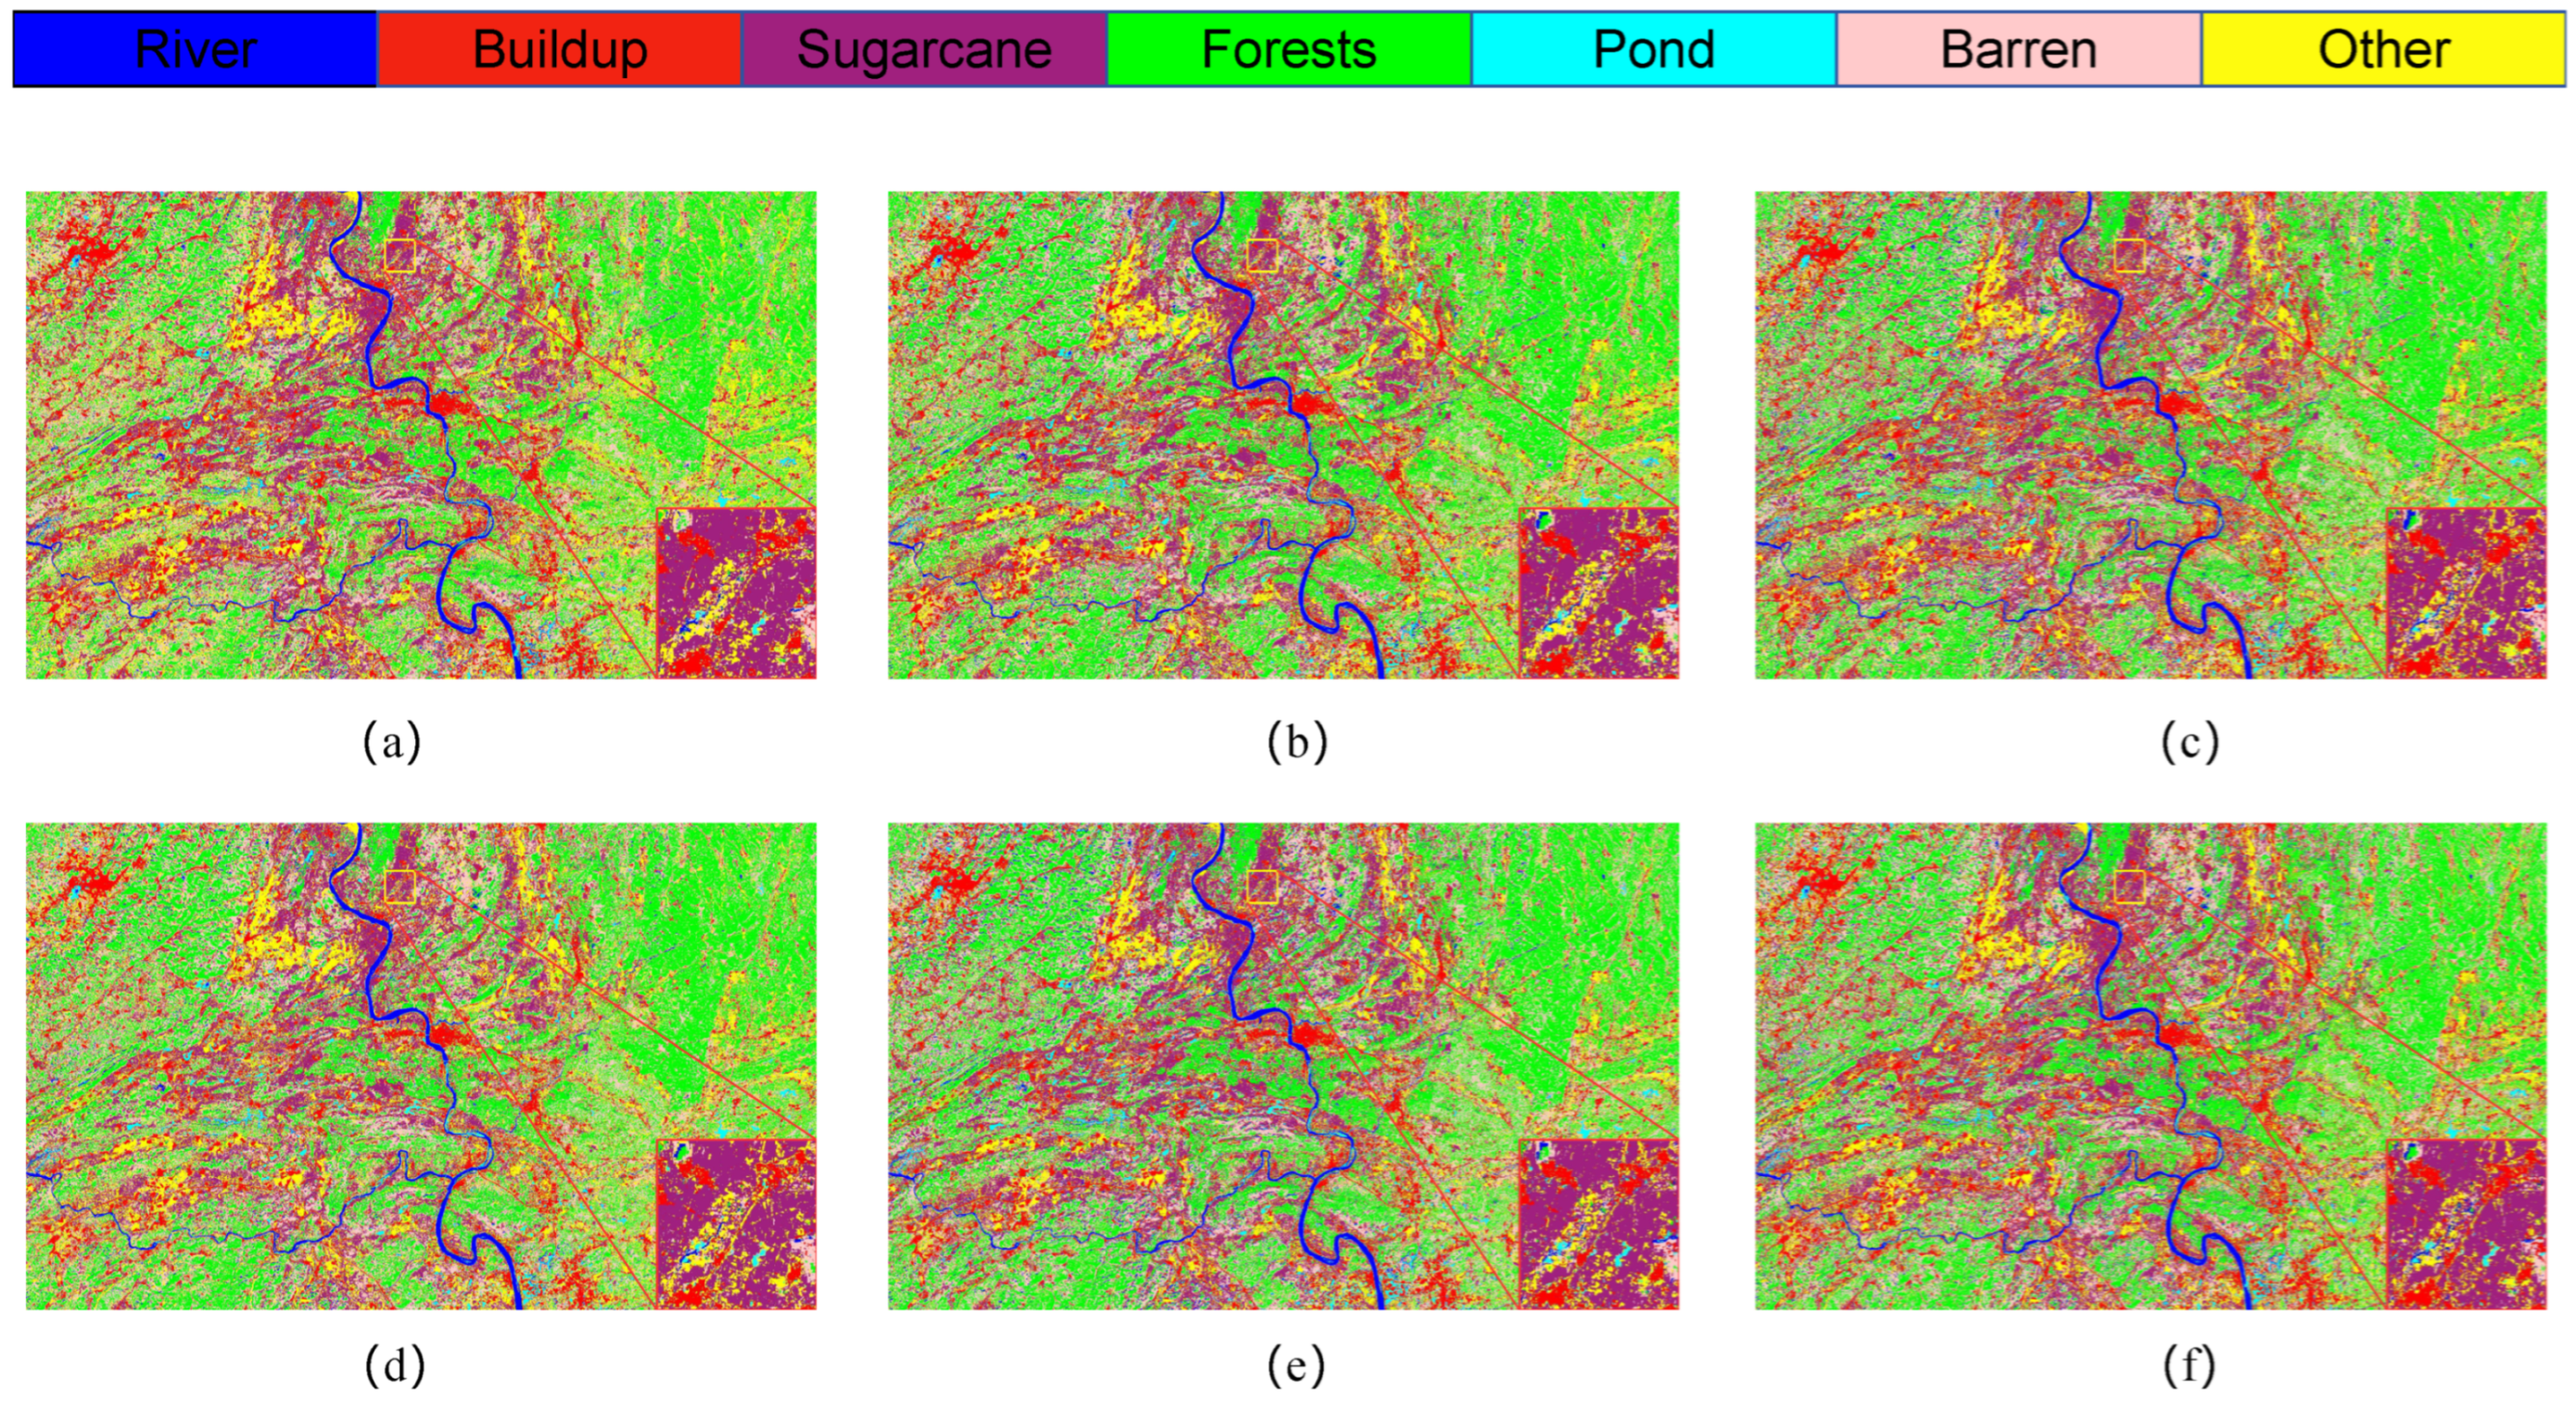
The classification outcomes for various combinations of module pairs within the Sentinel-2 study area dataset are illustrated in
Figure 10. The red box in the figure encompasses a portion of the S1 segment of the study area, which includes diverse land types such as sugarcane fields, barren land, and ponds. In the context of multiband analysis, as well as across the broader study area, the primary challenge in classification arises from the need to differentiate between sugarcane, barren land, and other agricultural crops. This difficulty is evident in the red box, which suggests that the MLPRNN model exhibits limitations in accurately classifying barren land and forested areas. Additionally, it is apparent that the inclusion of additional modules contributes to improved differentiation, particularly in more distinct regions such as water bodies and ponds. Notably, the complete LO-MLPRNN model continues to demonstrate a high level of classification accuracy when applied to 12-band multispectral images, indicating effective differentiation capabilities and the potential for further enhancement of network performance. The changes in loss function and accuracy with the number of iterations during the training process are shown in
Figure 11.
3.2. Multi-Method Comparative Experiments
To elucidate the performance enhancements associated with the proposed model, this study conducts a comparative analysis of the MLPRNN against several established algorithms, including SVM [
14], KNN [
16], 1D-CNN [
20], RNN, ViT [
25], SpectralFormer [
26], and ViTMLP [
43]. The following outlines the configuration parameters for each model:
For the SVM, the radial basis function (RBF) is employed as the kernel function, with a penalty factor set to 10 and the decision function shape designated as ‘one-vs-rest’ (ovr).
In the case of KNN, the number of neighbors (n_neighbors) is established at 3.
For 1DCNN, it consists of a 1D convolutional layer, a bulk normalization layer, ReLU activation function, a 1D maximal pooling layer, a fully connected layer, and an output layer.
The RNN architecture consists of two recurrent layers equipped with gating units.
For ViT, the structure consists of 5 encoder blocks, each processing a grouped spectral embedding with 64 dimensions. The interior of each encoder block consists of 4 self-attentive layers, a multilayer perceptron (MLP) with 8 hidden layers, and a dropout layer that randomly discards 10% of the neurons.
The SpectralFormer model retains the structure described in point (5), with the grouped spectral embedding configured to 2.
The ViTMLP model includes the architecture outlined in point (5) with the addition of MLP integration.
The LO-MLPRNN module encompasses the MLP module, the RNN module, and the modified LSK and ODC modules. The fully connected layer of the MLP has an input dimension of 128 and an output dimension of 256. The RNN module is structured as a two-layer Gated Recurrent Unit (GRU). The custom LSK module is of the LSKblock type with 12 input channels, while the ODC module is of the ODConv2d type, featuring 12 input and output channels and a convolutional kernel size of 1.
The quantitative classification results of OA, AA, and kappa for datasets S1, S2, and S3, along with per-class accuracies, are shown in
Table 4,
Table 5 and
Table 6. Overall, 1DCNN performs the worst, with OAs of 62.55% and 83.19% in 4-band S2 and S3 regions, and 82.25% in 12-band S1. Limited bands hinder 1DCNN’s ability to extract sufficient spectral features in 4-band regions, while it fails to utilize spatial information effectively in S1. Traditional methods SVM and KNN perform well in S1 and S2, with OAs of 92.82%, 93.46%, 97.63% for SVM and 97.27%, 97.70%, 97.6% for KNN, but struggle with specific classes, e.g., barren in S1 (SVM: 83.84%, KNN: 92.92%). Deep learning models (RNN, ViT, CAF, ViTMLP) show similar performance, demonstrating strong feature extraction capabilities. The proposed LO-MLPRNN achieves the best OA of 99.11%, outperforming all methods. In S2, LO-MLPRNN achieves the highest accuracy for all classes except pond (99.69% vs. SVM’s 100%).
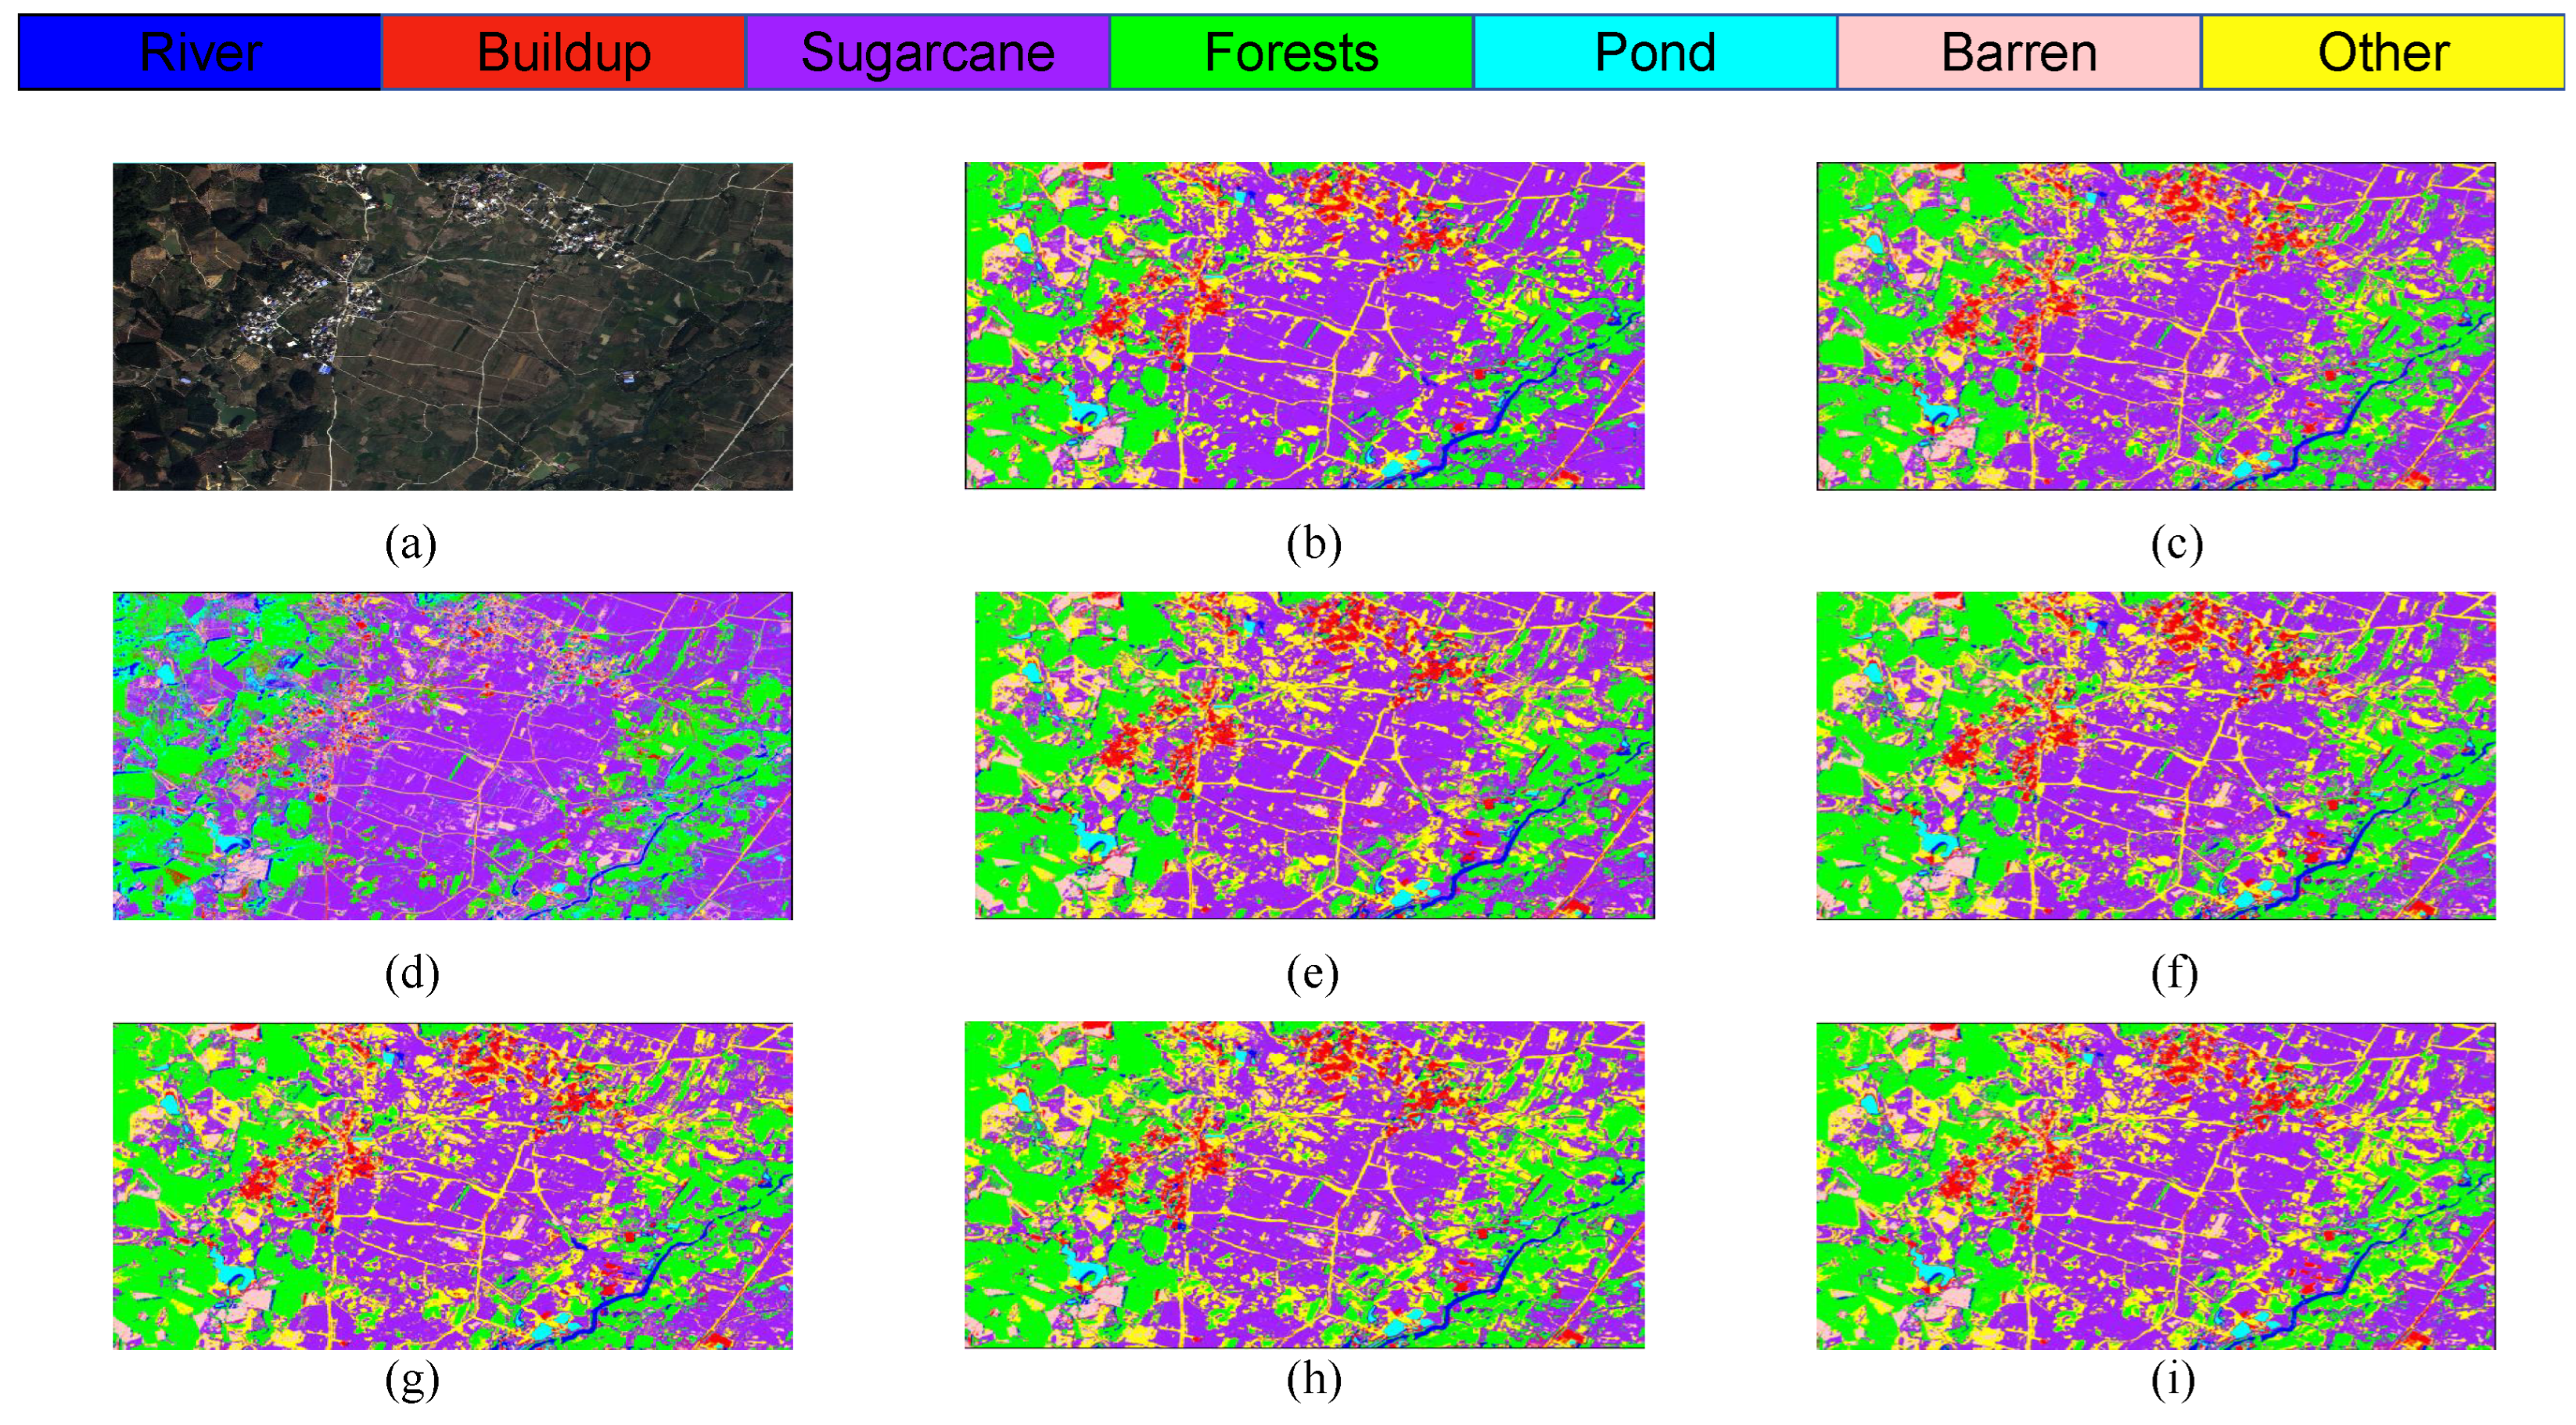
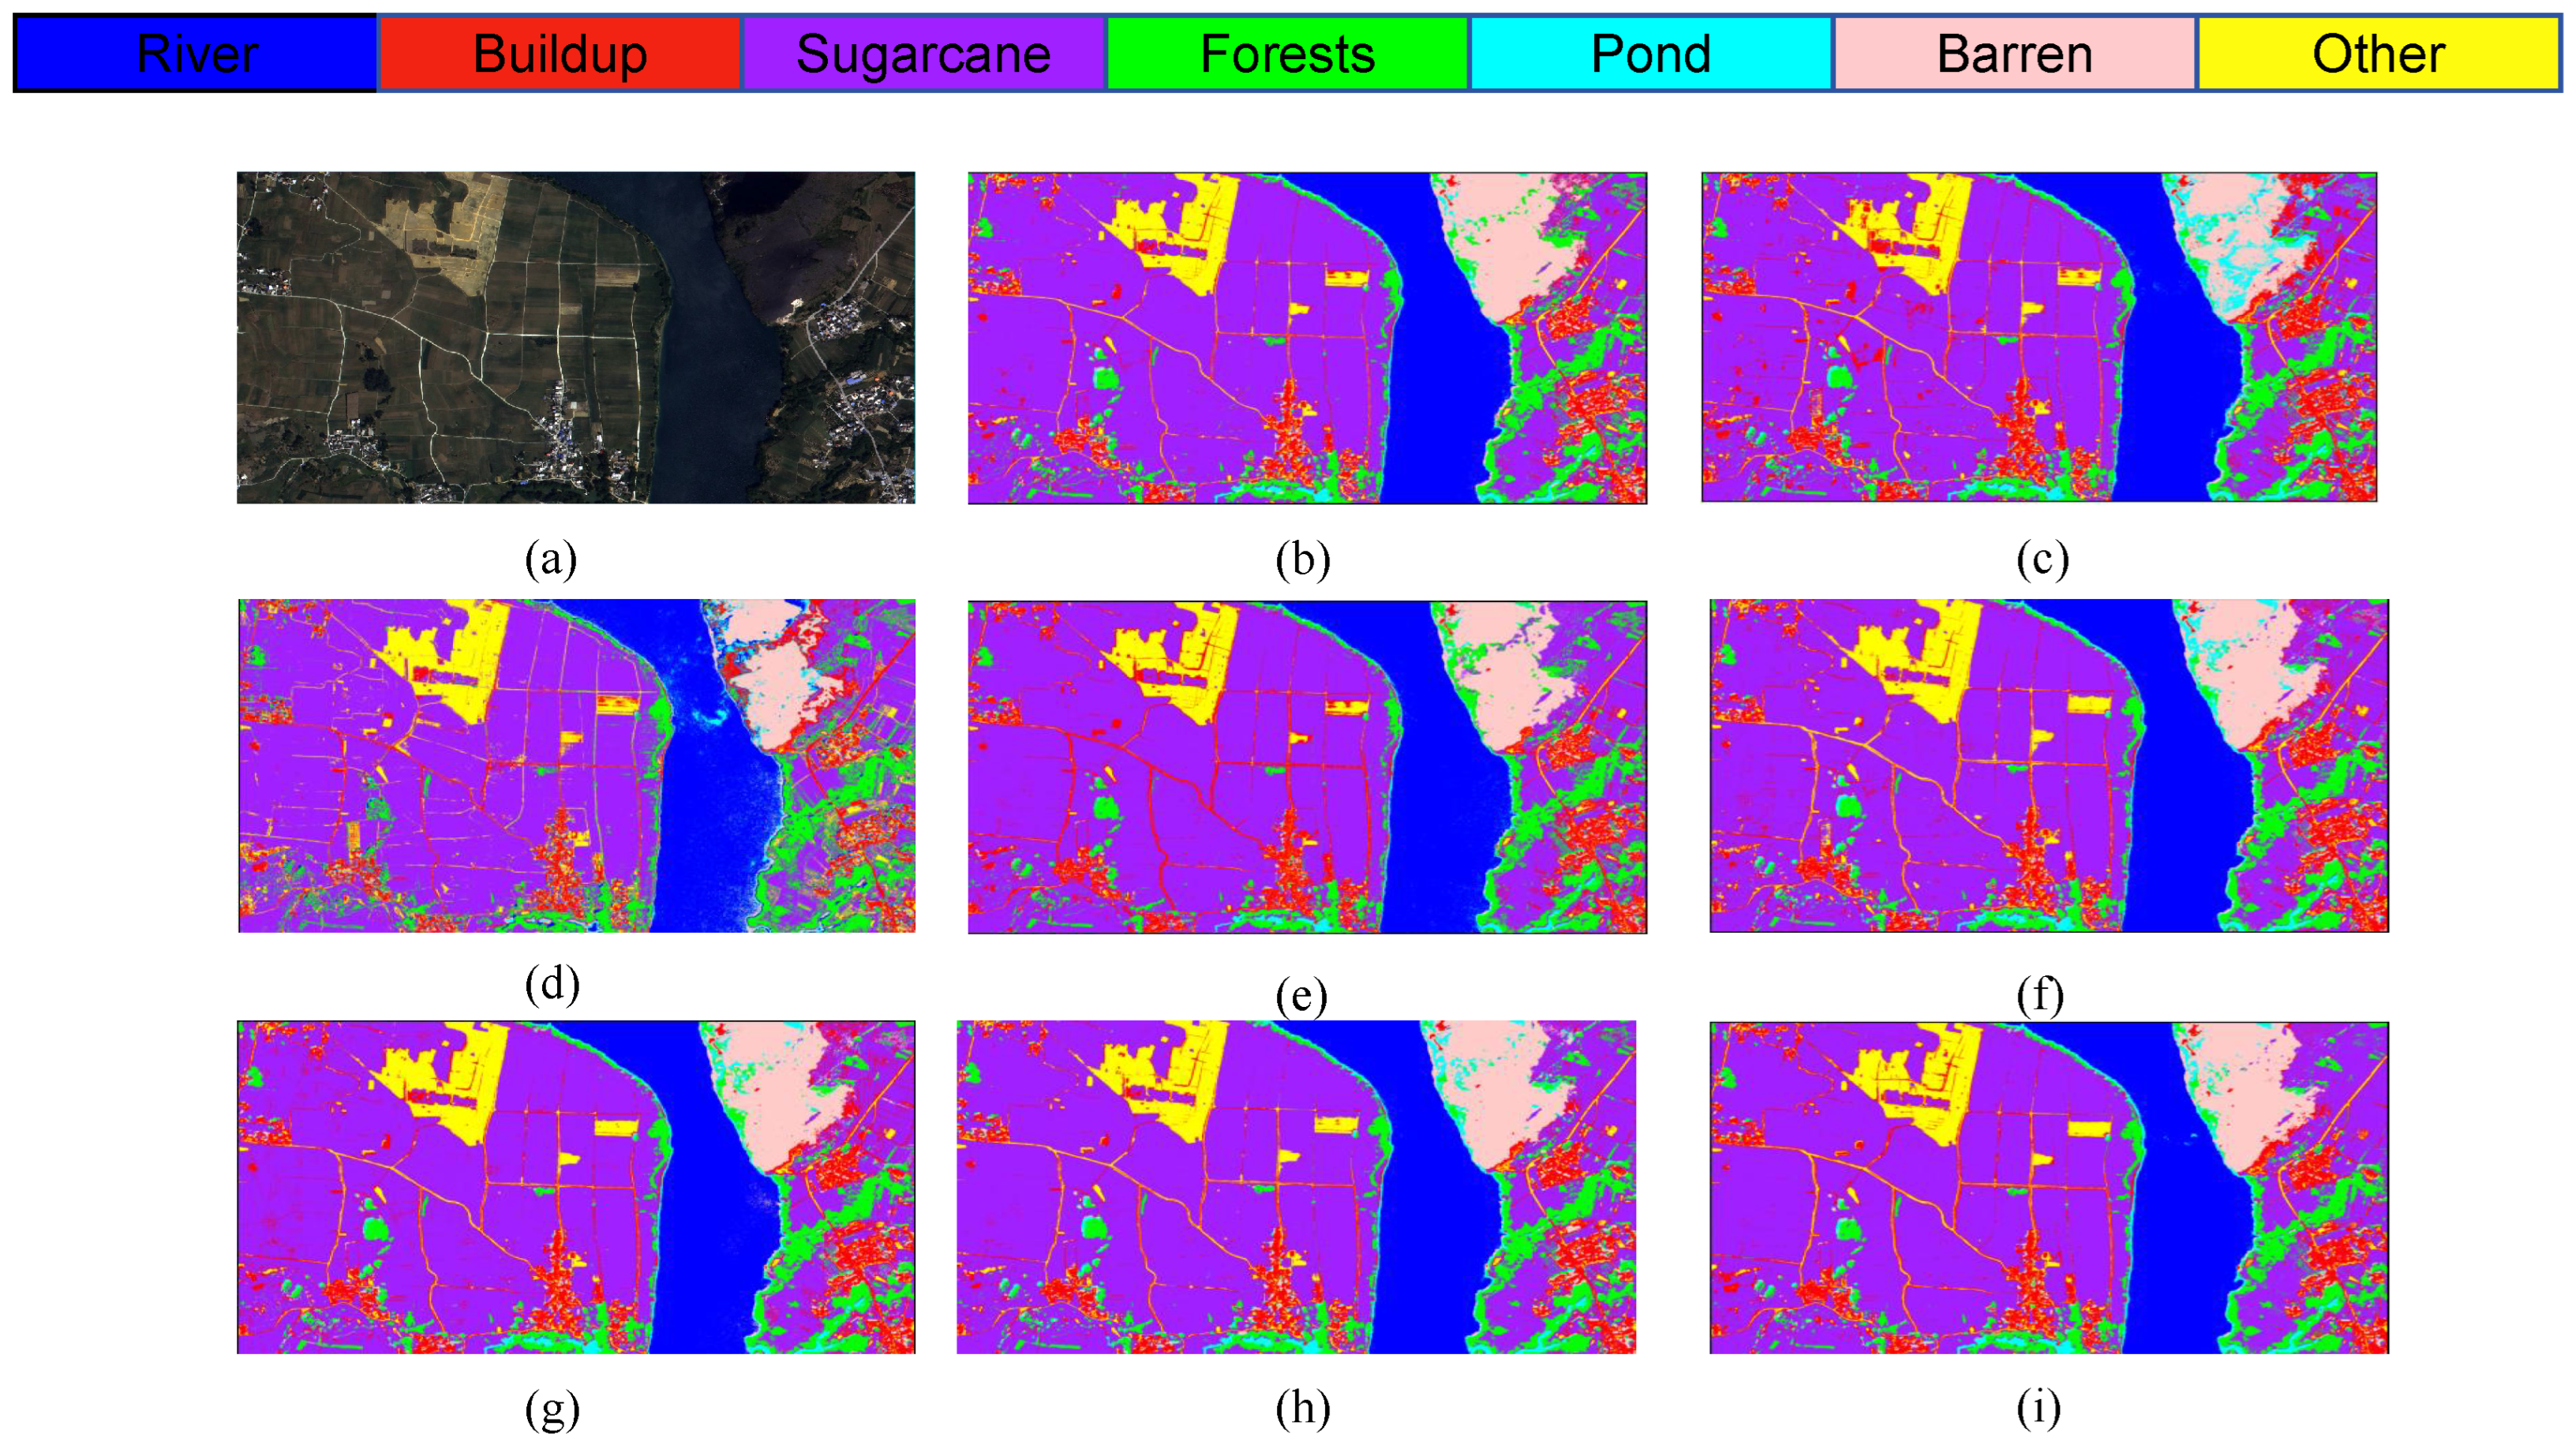
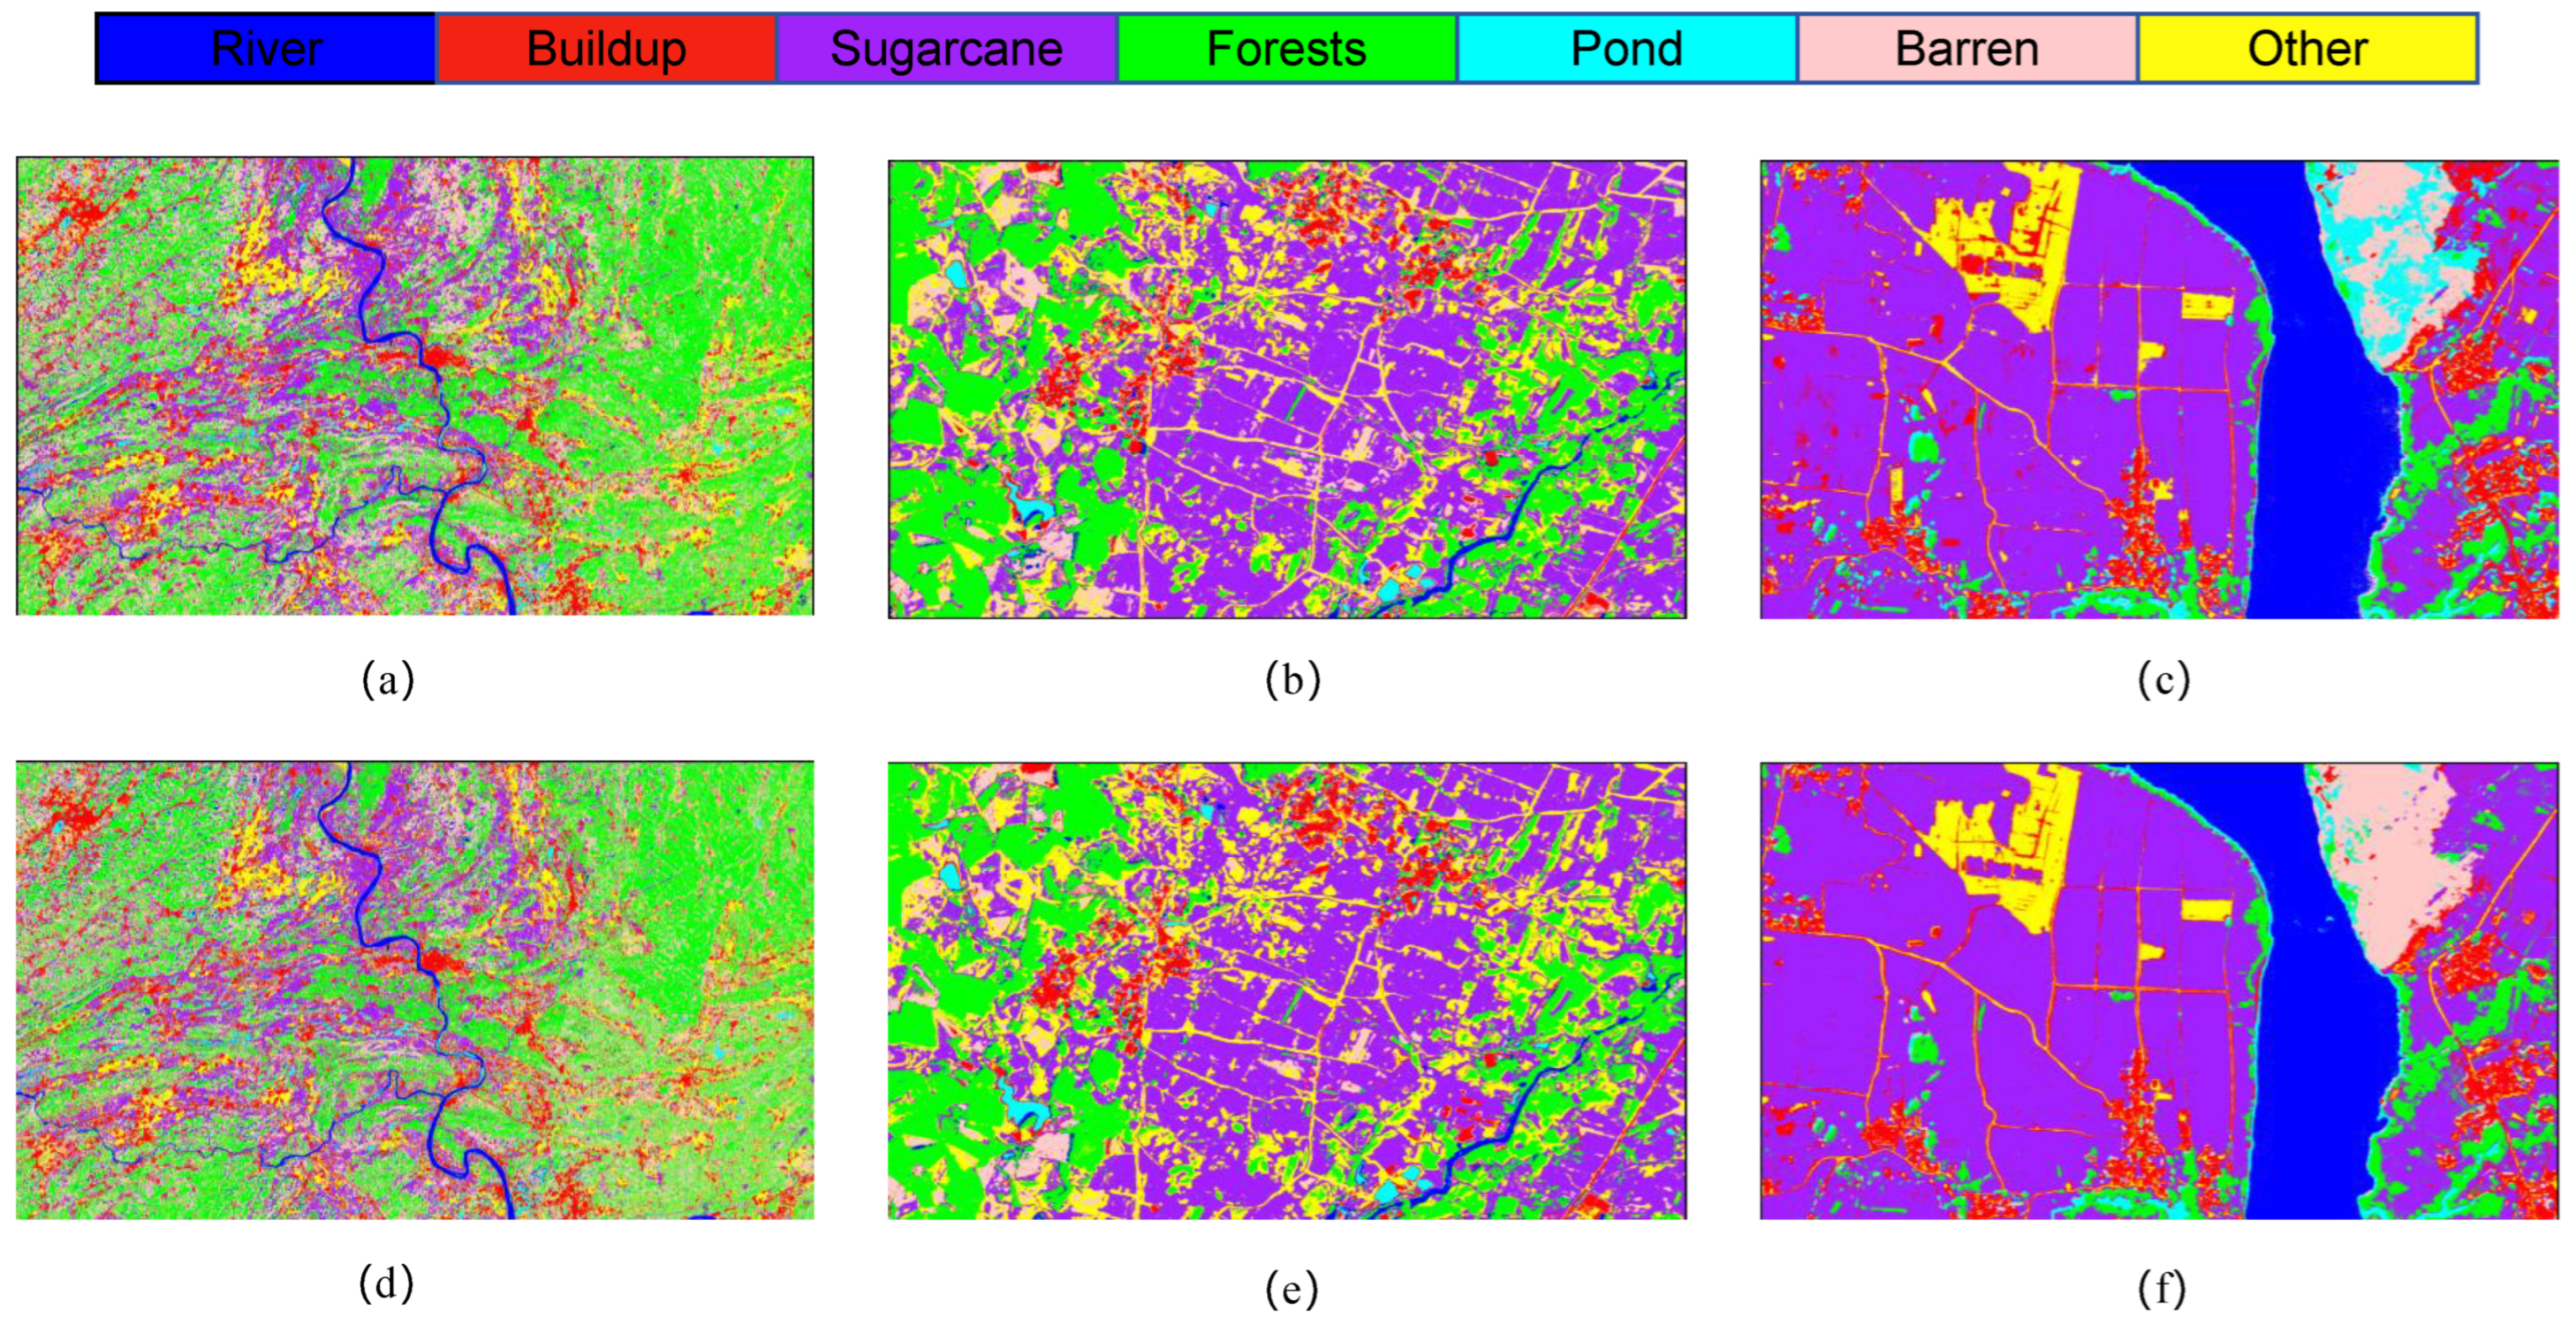
The S2 and S3 classification maps obtained through different models shown in
Figure 12,
Figure 13 and
Figure 14 show the training loss and accuracy changes of each classification model in the S2 study area. It is evident that the 1D-CNN model exhibits suboptimal performance in the overall classification within the study area. Conversely, the models ViTMLP, CAF, and LO-MLPRNN demonstrate enhanced classification outcomes. Notably, LO-MLPRNN exhibits superior classification accuracy in specific regions, particularly in its ability to differentiate between the challenging pond and river categories, while also effectively minimizing misclassifications of the barren category. The classification graph distinctly illustrates that LO-MLPRNN outperforms the other algorithms in terms of accuracy and clarity in detailed performance metrics.
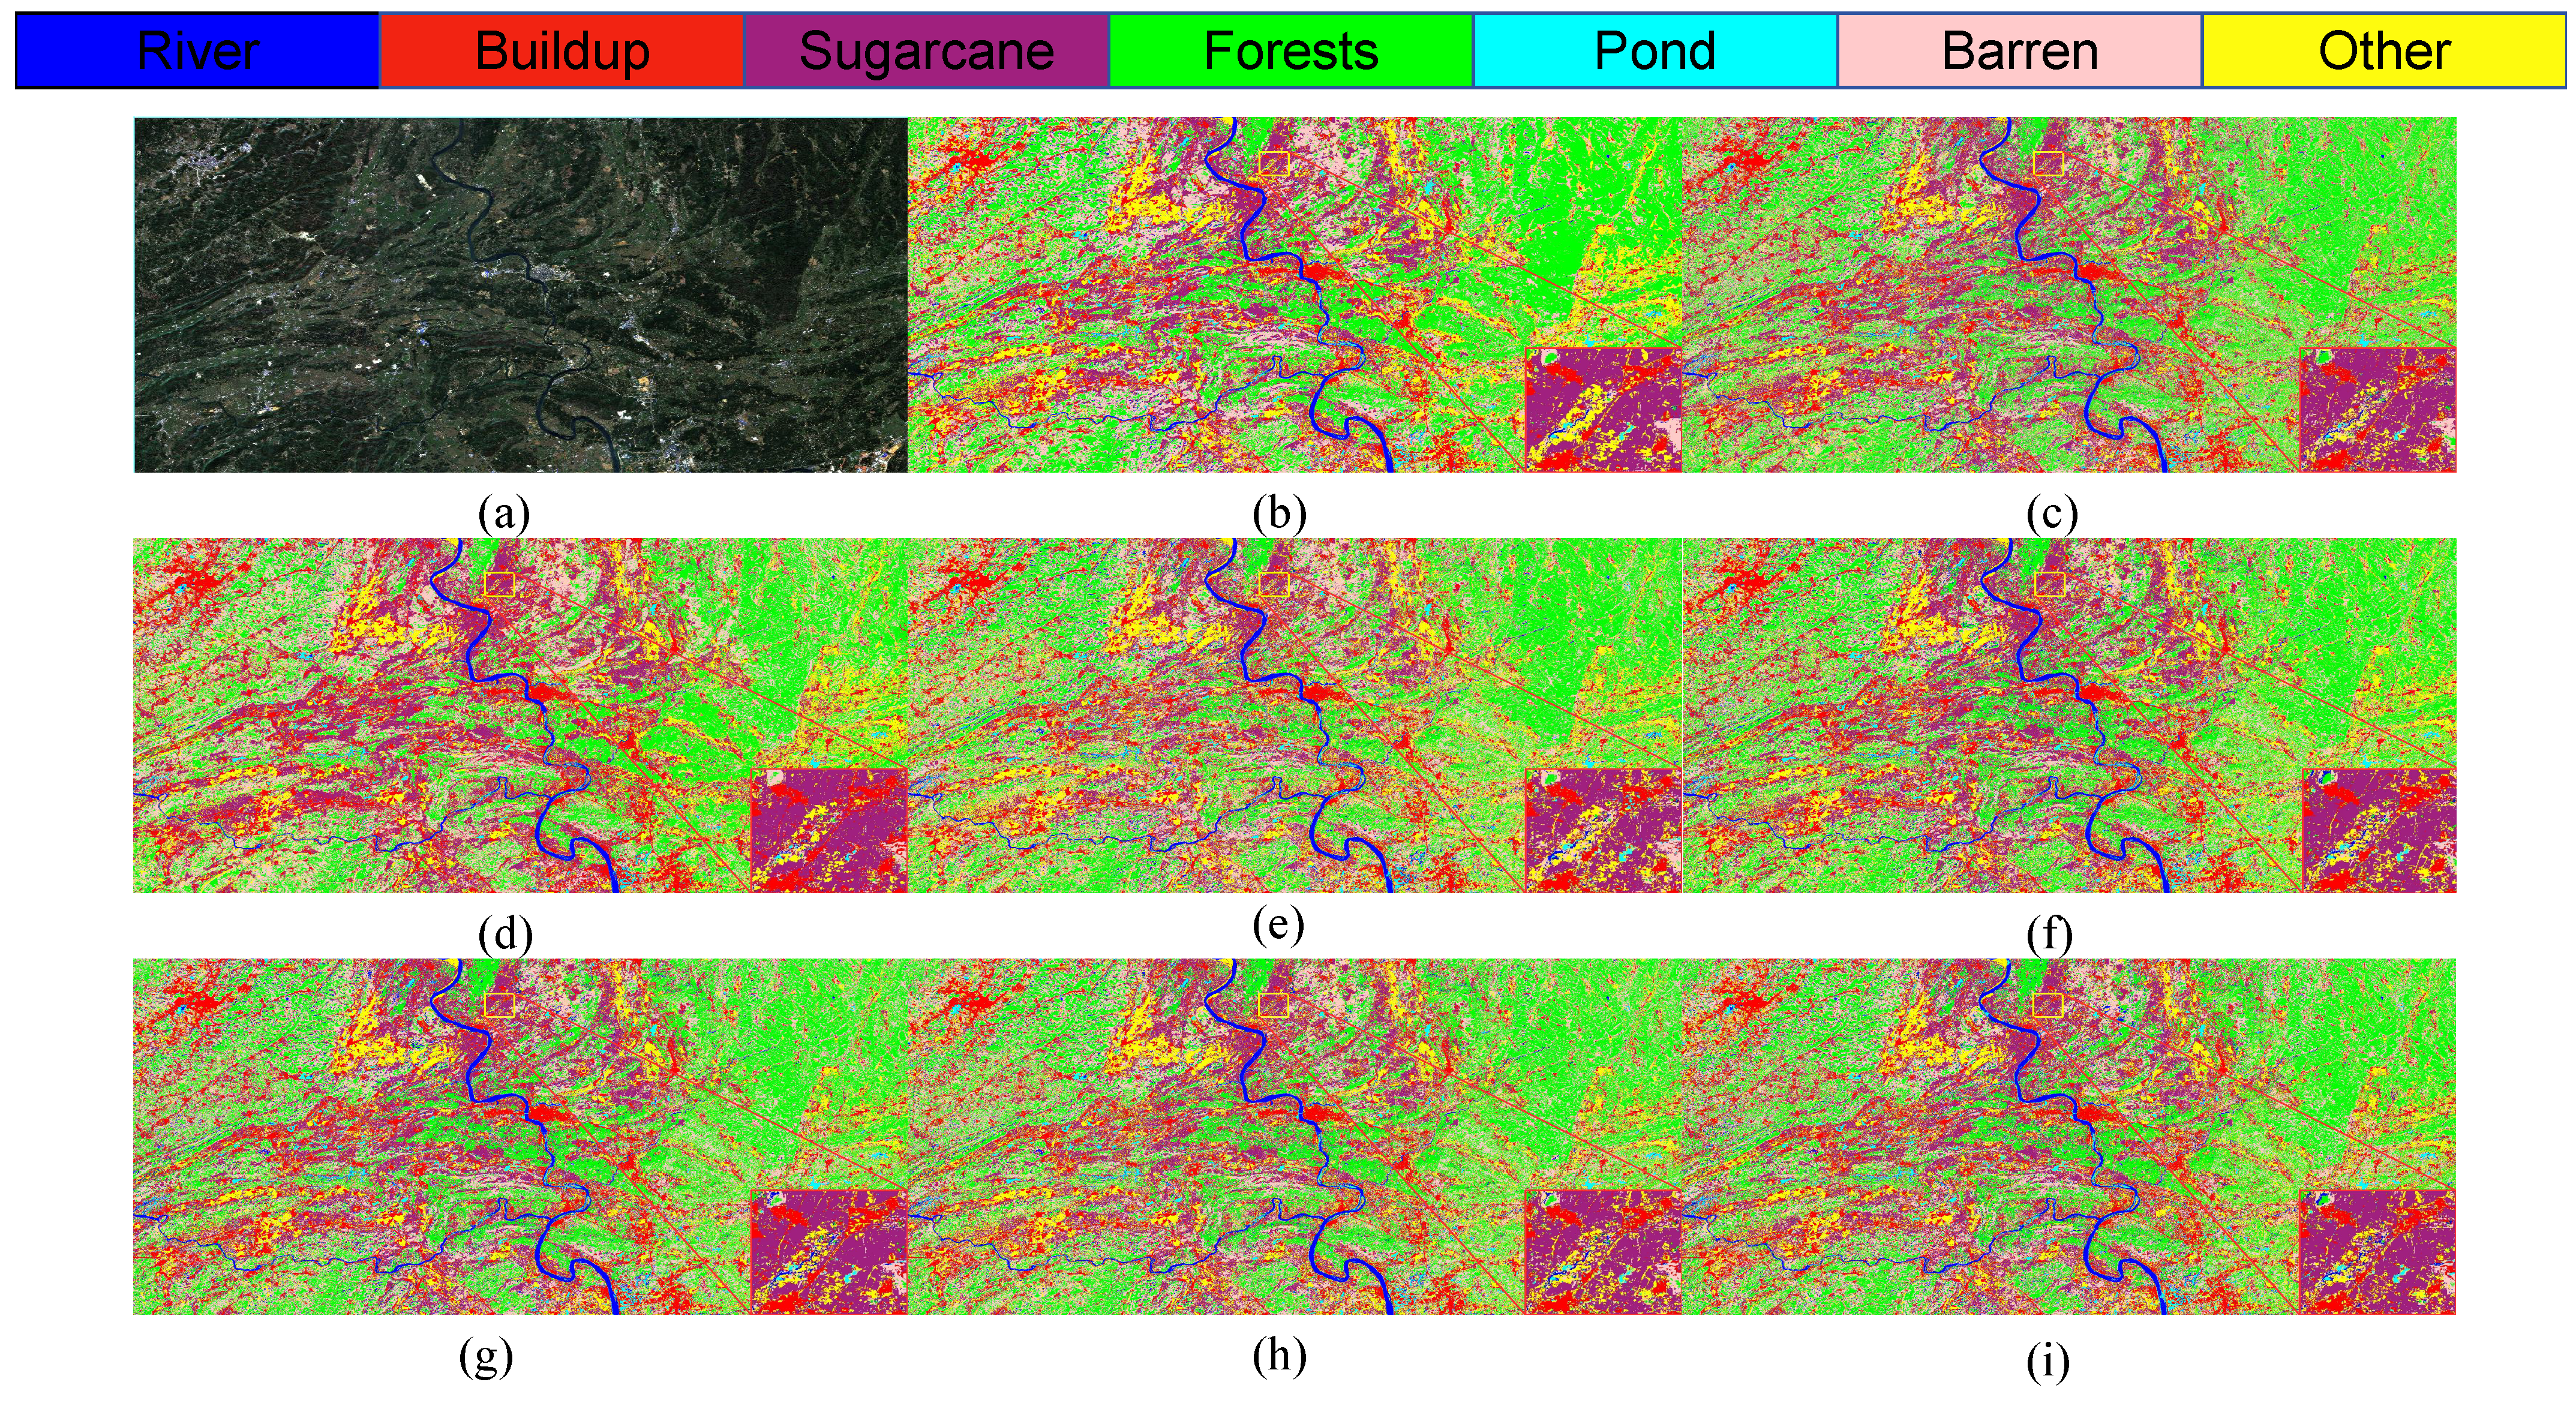
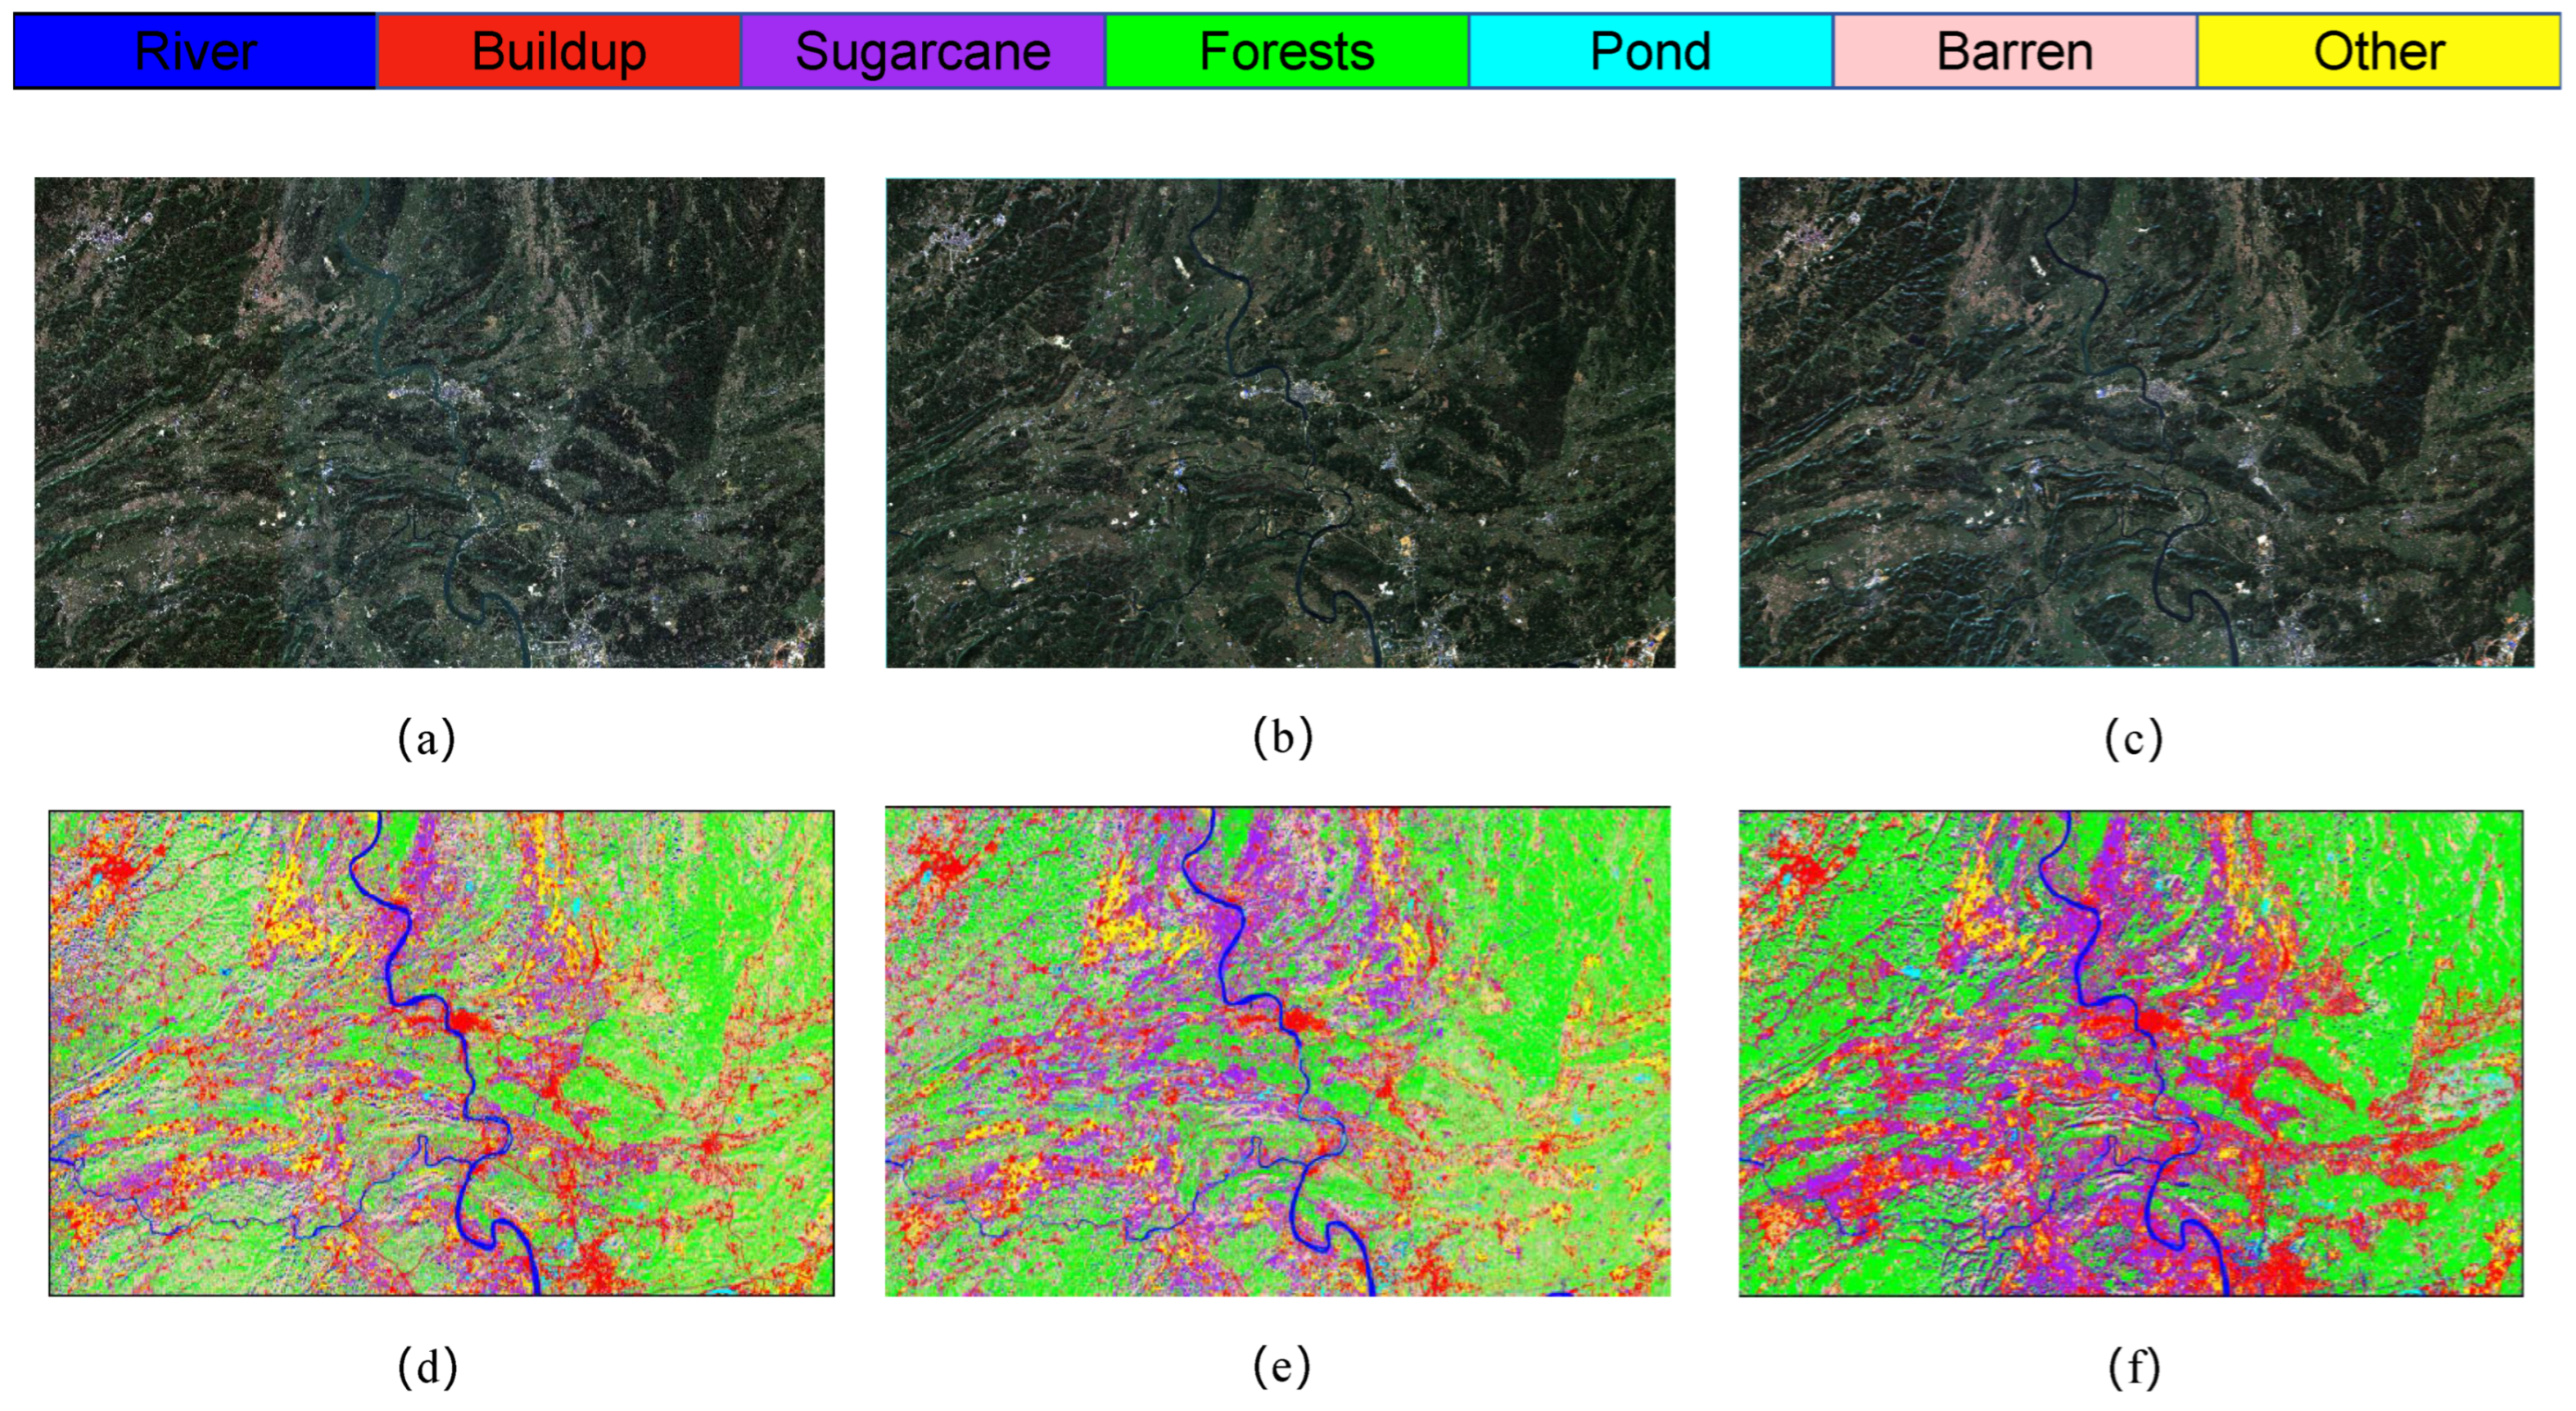
As illustrated in
Figure 15, the classification outcomes of S1 data across various models indicate that SVM and 1DCNN exhibit notably inferior performance in the selected zoomed-in regions. In contrast, among the other algorithms assessed, the LO-MLPRNN demonstrates superior accuracy in delineating the boundaries of built-up areas and sugarcane categories, with a more pronounced differentiation of blocks. Overall, LO-MLPRNN significantly surpasses the performance of the other algorithms in the context of multispectral image classification tasks. Despite the increased complexity of the proposed model’s architecture compared to other deep learning networks, it achieves substantial enhancements in OA, AA, and Kappa coefficient. Furthermore, the quality of the classification maps produced by LO-MLPRNN is markedly superior to that of the other algorithms, underscoring its considerable significance in this domain. The training loss and accuracy changes of each classification model in the S1 study area are shown in
Figure 16.
To further validate model performance, this study compares LO-MLPRNN with the Kolmogorov–Arnold Network (KAN) [
44]. Benefiting from its external similarity to MLP, KAN not only learns features but also optimizes them for higher accuracy. KAN has recently been applied in remote sensing, such as Minjong Cheon’s integration of KAN with pre-trained CNN models for remote sensing (RS) scene classification [
45], and H Niu’s proposed multimodal Kolmogorov–Arnold fusion network for interpreting urban informal settlements (UISs) using RS and street-view images [
46]. In this experiment, LO-MLPRNN outperforms KAN across all three study areas, as shown in
Table 7. KAN achieves accuracies of 90.56%, 91.93%, and 97.77% in S1, S2, and S3, respectively, while LO-MLPRNN demonstrates superior performance, confirming its applicability and high effectiveness in the study areas. The specific classification comparison is shown in
Figure 17.
3.3. Vegetation Dynamics
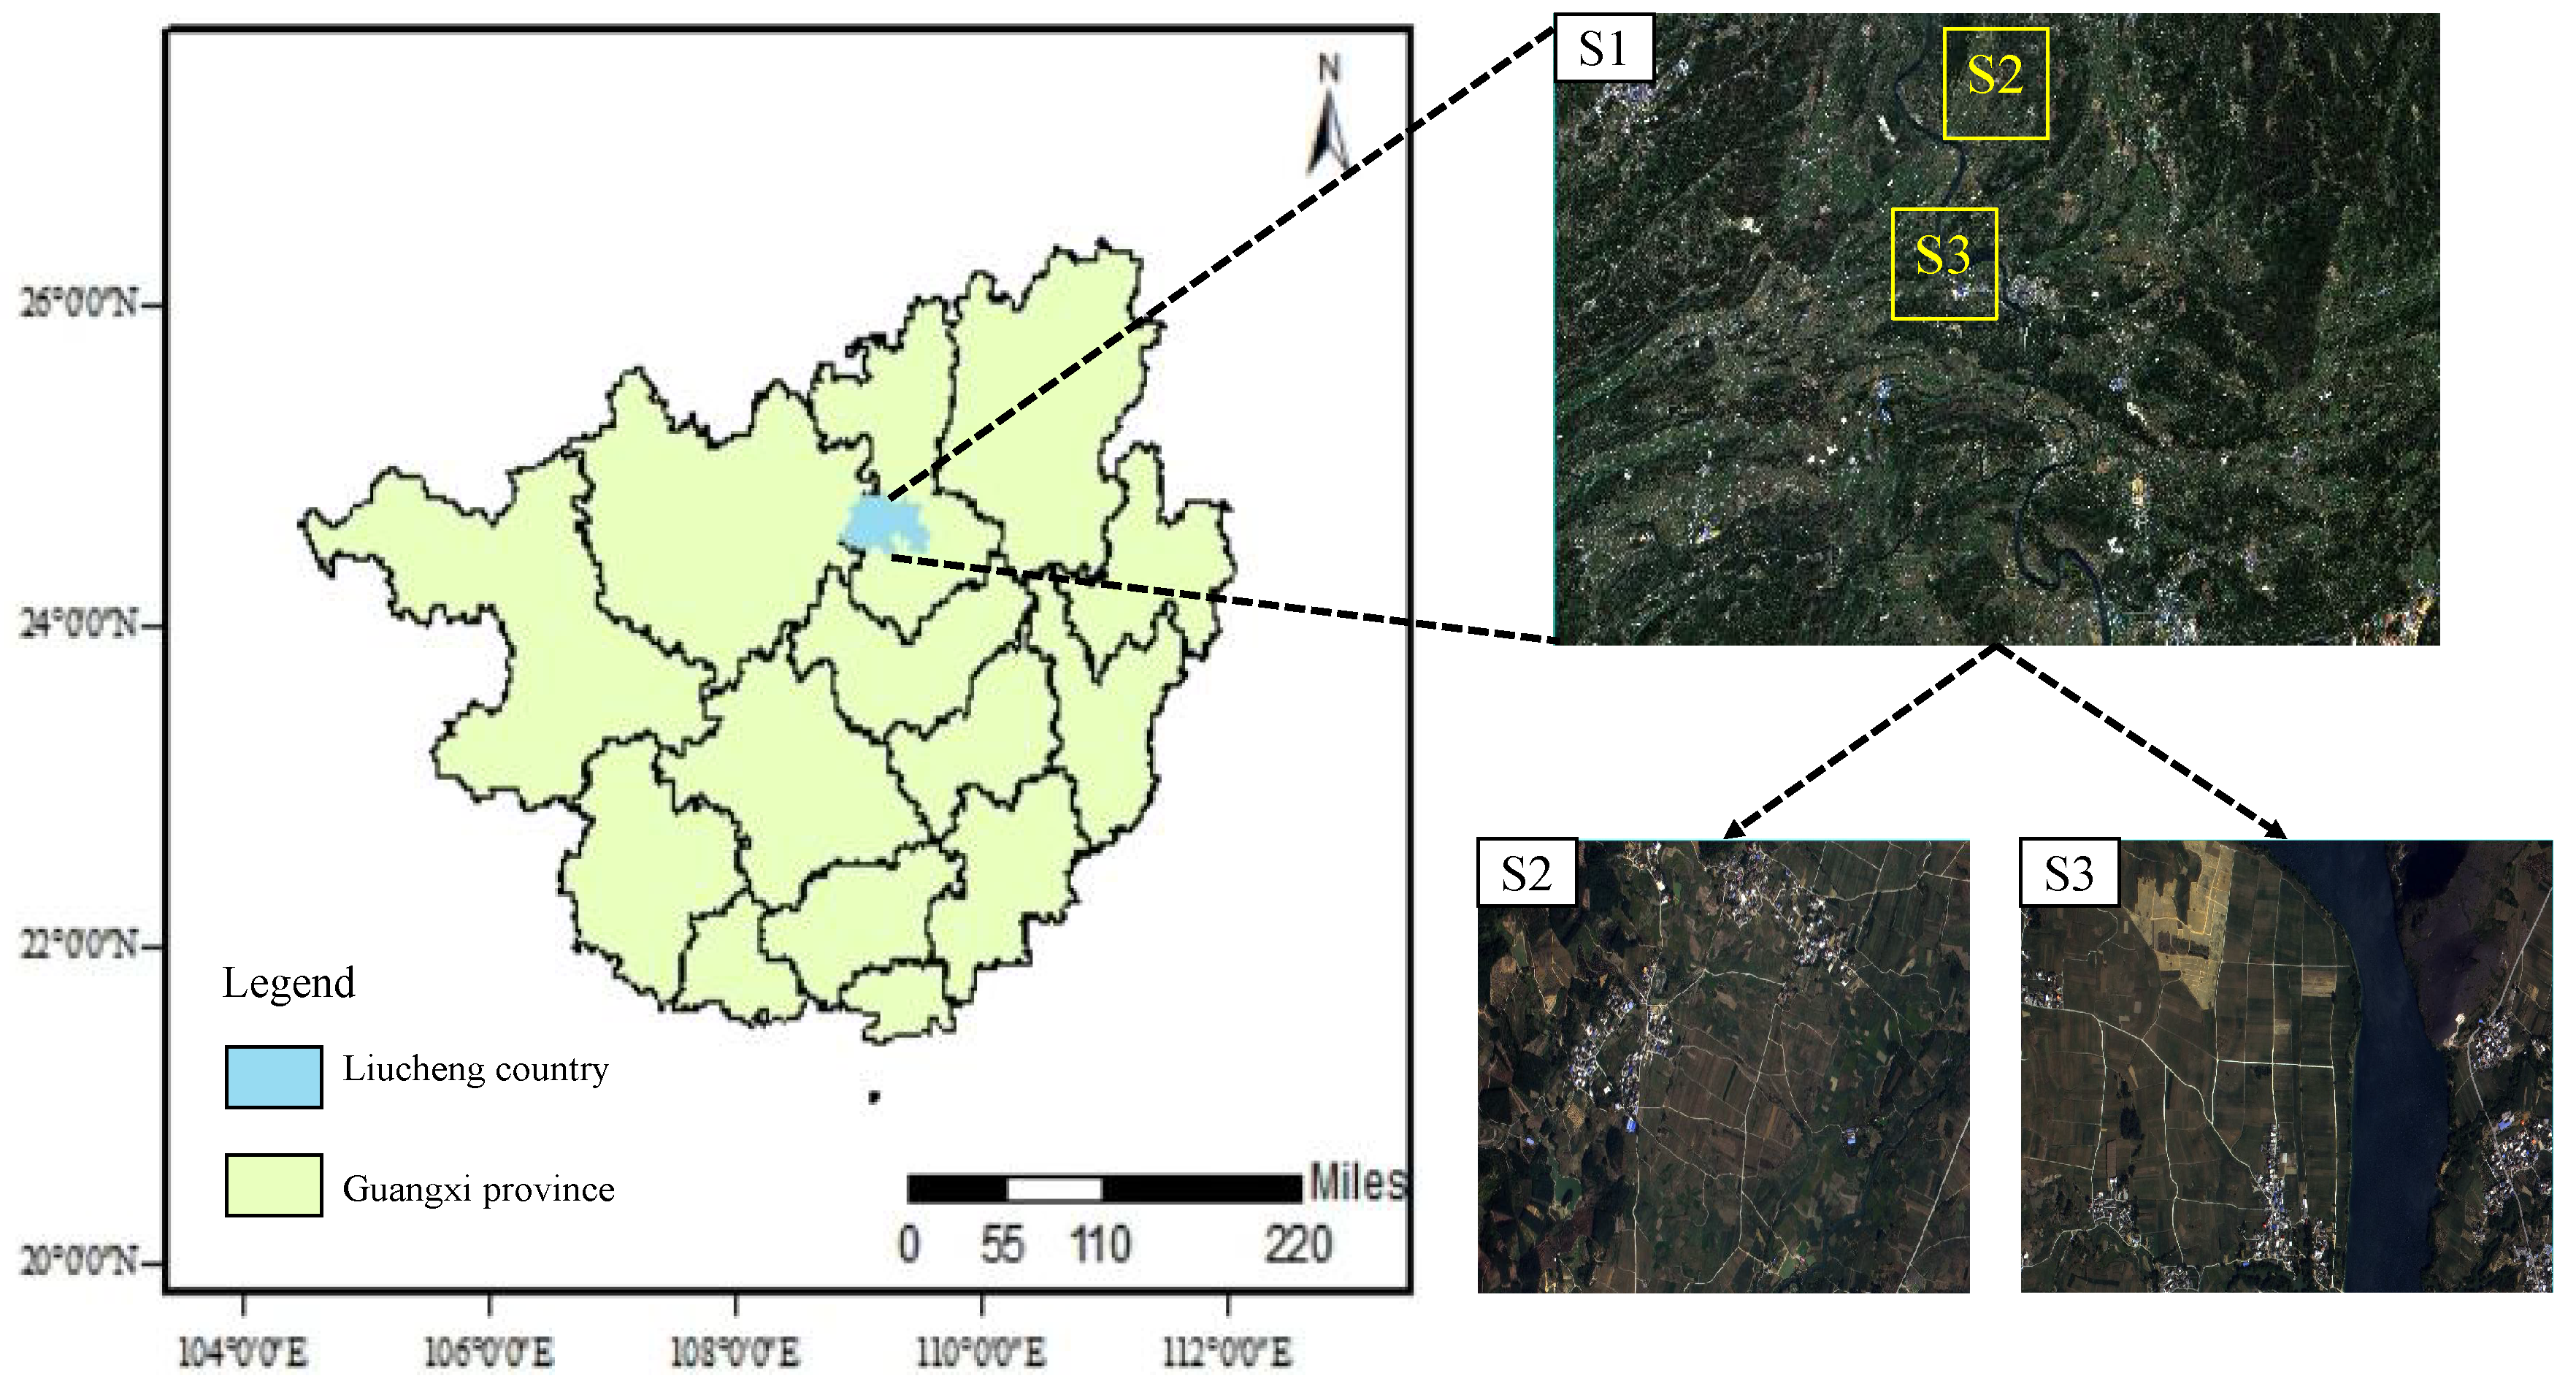
In this paper, the Sentinel-2 series images of 12 December 2019, 6 December 2021, and 21 November 2023, downloaded from the ESA website, were used for the study of vegetation dynamics. After preprocessing, the labels were recreated using the 2022 labeled ROIs with prior knowledge and the corresponding txt files were generated. Then, the sample set was randomly divided into training and test sets in the ratio of 6:4 according to the coordinates of the files. Finally, the classification of vegetation dynamics changes in the study area was carried out using the LO-MLPRNN proposed in this paper, focusing on analyzing the changes in the cover of forest and sugarcane.
The classification results of different models for the 2019, 2021, and 2023 sample datasets are shown in
Table 8,
Table 9 and
Table 10. LO-MLPRNN consistently demonstrates superior performance across all five years, achieving OAs of 99.65%, 99.24%, and 99.71%, the highest among all compared models. The improved accuracy on the 2023 dataset may be attributed to its higher spatial resolution or reduced noise, enabling better feature learning. Overall, LO-MLPRNN significantly outperforms other models. Compared to the original RNN, LO-MLPRNN shows improvements of 3.24%, 2.20%, and 0.87% in 2019, 2021, and 2023, respectively. The smaller improvement in 2023 suggests the original RNN already performed well that year. However, the substantial gains in the first two years provide stronger evidence and value for dynamic analysis of forest and other land cover changes over the five-year period. In summary, LO-MLPRNN’s classification performance meets the requirements for analyzing forest utilization changes in the study area of Liucheng County.
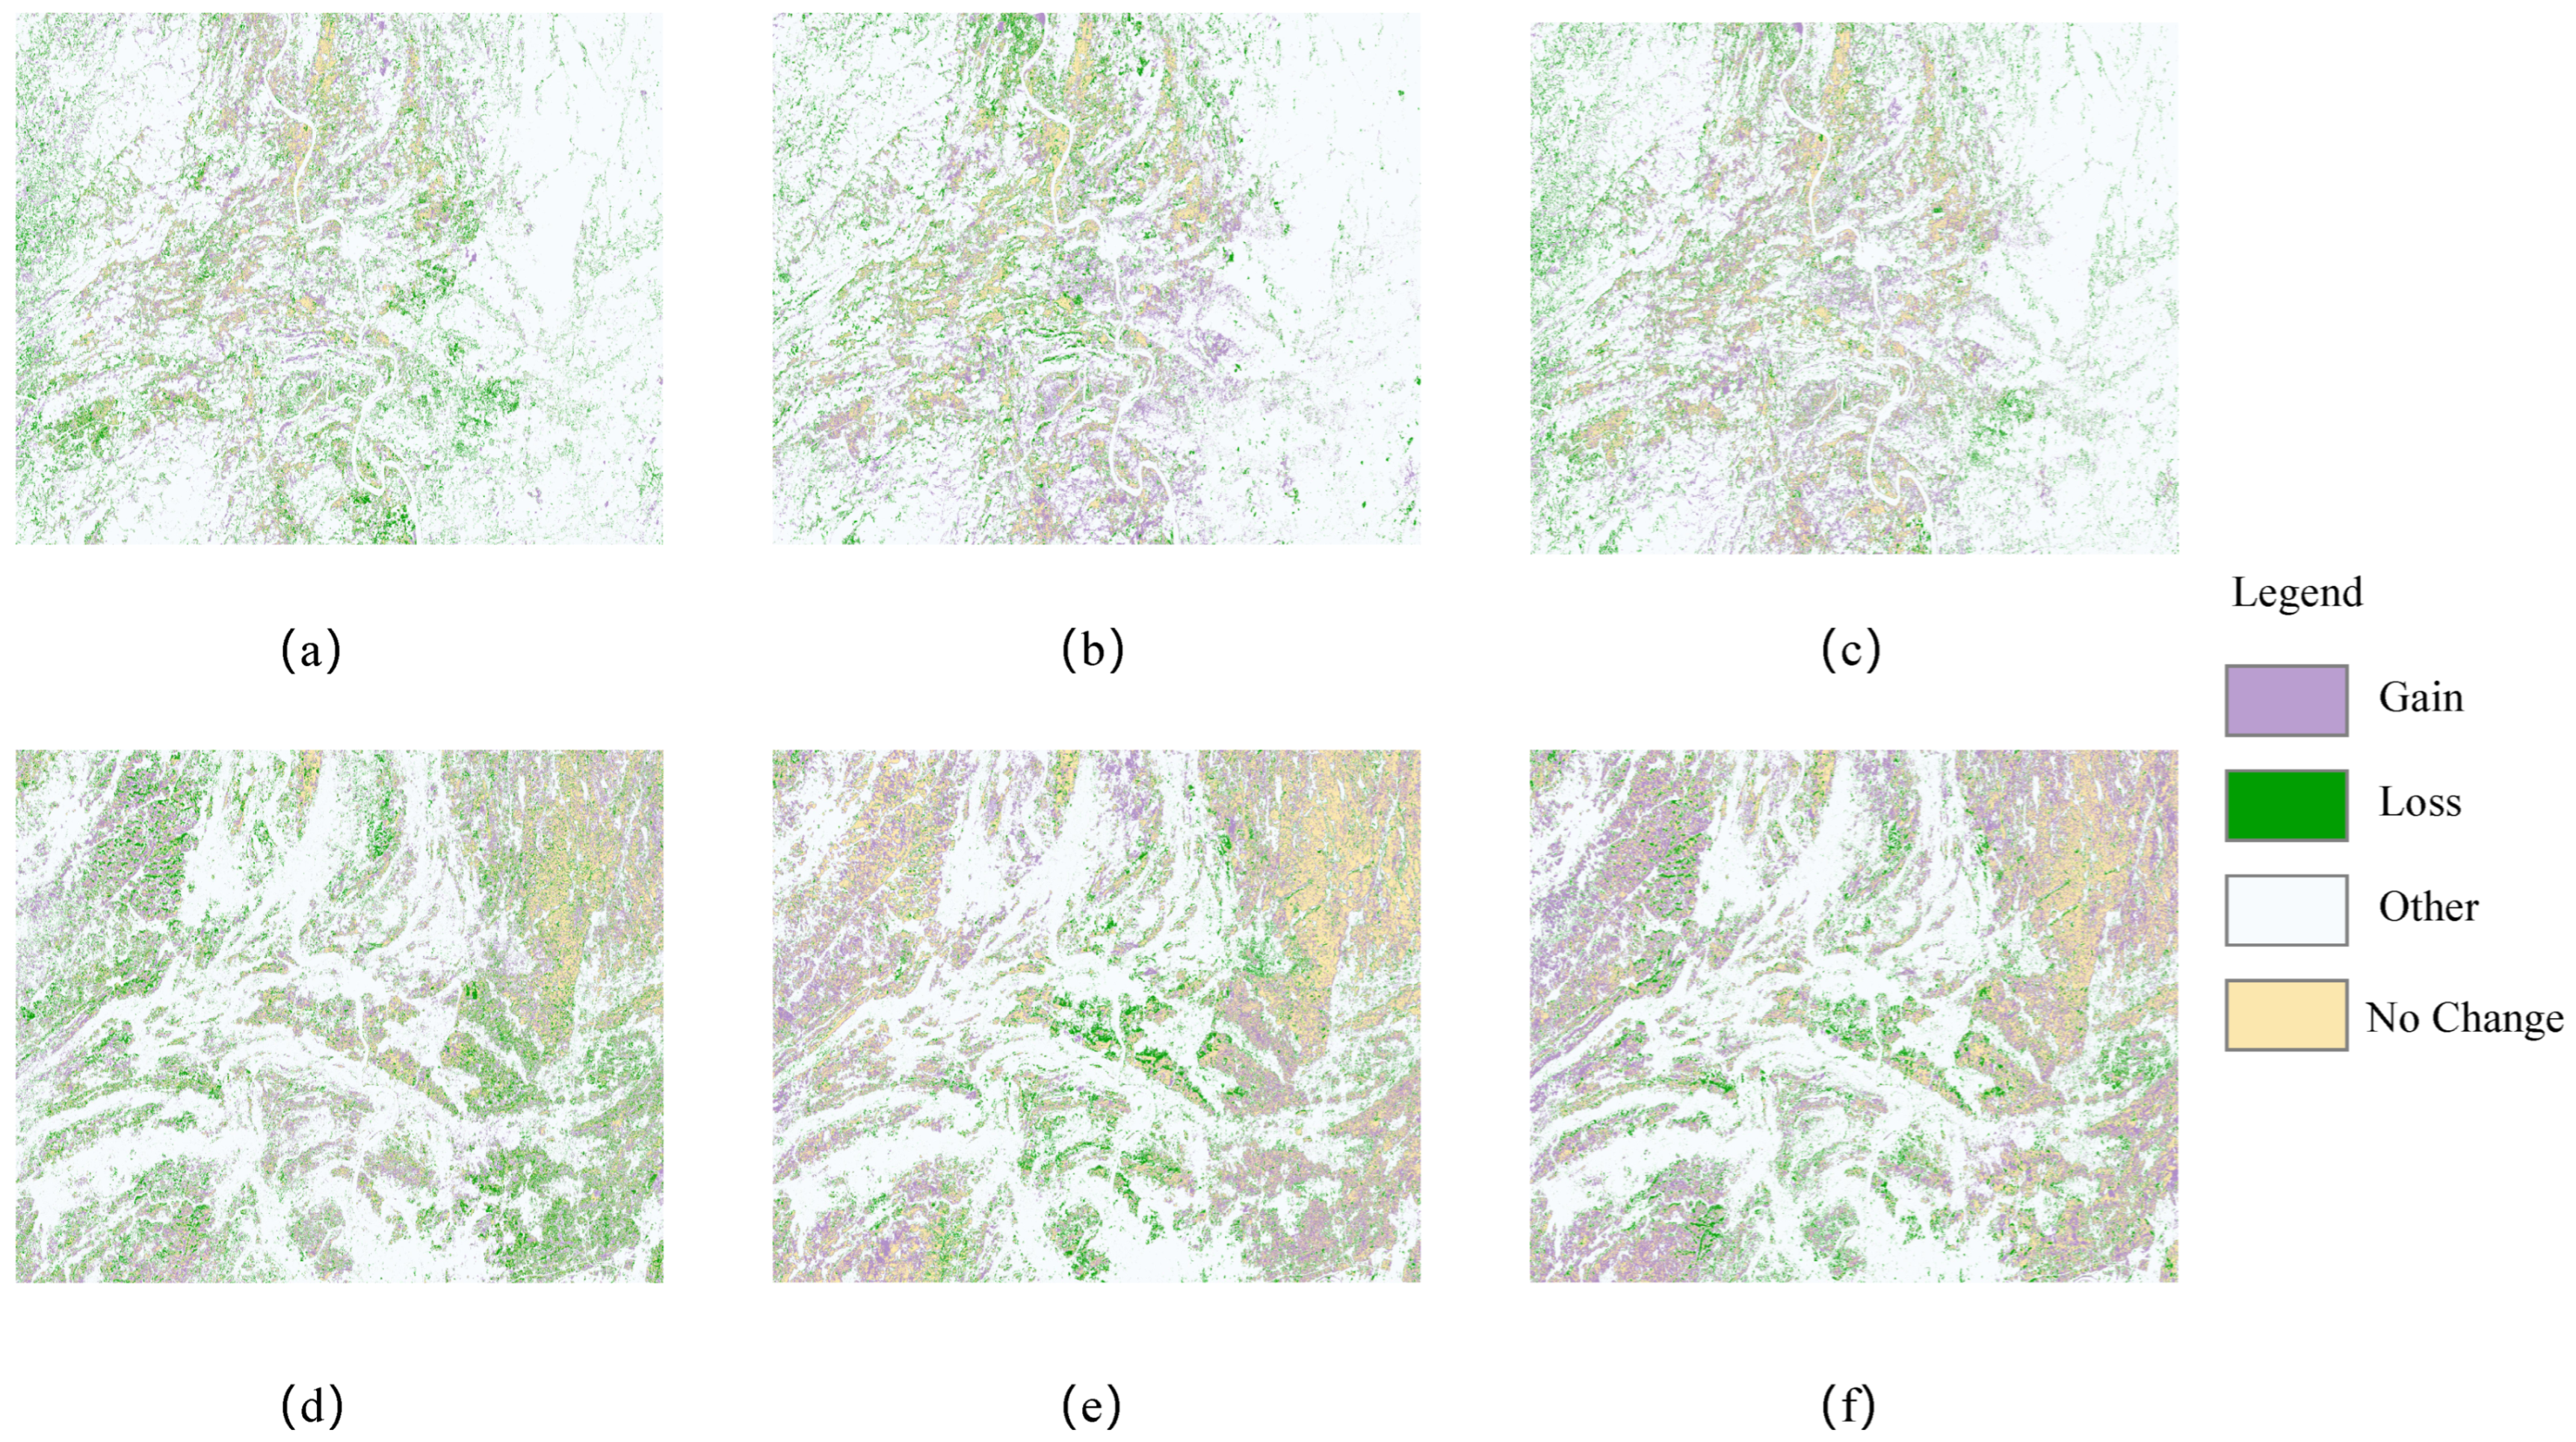
The spatial distribution of vegetation utilization in 2019, 2021, and 2023 is shown in
Figure 18. Forest areas have expanded annually, particularly from the periphery toward the center, reflecting the local government’s emphasis on ecological protection and forest management. Sugarcane cultivation is concentrated in the southwest and central regions, benefiting from fertile soil, favorable climate, and ample water resources. Its area has grown significantly over the five years, driven by agricultural policies and market demand. Rivers, primarily located in the central area, provide essential water resources for agriculture and ecological balance. Ponds, surrounded by buildup and barren land, likely serve aquaculture or as natural features, while buildup areas have expanded, indicating urbanization and population growth. Overall, the spatial distribution of forest utilization has become more balanced and rational, demonstrating sustainable and efficient management. This supports forest growth, ecological improvement, and biodiversity conservation in the region.
Table 11 presents the patterns of vegetation utilization and the rate of change in vegetation use within the study area over the past five years. Notably, the predominant type of vegetation utilization has shifted from barren land to forested areas. This transformation may be attributed to a series of ecological restoration and afforestation initiatives undertaken by the local government aimed at enhancing biodiversity and improving the ecological environment.
The significant increase in sugarcane area from 2019 to 2023 may be attributed to the rising demand for sugar and sugar-based products, as well as government support measures aimed at encouraging farmers to expand sugarcane cultivation. The increasing area of riverine vegetation indicates a growing recognition among local communities of the necessity for reforestation and the cultivation of crops, thereby highlighting the importance of water resource management.
This study emphasizes the geographical distribution of forests and sugarcane, as represented in
Figure 19. The graphic clearly shows that woodlands surround the research area. This distribution can be linked to the abundance of forest resources, which play an important role in preserving ecological balance, protecting water sources, and moderating soil erosion. Sugarcane agriculture is centered predominantly in the study area’s western and central areas. Notably, the area allocated to sugarcane farming and the quantity of forest cover have grown significantly in recent years. The enormous cultivation of sugarcane represents not only the increase in and diversification of agricultural production but also the government’s strategic planning and activities targeted at increasing agricultural output and maintaining food security. Concurrently, the growth in forest area demonstrates the local government’s dedication to ecological protection and forest resource management, as well as the implementation of numerous ecological restoration and afforestation projects. The simultaneous development of these two forms of land use demonstrates a harmonic balance between agricultural productivity and environmental protection in the studied region.
The dynamic changes in sugarcane and forest areas from 2019 to 2023 are illustrated in
Figure 20. During this period, the forest area decreased from 908.91 km
2 in 2019 to 841.86 km
2 in 2022, before significantly increasing to 1225.16 km
2 in 2023. Specifically, forest area declined by 7.38% from 2019 to 2021 but surged by 45.53% from 2021 to 2023, resulting in an overall growth rate of 34.79% over the entire observation period (2019–2023), indicating a consistent upward trend.
For sugarcane, the cultivated area was 443.96 km2 in 2019, slightly increased to 458.48 km2 in 2021, and then expanded significantly to 547.25 km2 in 2023. This represents a growth of 3.27% from 2019 to 2021 and a substantial increase of 19.36% from 2021 to 2023, with an overall growth rate of 23.27% over the five-year period. The notable expansion of sugarcane cultivation from 2019 to 2023 aligns with expectations, as the region’s fertile soil provides optimal natural conditions for sugarcane production, and the increased cultivation area aims to enhance economic benefits.
4. Discussion
This study evaluates the strengths and weaknesses of traditional machine learning algorithms, specifically SVM and KNN, alongside deep learning algorithms including 1DCNN, RNN, Transformers (Vision Transformers—ViT), CAF, and our proposed algorithm, LO-MLPRNN, in the context of multispectral image classification. The findings indicate that the proposed LO-MLPRNN algorithm exhibits a notable enhancement in classification performance. Traditional algorithms such as SVM and KNN demonstrate high efficiency characterized by short training durations while maintaining commendable classification accuracy, even when applied to high-resolution images. However, the classification accuracy of 1DCNN is suboptimal due to the limited information inherent in multispectral images. Conversely, RNNs, while advantageous for processing sequential data and outperforming 1DCNN in classification tasks, struggle to effectively capture long-term dependencies between inputs and outputs. This limitation is addressed by Transformers, which leverage positional encoding to efficiently learn global sequence information.
Our LO-MLPRNN model achieves pixel-level classification accuracy for Sentinel-2 remote sensing images within a multispectral dataset, showcasing superior classification performance. Nonetheless, the model’s requirement for multi-scale feature extraction results in an increased number of parameters and extended computation times compared to single deep learning models, thereby escalating computational costs. Furthermore, the model exhibits reduced efficacy in managing images characterized by complex long-range dependencies, such as those encountered in urban road segmentation scenarios. In instances of detecting irregularly shaped buildings with significant size variations, the feature extraction process may prove inadequate, leading to potential misclassifications or omissions in complex backgrounds and occluded situations.
To enhance the model’s performance and facilitate the handling of larger remote sensing image datasets in future endeavors, we intend to investigate model compression techniques aimed at reducing both the number of parameters and computation times. Additionally, we will consider the integration of spatial attention mechanisms to bolster the model’s capacity to comprehend and classify intricate scenes. Furthermore, we will explore strategies to better amalgamate spatial and spectral information from the images, thereby improving the model’s robustness and accuracy in complex environments and across diverse feature types.


 ,
, 


