1. Introduction
Over the years, the manufacturing sector has undergone a remarkable transformation since the introduction of Industry 4.0, uniquely revolutionizing industrial operations through smart technological implementations. These innovations have enhanced and fostered global innovation and competitiveness within the manufacturing sector. Artificial intelligence (AI) has been used not only in manufacturing processes but also plays a crucial role in the maintenance and reliability of industrial machinery. One aspect of AI, known as Prognostics and Health Management (PHM), ensures uninterrupted production by monitoring the life and performance of a system. PHM enables real-time monitoring and assessment of systems, with the capacity to monitor a system both online (while in operation) and offline (when not in operation) [
1]. It can predict the current and future state of a given system based on information generated through sensor technology. Although PHM originated in the aerospace industry, its reach has expanded to industries such as manufacturing, energy, production, automotive, construction, textile, healthcare, and pharmaceuticals.
Vision-based analysis has been successfully employed in manufacturing for standard and quality control inspections [
2]. It is also used in technical fields such as intelligent traffic monitoring and unmanned aerial vehicles [
3,
4]. Despite the success of Prognostics and Health Management (PHM) models in system diagnostics and monitoring, researchers continue to enhance condition-based system models to improve efficiency and robustness, addressing unresolved challenges. One such challenge is automated defect inspection and machine vision-based fault detection for glossy and curvy surfaces. The complex reflectiveness and curvy morphology of these surfaces often cause defects to go unnoticed when captured by traditional cameras [
5,
6]. For decades, such inspections have been performed manually by trained human inspectors, which is time-consuming and costly compared to automated non-glossy surface inspection [
5,
7].
Generally, product quality inspection is critical in manufacturing, with methods like visual inspection, automated optical inspection (AOI), machine vision, infrared thermography, laser scanning, and X-ray inspection widely used [
8,
9,
10]. Among these, computer vision stands out for its precision, computational efficiency, and non-contact approach, particularly as industries shift from Industry 4.0 to Industry 5.0 [
11,
12]. However, issues experienced with glossy and curved surfaces have prompted researchers to explore different methodologies to overcome these challenges.
Some methods for mitigating glossy surface effects primarily involve modifying image capture techniques and using advanced cameras with enhanced lighting to reduce surface reflectiveness. Techniques such as polynomial texture mapping, surface-enhanced ellipsometry, specular holography, and near-field imaging have proven effective when implemented correctly [
13,
14,
15]. Their efficacy is demonstrated in several studies. For example, Müller used polarization filters to diminish surface reflectiveness, capturing two images with different filter orientations and then deriving the specular reflectance intensity on plane surfaces, effectively mitigating surface reflections [
16]. Similarly, Yoon et al. [
17] proposed a method to remove light reflections in medical diagnostic imaging by adjusting the angle of a linear polarized filter. By controlling vertical and horizontal polarization through filter rotation, they eliminated light reflections and expanded the field of view. In another study [
18], the authors introduced a spatial augmented reality framework to improve the appearance of glossy surfaces. Their technique spatially manipulates an environment’s appearance, allowing a glossy surface to reflect a projected image without direct modification, thus enabling effective appearance editing through careful content control. Nevertheless, environmental factors, incompatibility with certain surfaces, and reduced image resolution remain limitations of this approach [
19,
20,
21].
Another unique method often utilized involves implementing advanced algorithms and unique image processing deep learning models, robust enough to handle glossy surfaces. The study by Yuan et al. [
22] proposed a dual-mask-guided deep learning model specifically designed to detect surface defects on highly reflective leather materials. Their model enhances defect detection accuracy by effectively removing surface specular highlights in images while preserving bright defects. Although leather surfaces may not be perfectly reflective, this technique could be effective on highly glossy surfaces when implemented with robust models. In another notable study [
23], the authors presented an object detection and classification model of polished metal shaft surface defect using a deep learning method based on convolutional neural network feature extraction. Their method was achieved through image segmentation, architecture setup, and parameter optimization of a Fast-R-CNN object detection framework. According to the assessment, their model proved to be implementable in practical production; hence, their model can also be extended to other fields of large image micro-fine defects with large light surfaces. However, model performance can decline in real-life applications involving intense reflections or varying levels of reflectiveness. For example, a glass defect detection method proposed in [
20] struggled when the background image closely resembled the reflected image.
For curved surfaces in fault detection—especially with fixed cameras—researchers have developed various techniques to address the challenges. Among these, robotic arms stand out for their flexibility in navigating curved geometries. Wang et al. [
24] demonstrated a robotic arm equipped with a 3D micro X-ray fluorescence (µXRF) spectrometer and a depth camera for high-precision scanning of curved surfaces. They emphasized that maintaining consistent X-ray incident angles and scanning distances minimizes counting errors and improves accuracy. The arm’s flexible six-axis design enables comprehensive surface inspections from multiple perspectives, enhancing its industrial utility. Similarly, Huo et al. [
25] highlighted the advantages of robotic arms by employing a six-degree-of-freedom manipulator integrated with a line scan camera and high-intensity lighting. This setup successfully inspected convex, free-form, and specular surfaces by dynamically adapting the region of interest, ensuring robust defect detection on complex geometries.
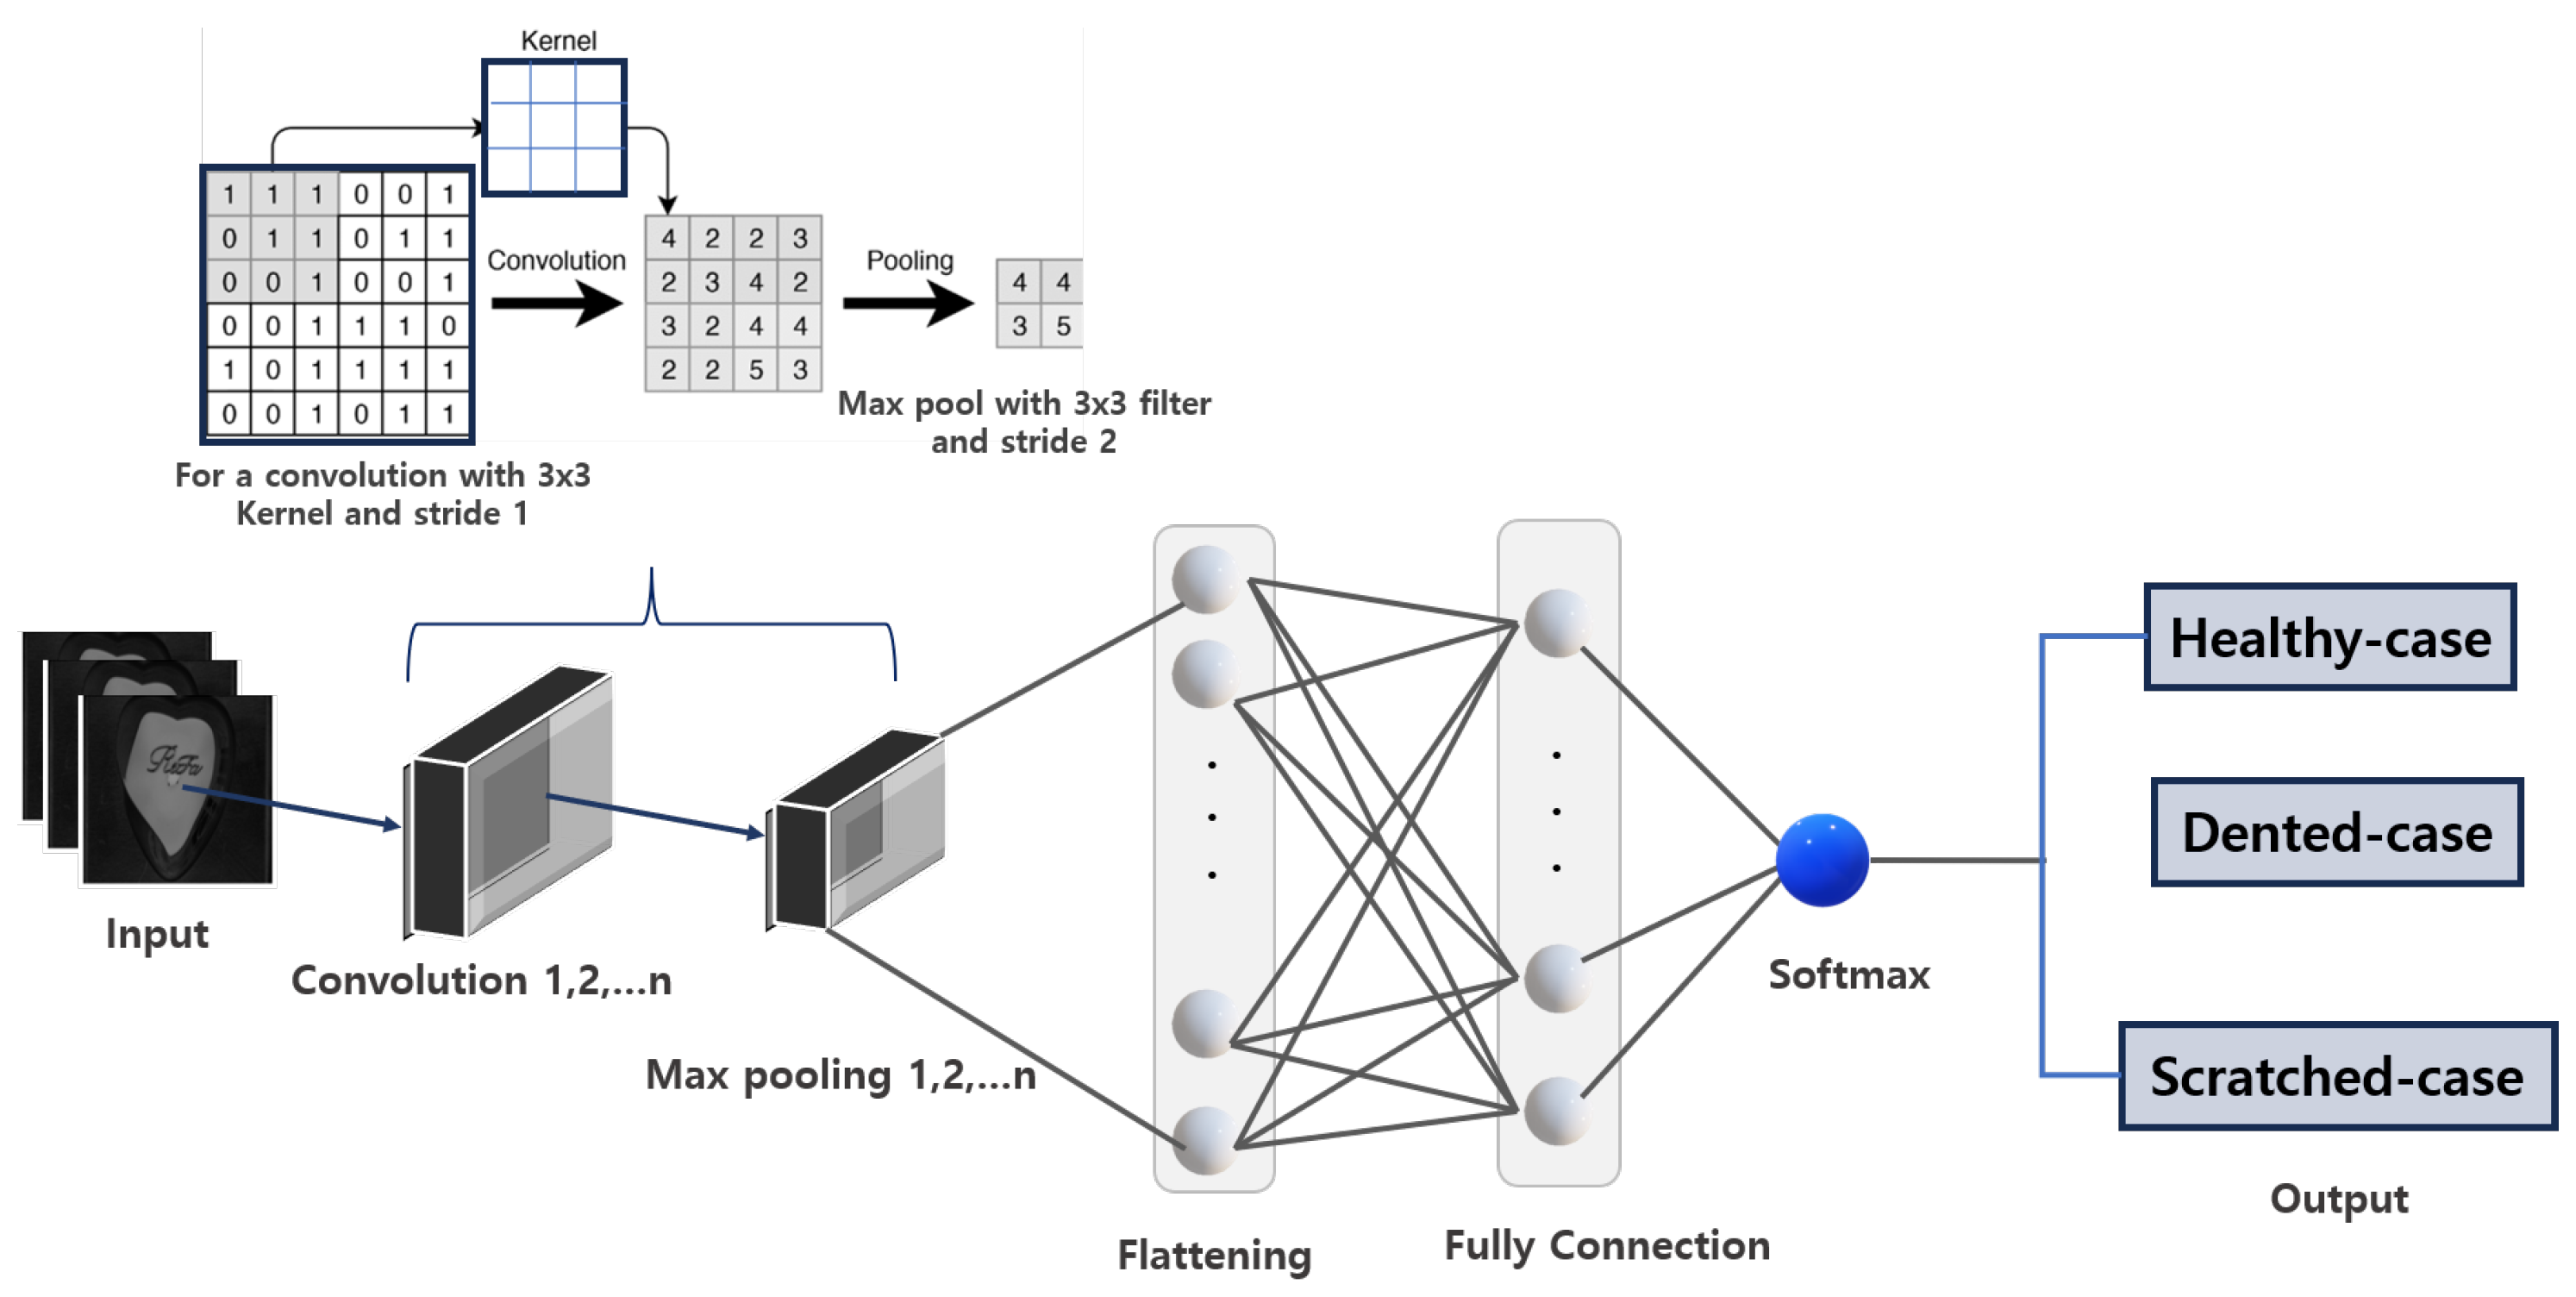
Regardless of the technique used to establish a robust image fault detection or classification model, the classifier or fault detection algorithm remains critical to achieving accurate results. Among deep learning algorithms, convolutional neural networks (CNNs) stand out as one of the most powerful. They have dominated the field of computer vision since their remarkable performance in the ImageNet Large Scale Visual Recognition Competition in 2012 and are widely employed in diverse areas, including medical imaging for tumor detection and fault identification using MRI and X-ray images [
26,
27,
28]. A typical example can be seen in this study by Rajeshkumar et al. [
29]; they used CNNs to diagnose brain tumors via MRI scans, emphasizing prompt and efficient defect detection in medical practice. Their methodology demonstrated the flexibility of CNNs; by employing a grid search optimization technique, they enhanced the performance of three CNN models for multi-classification tasks involving brain tumor images. While the models exhibited varying performance levels, they demonstrated the flexibility and adaptability of CNNs. The high accuracy achieved in identifying and classifying brain tumors further underscores the reliability and effectiveness of CNNs in medical image analysis.
Over the years, convolutional neural networks (CNNs) have branched into various specialized architectures to tackle specific challenges in computer vision—including segmentation, object detection, fault detection, and more. For instance, the Visual Geometry Group (VGG) architecture is a standard CNN model with multiple sequential layers, emphasizing simplicity in design to enhance feature extraction [
30,
31]. However, this comes at a high computational cost due to its depth. The Residual Neural Network (ResNet) architecture revolutionized deep networks by introducing residual connections, which address the vanishing gradient issue and enable much deeper architectures [
32].
The strength of ResNet was demonstrated in [
33], where several CNN architectures—including Inception V3, VGG-16, VGG-19, and a conventional CNN—were compared for early fault detection in rice leaf blast disease. ResNet-50 achieved a top accuracy of 99.75%, highlighting the importance of deep feature extraction in agricultural applications. In some cases, combining multiple CNN architectures can yield better results. For example, in [
34], the authors employed a combination of CNN subtypes for COVID-19 detection and classification. They used Faster R-CNN with a VGG-16 backbone to detect and classify COVID-19 infections in computed tomography (CT) images, achieving an accuracy of 93.86%. This further validates the utility of region-based CNNs in medical image analysis. CNN has also been integrated into various advanced models to create more sophisticated frameworks. For instance, the authors in [
35] proposed a novel transformer network enhanced with a CNN cross-attention mechanism for hyperspectral image (HSI) classification. Despite the constraint of limited data samples, their framework demonstrated exceptional classification performance. In another study, He et al. [
36] utilized a cross-fusion of CNN and transformer architectures for high-speed railway dropper defect detection. Their robust framework achieved accurate defect detection even under challenging weather conditions, such as rain, fog, sunlight, and nighttime. Deployed across over 300 high-speed trains, their system successfully detected more than 10,000 dropper defects, outperforming most state-of-the-art networks in terms of competence and reliability.
The motivation behind this study stems from the pressing demand within a manufacturing company to create a reliable classification model for products with glossy and curved surfaces.
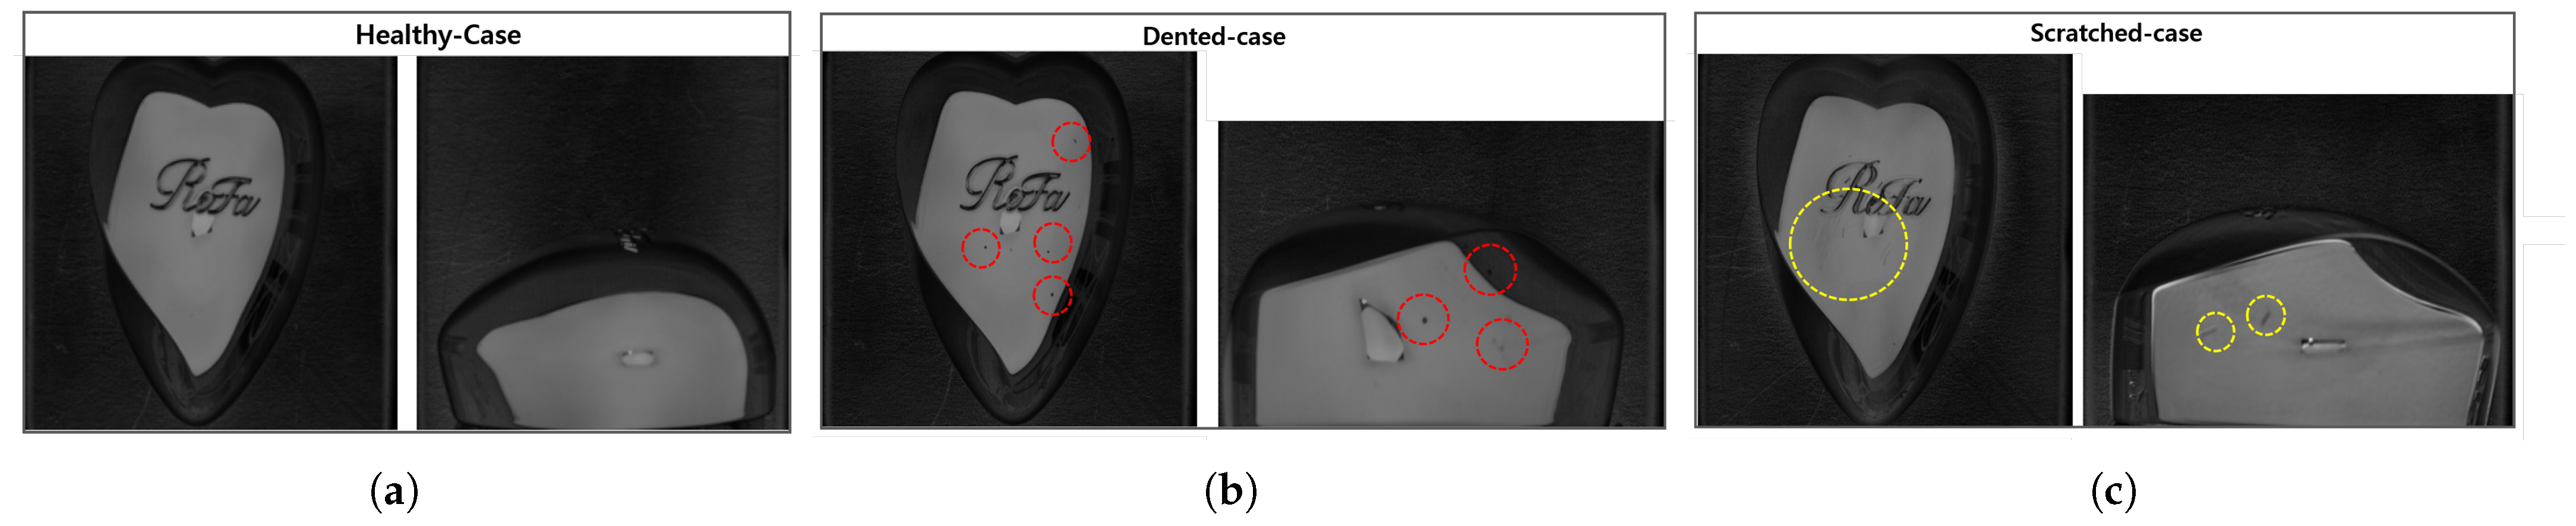
Figure 1 illustrates a product sample: a uniquely designed hairbrush case cover tailored for women. This product merges aesthetic appeal with practical functionality, catering to a specific consumer need. Its distinctiveness arises not only from its visual design but also from its ergonomic construction, material durability, and comfortable palm fit. Beyond its user-centric features, the case enhances the hairbrush’s longevity by providing protection and portability. Its versatile design ensures adaptability to diverse settings and uses, further solidifying its value in everyday life.
Nevertheless, the product’s aesthetic nature not only attracts customers but also poses challenges. Its glossy and curved design complicates traditional machine-vision inspection techniques. For example, as shown in
Figure 1, the white circles highlight dent locations that are difficult to detect visually due to surface reflectivity. Quality inspection is critical for this product, as the target demographic demands flawless items, and even minor defects like cracks, dents, or scratches lead to rejection. This stringent requirement has prompted online platforms to automatically flag and reject listings with such imperfections.
To ensure that fault classification is effectively carried out on glossy and curved surfaces in the manufacturing industry, this study makes the following contributions:
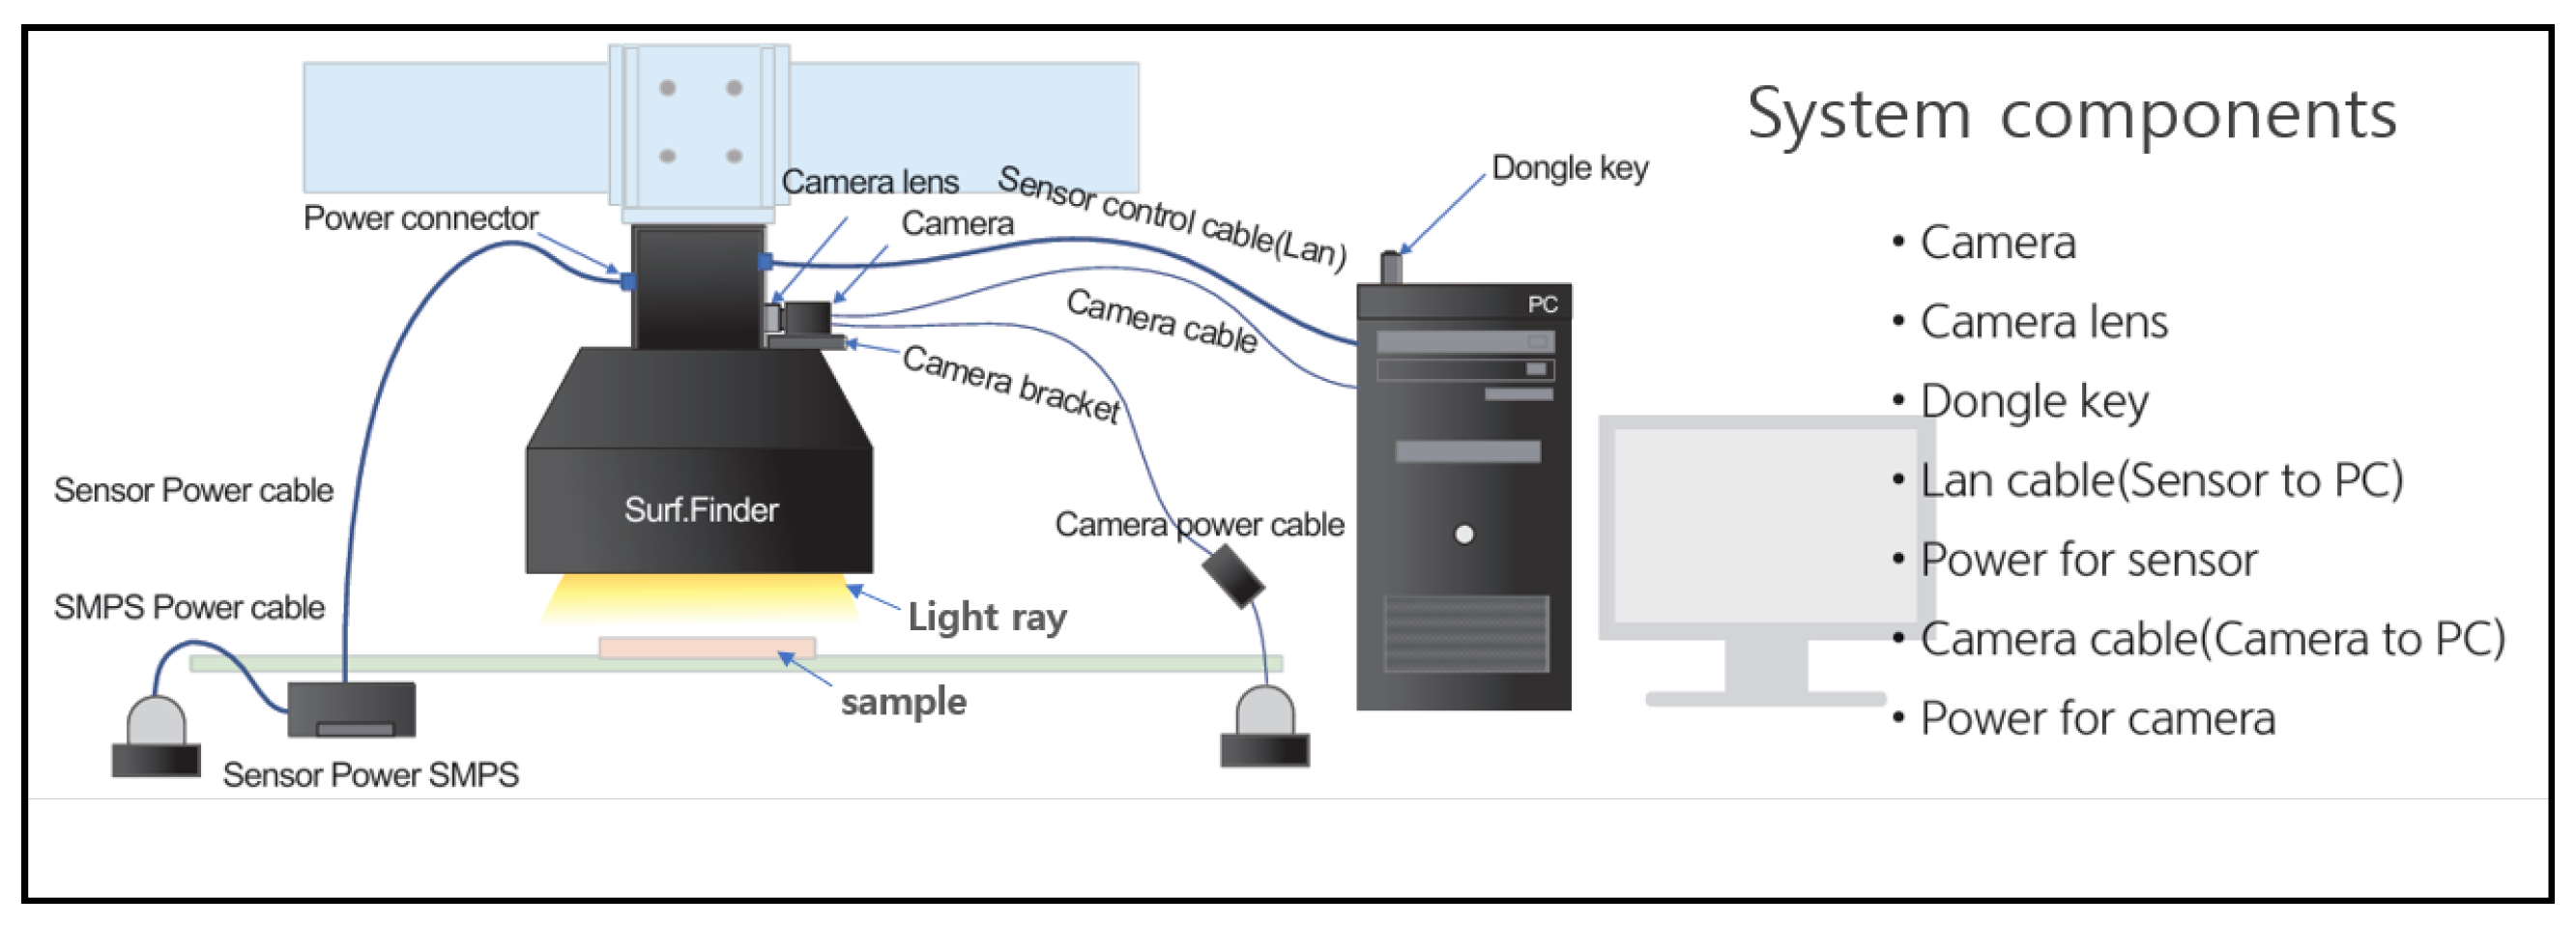
A proposal for integrating a Basler vision camera with enhanced lighting to achieve clear, high-quality image acquisition of glossy surfaces. This integration is aimed to facilitate the development of a robust fault detection and classification framework specifically designed for reflective surfaces.
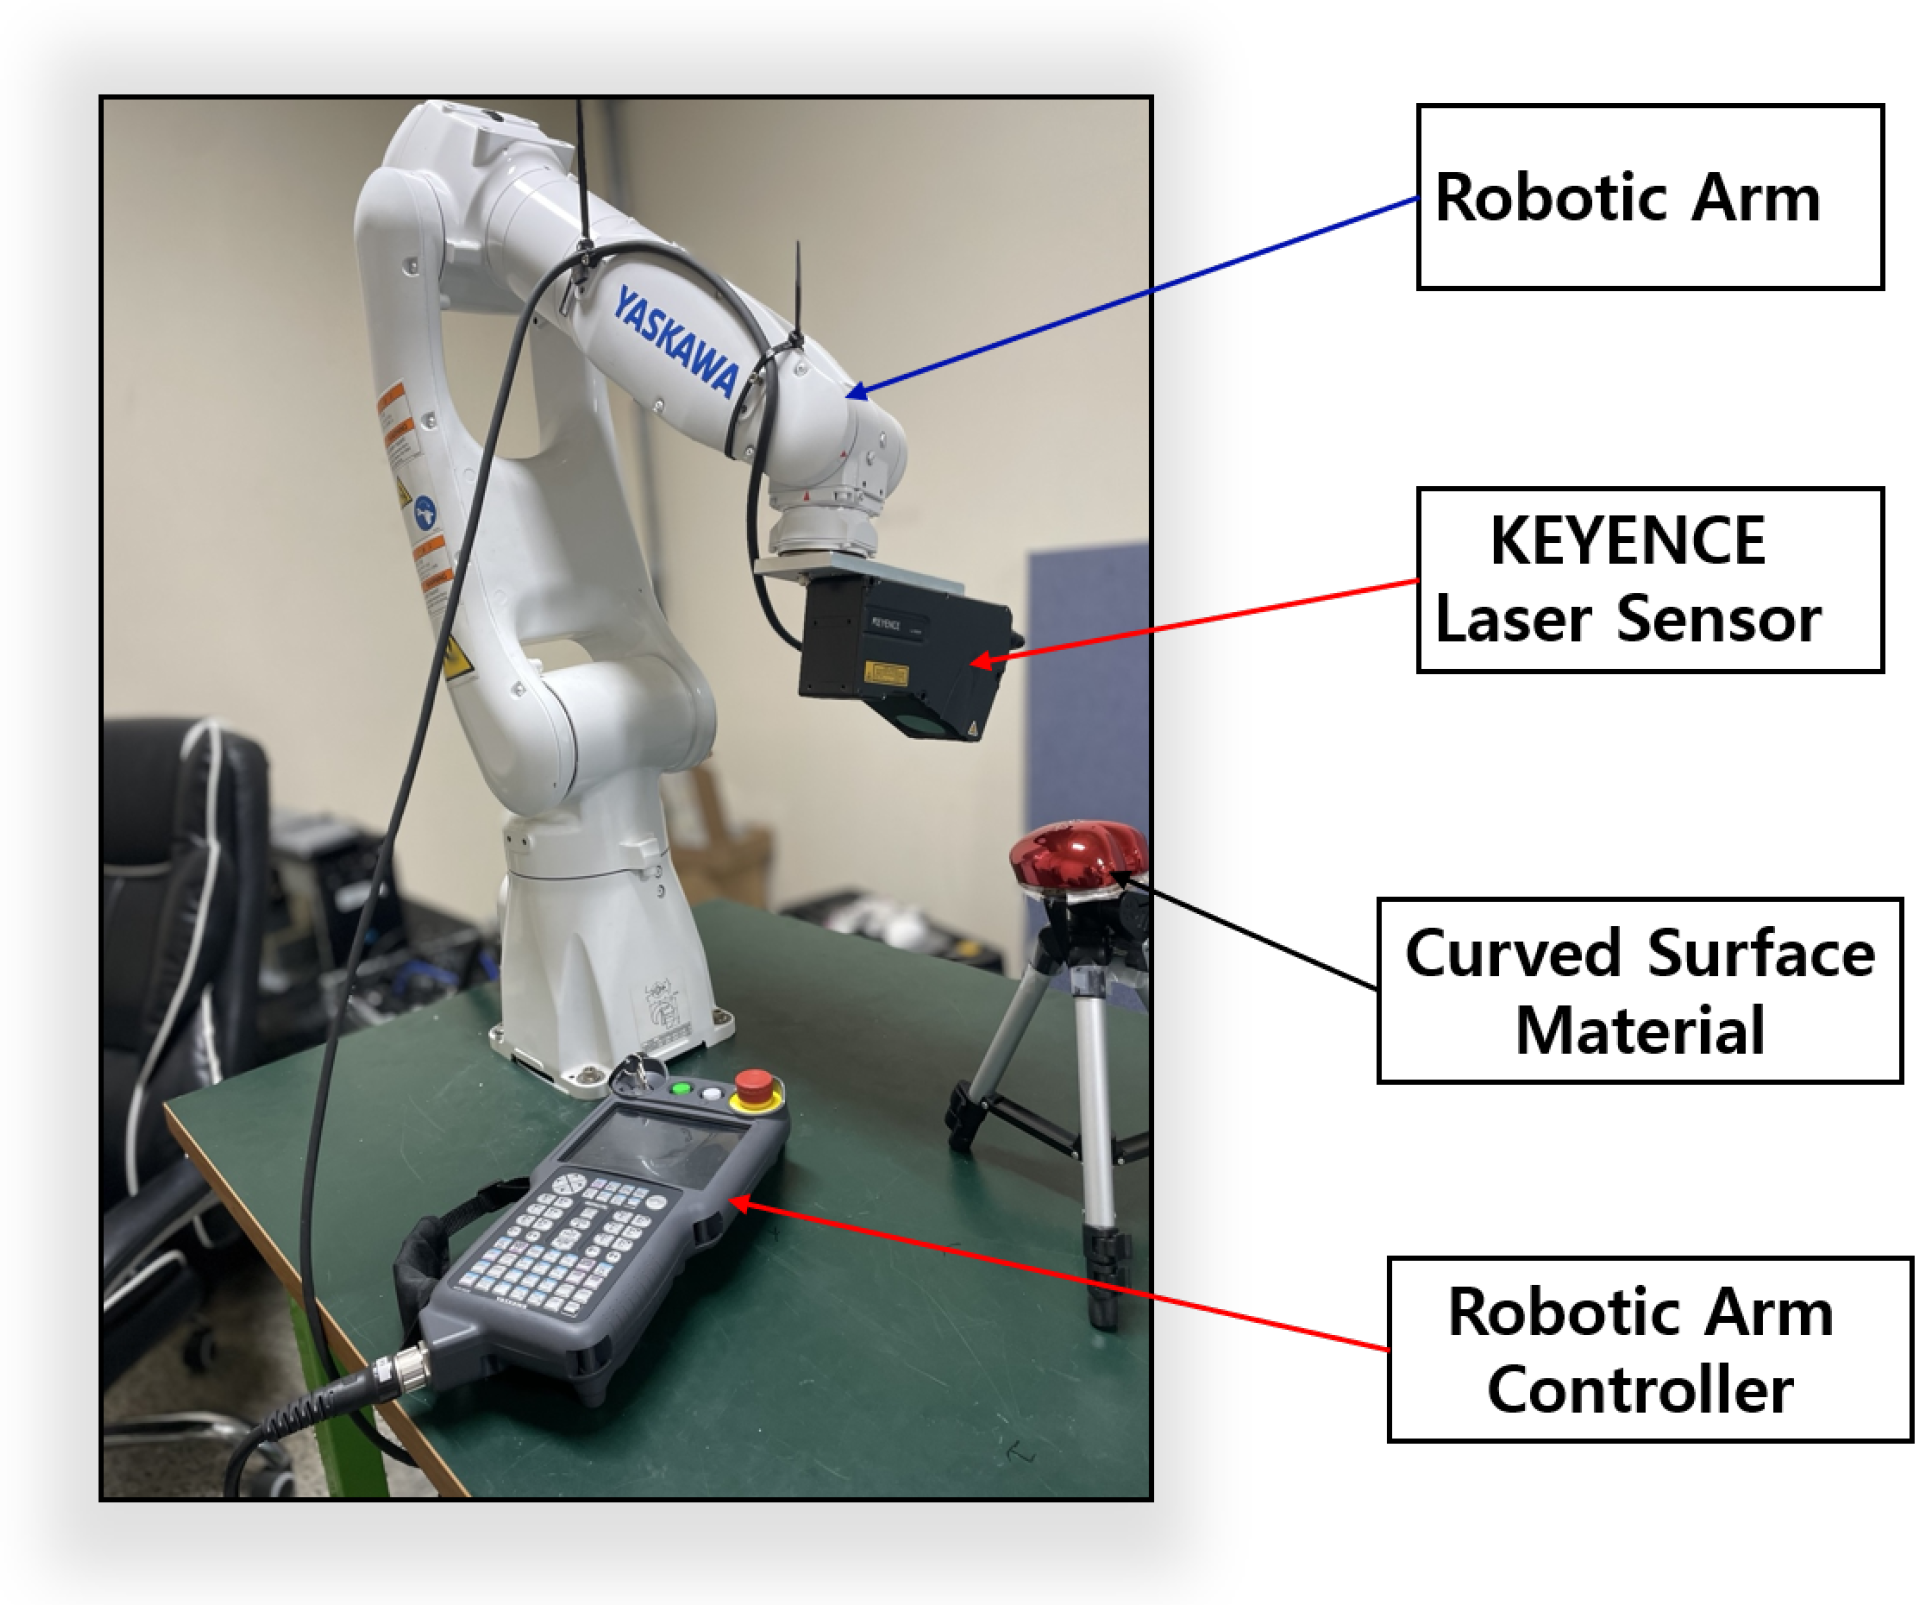
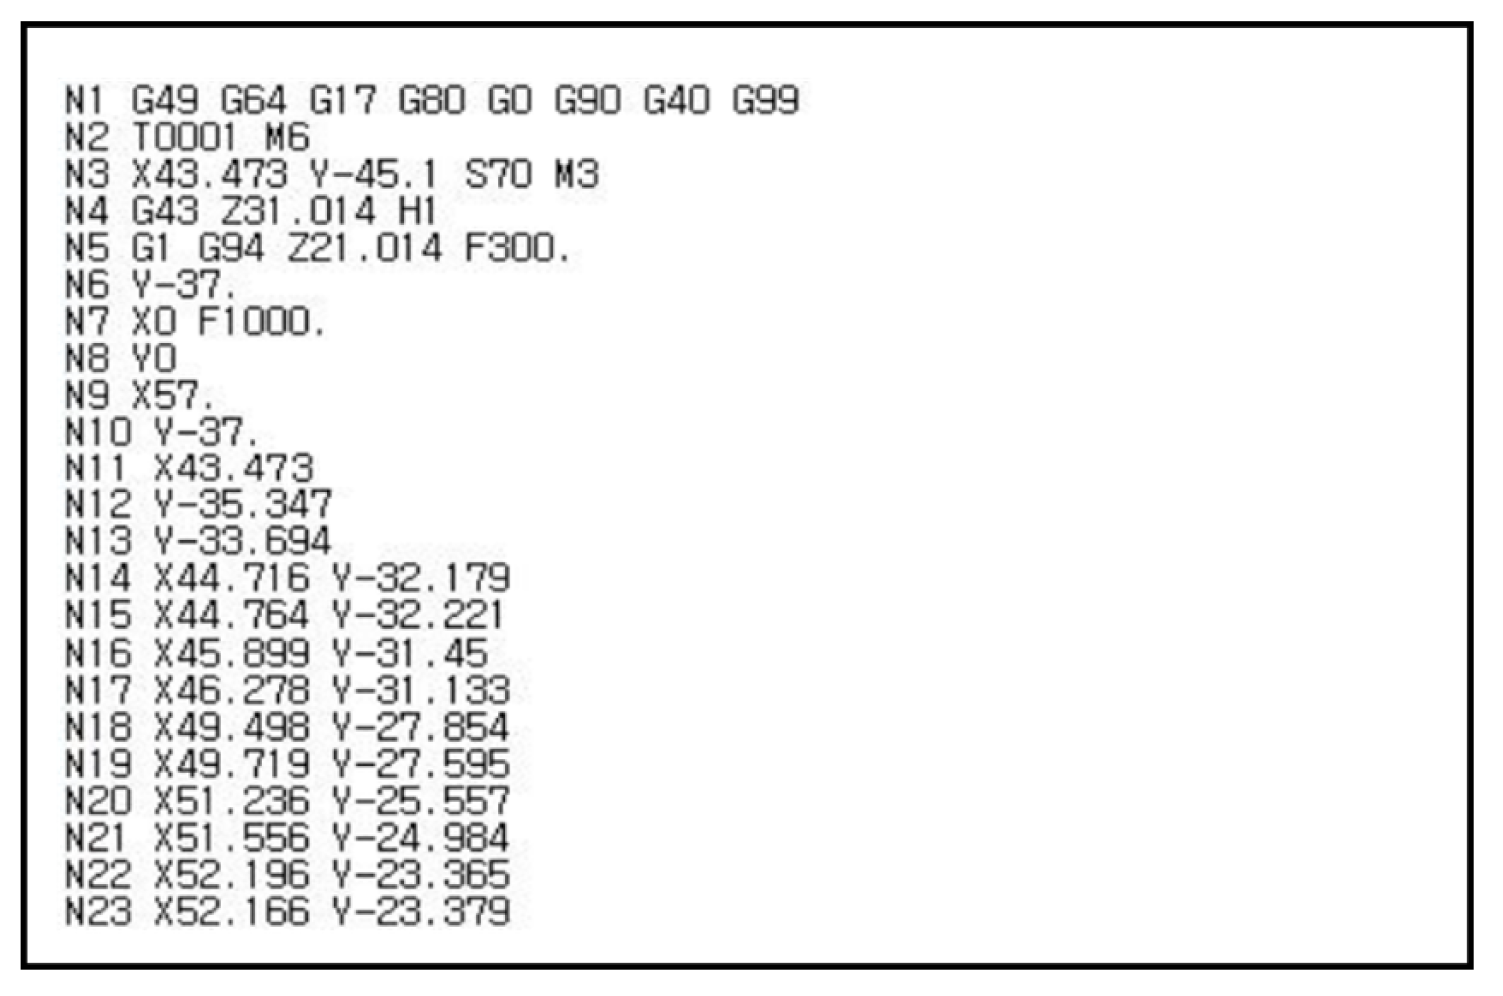
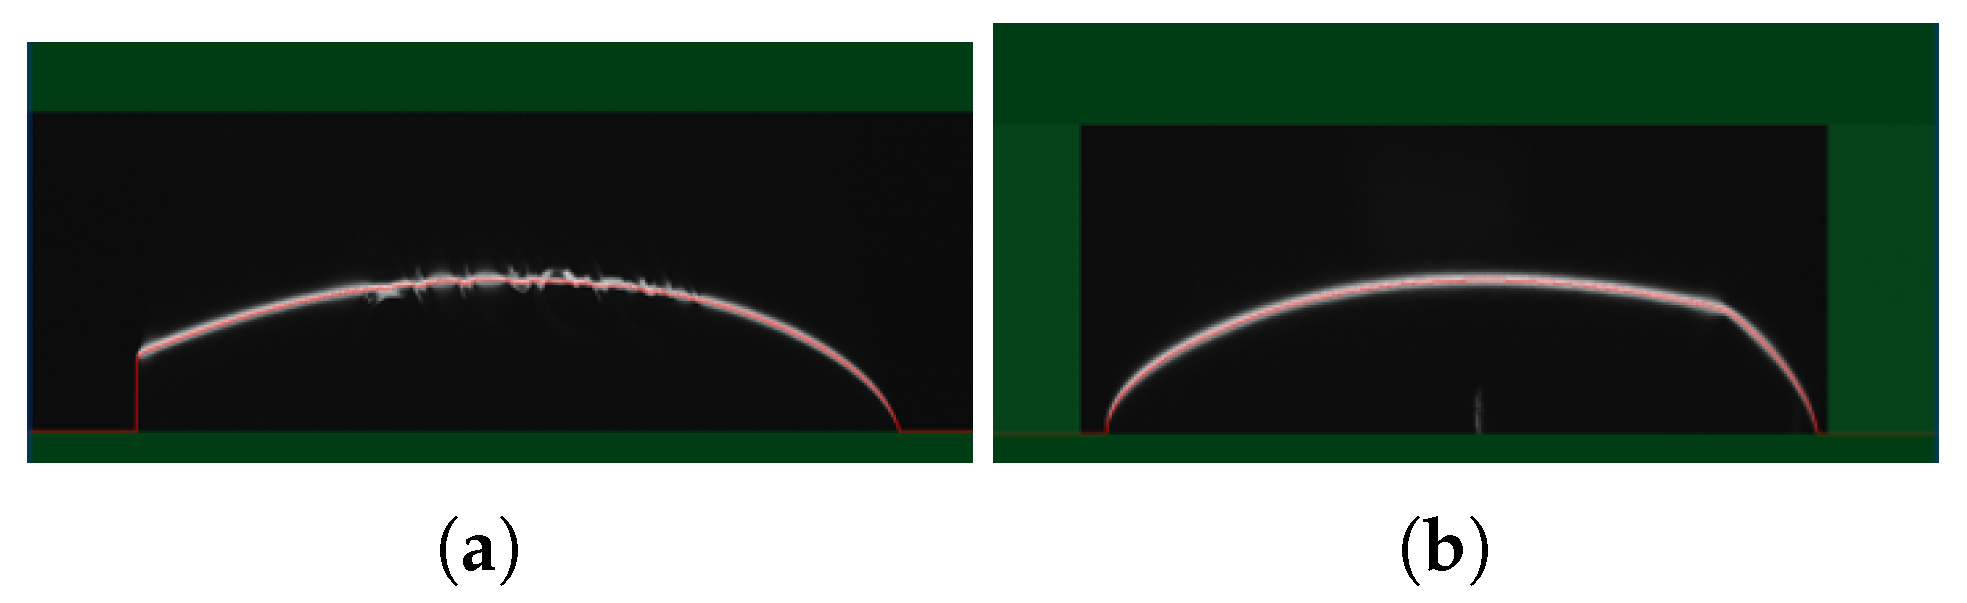
The utilization of a KEYENCE laser displacement sensor in combination with a Motoman-GP7 Yaskawa robotic arm to enable the precise and effective acquisition of curved geometries. Additionally, the integration of images from the Basler vision camera and the laser displacement sensor is proposed as an ideal approach for developing a fault classification framework for glossy and curved surface image products.
A thorough comparative assessment of robust deep learning algorithms for image-based fault detection, with global assessment metrics such as accuracy, loss, computational efficiency, recall, F1 score, specificity, mAP, and confusion matrix, to validate the performance of our model and identify an efficient algorithm that is also computationally cost efficient.
The rest of the paper is structured as follows:
Section 2 explains the theoretical background of the core techniques employed in the study.
Section 3 details the proposed system framework and methodologies used to achieve the study’s objectives.
Section 4 presents the experimental setup and visualizations.
Section 5 discusses and evaluates the results, while
Section 6 concludes the study.
3. Proposed System Framework and Methodology
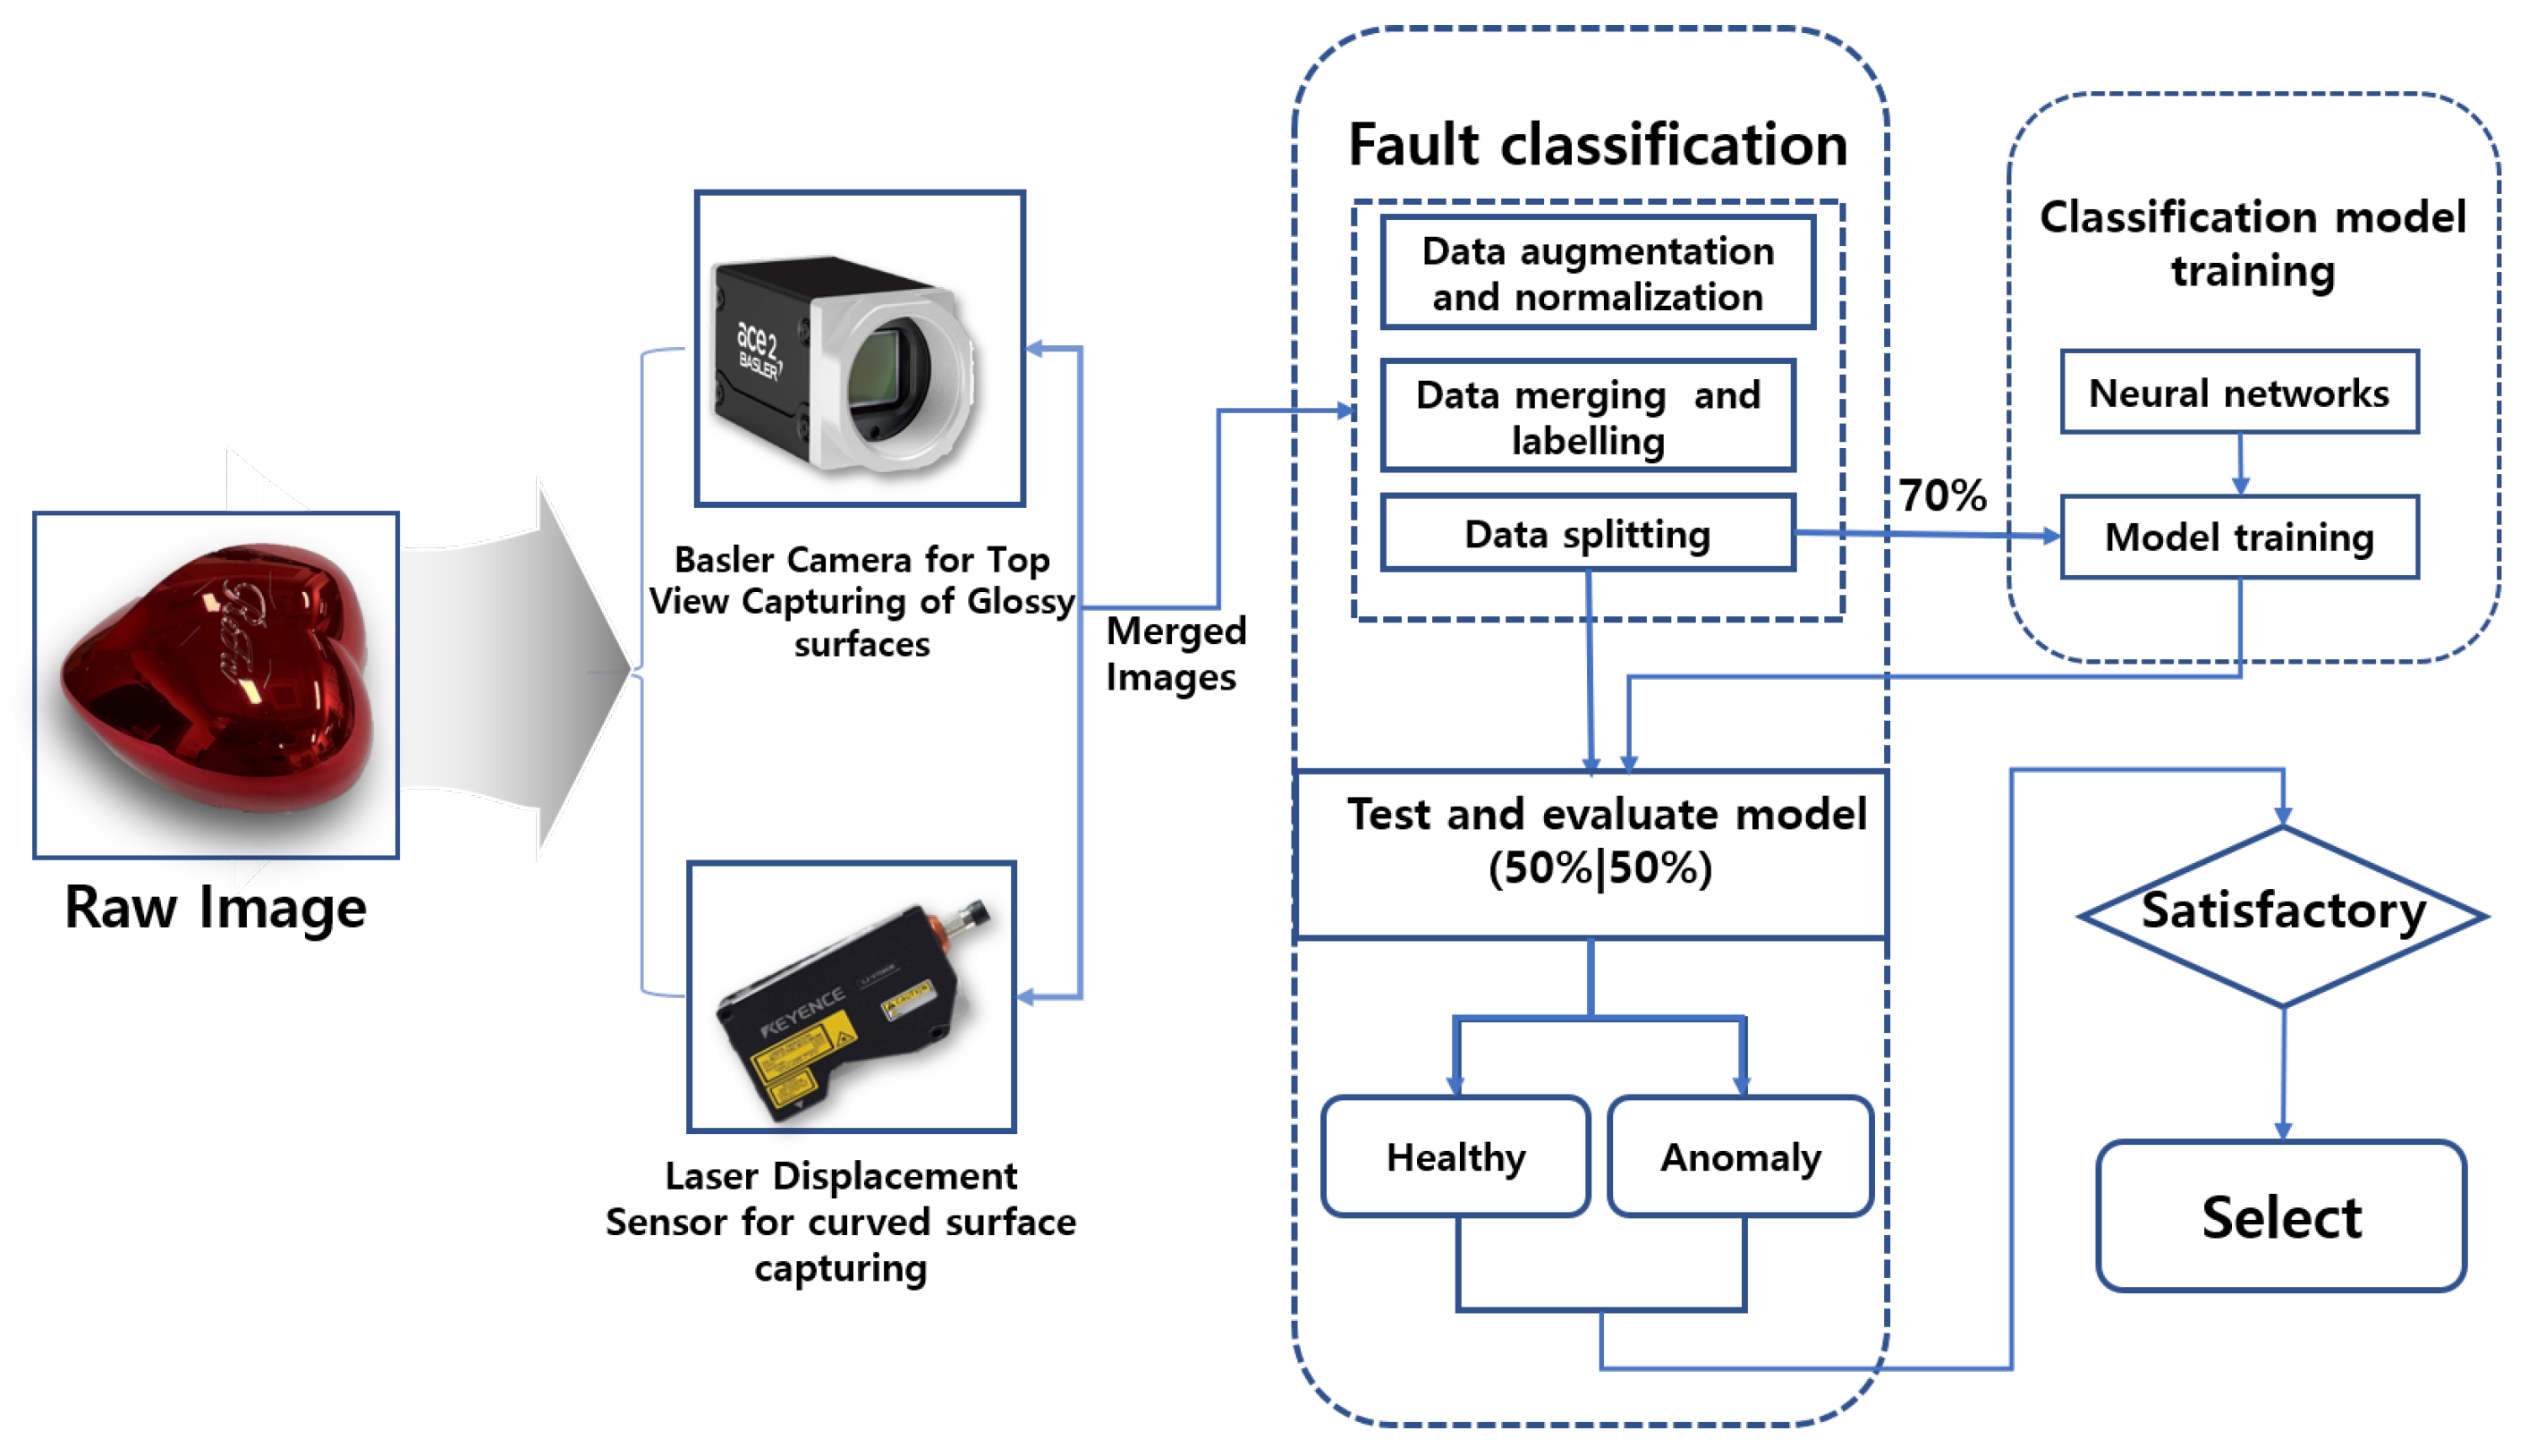
The proposed framework, illustrated in
Figure 2, outlines the steps and methodologies used in our study to achieve fault diagnostic classification for glossy and curved surfaces. A heart-shaped brush case with a glossy and curved surface was selected as the reference sample.
Our methodology consisted of three key steps. The first step involved image data collection, where two robust pieces of equipment were used to ensure the datasets were suitable for deep learning-based fault classification. A Basler vision camera with lighting was employed to capture images of the flat top surface, while a KEYENCE laser displacement sensor, mounted on a robotic arm, was used to efficiently scan the curved surface. The second step focused on data processing, which included data merging, data augmentation, labeling, and dataset splitting. In the final step, the processed datasets were fed into various deep learning image classification models. Validation assessments were conducted to identify the best-performing model and ensure it met the required performance standards.
These stages are implemented to ensure that issues encountered with glossy and curved surfaces are mitigated, thereby providing a reliable framework capable of achieving the desired efficiency for overall model validation. Given the nature of our dataset, which originates from glossy and curved surfaces, we applied specific data augmentation techniques to further enhance the images and ensure optimal adaptation.
3.1. Data Augmentation
The primary aim of data augmentation is to introduce variability into the dataset, simulating real-world instances such as zoom, lighting changes, and flipping. This ensures that the model does not rely on overly simplistic patterns, which could lead to overfitting. Data augmentation is particularly crucial when working with unbalanced or small datasets, as it serves as an efficient way to enhance and increase training data without the need to acquire additional samples. In our study, the augmentation techniques employed were brightness, zoom, and custom pixel multiplication, and their mathematical representation is presented thus:
Brightness:
where
stands for the pixel value at position
,
is the brightness adjustment constant.
stands for the zoom factor.
Custom Pixel Multiplication:
where
k is the scaling factor for each pixel value.
In this study, brightness and contrast were adjusted by and , respectively, while zoom was adjusted by . Additionally, a random multiplier of 3.0 was applied.
3.2. Model Performance Evaluation Criteria
Model evaluation is important to ensure that the model performs up to a given standard. In this study, these metrics were implemented to help evaluate, validate, and determine the best-performing deep neural network for our framework. Thus, some of the core global performance metrics implemented in this study include accuracy (
), precision (
), F1-score (
), sensitivity (
), specificity (
), and mean average precision (mAP), and their mathematical representations are shown in (
16)–(
20).
, , , and stand for true positive, false positive, true negative, and false negative, respectively. represents the average precision of class x, while N is the total number of classes.
represents the number of positive samples that a model accurately classified as belonging to the positive class, while indicates the number of non-positive samples that the model falsely classified as belonging to the positive class. On the other hand, represents the number of negative samples that the model accurately classified as belonging to the negative class, and stands for the number of negative samples that the model falsely classified as belonging to the positive class.
mAP measures the accuracy of a model in classifying within a dataset. It evaluates the model’s performance across all classes and provides a single score for overall assessment, indicating the model’s quality. Furthermore, a confusion matrix was implemented in our study to provide a detailed analysis of the actual classification performance, represented in percentages with respect to , , , and .
5. Result Evaluation and Discussion
The eight neural networks were empirically evaluated and assessed using three image classes, with the evaluation based on global metrics outlined in the previous section. This approach ensured the selection of the best model for our fault classifier. In addition to performance metrics, computational cost and the confusion matrix were also considered to guarantee a comprehensive evaluation of the models. A total of 6902 images were used, consisting of 2452 HHC, 2414 DCC, and 2037 SCC images. The dataset was divided into training, validation, and testing sets. For VGG-16 and ResNet-50, a 70:15:15 ratio (training:validation:testing) was used, while custom CNN models were trained with an 80:10:10 ratio, based on their respective adaptation requirements. For VGG-16 and ResNet-50, both the 70:15:15 and 80:10:10 splits produced similar results. However, the 70:15:15 ratio was chosen because it allocated fewer resources to training, reducing computational demands while maintaining performance. In contrast, for the custom CNN models, the 80:10:10 ratio yielded better performance, as evidenced by higher accuracy and lower loss values compared to the 70:15:15 split, making it the preferred choice.
The experiments were conducted on a system configured with an Intel Core i7-11700 processor (8 cores, 16 threads, 2.50 GHz base frequency), 32 GB of DDR4 RAM, and running the Windows 10 operating system. The hardware was manufactured by Gigabyte Technology Co., Ltd., New Taipei City, Taiwan, featuring the B560M AORUS ELITE motherboard. The system designation is DESKTOP-J1TP30L, operating on a 64-bit architecture (x64-based PC). The deep learning models were trained using TensorFlow 2.x and NumPy 1.23.4 without GPU acceleration. The decision to use only the CPU was intentional, as the goal was to establish a resource-aware framework that could be deployed on systems without GPU acceleration, making it more accessible for practical applications. Consequently, some state-of-the-art algorithms, such as R-CNN, Mask R-CNN, and YOLO, were not feasible due to their high computational demands, which stem from their reliance on large-scale feature extraction and real-time processing capabilities.
Figure 10 presents the training and loss curves for all models, illustrating their convergence behavior and performance during training.
As shown in the plots, the training accuracy and loss curves of all eight neural network models used in this study reveal key insights into their performance. The results demonstrate that higher image resolution improved model efficiency, emphasizing the importance of resolution in enhancing training outcomes. In general, all models displayed strong learning capacity, as reflected in their accuracy curves, with the exception of ResNet-50128 and ResNet-50224, which experienced some instability during the early stages of training.
However, this instability was not observed in the loss curves, where the validation curves for VGG-16128, VGG-16224, ResNet-50128, and ResNet-50224 struggled to converge, despite the models’ inherent robustness. This could be attributed to the input image dimensions, as the VGG-16224 and ResNet-50224 models showed greater stability than their 128 × 128 counterparts. Additionally, the high learning rate used due to the complexity of the dataset may have contributed to the observed fluctuations. While early fluctuations in accuracy and loss curves do not necessarily indicate poor performance, they suggest potential challenges in model convergence. Upon closer inspection, despite the fluctuations, ResNet-50224 demonstrated the ability to adapt and stabilize towards the end of the training process, showcasing its robustness and capacity to efficiently optimize and generalize from the data.
To provide a more comprehensive evaluation, the models were further assessed using the test dataset, and the results are summarized in
Table 11 below.
In our assessment, macro-averaging was preferred over weighted averaging for the evaluation metrics to ensure that the models were evaluated based on their performance across each individual class. Given the slight imbalance in our dataset classes, macro-averaging was chosen to provide a more balanced evaluation. As shown in
Table 11, VGG-16
224 and ResNet-50
224 outperformed the other models across various metrics. Specifically, ResNet-50
224 achieved the best performance in most cases, including accuracy, loss, precision, recall, and F1-score. On the other hand, VGG-16
224 excelled in specificity and mean average precision (mAP).
While ResNet-50224 can be considered the best classifier based on these results, it is important to note that specificity and mAP are also critical metrics. In particular, mAP is often the most important metric for evaluation, especially in multi-class and imbalanced data scenarios. Notably, ResNet-50224 did not achieve the highest mAP score, suggesting that other models, such as VGG-16224, may offer better performance in certain aspects.
To gain deeper insights into the models’ performance, the confusion matrix was also employed to evaluate the actual class classification performance, focusing on , , , and .
Figure 11 displays the confusion matrix for all models. The reduced performance of most models can be attributed to the high
values in the dent class, with many datasets incorrectly predicted as belonging to the normal class. Overall, the dent class had the highest
, while the scratch class had the lowest
on average across all models. The normal class consistently showed the highest percentage of
, whereas the dent class had the lowest percentage of
.
A comparative analysis of the performance of VGG-16
224 and ResNet-50
224—based on their confusion matrix evaluations shown in
Figure 11f and
Figure 11h, respectively—was conducted to determine the superior model, as these two emerged as the top performers. The performance of each model across all classes was evaluated to identify their respective strengths and weaknesses in class prediction. ResNet-50
224 demonstrated superior
performance for the normal and scratch classes, while VGG-16
224 excelled in the dent class. Furthermore, ResNet-50
224 achieved lower FN scores in two classes (normal and scratch), while VGG-16
224 recorded a lower FN only for the dent class. A similar pattern was observed in the
assessment, where ResNet-50
224 exhibited lower scores for the dent and scratch classes, whereas VGG-16
224 had a lower score for the normal class.
These findings suggest that ResNet-50224 demonstrated greater data adaptability and overall efficiency compared to VGG-16224 in this study.
5.1. Computation Efficiency Evaluation
One of the key factors in determining an optimal model is its computational efficiency. Therefore, this section discusses the selection of an adequate model and offers suggestions for alternative models that could be considered when computational efficiency is a critical factor.
For a more in-depth analysis, floating point operations (FLOPs) are introduced to concisely determine the computational energy requirements of each model. FLOPs are a key metric for assessing model complexity, especially in deep learning models. They provide valuable insights into the computational requirement of a model, which is key for model optimization, hardware implementation, and real-time performance.
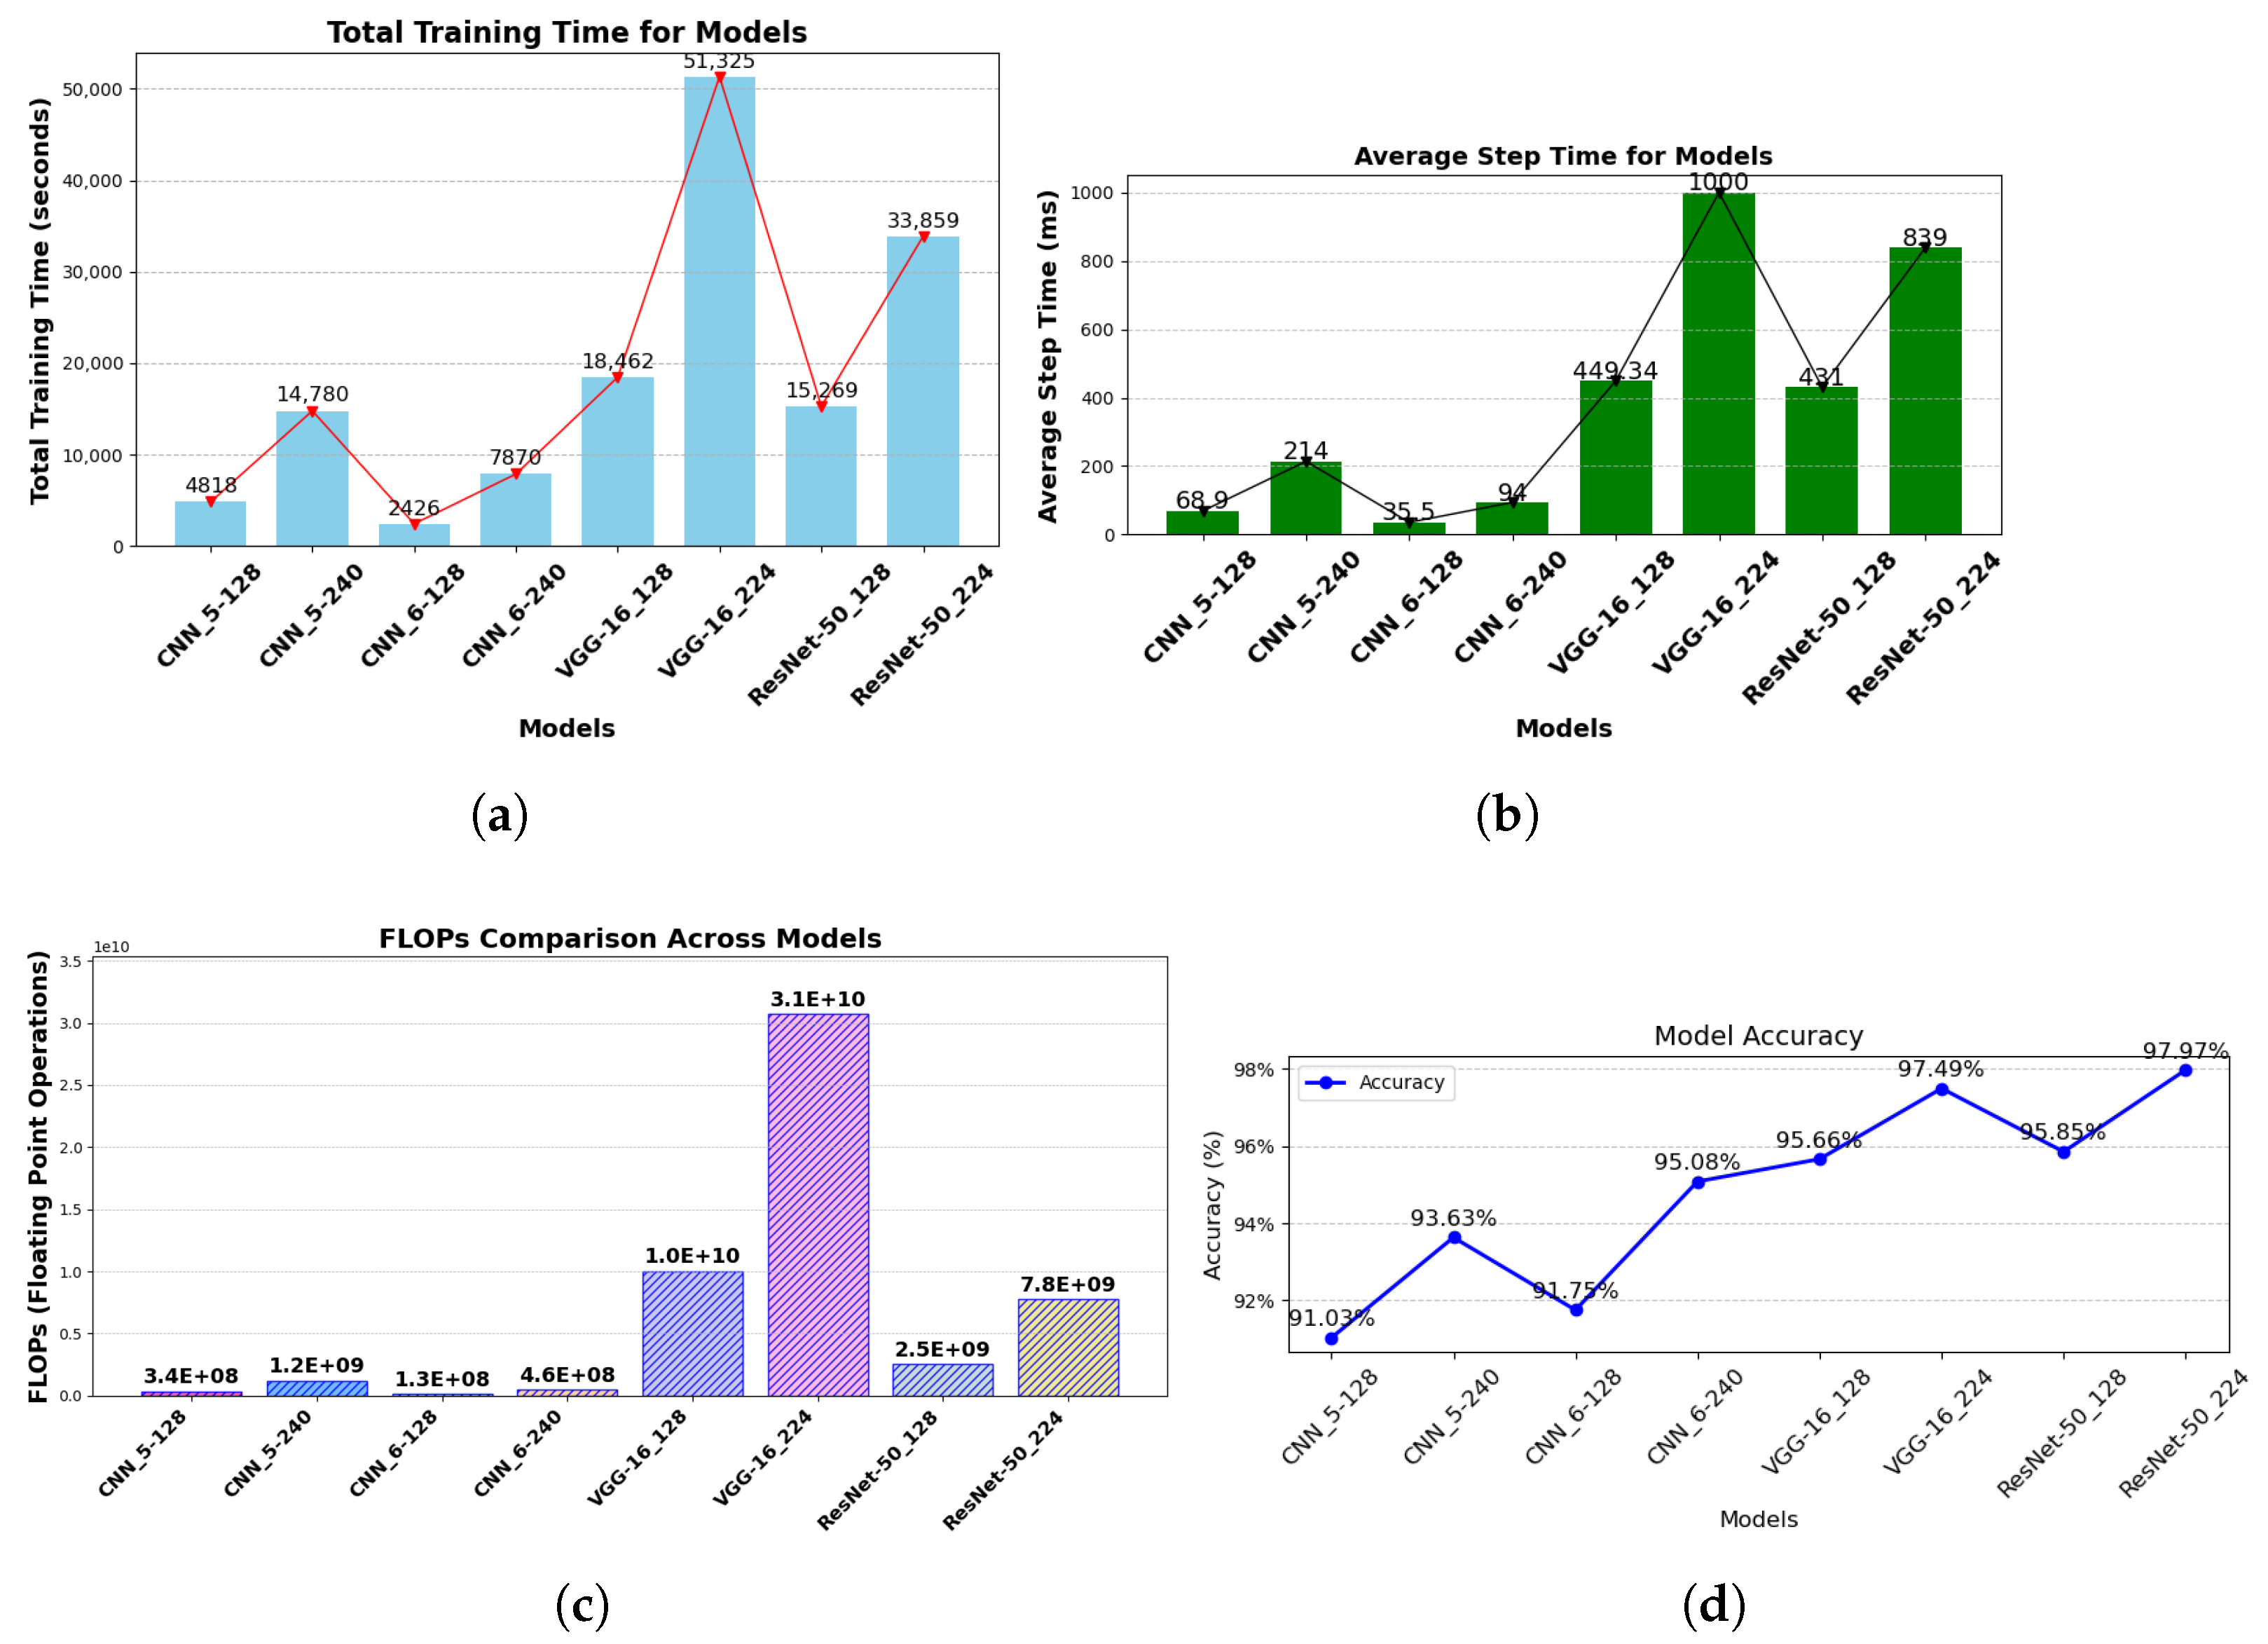
Figure 12a–c provide a comprehensive computational analysis of the models implemented in this study. The plots clearly show that the custom CNN models outperformed the pre-trained models (VGG-16 and ResNet-50 variants) in terms of computational efficiency. An interesting observation from the computational analysis is that the CNN
5 models exhibited higher computational energy demands for their respective input pixel dimensions, despite having shallower architectures compared to the CNN
6 models. This behavior may be attributed to the complexity of the dataset, which likely challenges the CNN
5 architectures in fully capturing and learning its features.
While ResNet-50
224 demonstrated exceptional performance across various evaluation metrics, its significant computational energy demand raises concerns for applications where computational efficiency is a key factor, as shown in
Figure 12a,b. Furthermore,
Figure 12c, which displays the FLOPs of the models, revealed similar findings. ResNet-50
224—with a total of 7,751,510,674 FLOPs—may not be the ideal choice for real-time system applications due to its computational complexity. In contrast, CNN
6-240 presents itself as a more desirable option. Its accuracy—reaching up to 95% as shown in
Figure 12d—though lower than that of ResNet-50
224, requires significantly less computational energy and has FLOPs of 459,072,914, suggesting suitability for real-time system implementation. This can be attributed to its lighter architecture, making it a practical alternative despite its slightly lower accuracy compared to ResNet-50
224. Moreover, its computational efficiency offers an opportunity for further hyperparameter tuning, which could enhance its accuracy. This makes the CNN
6-240 model adaptable, cost-effective, and well-suited for resource-sensitive environments without compromising performance.
5.2. K-Fold Model Evaluation
To validate the two best-performing models—ResNet-50224 (best overall) and CNN6-240 (most computationally efficient)—we implemented a 3-fold cross-validation. This technique partitions the dataset into three folds, using two folds for training and one for validation in each iteration. By rotating the validation fold, we ensure every data point contributes to both training and evaluation, reducing bias from a single split, hence providing a more generalized performance assessment. Stratified sampling was implemented to ensure robust evaluation.
Figure 13 illustrate the outcomes of the 3-fold cross-validation, showing both models’ accuracy and loss curves, alongside their respective test accuracies and losses. CNN
6-240 maintained an average k-fold test accuracy of 94.86%, closely mirroring its initial test accuracy of 95.08%. This reflects its strong efficiency and reliability in maintaining performance across different splits. Meanwhile, ResNet-50
224 demonstrated superior accuracy, achieving an average of 98.088% with a reduced average loss of 0.0932, outperforming its original test results of 97.97% accuracy and 0.1030 loss. These findings highlight ResNet-50
224’s advantage in generalization and accuracy, while CNN
6-240 remains an effective, computationally efficient alternative.
6. Conclusions and Further Works
In this study, we proposed a framework for image data generation and fault classification on glossy and curved surfaces. Data collection was achieved using two complementary techniques: a Basler vision camera with specialized lighting to capture front-view images of heart case glossy surface samples while minimizing reflectiveness, and a laser displacement sensor paired with a robotic arm to accurately capture the curved surfaces of the samples.
Our dataset—consisting of three classes (HCC, DCC, and SCC)—was used to train eight deep neural networks. These networks were selected for their adaptability to the data and lower computational energy requirements. The architectures included four custom traditional CNNs (CNN5-128, CNN5-240, CNN6-128, CNN6-240) trained on image dimensions of 128 × 128 and 240 × 240 pixels, as well as four pre-established models: two variations of VGG-16 (VGG-16128, VGG-16224) and two variations of ResNet-50 (ResNet-50128, ResNet-50224), which were trained on images of 128 × 128 and 224 × 224 pixels, respectively. From our evaluation results, ResNet-50224 achieved the highest accuracy at 97.97%, followed closely by VGG-16224 with an accuracy of 97.49%. However, ResNet-50224’s computational demands were less efficient compared to some of the custom traditional CNN architectures. Notably, CNN6-240 delivered an accuracy of 95.08% with an average step time of 94 milliseconds, compared to ResNet-50224’s 839 milliseconds, making CNN6-240 a viable choice in scenarios where computational efficiency is paramount.
Our framework significantly advances glossy and curved surface defect detection by integrating specialized imaging hardware with tailored deep learning models. Using a Basler camera with custom lighting minimizes reflections on glossy surfaces, while a laser displacement sensor with a robotic arm precisely captures curved surfaces—yielding high-quality, reliable data. Beyond technical metrics, our framework also has significant industrial implications. Its deployment in manufacturing could lead to substantial cost savings by reducing defect rates and minimizing downtime, ultimately improving product quality and competitiveness.
For future work, we plan to further optimize and enhance the custom CNN models to achieve higher accuracy while reducing energy consumption. The lag observed in most models can likely be attributed to the high FN rate of the dent class, as indicated by the confusion matrix. This issue is more likely caused by feature overlap with normal surfaces rather than class imbalance. To address this, targeted data augmentation like CLACHE (Contrast Limited Adaptive Histogram Equalization), feature engineering, and loss function modifications can be employed to enhance detection accuracy. In addition, systematic optimization techniques such as grid search and Bayesian optimization can be introduced to fine-tune hyperparameters for improved model performance. Furthermore, we aim to explore federated learning for multi-factory deployment, enabling collaborative, privacy-preserving model training across distributed production sites. We also plan to investigate lightweight model distillation techniques to facilitate real-time, energy-efficient deployment in industrial settings, potentially achievable through fine-tuning the custom CNN.
However, a key limitation of our approach is its reliance on controlled lighting conditions and specific robotic arm configurations. The reliance on controlled lighting conditions may limit the framework’s applicability in environments with no lighting, variable lighting, or uncontrolled lighting, such as outdoor or poorly lit industrial settings. For example, in environments with uncontrolled lighting, the system’s accuracy could drop significantly due to increased reflections and noise. Furthermore, the use of a robotic arm for precise positioning introduces scalability limitations and challenges in integrating with other automated systems. Additionally, its deployment is heavily dependent on expert knowledge, which may restrict widespread adoption. Future work will focus on mitigating these limitations by improving adaptability to diverse lighting conditions and exploring alternative data acquisition methods.


