
A Highly Portable Smartphone-Based Capillary Electrophoresis with Capacitively Coupled Contactless Conductivity Detection

 , and
, and
Abstract
1. Introduction
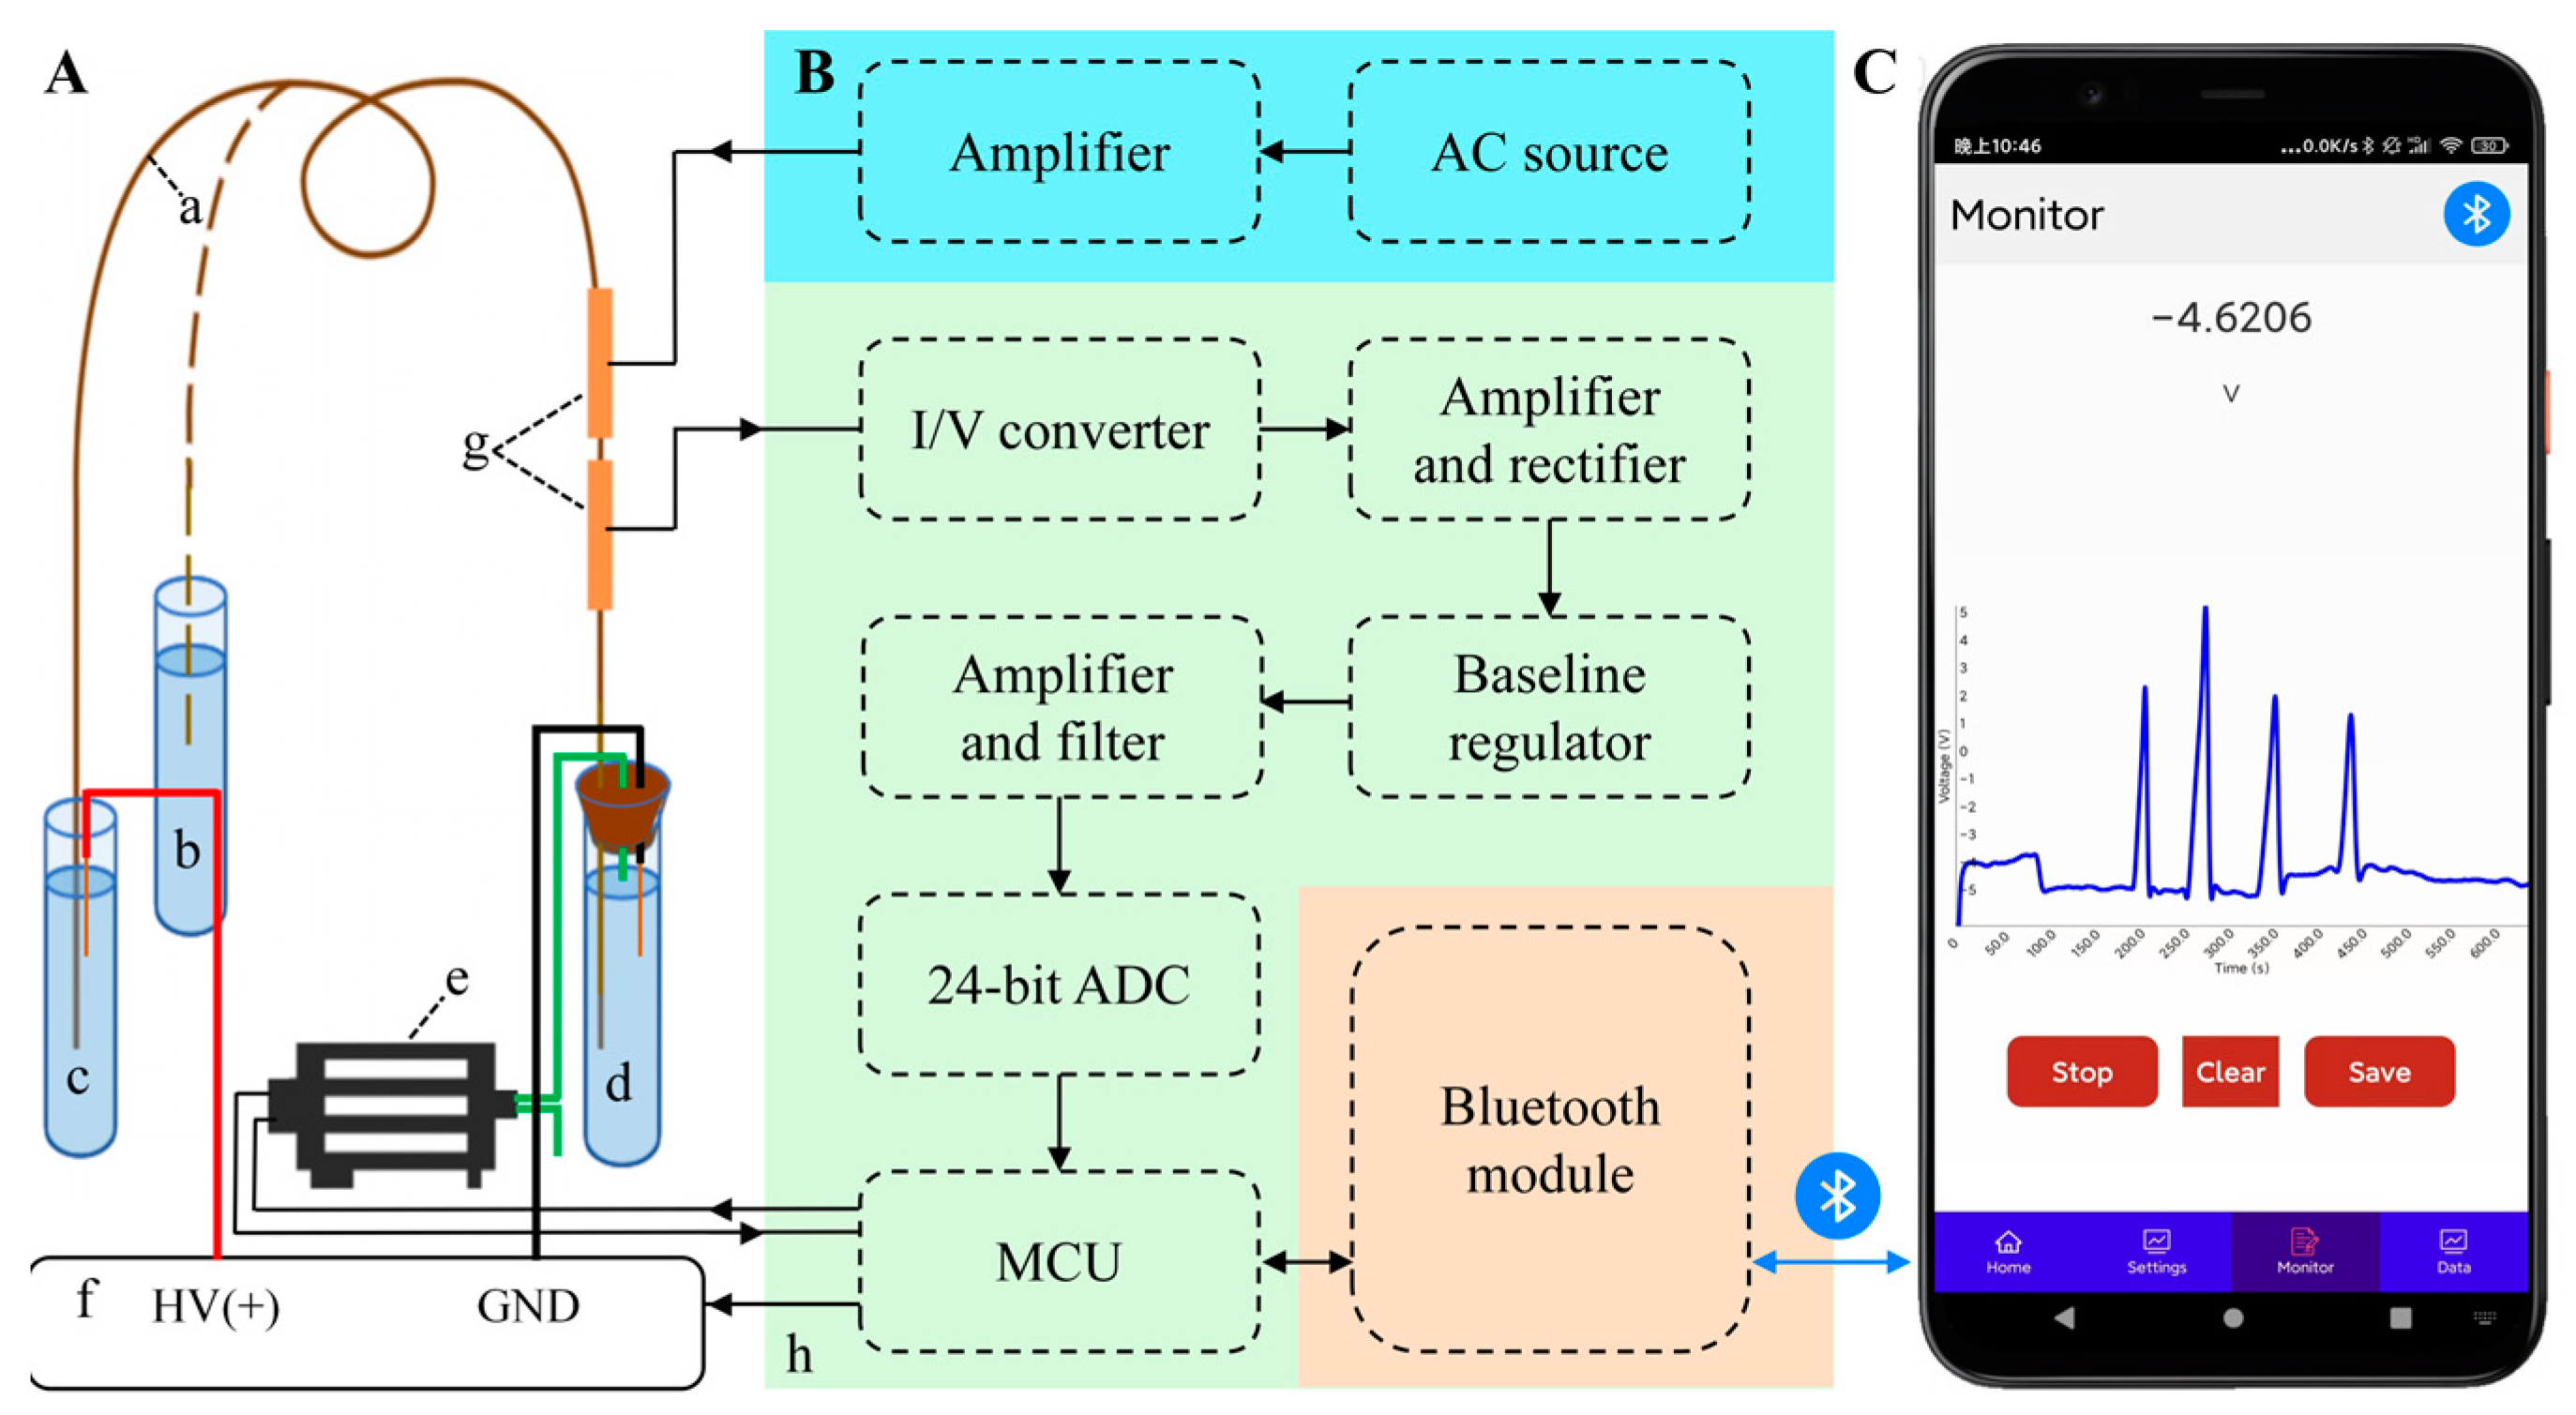
2. CE-C4D Device
2.1. Design of CE-C4D
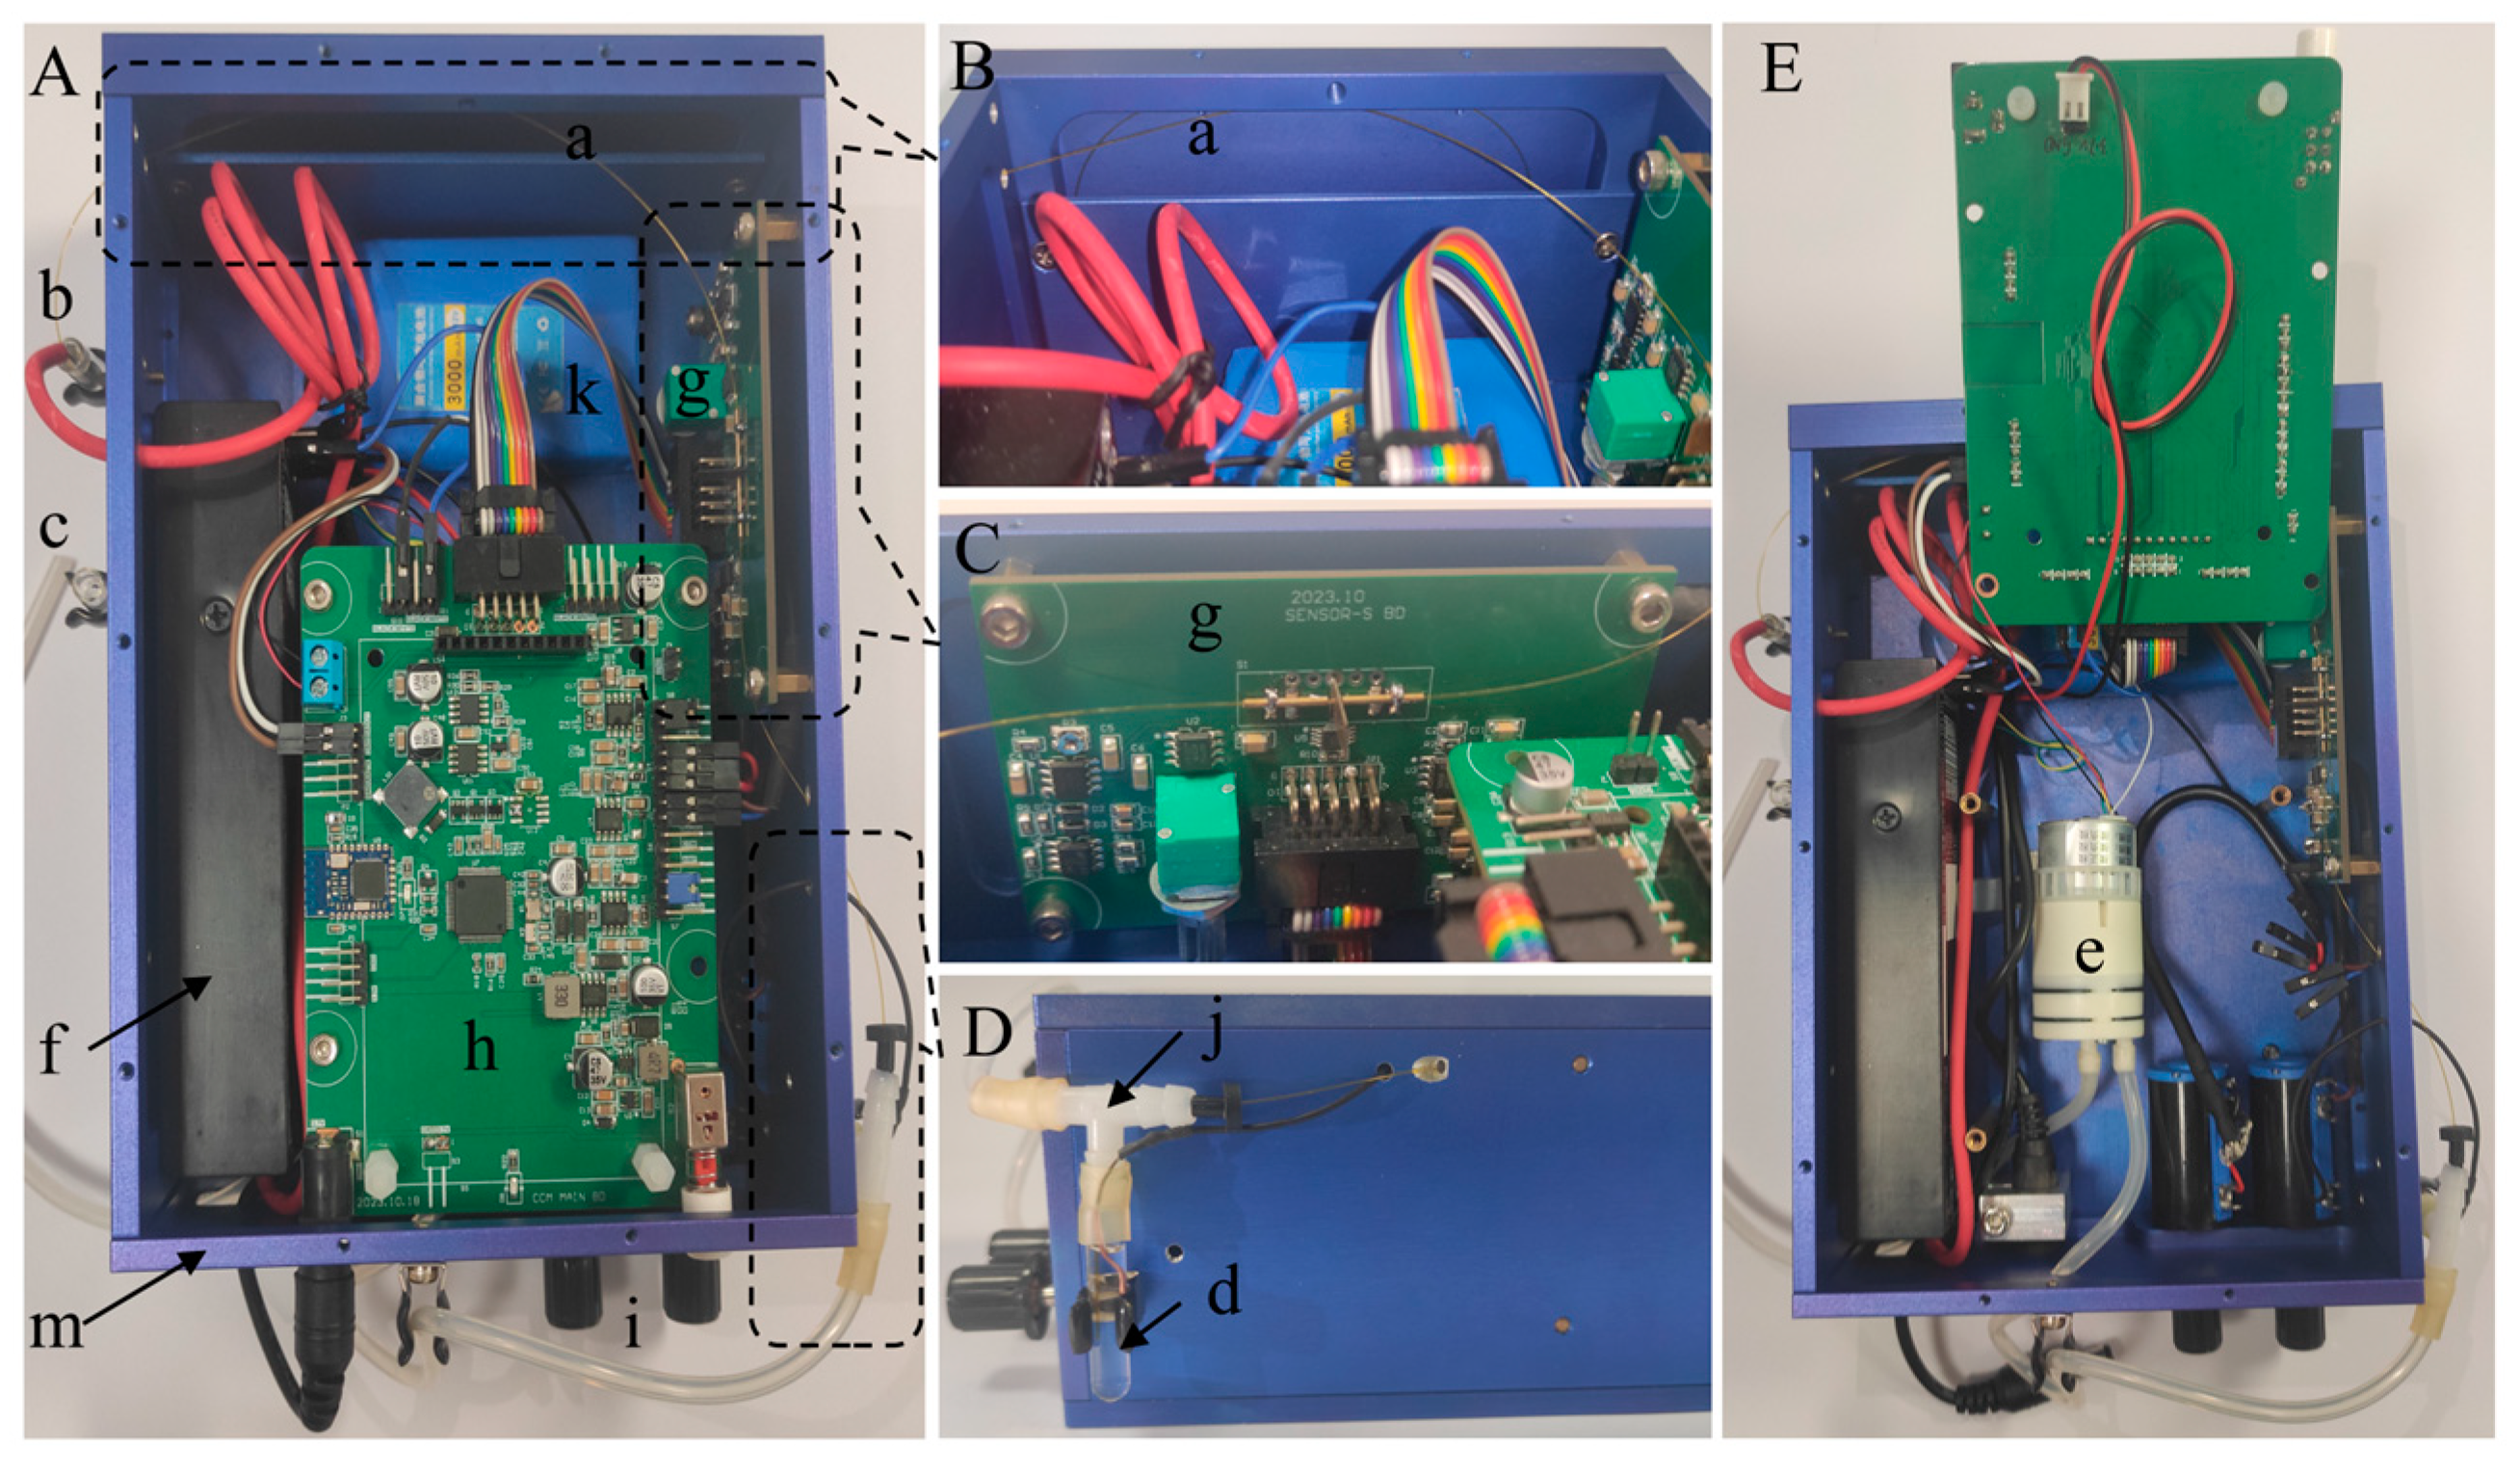
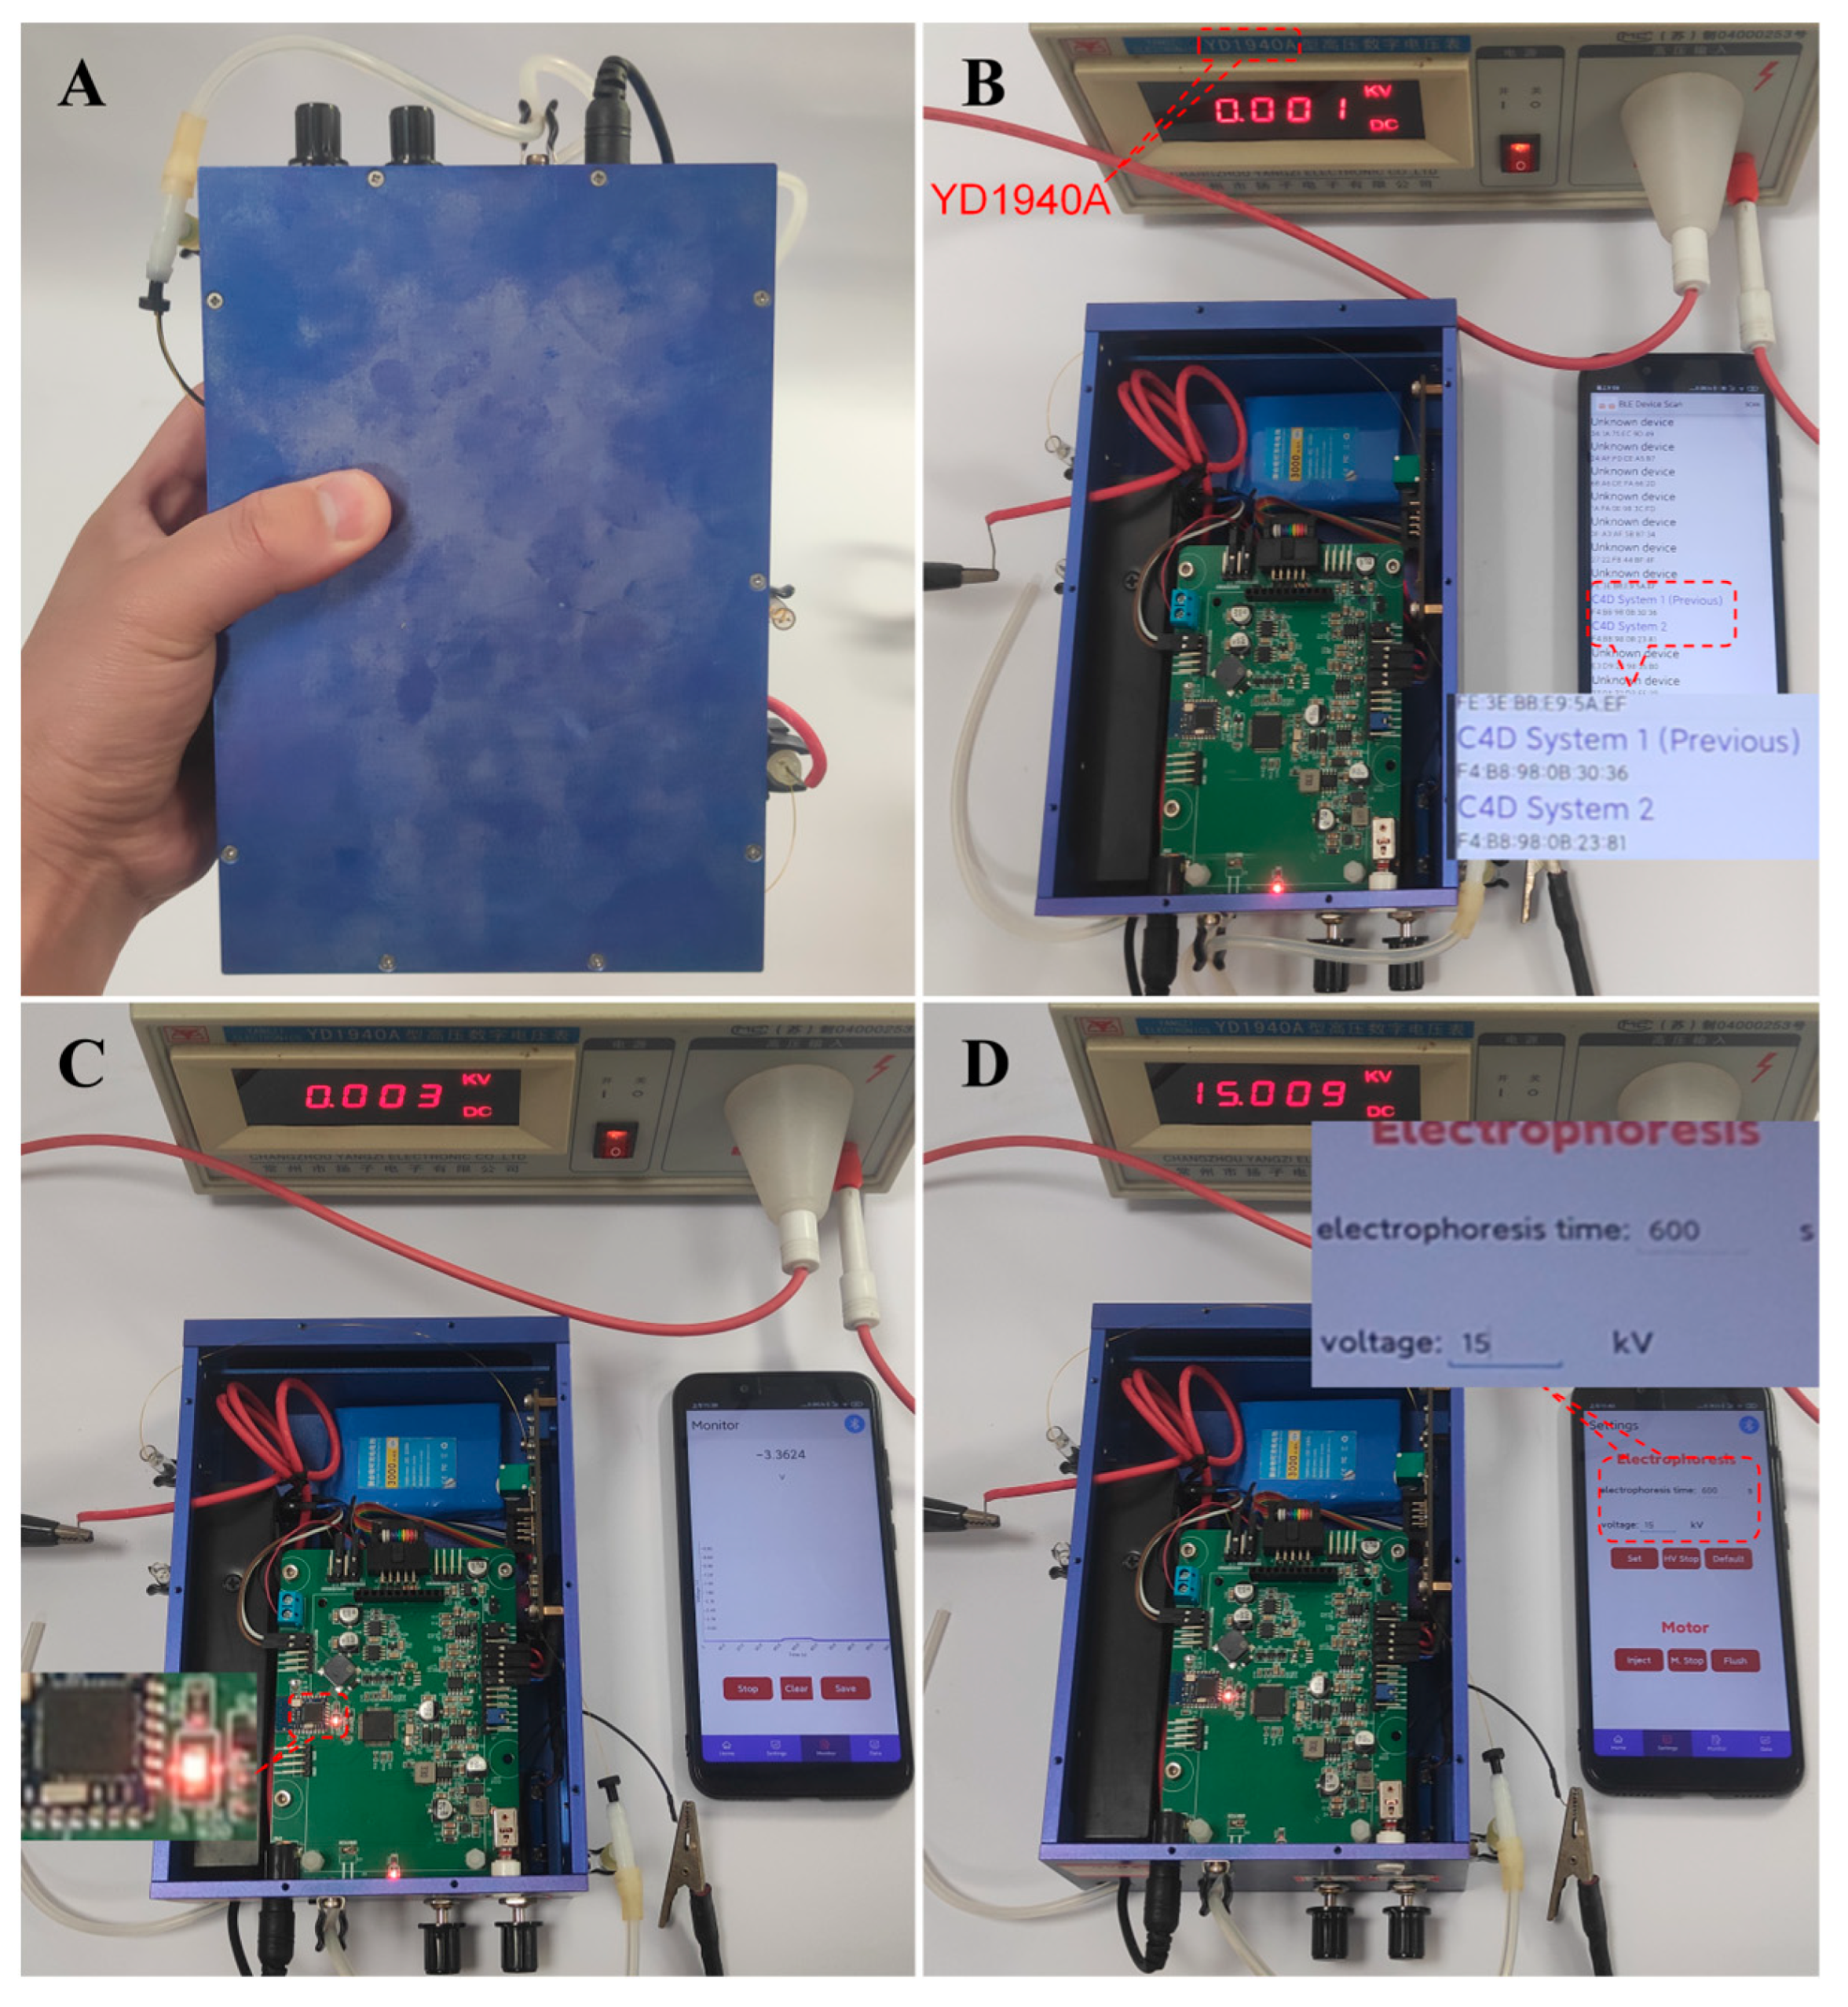
2.2. Fabrication of CE-C4D Device
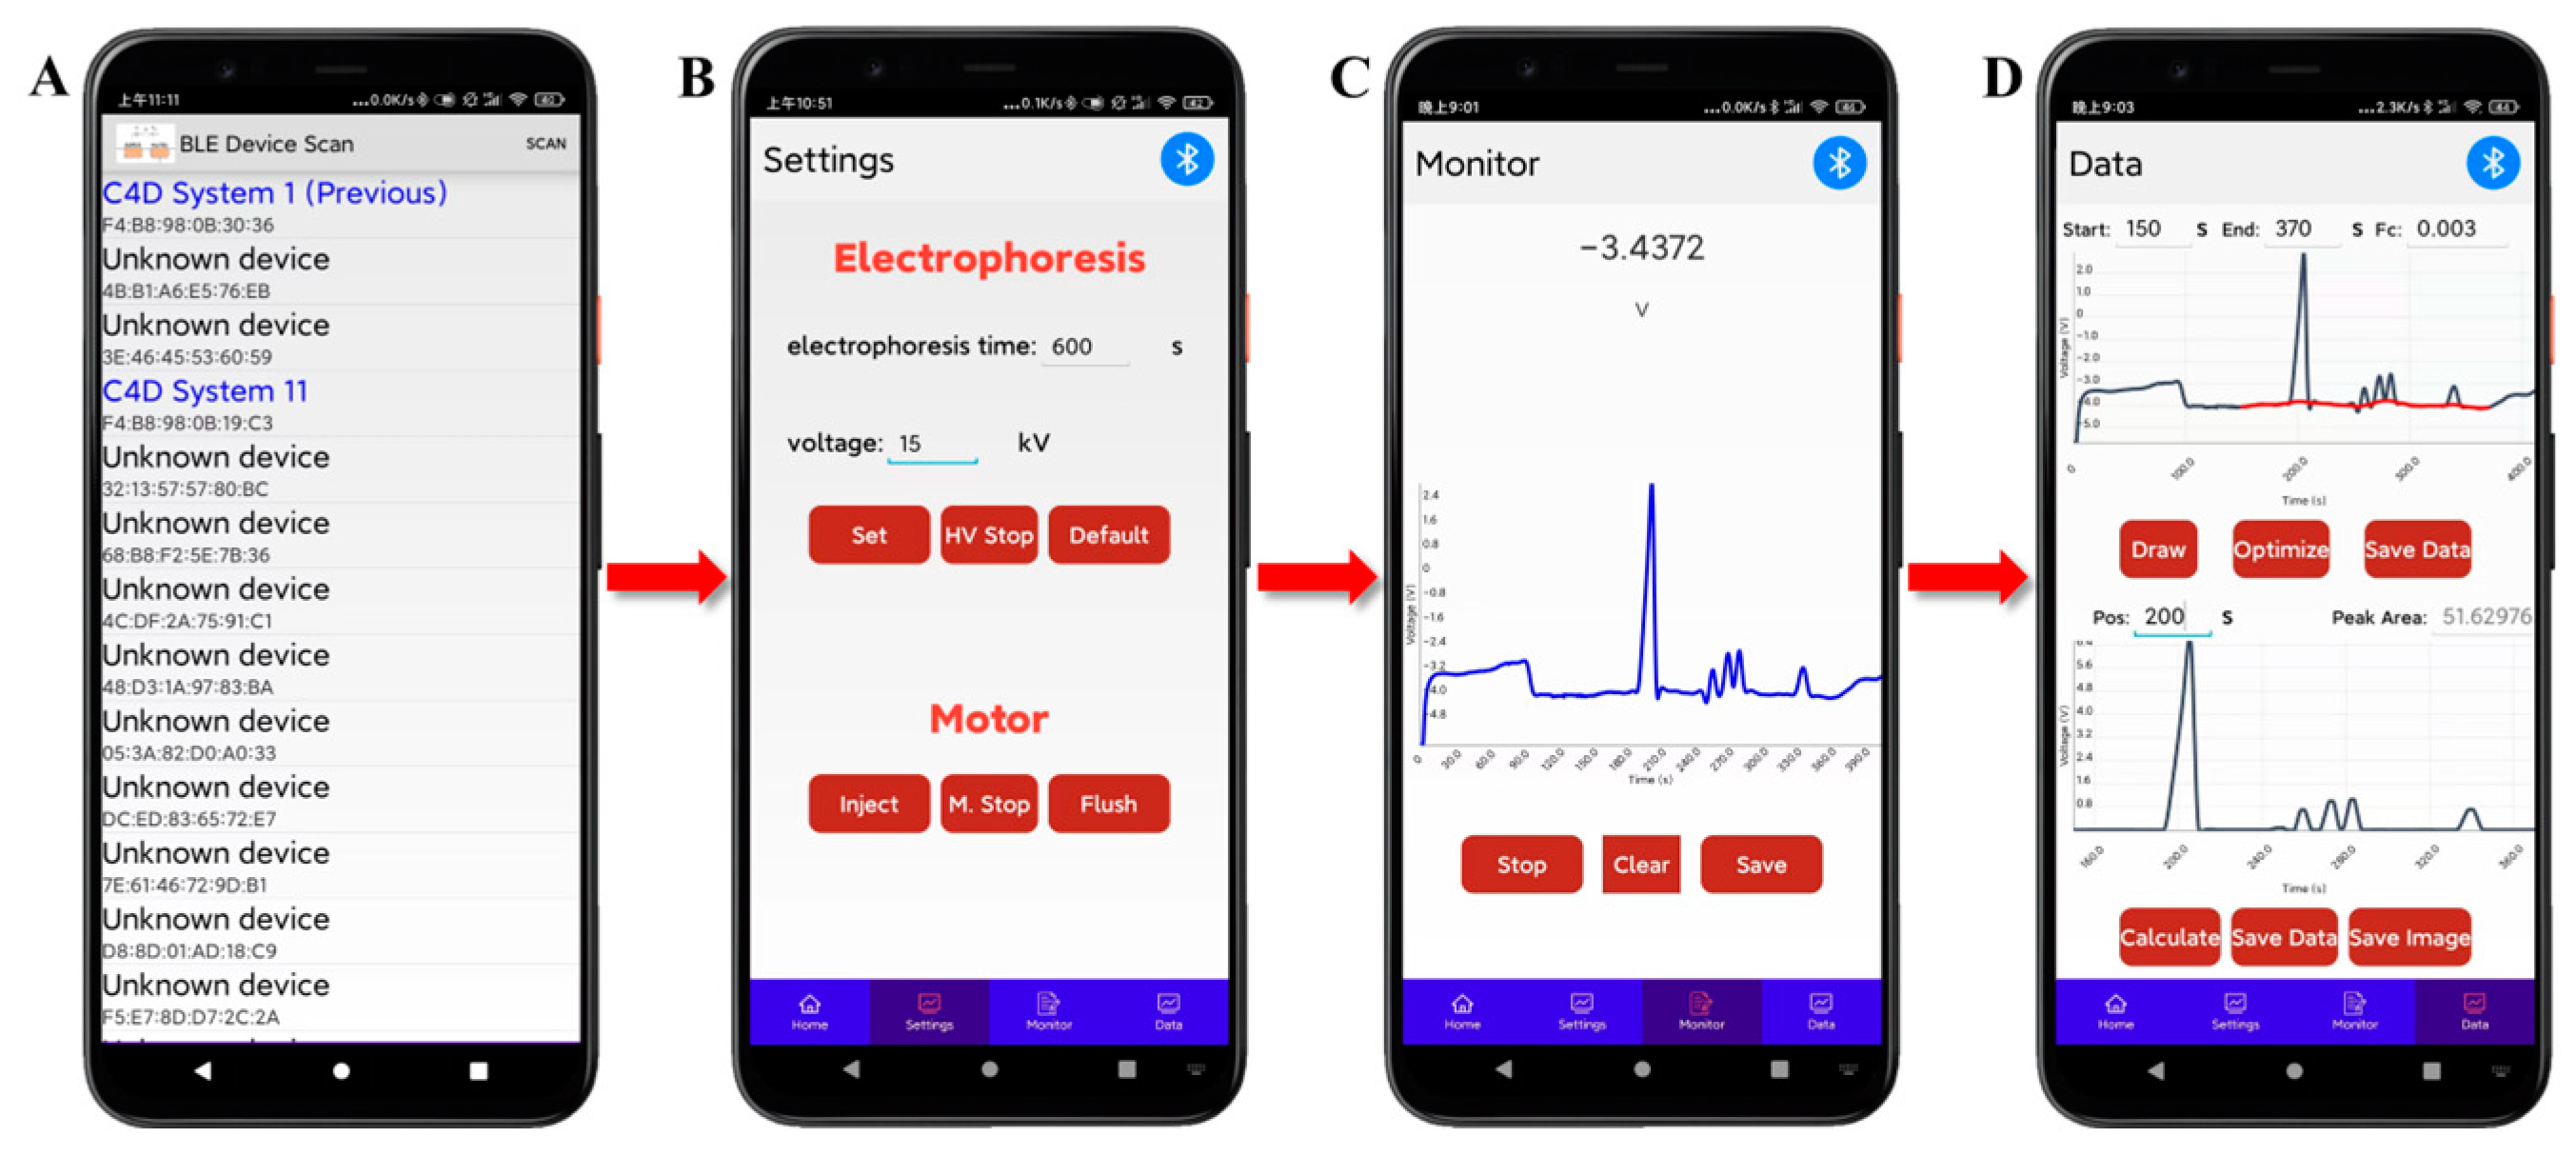
2.3. Phone-Based User Software
3. Materials and Methods
3.1. Instruments
3.2. Chemicals
3.3. Procedure of CE-C4D
4. Results and Discussion
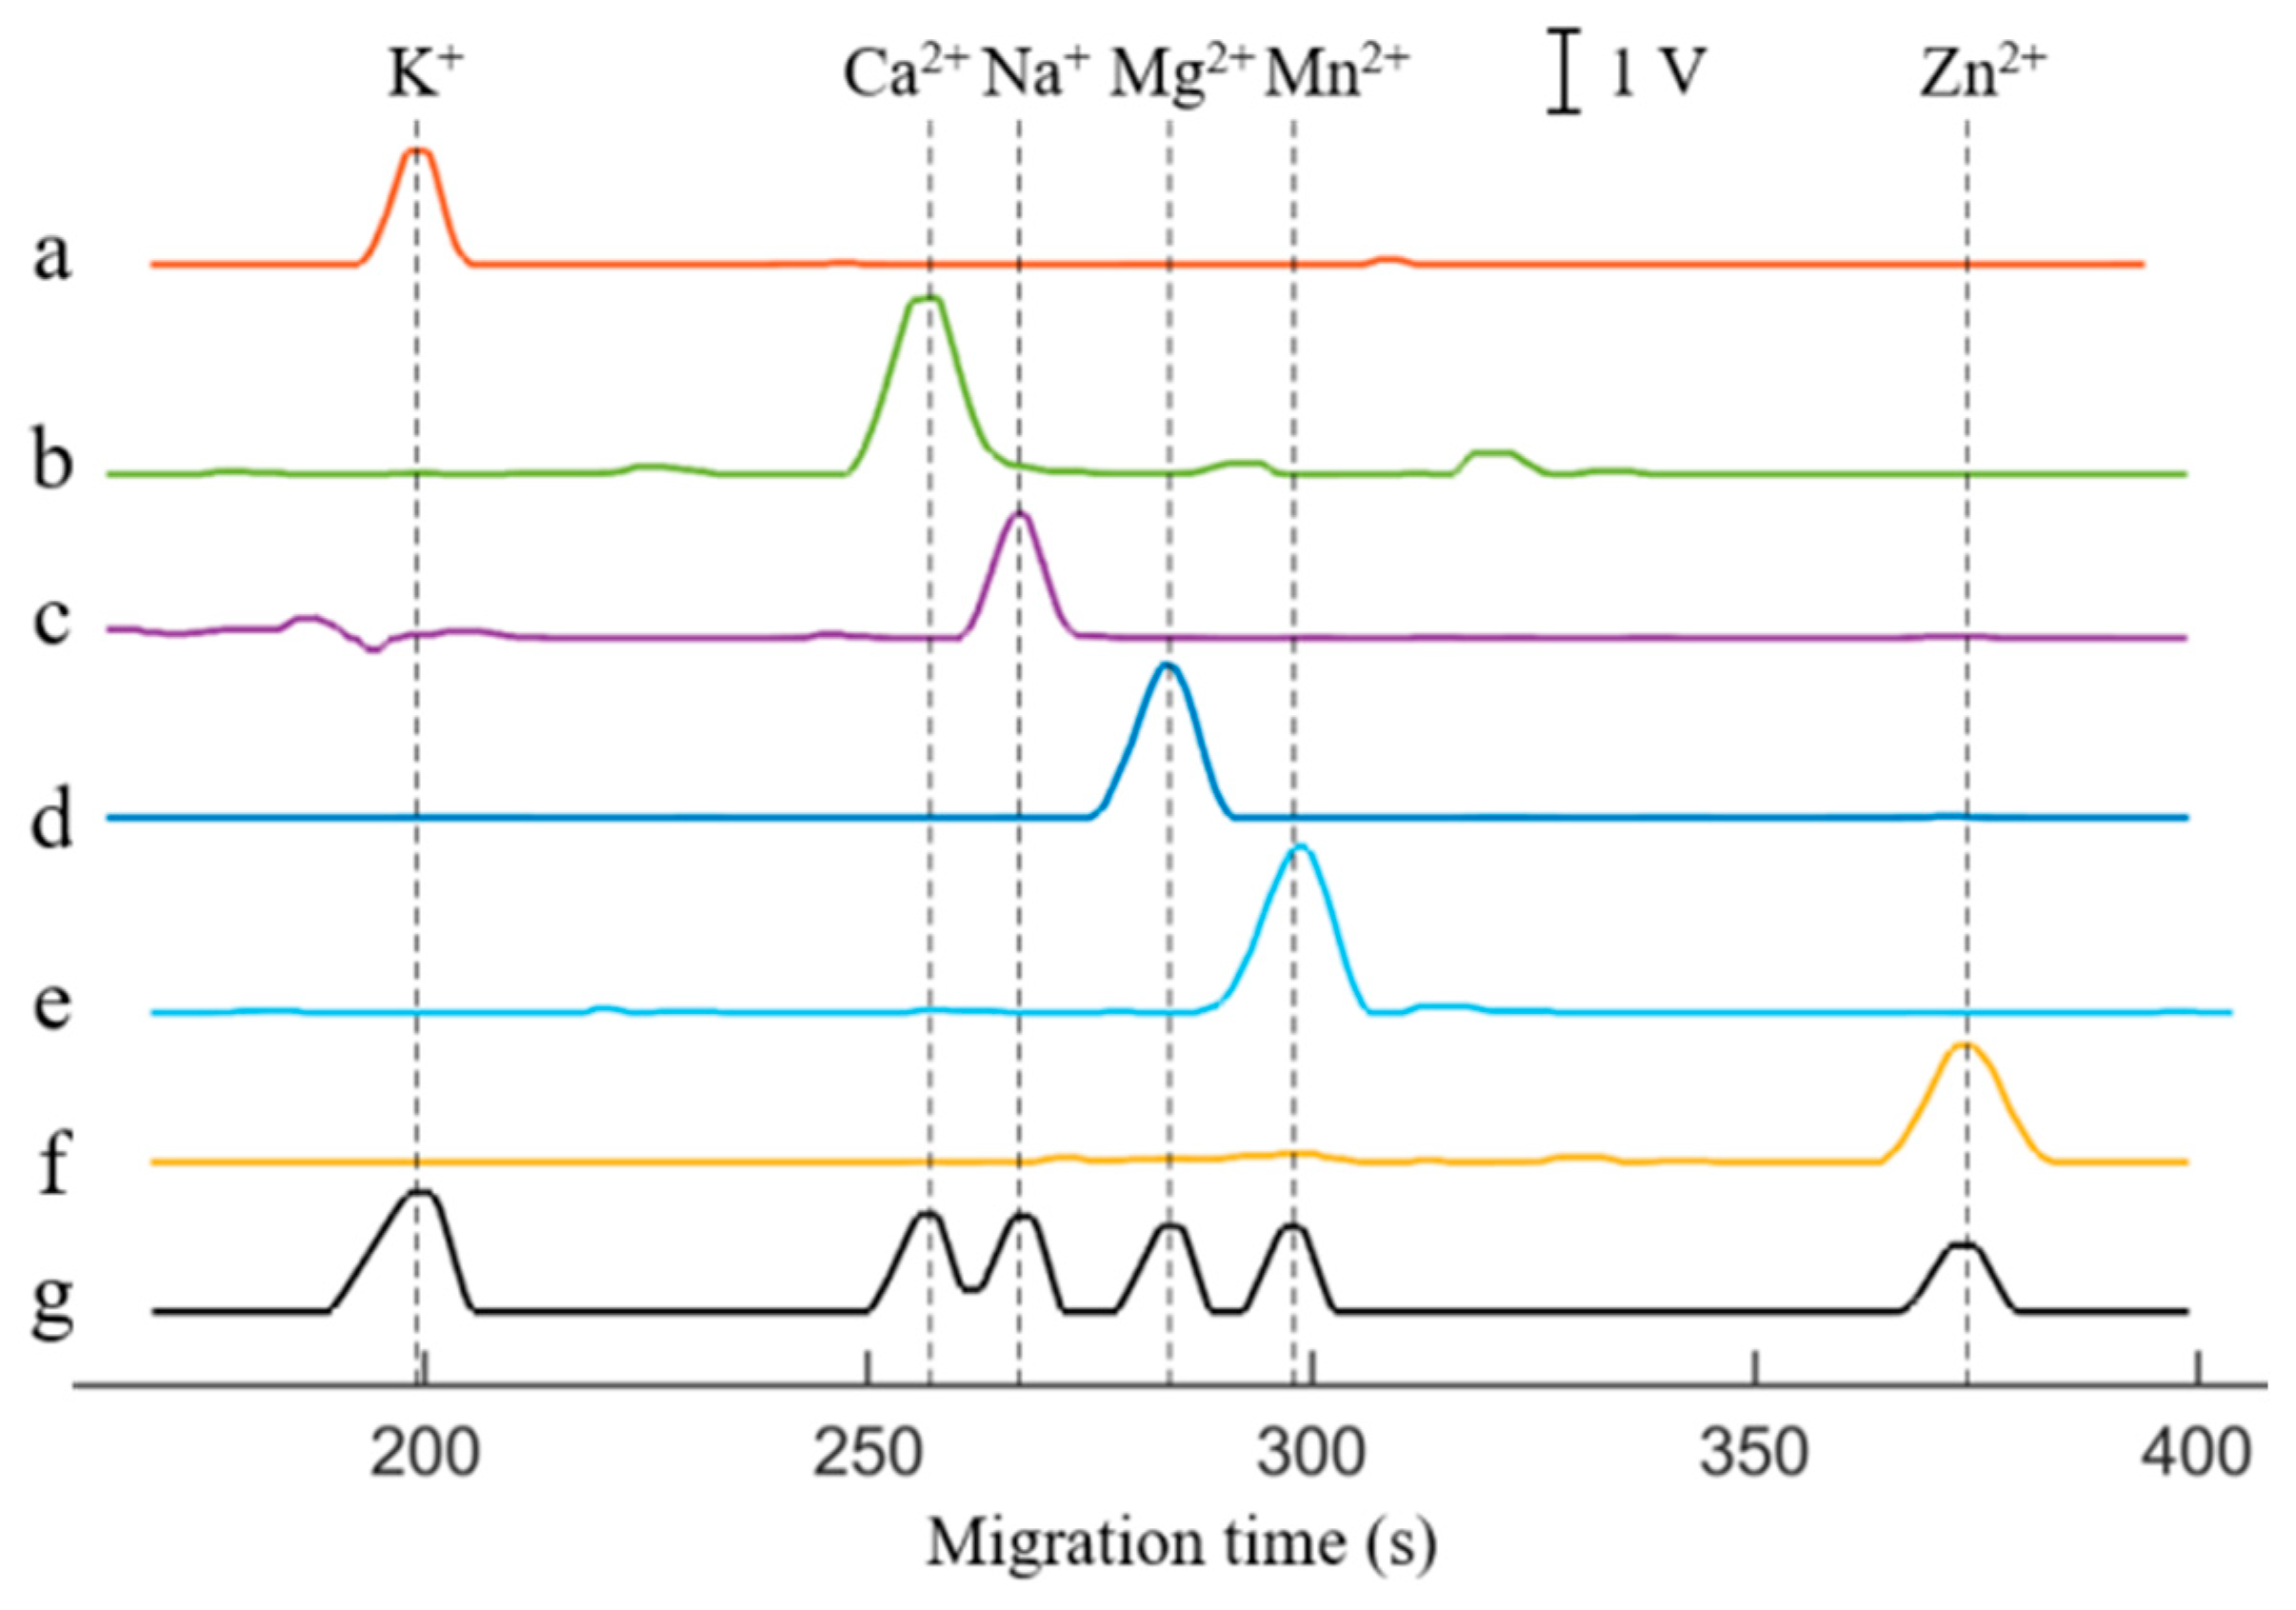
4.1. Feasibility of Smartphone-Based CE-C4D
4.2. Analytical Performance
4.3. Application
4.4. Merits and Disadvantages
5. Conclusions
Supplementary Materials
Author Contributions
Funding
Institutional Review Board Statement
Informed Consent Statement
Data Availability Statement
Conflicts of Interest
References
- Van Schepdael, A.V. Capillary Electrophoresis as a Simple and Low-Cost Analytical Tool for Use in Money-Constrained Situations. TrAC Trends Anal. Chem. 2023, 160, 116992. [Google Scholar] [CrossRef]
- Saar-Reismaa, P.; Erme, E.; Vaher, M.; Kulp, M.; Kaljurand, M.; Mazina-Šinkar, J. In Situ Determination of Illegal Drugs in Oral Fluid by Portable Capillary Electrophoresis with Deep UV Excited Fluorescence Detection. Anal. Chem. 2018, 90, 6253–6258. [Google Scholar] [CrossRef] [PubMed]
- Pan, J.-Z.; Fang, P.; Fang, X.-X.; Hu, T.-T.; Fang, J.; Fang, Q. A Low-Cost Palmtop High-Speed Capillary Electrophoresis Bioanalyzer with Laser Induced Fluorescence Detection. Sci. Rep. 2018, 8, 1791. [Google Scholar] [CrossRef]
- Saar-Reismaa, P.; Brilla, C.-A.; Leiman, K.; Kaljurand, M.; Vaher, M.; Kulp, M.; Mazina-Šinkar, J. Use of a Newly-Developed Portable Capillary Electrophoresis Analyser to Detect Drugs of Abuse in Oral Fluid: A Case Study. Talanta 2020, 211, 120662. [Google Scholar] [CrossRef] [PubMed]
- Zhang, M.; Smejkal, P.; Bester, N.; Robertson, J.C.; Atia, M.A.; Townsend, A.T.; Guijt, R.M.; Breadmore, M.C. Inexpensive Portable Capillary Electrophoresis Instrument for Monitoring Zinc(II) in Remote Areas. J. Chromatogr. A 2022, 1668, 462895. [Google Scholar] [CrossRef]
- Kaljurand, M.; Mazina-Šinkar, J. Portable Capillary Electrophoresis as a Green Analytical Technology. TrAC Trends Anal. Chem. 2022, 157, 116811. [Google Scholar] [CrossRef]
- Xiao, R.; Lu, L.; Rong, Z.; Wang, C.; Peng, Y.; Wang, F.; Wang, J.; Sun, M.; Dong, J.; Wang, D.; et al. Portable and Multiplexed Lateral Flow Immunoassay Reader Based on SERS for Highly Sensitive Point-of-Care Testing. Biosens. Bioelectron. 2020, 168, 112524. [Google Scholar] [CrossRef]
- Tran, V.; Walkenfort, B.; König, M.; Salehi, M.; Schlücker, S. Rapid, Quantitative, and Ultrasensitive Point-of-Care Testing: A Portable SERS Reader for Lateral Flow Assays in Clinical Chemistry. Angew. Chem. Int. Ed. 2018, 58, 442–446. [Google Scholar] [CrossRef]
- Hassantabar, F.; Zorriehzahra, M.J.; Firouzbakhsh, F.; Thompson, K.D. Development and Evaluation of Colloidal Gold Immunochromatography Test Strip for Rapid Diagnosis of Nervous Necrosis Virus in Golden Grey Mullet (Chelon aurata). J. Fish Dis. 2021, 44, 783–791. [Google Scholar] [CrossRef]
- Raziq, A.; Kidakova, A.; Boroznjak, R.; Reut, J.; Öpik, A.; Syritski, V. Development of a Portable MIP-Based Electrochemical Sensor for Detection of SARS-CoV-2 Antigen. Biosens. Bioelectron. 2021, 178, 113029. [Google Scholar] [CrossRef]
- Correia, R.M.; Andrade, R.; Tosato, F.; Nascimento, M.T.; Pereira, L.L.; Araújo, J.B.S.; Pinto, F.E.; Endringer, D.C.; Padovan, M.P.; Castro, E.V.R.; et al. Analysis of Robusta Coffee Cultivated in Agroforestry Systems (AFS) by ESI-FT-ICR MS and Portable NIR Associated with Sensory Analysis. J. Food Compos. Anal. 2020, 94, 103637. [Google Scholar] [CrossRef]
- Deidda, R.; Sacre, P.-Y.; Clavaud, M.; Coïc, L.; Avohou, H.; Hubert, P.; Ziemons, E. Vibrational Spectroscopy in Analysis of Pharmaceuticals: Critical Review of Innovative Portable and Handheld NIR and Raman Spectrophotometers. TrAC Trends Anal. Chem. 2019, 114, 251–259. [Google Scholar] [CrossRef]
- Hara, R.; Ishigaki, M.; Kitahama, Y.; Ozaki, Y.; Genkawa, T. Use of the Product of Mean Intensity Ratio (PMIR) Technique for Discriminant Analysis of Lycopene-Rich Vegetable Juice Using a Portable NIR-Excited Raman Spectrometer. Food Chem. 2018, 241, 353–357. [Google Scholar] [CrossRef]
- Wang, C.; Zhang, Q.; Liu, X.; Li, G.; Kong, H.; Khan, M.I.; Xiao, H.; Wang, Y.; Liu, W.; Cao, C. Double Inner Standard Plot Model of an Electrophoresis Titration Chip for a Portable and Green Assay of Protein Content in Milk. Lab A Chip 2019, 19, 484–492. [Google Scholar] [CrossRef]
- Chen, L.; Zhang, Q.; Liu, W.; Xiao, H.; Liu, X.; Fan, L.; Wang, Y.; Li, H.; Cao, C. A Facile Thermometer-like Electrophoresis Titration Biosensor for Alternative miRNA Assay via Moving Reaction Boundary Chip. Biosens. Bioelectron. 2021, 171, 112676. [Google Scholar] [CrossRef]
- Poboży, E.; Trojanowicz, M. Application of Capillary Electrophoresis for Determination of Inorganic Analytes in Waters. Molecules 2021, 26, 6972. [Google Scholar] [CrossRef] [PubMed]
- Kubáň, P.; Hauser, P.C. Fundamental Aspects of Contactless Conductivity Detection for Capillary Electrophoresis. Part I: Frequency Behavior and Cell Geometry. Electrophoresis 2004, 25, 3387–3397. [Google Scholar] [CrossRef]
- Kubáň, P.; Hauser, P.C. Fundamental Aspects of Contactless Conductivity Detection for Capillary Electrophoresis. Part II: Signal-to-noise Ratio and Stray Capacitance. Electrophoresis 2004, 25, 3398–3405. [Google Scholar] [CrossRef]
- Brito-Neto, J.G.A.; Fracassi da Silva, J.A.; Blanes, L.; do Lago, C.L. Understanding Capacitively Coupled Contactless Conductivity Detection in Capillary and Microchip Electrophoresis. Part 1. Fundamentals. Electroanalysis 2005, 17, 1198–1206. [Google Scholar] [CrossRef]
- Kappes, T.; Galliker, B.; Schwarz, M.A.; Hauser, P.C. Portable Capillary Electrophoresis Instrument with Amperometric, Potentiometric and Conductometric Detection. TrAC Trends Anal. Chem. 2001, 20, 133–139. [Google Scholar] [CrossRef]
- Kubáň, P.; Nguyen, H.T.A.; Macka, M.; Haddad, P.R.; Hauser, P.C. New Fully Portable Instrument for the Versatile Determination of Cations and Anions by Capillary Electrophoresis with Contactless Conductivity Detection. Electroanalysis 2007, 19, 2059–2065. [Google Scholar] [CrossRef]
- Mai, T.D.; Pham, T.T.T.; Pham, H.V.; Sáiz, J.; Ruiz, C.G.; Hauser, P.C. Portable Capillary Electrophoresis Instrument with Automated Injector and Contactless Conductivity Detection. Anal. Chem. 2013, 85, 2333–2339. [Google Scholar] [CrossRef] [PubMed]
- Kobrin, E.; Lees, H.; Fomitšenko, M.; Kubáň, P.; Kaljurand, M. Fingerprinting Postblast Explosive Residues by Portable Capillary Electrophoresis with Contactless Conductivity Detection. Electrophoresis 2014, 35, 1165–1172. [Google Scholar] [CrossRef] [PubMed]
- Nguyen, T.A.H.; Pham, T.N.M.; Doan, T.T.; Ta, T.T.; Sáiz, J.; Nguyen, T.Q.H.; Hauser, P.C.; Mai, T.D. Simple Semi-Automated Portable Capillary Electrophoresis Instrument with Contactless Conductivity Detection for the Determination of β-Agonists in Pharmaceutical and Pig-Feed Samples. J. Chromatogr. A 2014, 1360, 305–311. [Google Scholar] [CrossRef]
- Greguš, M.; Foret, F.; Kubáň, P. Portable Capillary Electrophoresis Instrument with Contactless Conductivity Detection for On-Site Analysis of Small Volumes of Biological Fluids. J. Chromatogr. A 2016, 1427, 177–185. [Google Scholar] [CrossRef]
- Koenka, I.J.; Küng, N.; Kubáň, P.; Chwalek, T.; Furrer, G.; Wehrli, B.; Müller, B.; Hauser, P.C. Thermostatted Dual-channel Portable Capillary Electrophoresis Instrument. Electrophoresis 2016, 37, 2368–2375. [Google Scholar] [CrossRef]
- Opekar, F.; Tůma, P. Dual-Channel Capillary Electrophoresis for Simultaneous Determination of Cations and Anions. J. Chromatogr. A 2016, 1446, 158–163. [Google Scholar] [CrossRef]
- Fuiko, R.; Saracevic, E.; Koenka, I.J.; Hauser, P.C.; Krampe, J. Capillary Electrophoresis for Continuous Nitrogen Quantification in Wastewater Treatment Processes. Talanta 2019, 195, 366–371. [Google Scholar] [CrossRef]
- Li, L.; Song, Y.-P.; Ren, D.-D.; Li, T.-X.; Gao, M.-H.; Zhou, L.; Zeng, Z.-C.; Pu, Q. A Compact and High-Performance Setup of Capillary Electrophoresis with Capacitively Coupled Contactless Conductivity Detection (CE-C4D). Analyst 2024, 149, 3034–3040. [Google Scholar] [CrossRef]
- Kanakasabapathy, M.K.; Pandya, H.J.; Draz, M.S.; Chug, M.K.; Sadasivam, M.; Kumar, S.; Etemad, B.; Yogesh, V.; Safavieh, M.; Asghar, W.; et al. Rapid, Label-Free CD4 Testing Using a Smartphone Compatible Device. Lab A Chip 2017, 17, 2910–2919. [Google Scholar] [CrossRef]
- Calabretta, M.M.; Álvarez-Diduk, R.; Michelini, E.; Roda, A.; Merkoçi, A. Nano-Lantern on Paper for Smartphone-Based ATP Detection. Biosens. Bioelectron. 2020, 150, 111902. [Google Scholar] [CrossRef] [PubMed]
- Nie, Y.; Zhang, X.; Zhang, Q.; Liang, Z.; Ma, Q.; Su, X. A Novel High Efficient Electrochemiluminescence Sensor Based on Reductive Cu(I) Particles Catalyzed Zn-Doped MoS2 QDs for HPV 16 DNA Determination. Biosens. Bioelectron. 2020, 160, 112217. [Google Scholar] [CrossRef] [PubMed]
- Xu, Z.; Liu, Z.; Xiao, M.; Jiang, L.; Yi, C. A Smartphone-Based Quantitative Point-of-Care Testing (POCT) System for Simultaneous Detection of Multiple Heavy Metal Ions. Chem. Eng. J. 2020, 394, 124966. [Google Scholar] [CrossRef]
- Zheng, J.; Zhu, M.; Kong, J.; Li, Z.; Jiang, J.; Xi, Y.; Li, F. Microfluidic Paper-Based Analytical Device by Using Pt Nanoparticles as Highly Active Peroxidase Mimic for Simultaneous Detection of Glucose and Uric Acid with Use of a Smartphone. Talanta 2022, 237, 122954. [Google Scholar] [CrossRef]
- Fiore, L.; De Lellis, B.; Mazzaracchio, V.; Suprun, E.; Massoud, R.; Goffredo, B.M.; Moscone, D.; Arduini, F. Smartphone-Assisted Electrochemical Sensor for Reliable Detection of Tyrosine in Serum. Talanta 2022, 237, 122869. [Google Scholar] [CrossRef]
- Yu, K.; Li, M.; Chai, H.; Liu, Q.; Hai, X.; Tian, M.; Qu, L.; Xu, T.; Zhang, G.; Zhang, X. MOF-818 Nanozyme-Based Colorimetric and Electrochemical Dual-Mode Smartphone Sensing Platform for in Situ Detection of H2O2 and H2S Released from Living Cells. Chem. Eng. J. 2023, 451, 138321. [Google Scholar] [CrossRef]
- Liu, W.; Liang, Z.; Wang, Y.; Cao, J.; Zhang, Q.; Liu, X.; Wang, Y.; Cao, C. A Facile Online Multi-Gear Capacitively Coupled Contactless Conductivity Detector for an Automatic and Wide Range Monitoring of High Salt in HPLC. Analyst 2022, 147, 496–504. [Google Scholar] [CrossRef]
- Ning, X.; Selesnick, I.W.; Duval, L. Chromatogram Baseline Estimation and Denoising Using Sparsity (BEADS). Chemom. Intell. Lab. Syst. 2014, 139, 156–167. [Google Scholar] [CrossRef]
- Tang, M.; Xu, J.; Xu, Z. Simultaneous Determination of Metal Ions by Capillary Electrophoresis with Contactless Conductivity Detection and Insights into the Effects of BGE Component. Microchem. J. 2019, 147, 857–862. [Google Scholar] [CrossRef]


| Ions | Regression Equation | R2 | Linear Range (μmol/L) | LOD (μmol/L) |
|---|---|---|---|---|
| K+ | y = 0.1958 × x + 1.5112 | 0.9995 | 6–800 | 1.9 |
| Ca2+ | y = 0.3742 × x + 21.602 | 0.9934 | 6–1000 | 1.8 |
| Na+ | y = 0.2081 × x + 4.4588 | 0.9953 | 10–1000 | 3.3 |
| Mg2+ | y = 0.3261 × x + 4.7685 | 0.9989 | 10–1000 | 2.7 |
| Mn2+ | y = 0.1868 × x + 5.5635 | 0.9990 | 12–1500 | 3.6 |
| Zn2+ | y = 0.1845 × x + 0.6490 | 0.9982 | 15–1500 | 4.3 |
| Ions | RSD of Intra-Day (%) (n = 5) | RSD of Inter-Day (%) (n = 5) | ||
|---|---|---|---|---|
| Migration Time | Area | Migration Time | Area | |
| K+ | 2.40 | 2.53 | 4.68 | 3.34 |
| Ca2+ | 5.24 | 1.38 | 5.53 | 1.87 |
| Na+ | 4.96 | 0.75 | 5.34 | 1.02 |
| Mg2+ | 3.05 | 2.03 | 4.52 | 2.69 |
| Mn2+ | 3.83 | 2.70 | 5.22 | 4.15 |
| Zn2+ | 3.54 | 2.82 | 4.17 | 3.03 |
| Ions | Developed CE-C4D | IC (Table S1) | Recovery | |
|---|---|---|---|---|
| Peak Area | Detected (μmol/L) | Detected (μmol/L) | ||
| K+ | 6.1634 | 23.76 | 18.53 | 128% |
| Ca2+ | 70.9018 | 131.75 | 127.30 | 103% |
| Na+ | 57.9601 | 257.09 | 241.41 | 106% |
| Mg2+ | 19.8852 | 46.36 | 48.76 | 95% |
| Devices | Size (mm3) | Weight (kg) | Phone Based | LOD (μmol/L) | RSD (MT) | RSD (PA) | Recovery (%) | Analytes | Ref. |
|---|---|---|---|---|---|---|---|---|---|
| CE-C4D prototype | 340 × 175 × 175 | 7.5 | No | 0.7–5.6 | - | - | - | Inorganic ions, organic acids | [20] |
| New portable CE-C4D | 310 × 220 × 260 | - | No | 0.2–1.0 | - | 0.82–6.9 | - | Inorganic cations and anions | [21] |
| Suitcase CE-C4D | 450 × 350 × 150 | 8 | No | 1.5–17.0 | 0.6–2.4 | 93–116 | Inorganic cations and anions | [22] | |
| Purpose-built CE-C4D | 270 × 246 × 124 | - | No | 3.7–35.7 | 0.3–0.6 | 3.6–9.9 | - | Inorganic cations and anions | [23] |
| semi-auto CE-C4D | 400 × 280 × 210 | 6 | No | 2.1–3.4 a | 0.8–0.9 | 4.1–6.2 | 86.6–113.9 | β-agonists | [24] |
| Portable CE-C4D | 200 × 330 × 170 | <5 | No | 0.04–0.36 | 0.42–1.06 | 2.85–5.05 | - | Inorganic and organic anions | [25] |
| Dual channel CE | 520 × 340 × 180 | <15 | No | 2.8–18 | - | 6.3–11.6 | - | Inorganic cations and anions | [26] |
| On-board CE | 200 × 250 b | - | No | 6.9–10.6 | 1.5–3.5 | 2.0–5.2 | 95.2–114.5 | Inorganic cations and anions | [27] |
| SIA-CE-C4D c | 19 inch rack | - | No | 0.5–3.4 | 0.43–0.96 | 0.52–1.34 | 90–108 | NO2−, NO3−, NH4+ | [28] |
| Compact CE-C4D | 245 × 220 × 95 | - | No | 0.029–0.41 | - | - | 97.1–103.7 | Lanthanide rare-earth ions | [29] |
| Phone-based CE-C4D | 130 × 190 × 70 | 1.4 | Yes | 1.8–4.3 | 2.40–5.53 | 0.75–4.15 | 95–106(K+:128) | Inorganic cations | This work |
Disclaimer/Publisher’s Note: The statements, opinions and data contained in all publications are solely those of the individual author(s) and contributor(s) and not of MDPI and/or the editor(s). MDPI and/or the editor(s) disclaim responsibility for any injury to people or property resulting from any ideas, methods, instructions or products referred to in the content. |
© 2025 by the authors. Licensee MDPI, Basel, Switzerland. This article is an open access article distributed under the terms and conditions of the Creative Commons Attribution (CC BY) license (https://creativecommons.org/licenses/by/4.0/).
Share and Cite
Tao, Z.; Zhang, Q.; Cao, Y.; Duan, X.; Wu, Y.; Fan, L.; Cao, C.; Liu, W. A Highly Portable Smartphone-Based Capillary Electrophoresis with Capacitively Coupled Contactless Conductivity Detection. Sensors 2025, 25, 2303. https://doi.org/10.3390/s25072303
Tao Z, Zhang Q, Cao Y, Duan X, Wu Y, Fan L, Cao C, Liu W. A Highly Portable Smartphone-Based Capillary Electrophoresis with Capacitively Coupled Contactless Conductivity Detection. Sensors. 2025; 25(7):2303. https://doi.org/10.3390/s25072303
Chicago/Turabian StyleTao, Zhimin, Qiang Zhang, Yiren Cao, Xunjie Duan, Yuyang Wu, Liuyin Fan, Chengxi Cao, and Weiwen Liu. 2025. "A Highly Portable Smartphone-Based Capillary Electrophoresis with Capacitively Coupled Contactless Conductivity Detection" Sensors 25, no. 7: 2303. https://doi.org/10.3390/s25072303
APA StyleTao, Z., Zhang, Q., Cao, Y., Duan, X., Wu, Y., Fan, L., Cao, C., & Liu, W. (2025). A Highly Portable Smartphone-Based Capillary Electrophoresis with Capacitively Coupled Contactless Conductivity Detection. Sensors, 25(7), 2303. https://doi.org/10.3390/s25072303