
Rapid Evaluation Method to Vertical Bearing Capacity of Pile Group Foundation Based on Machine Learning


Abstract
1. Introduction
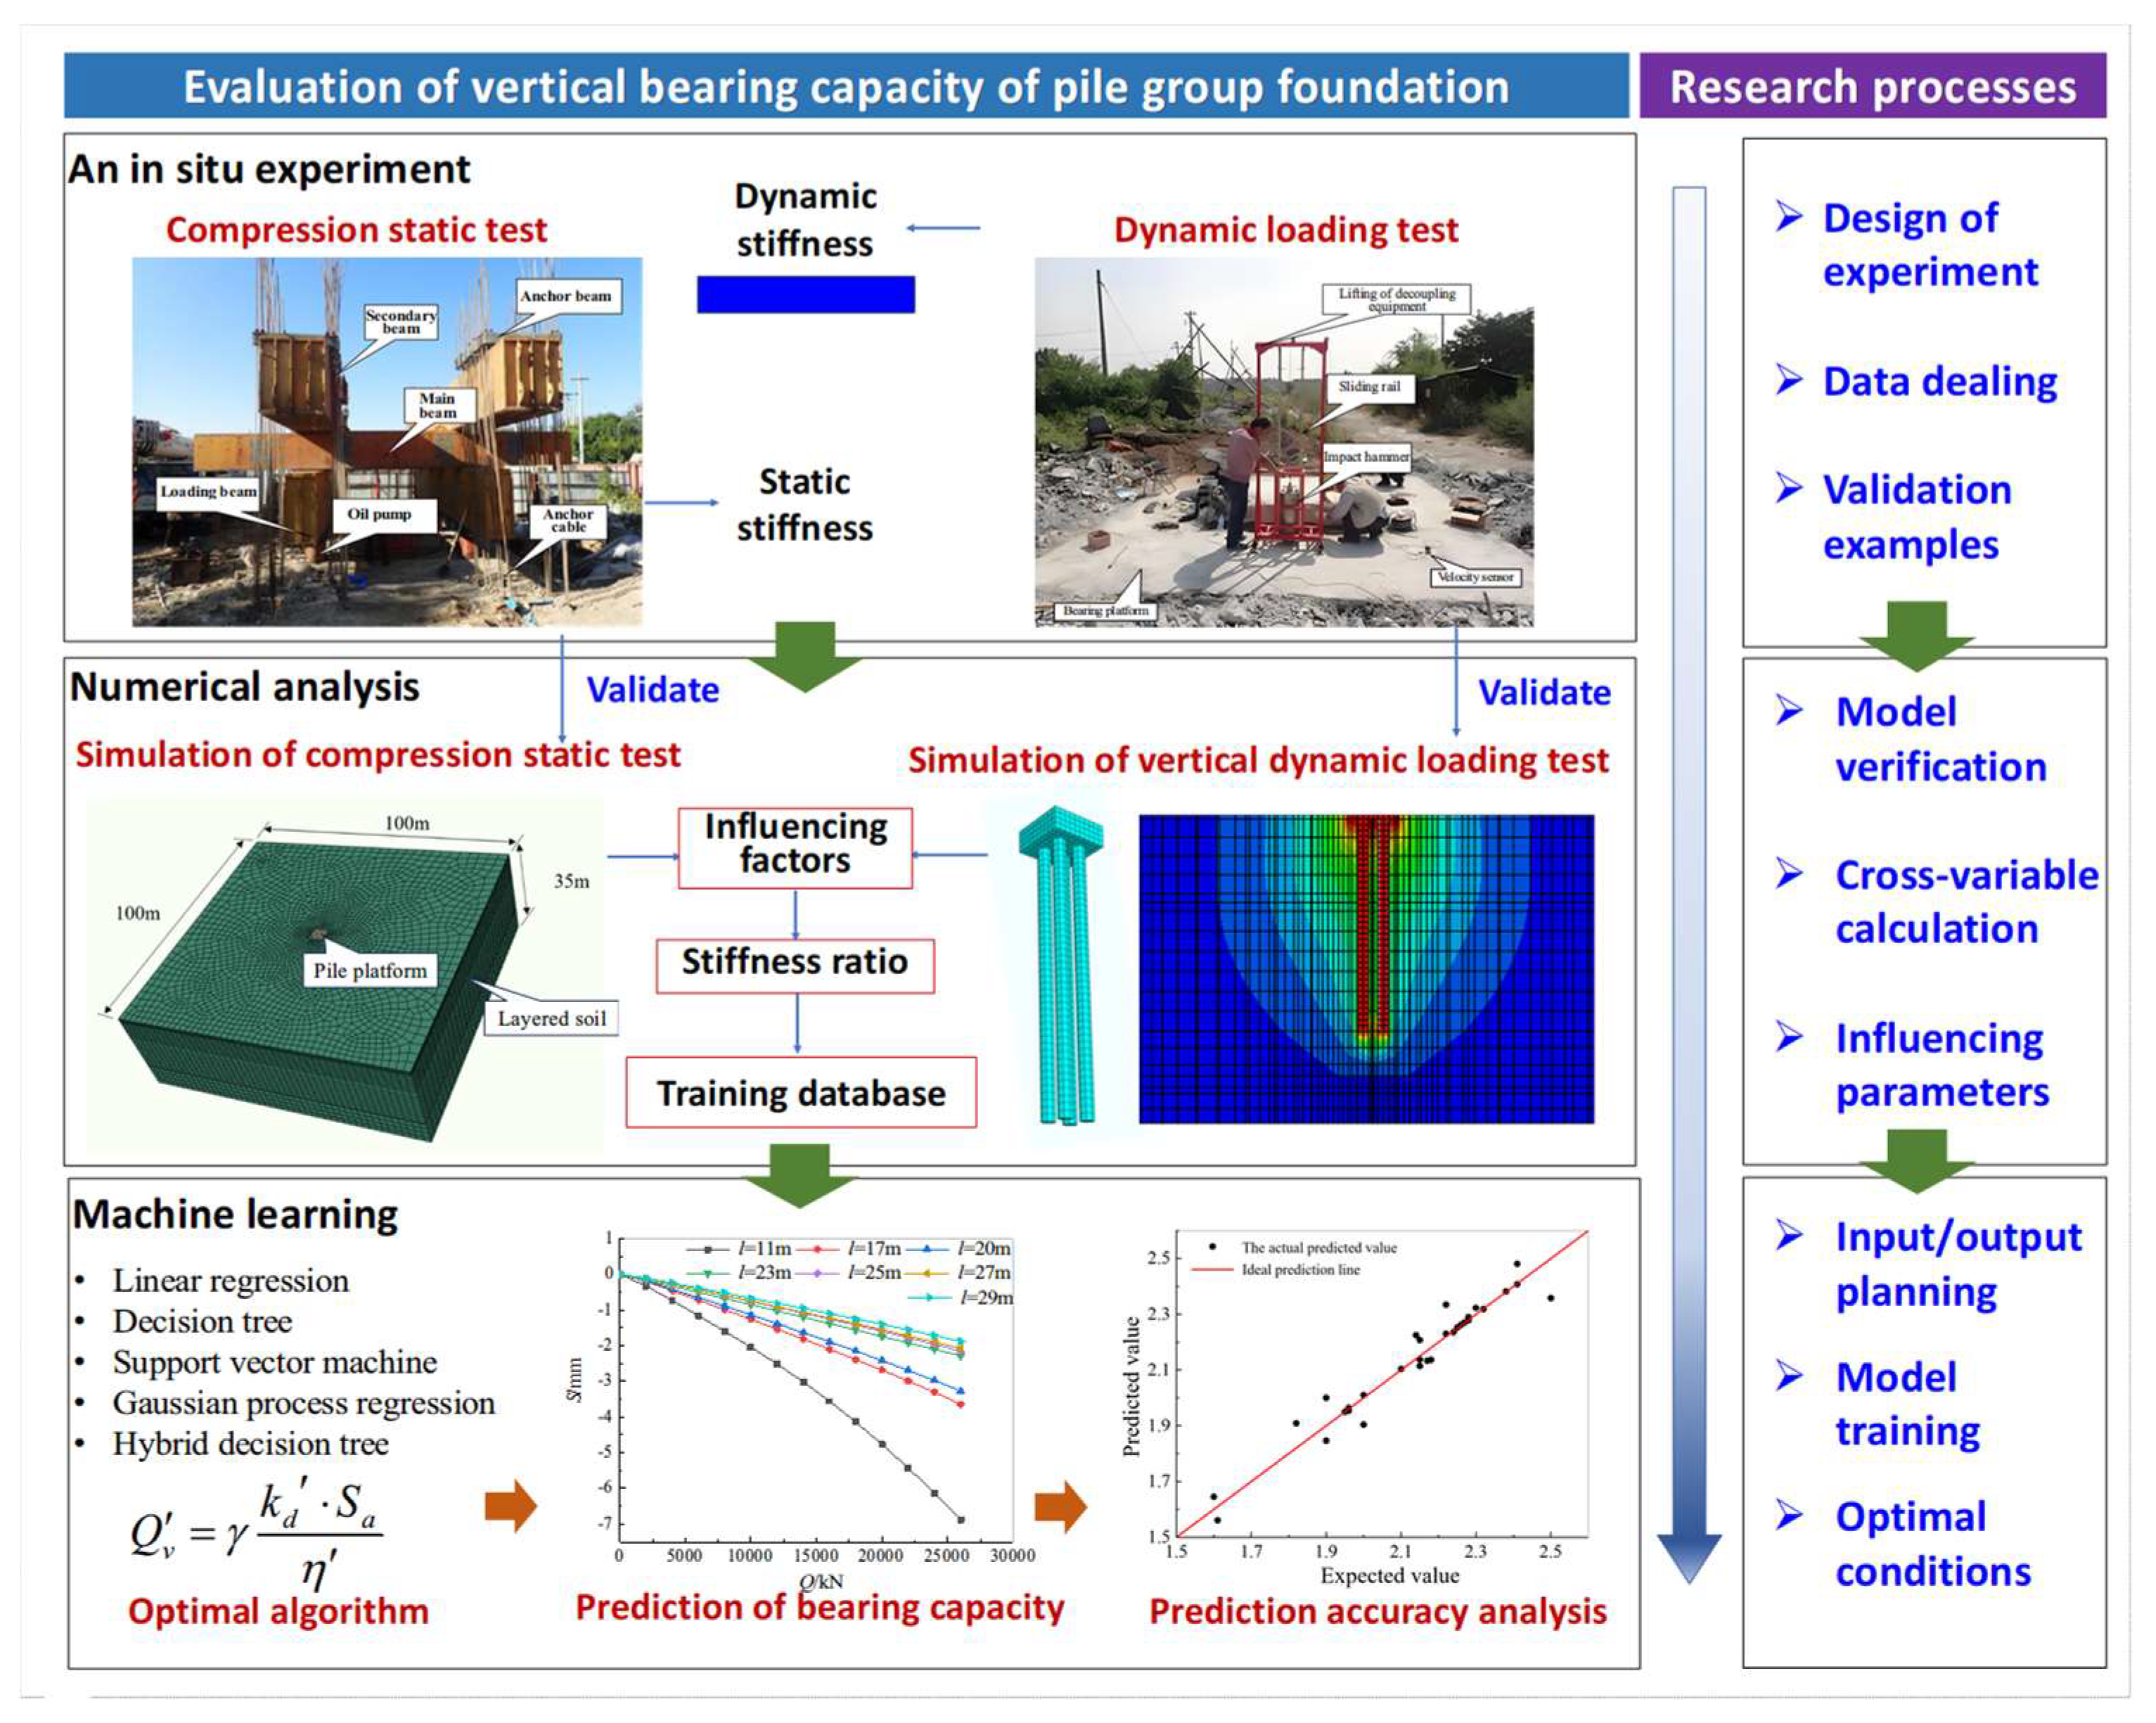
2. Methodology
3. Numerical Simulation and Experimental Verification of Nondestructive Pile Foundation Testing
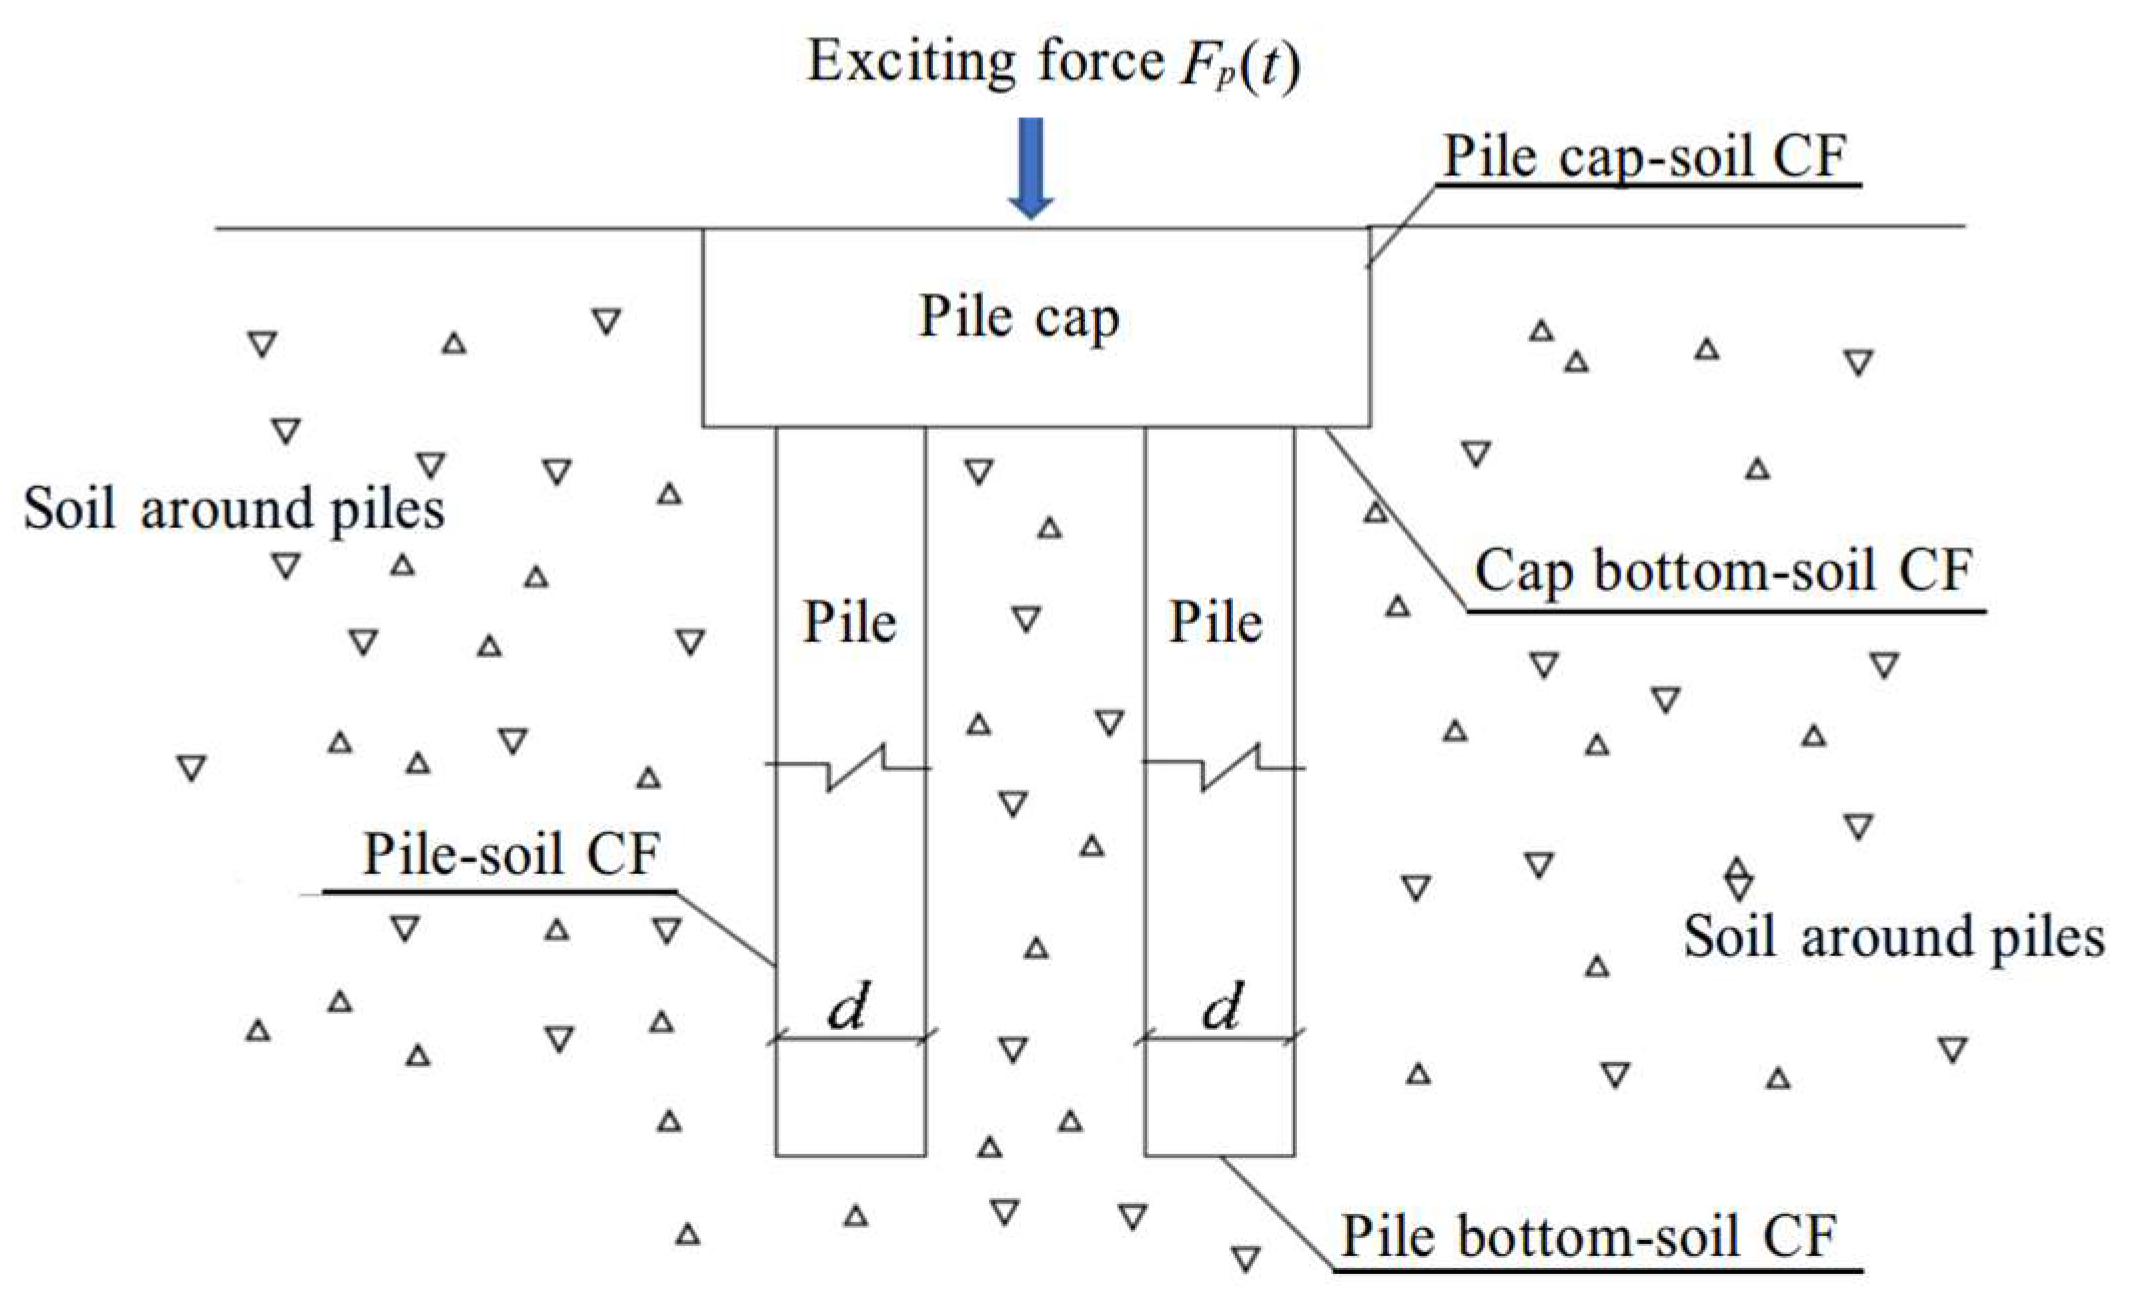
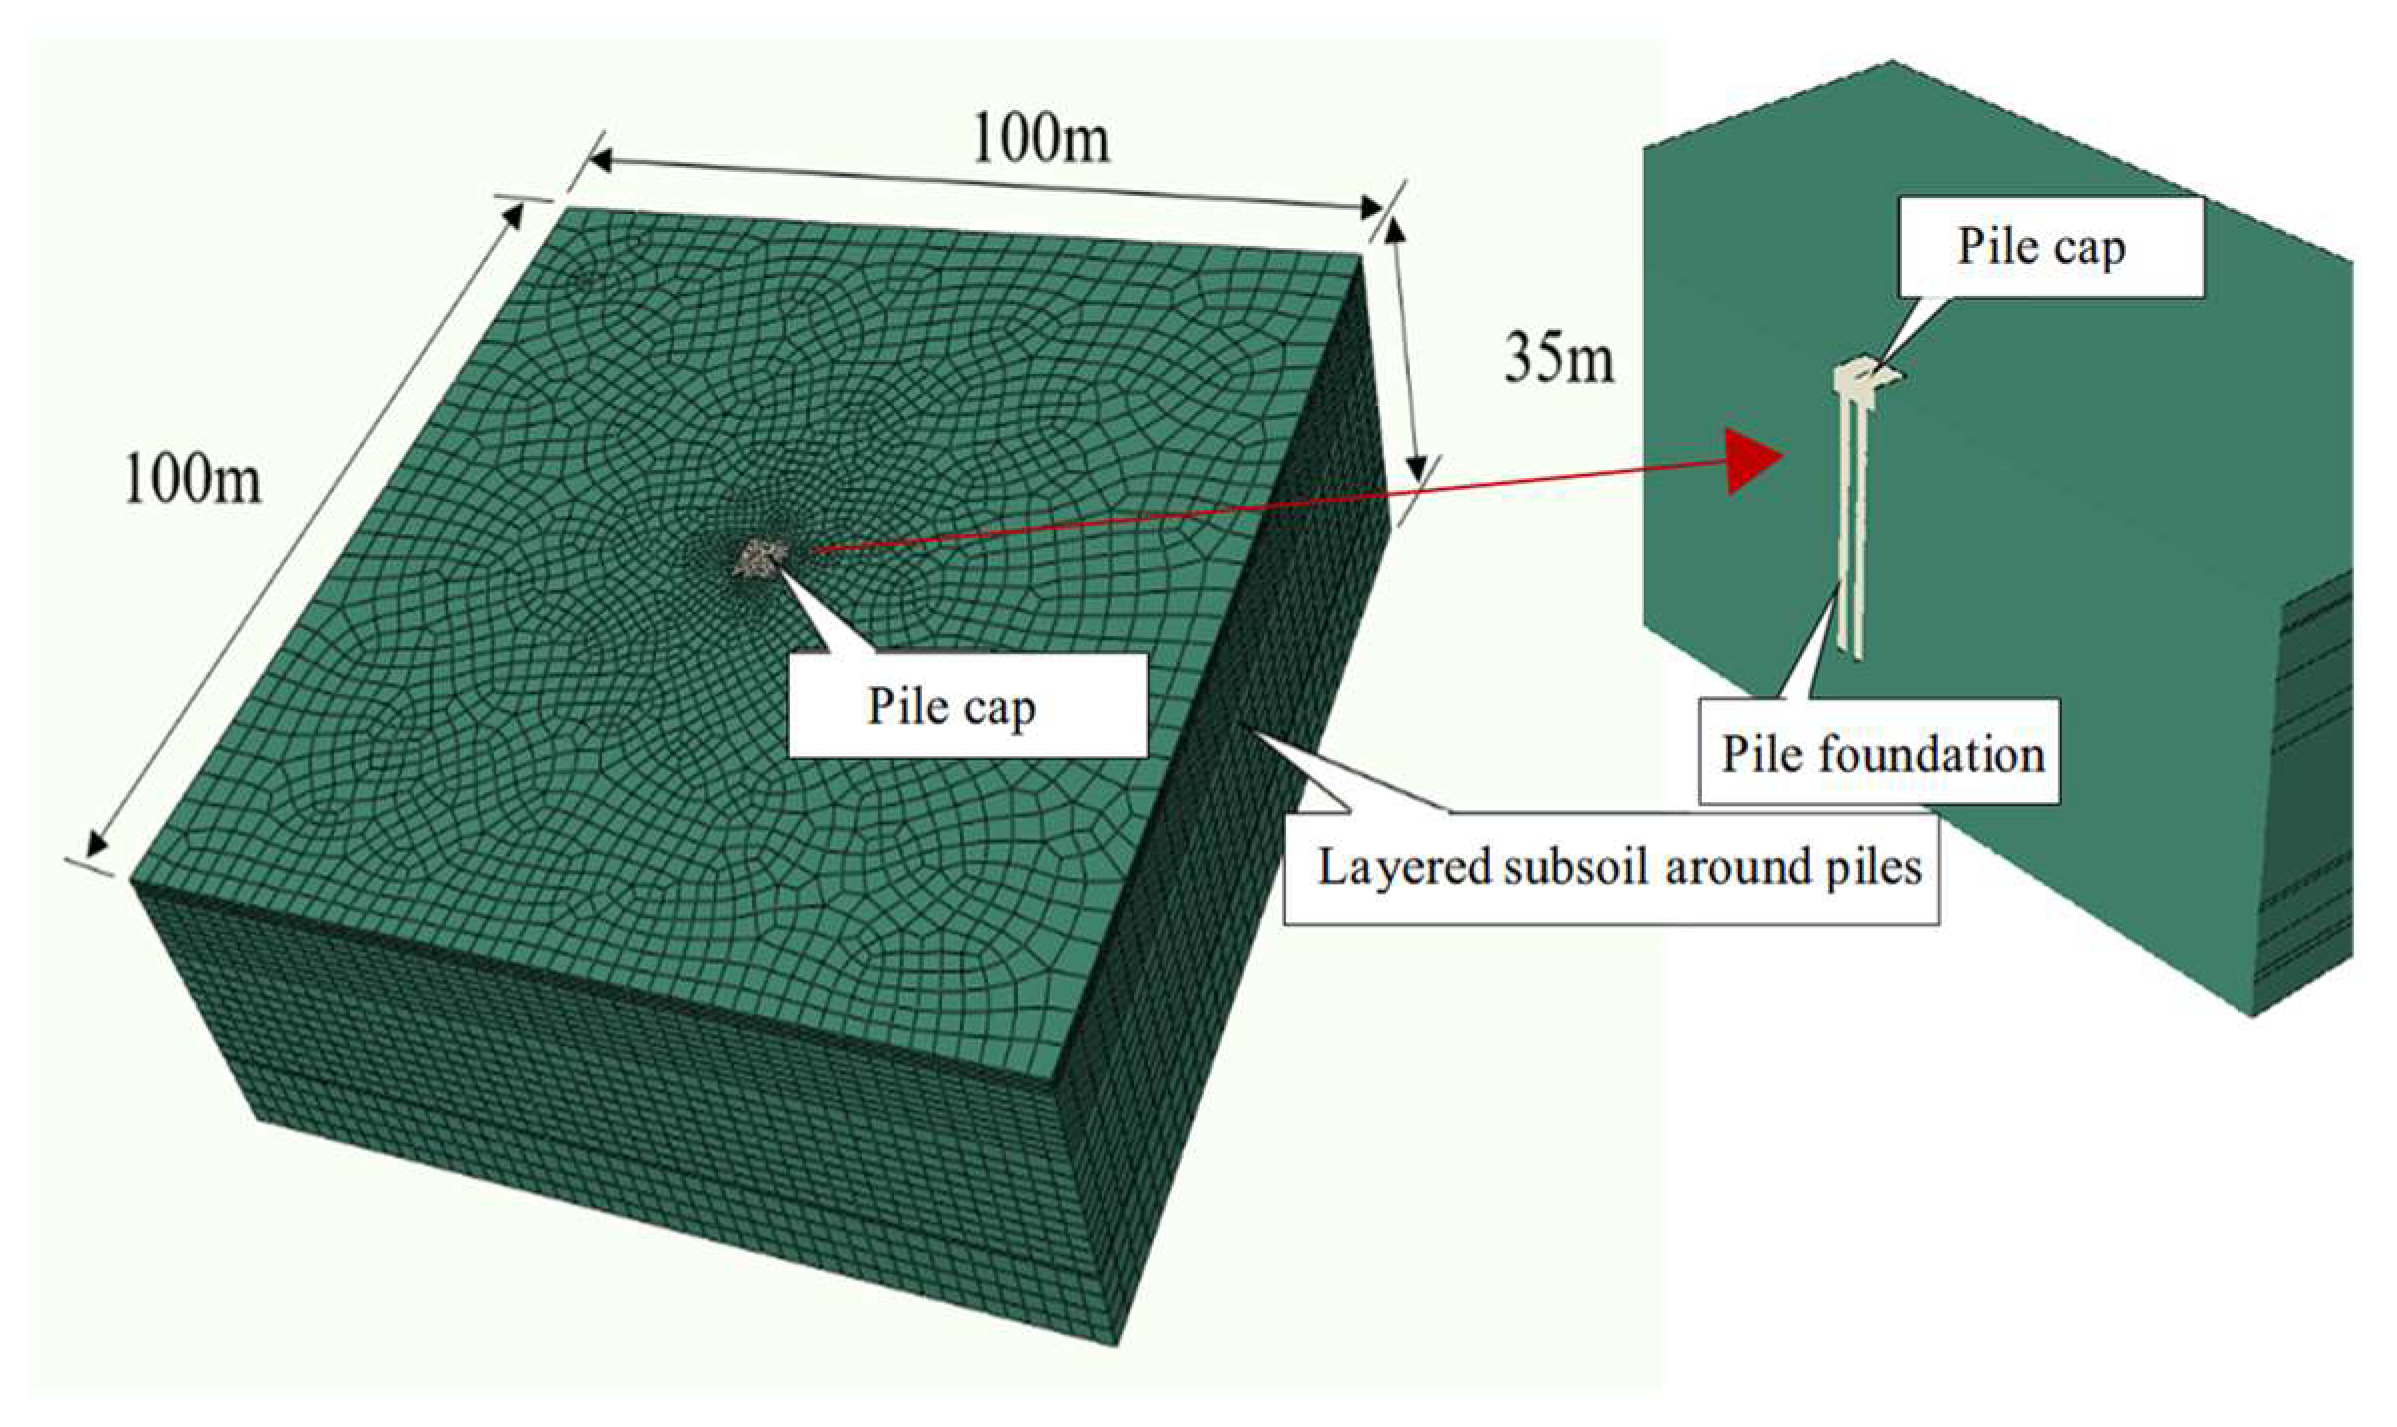
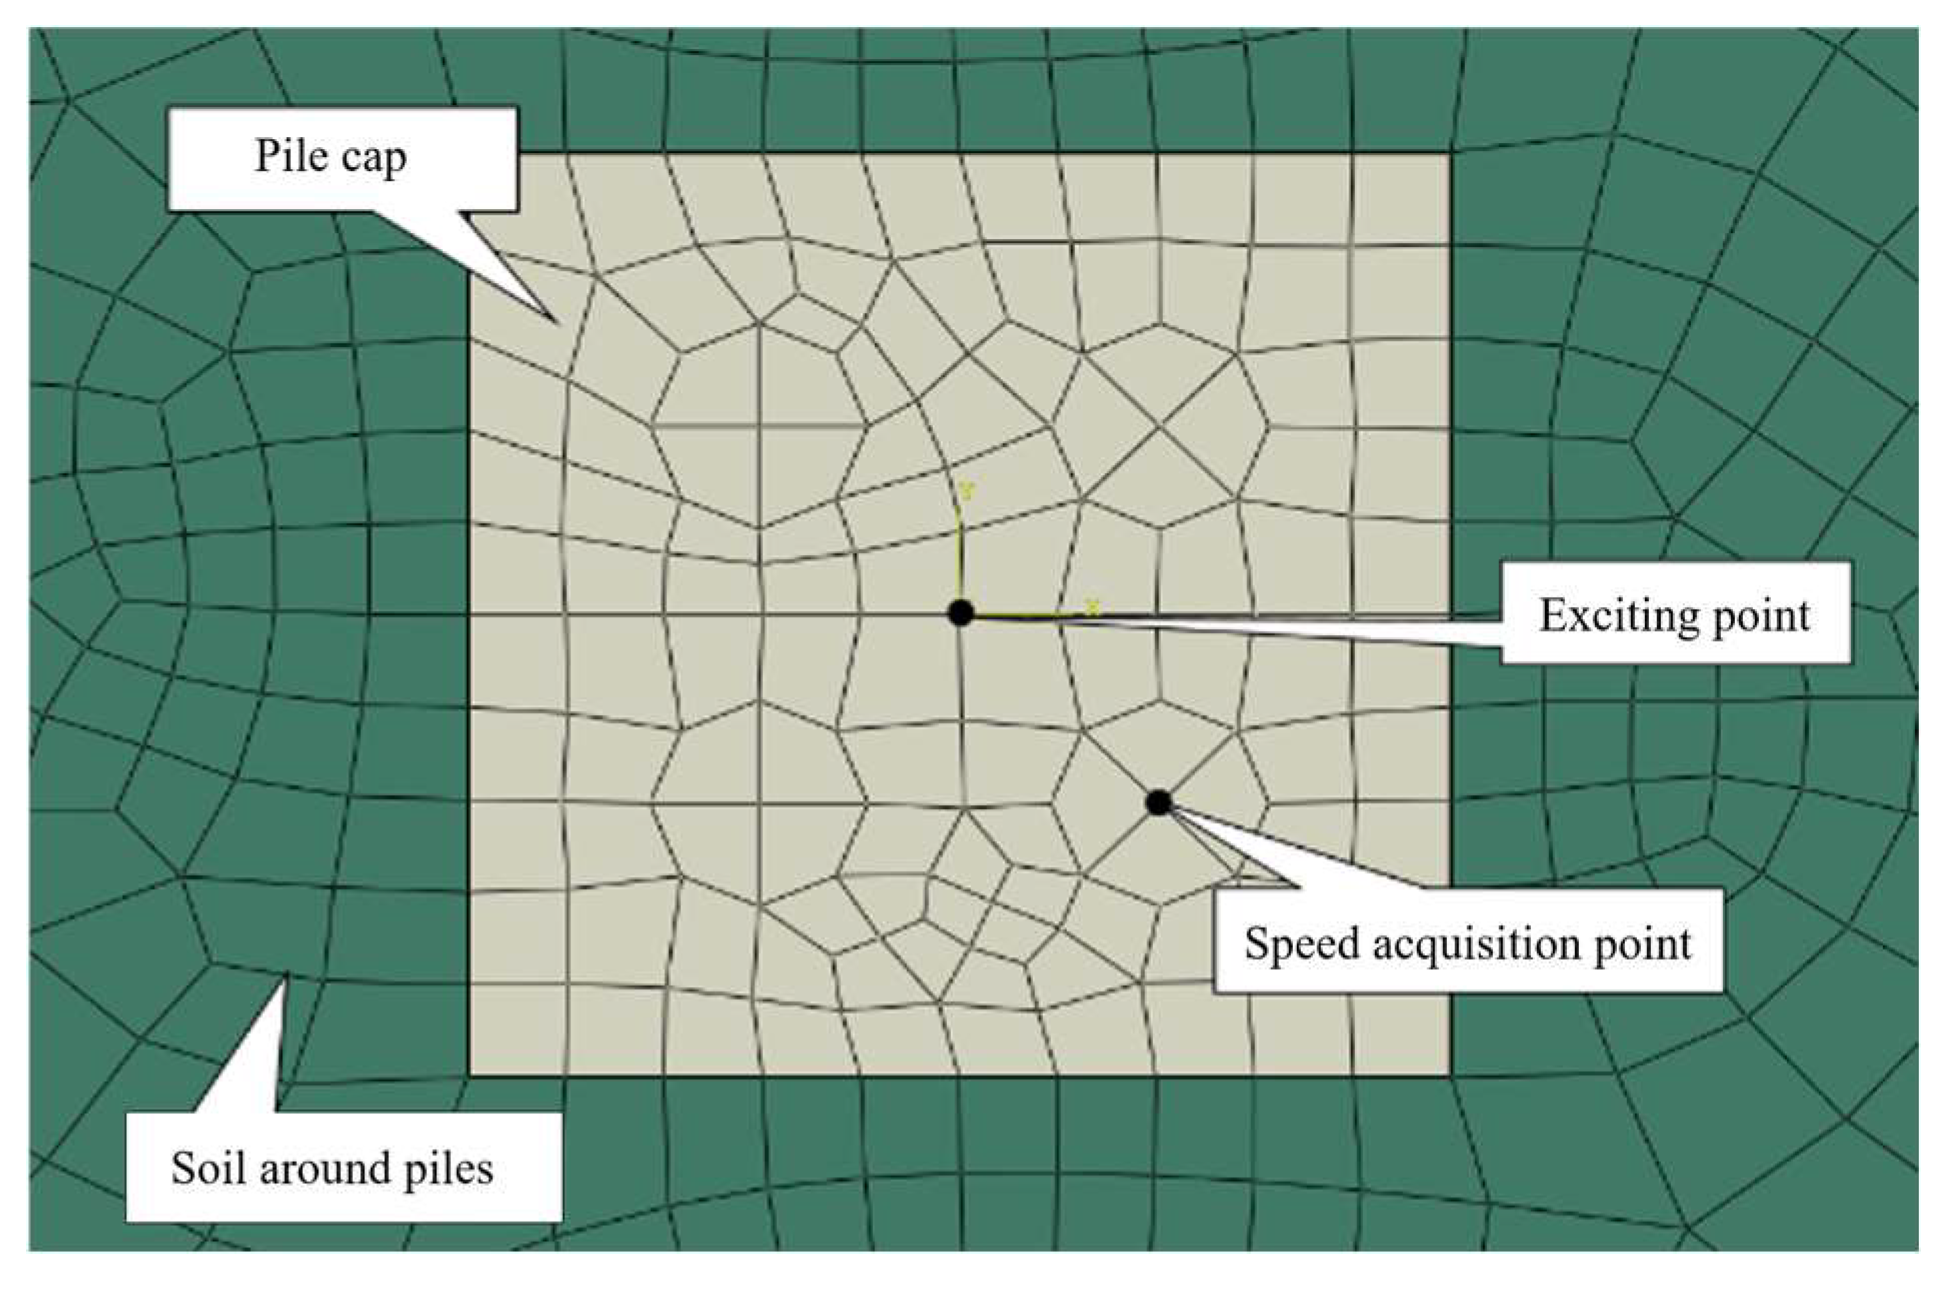
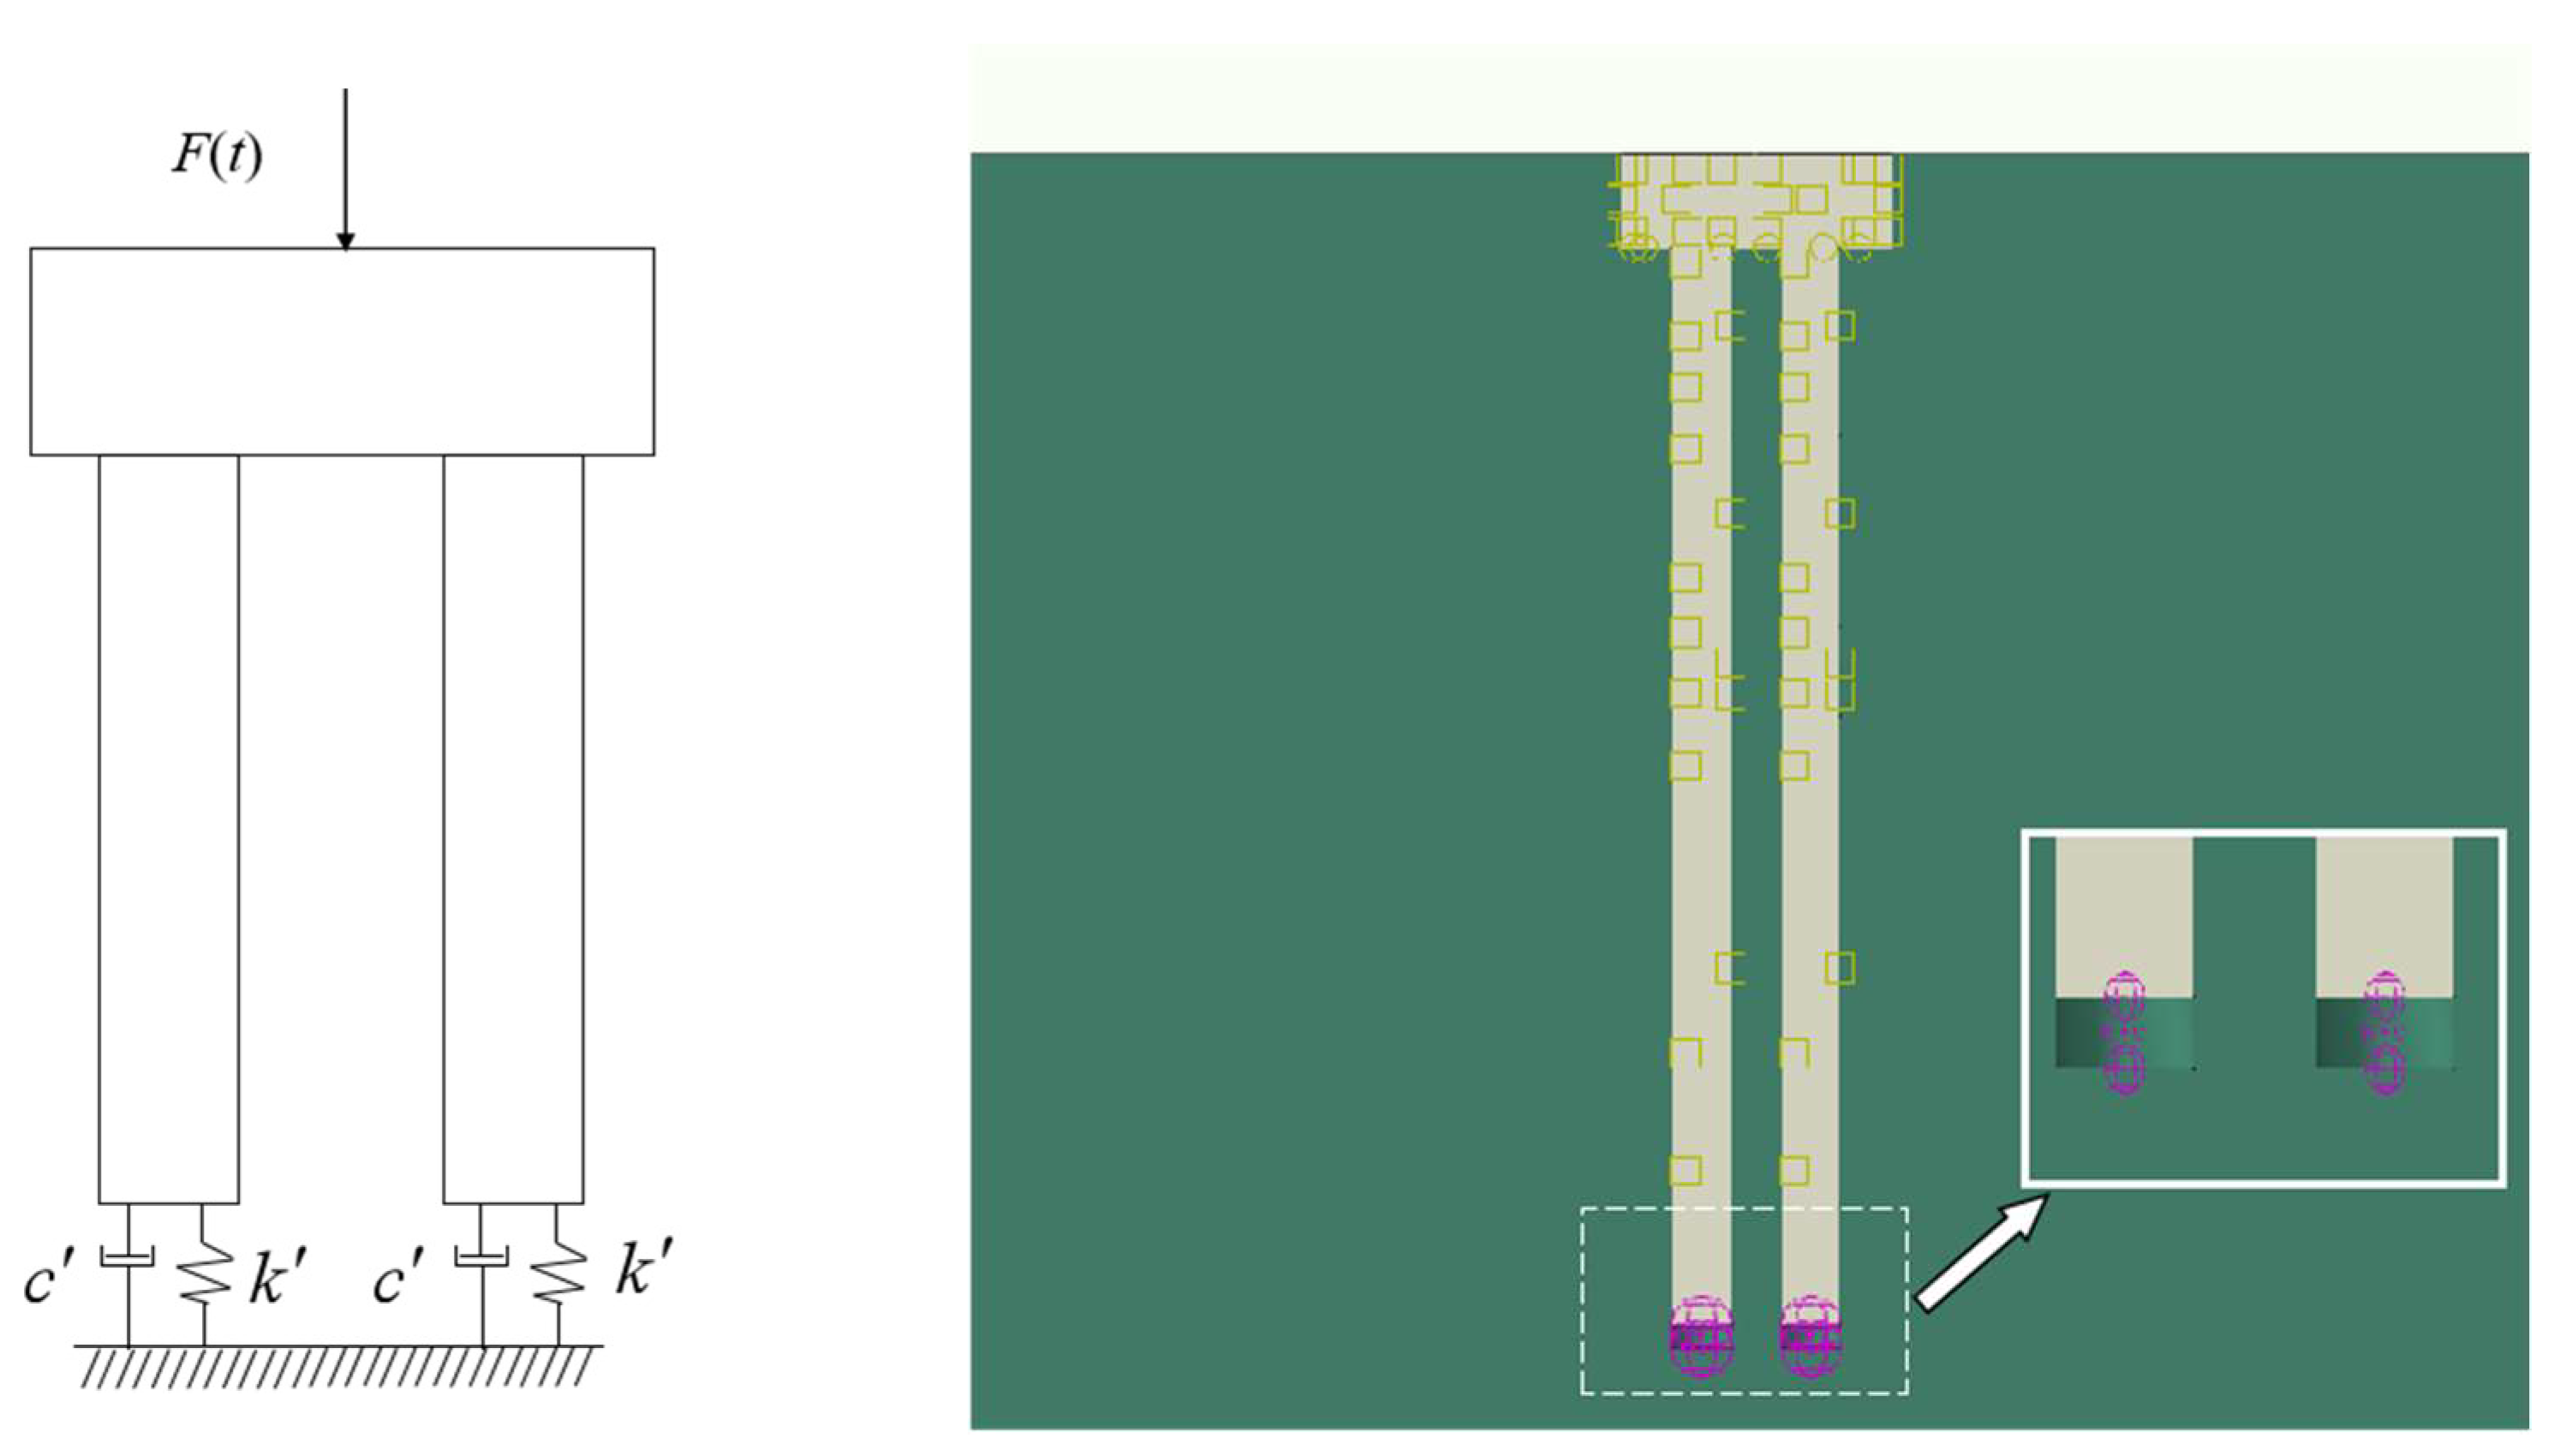
3.1. Three-Dimensional Numerical Model of Pile Cap–Pile Group–Soil Interaction
3.2. Calculation of Vertical Bearing Capacity of Pile Foundation
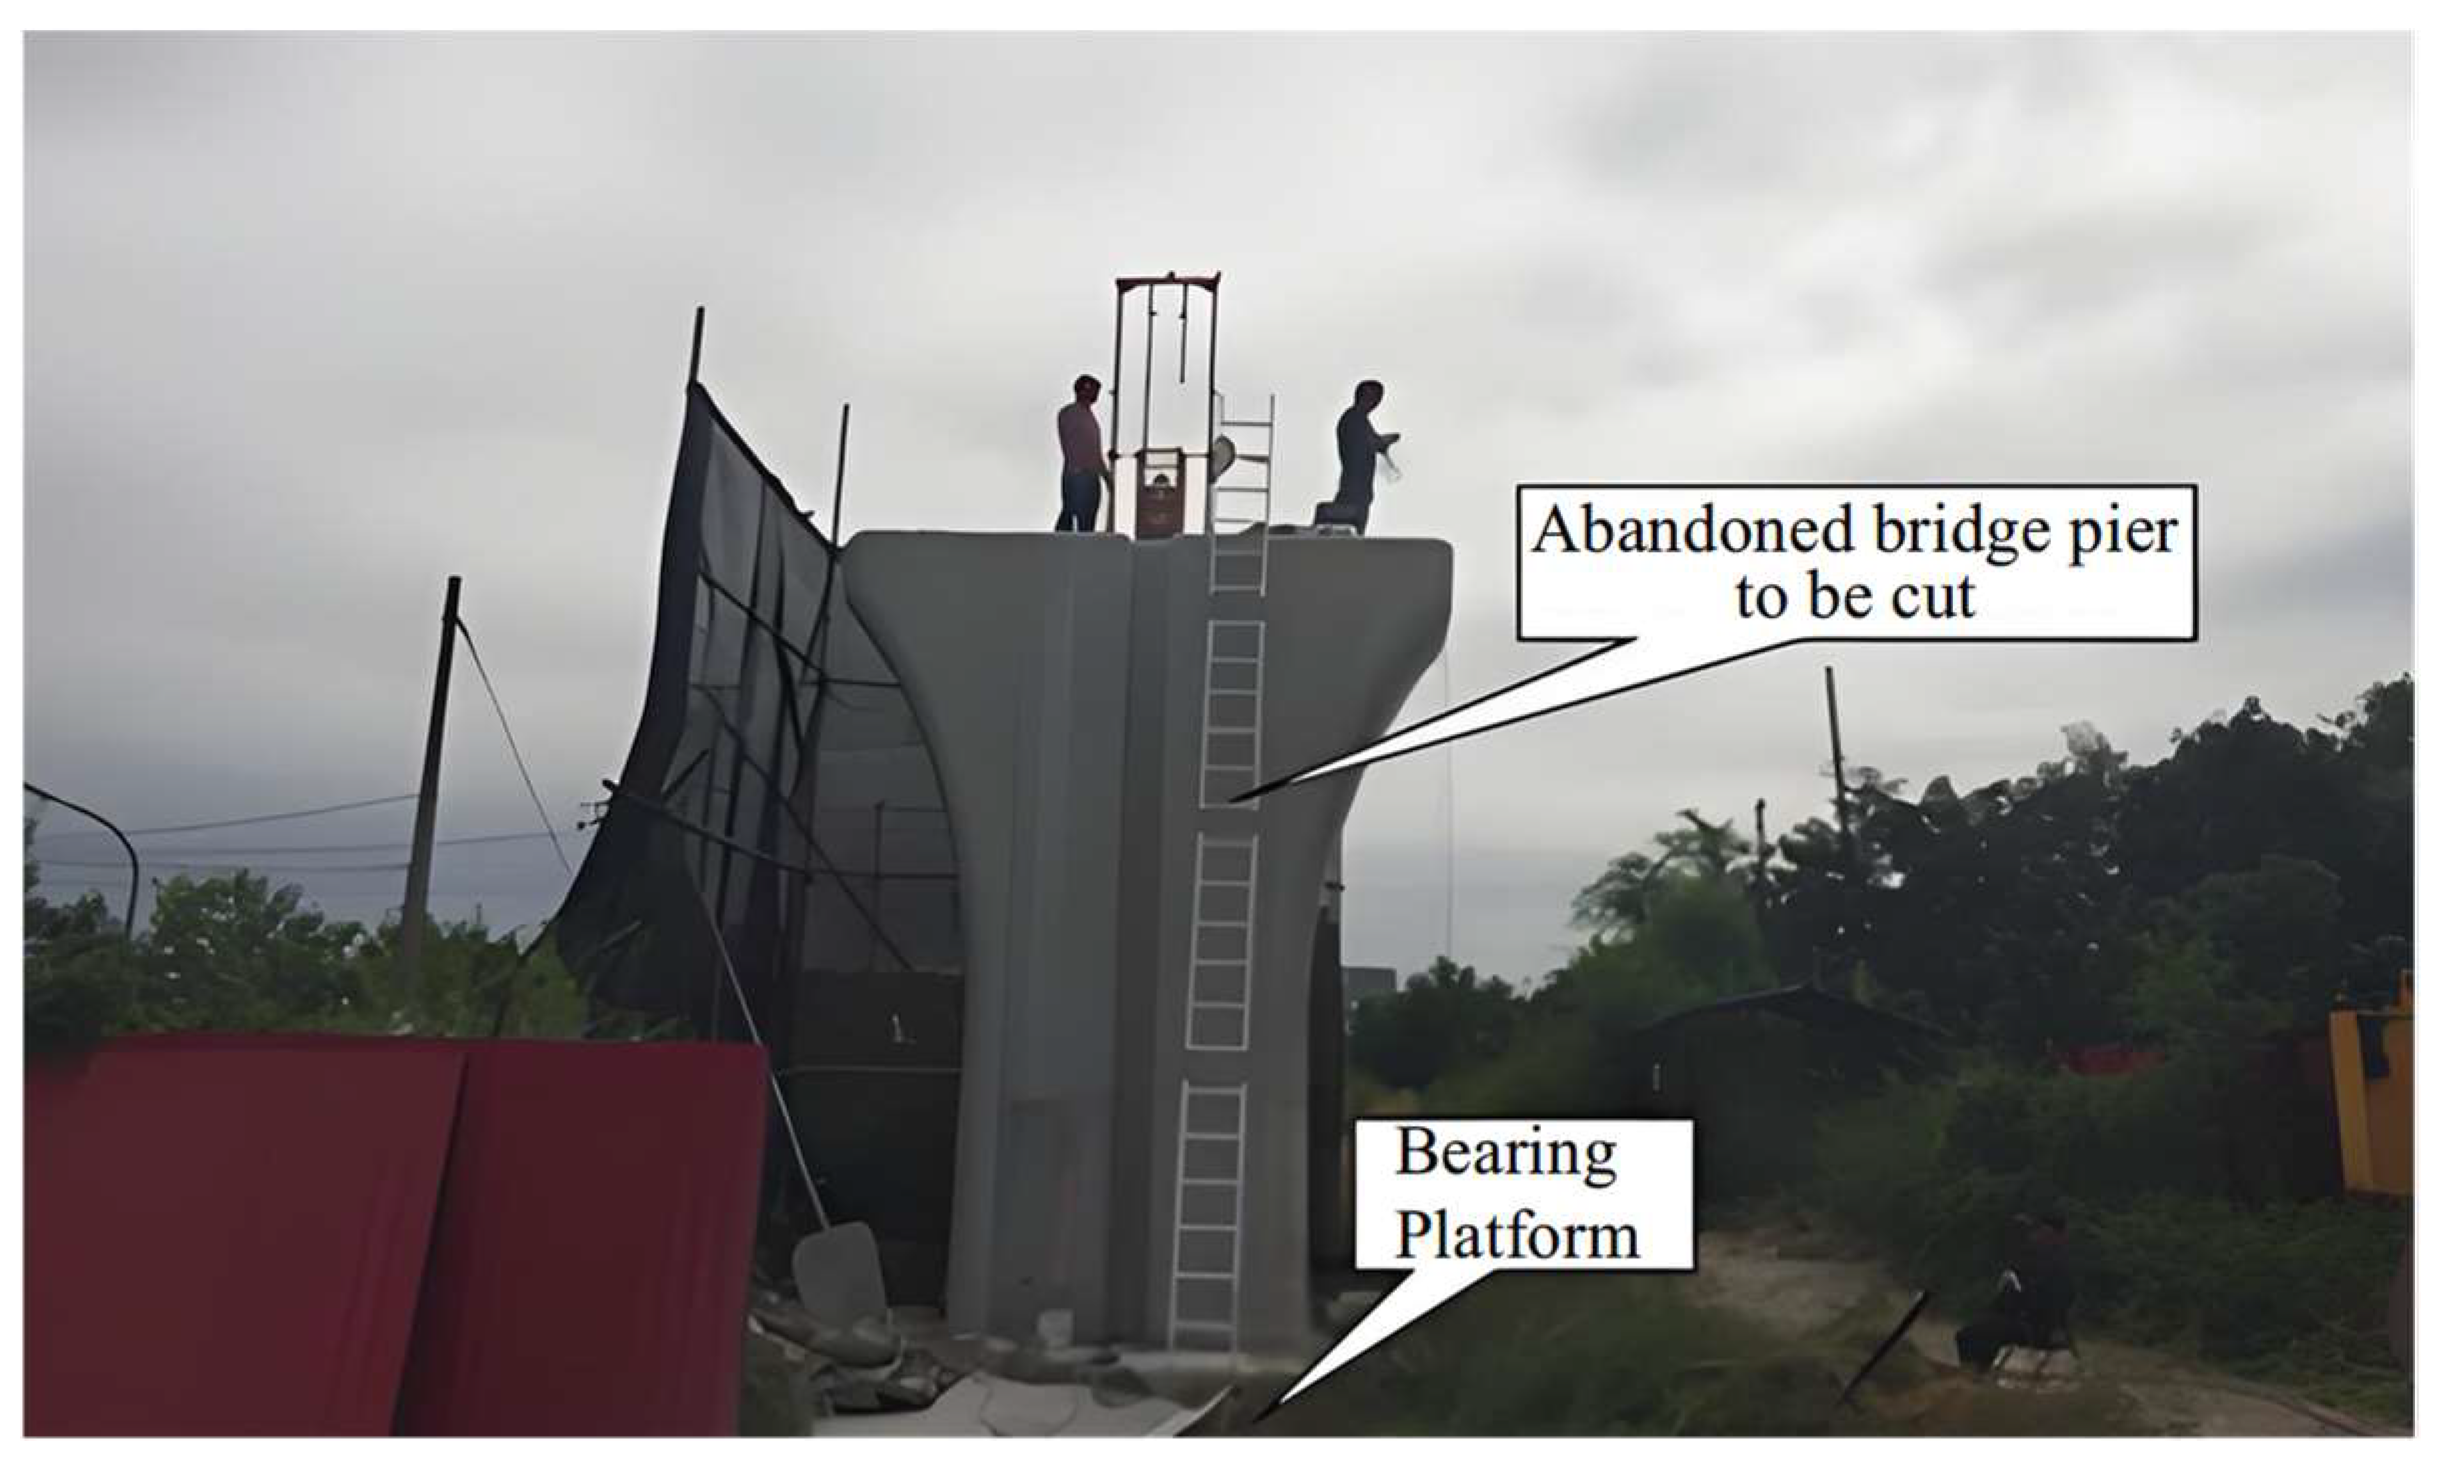
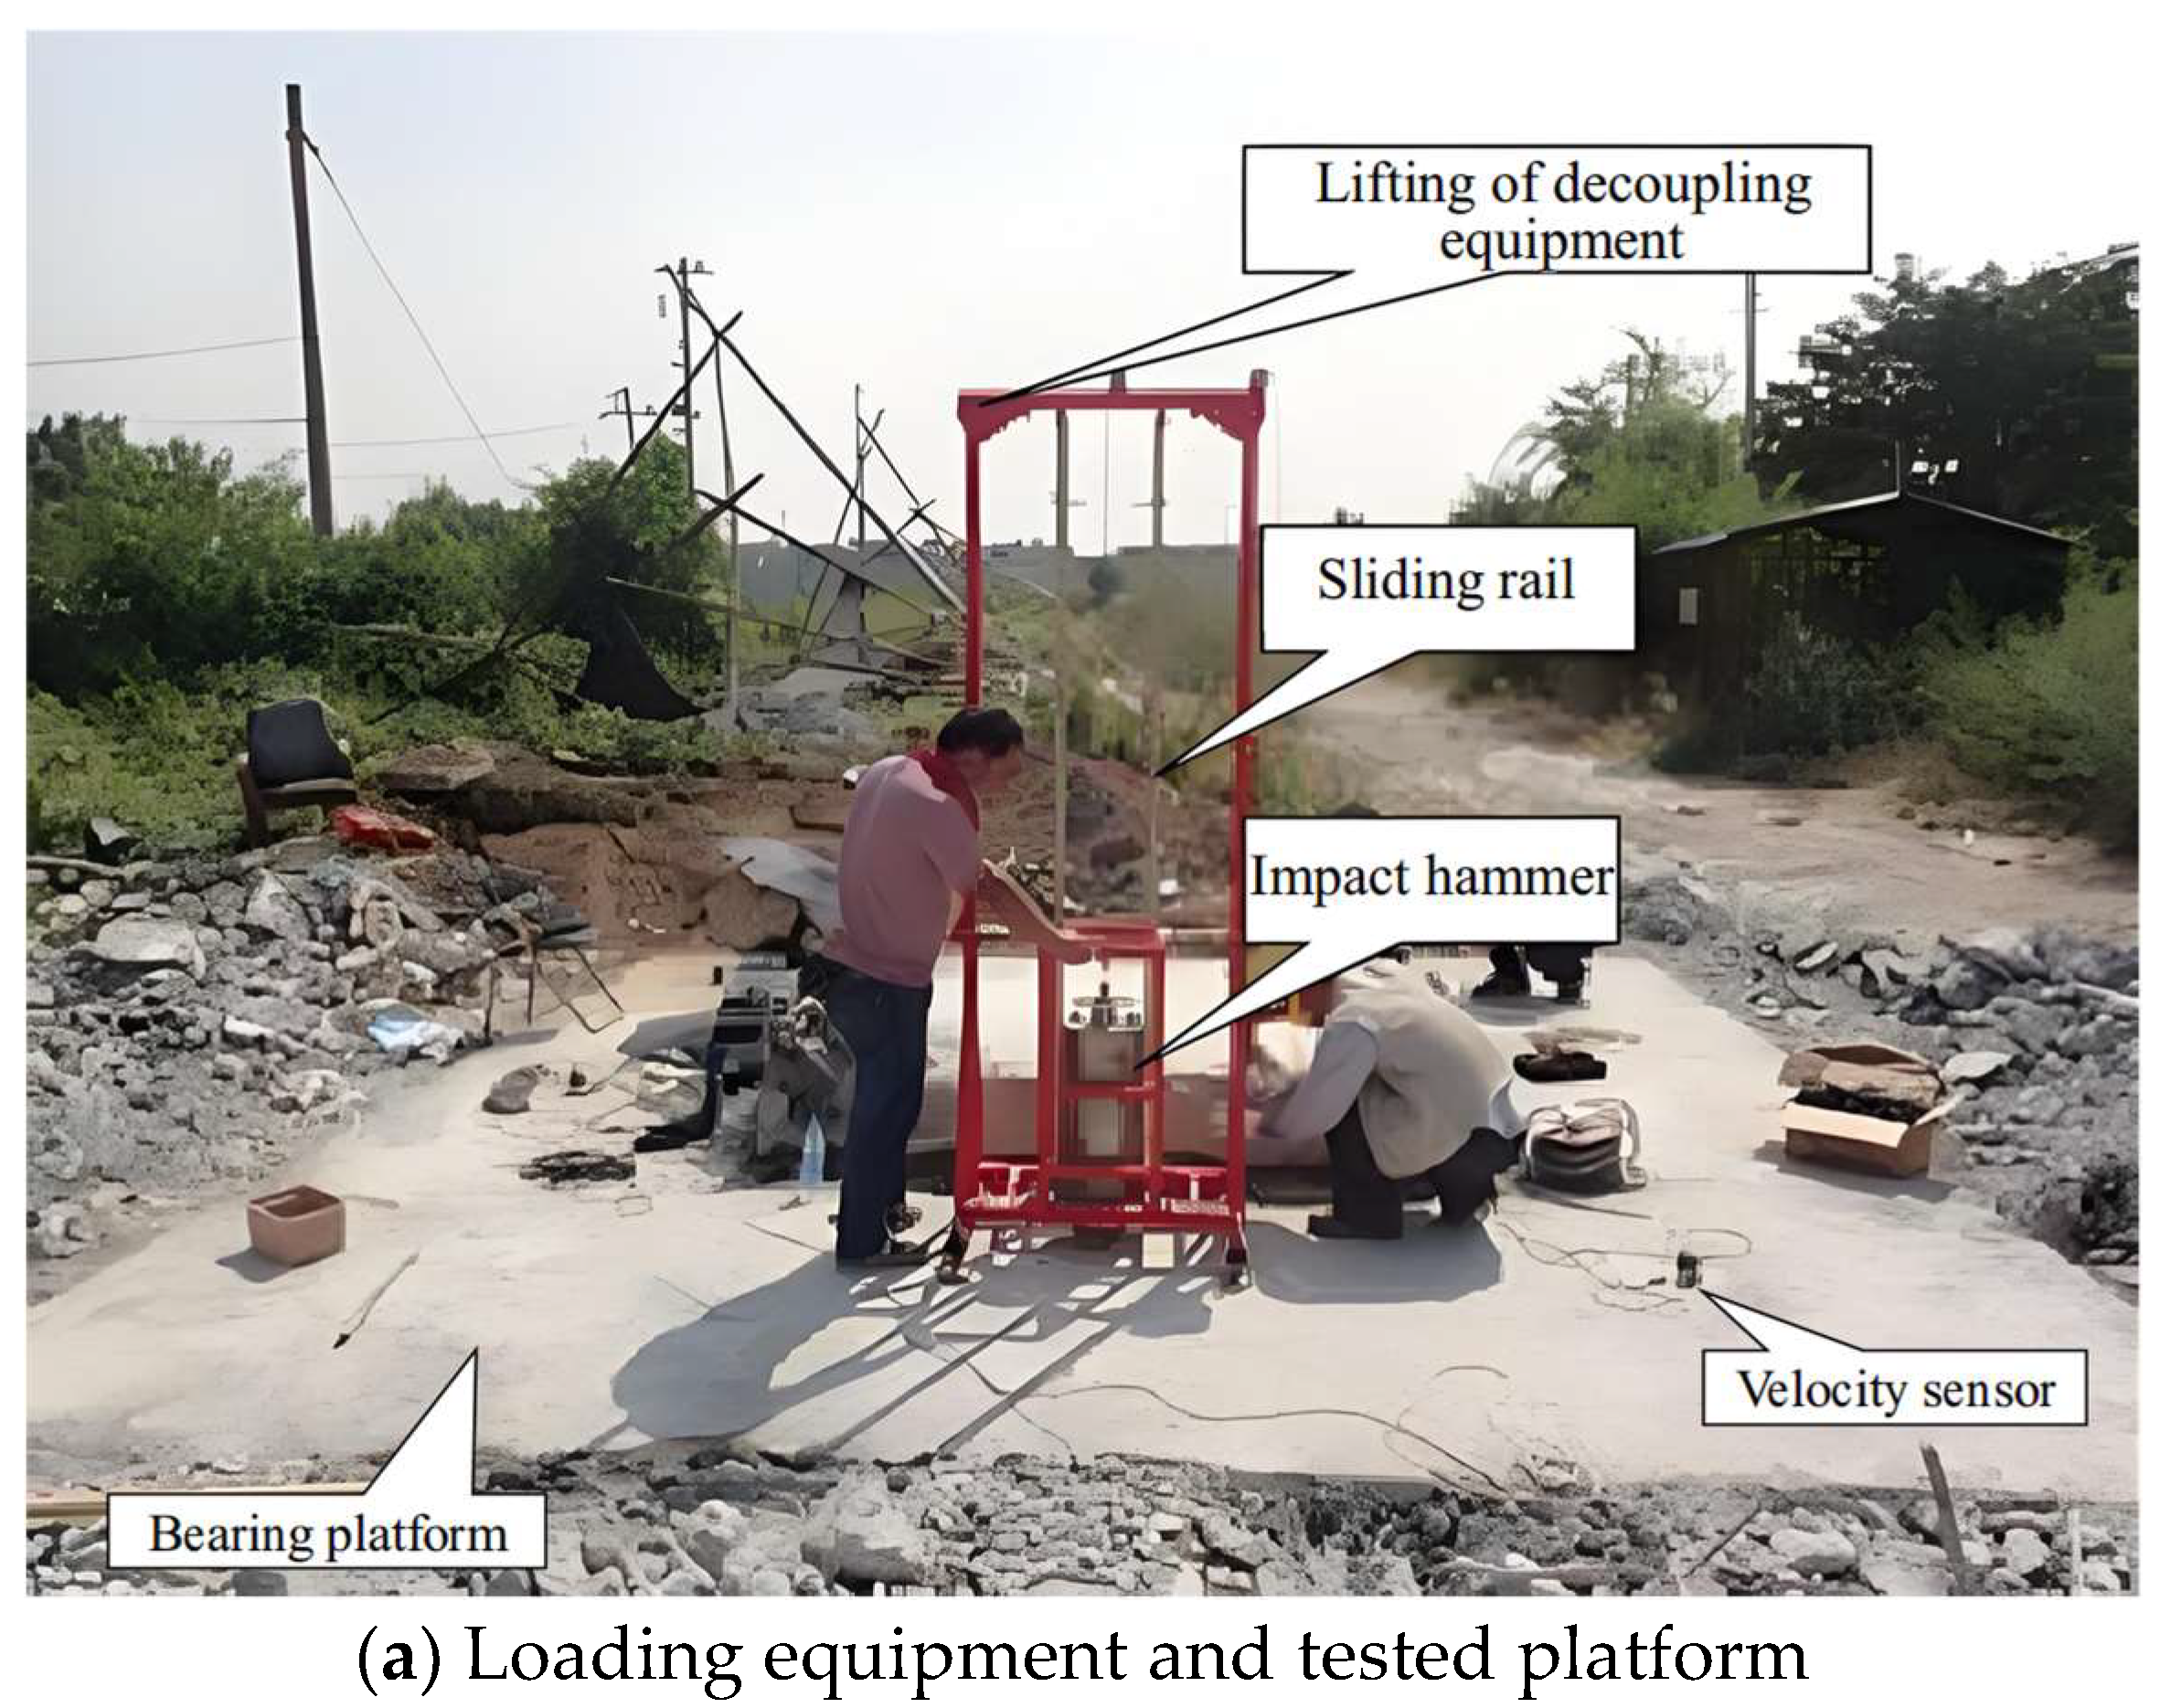
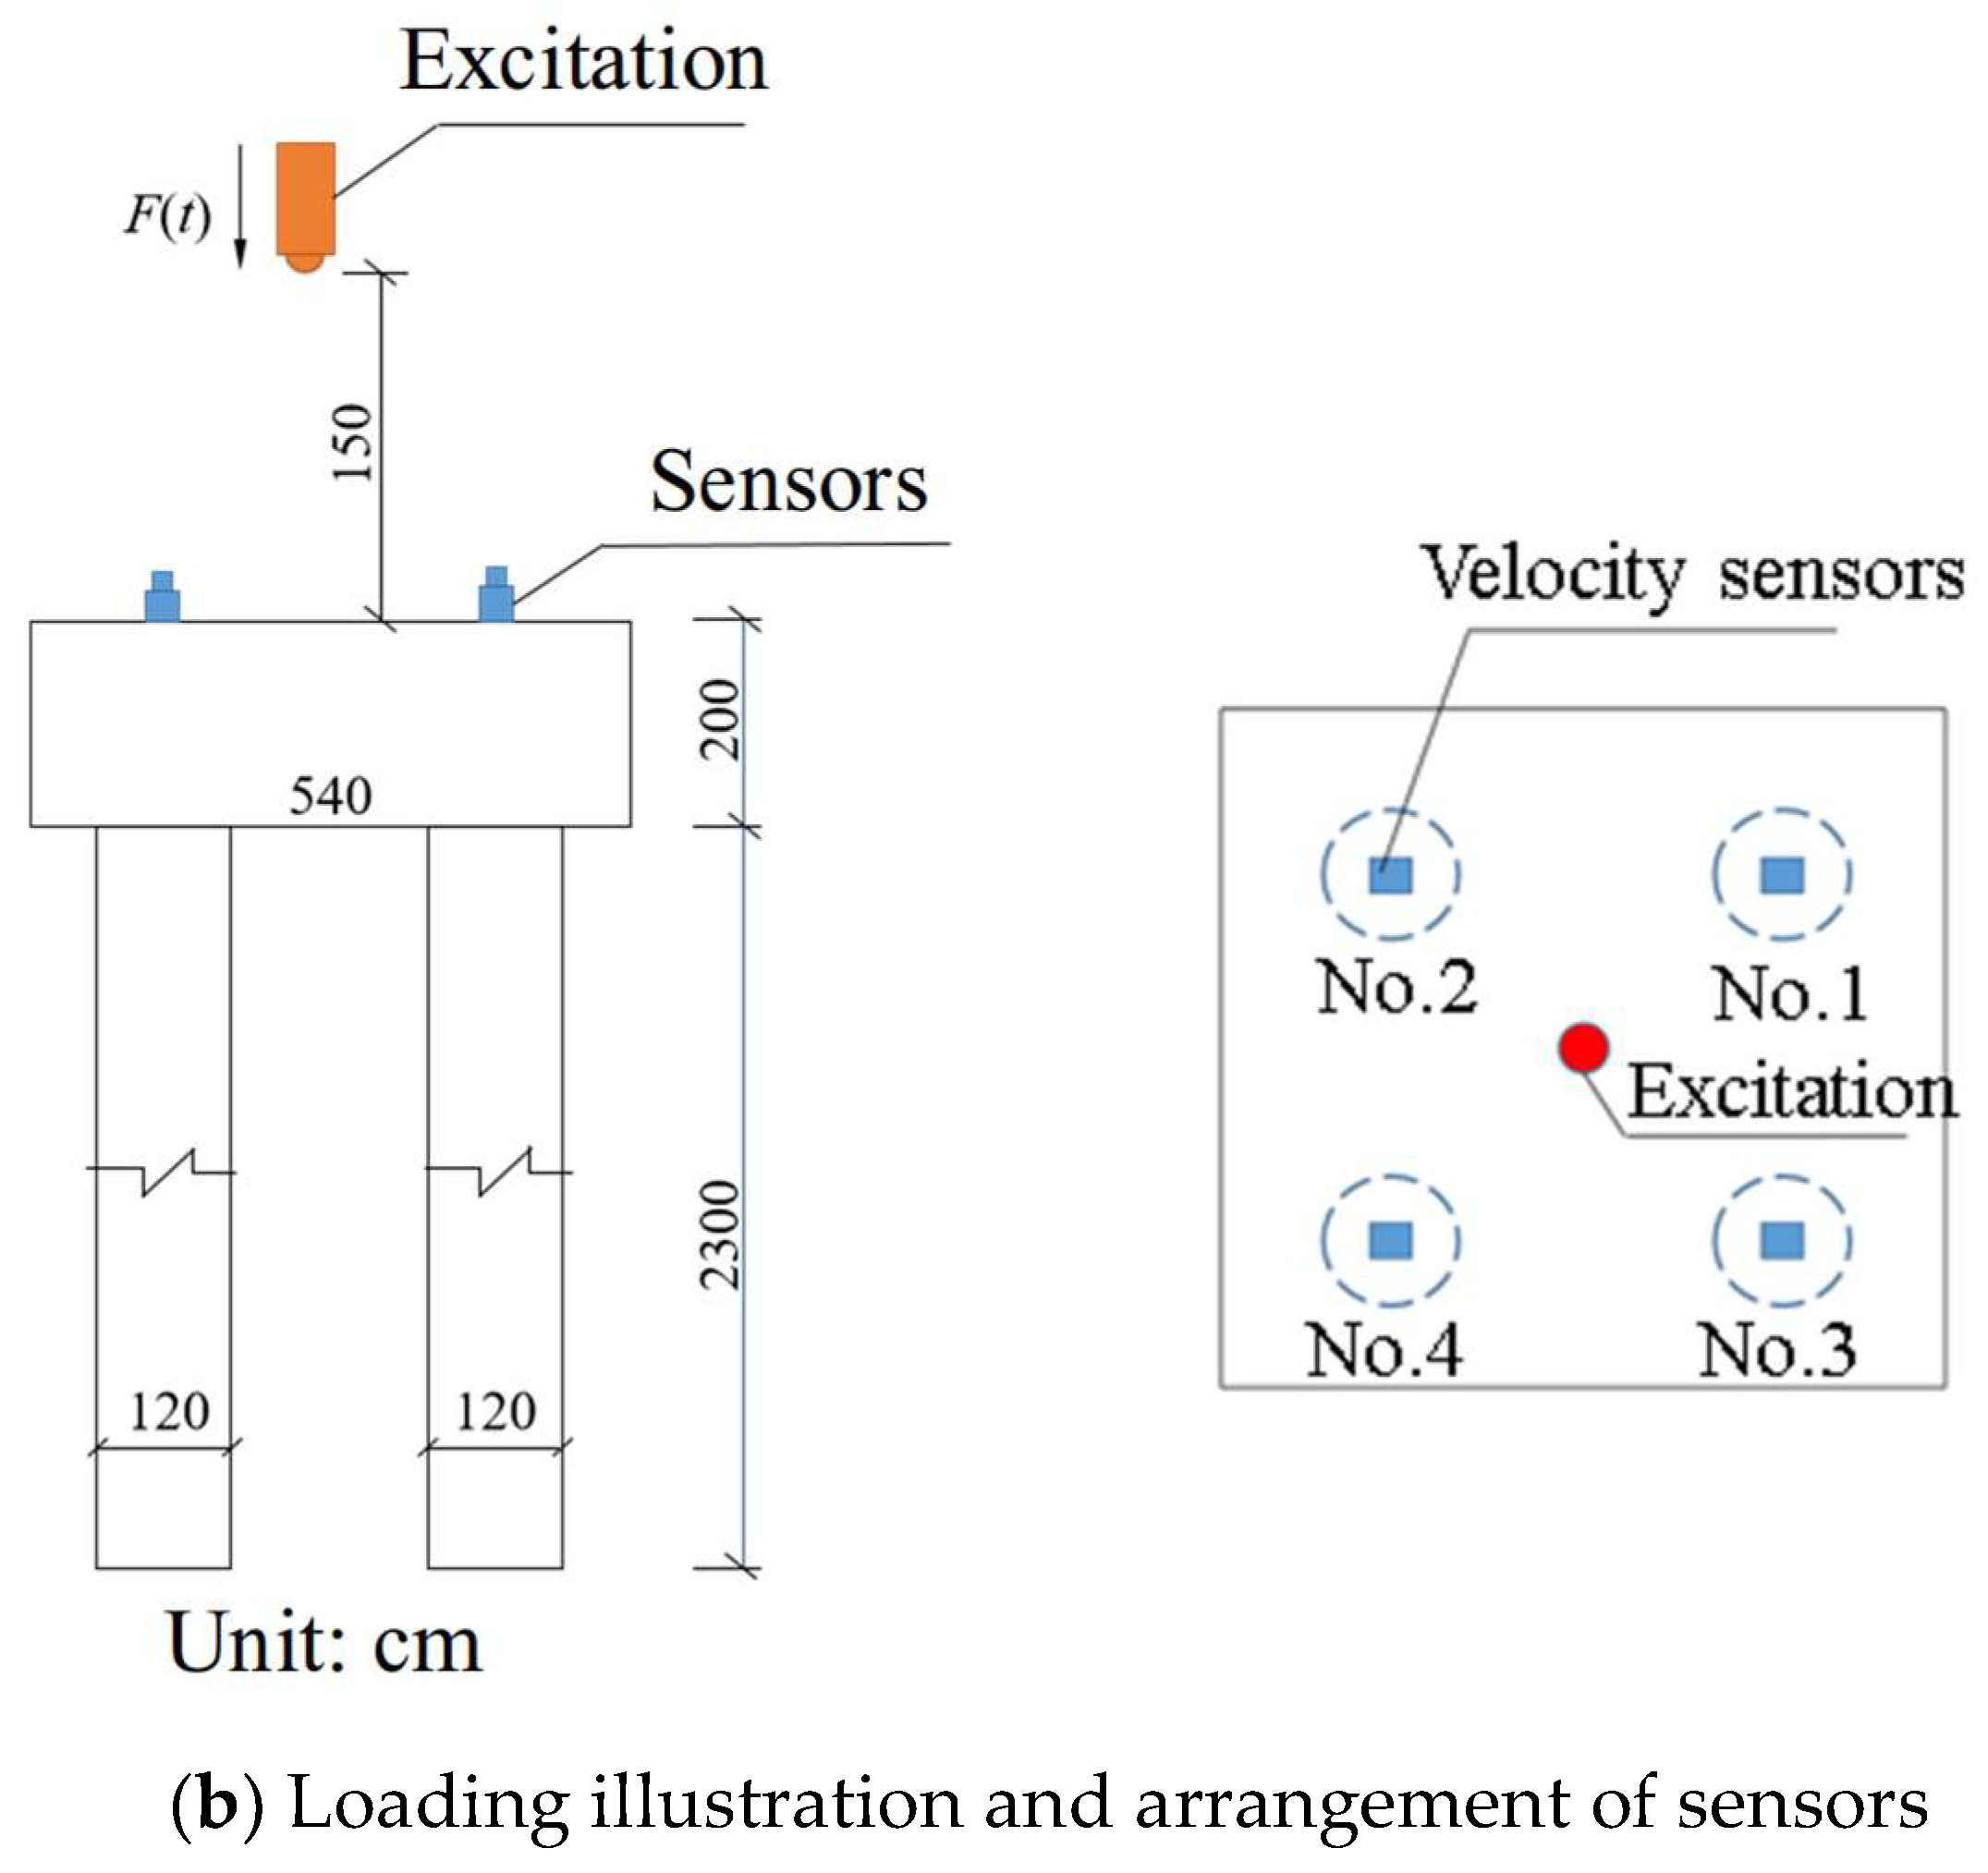
3.3. Experimental Verification of Numerical Analysis Model
- (1)
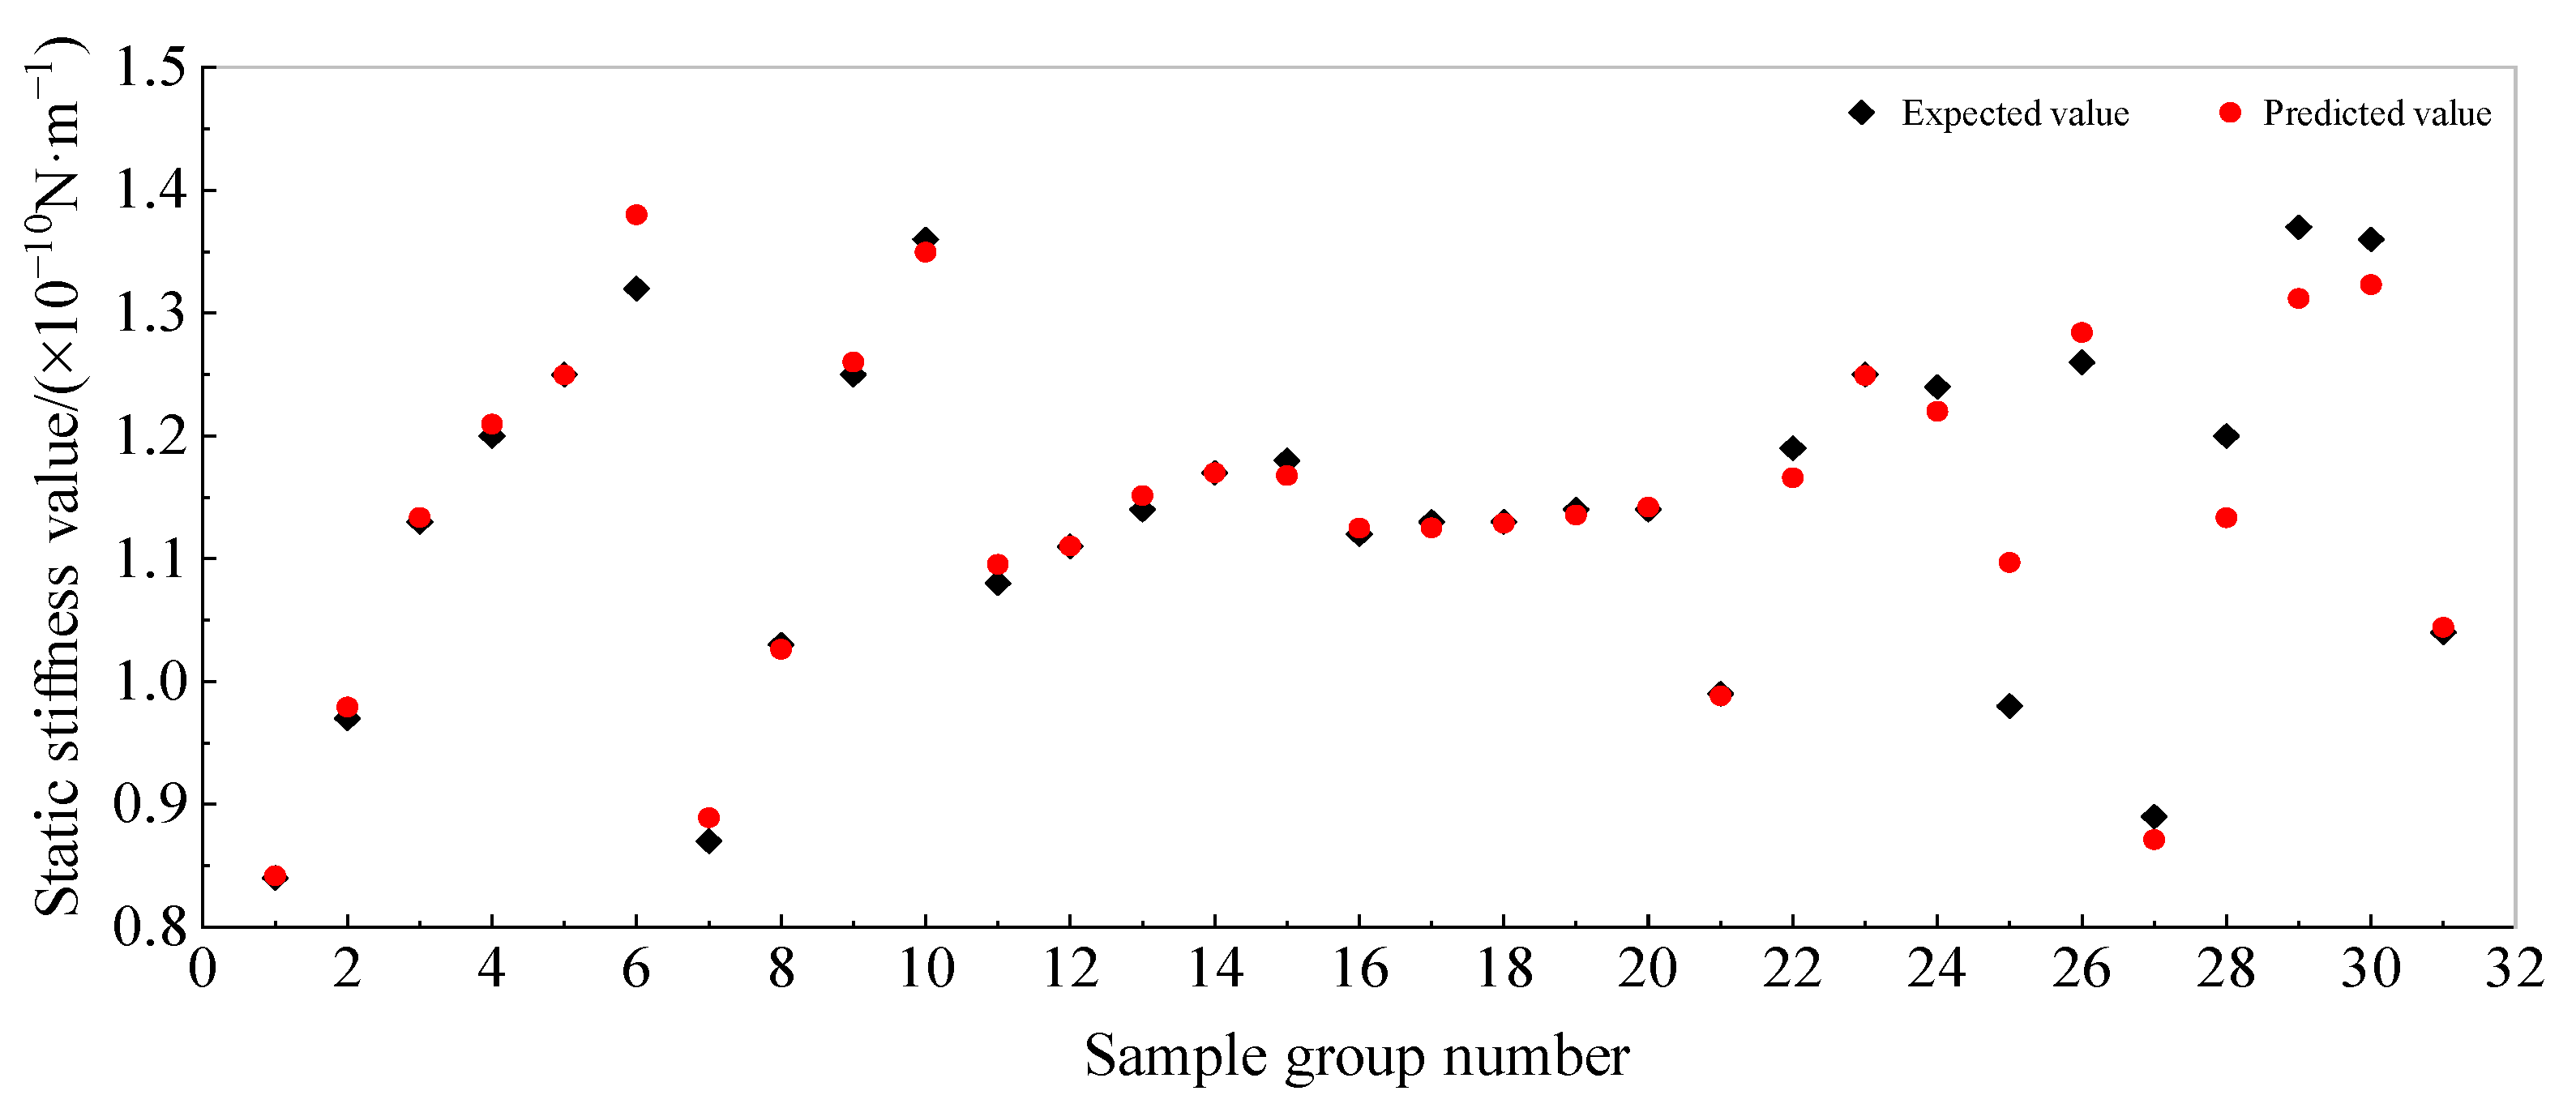
- Verification of the static stiffness prediction for bridge pile foundations
- (2)
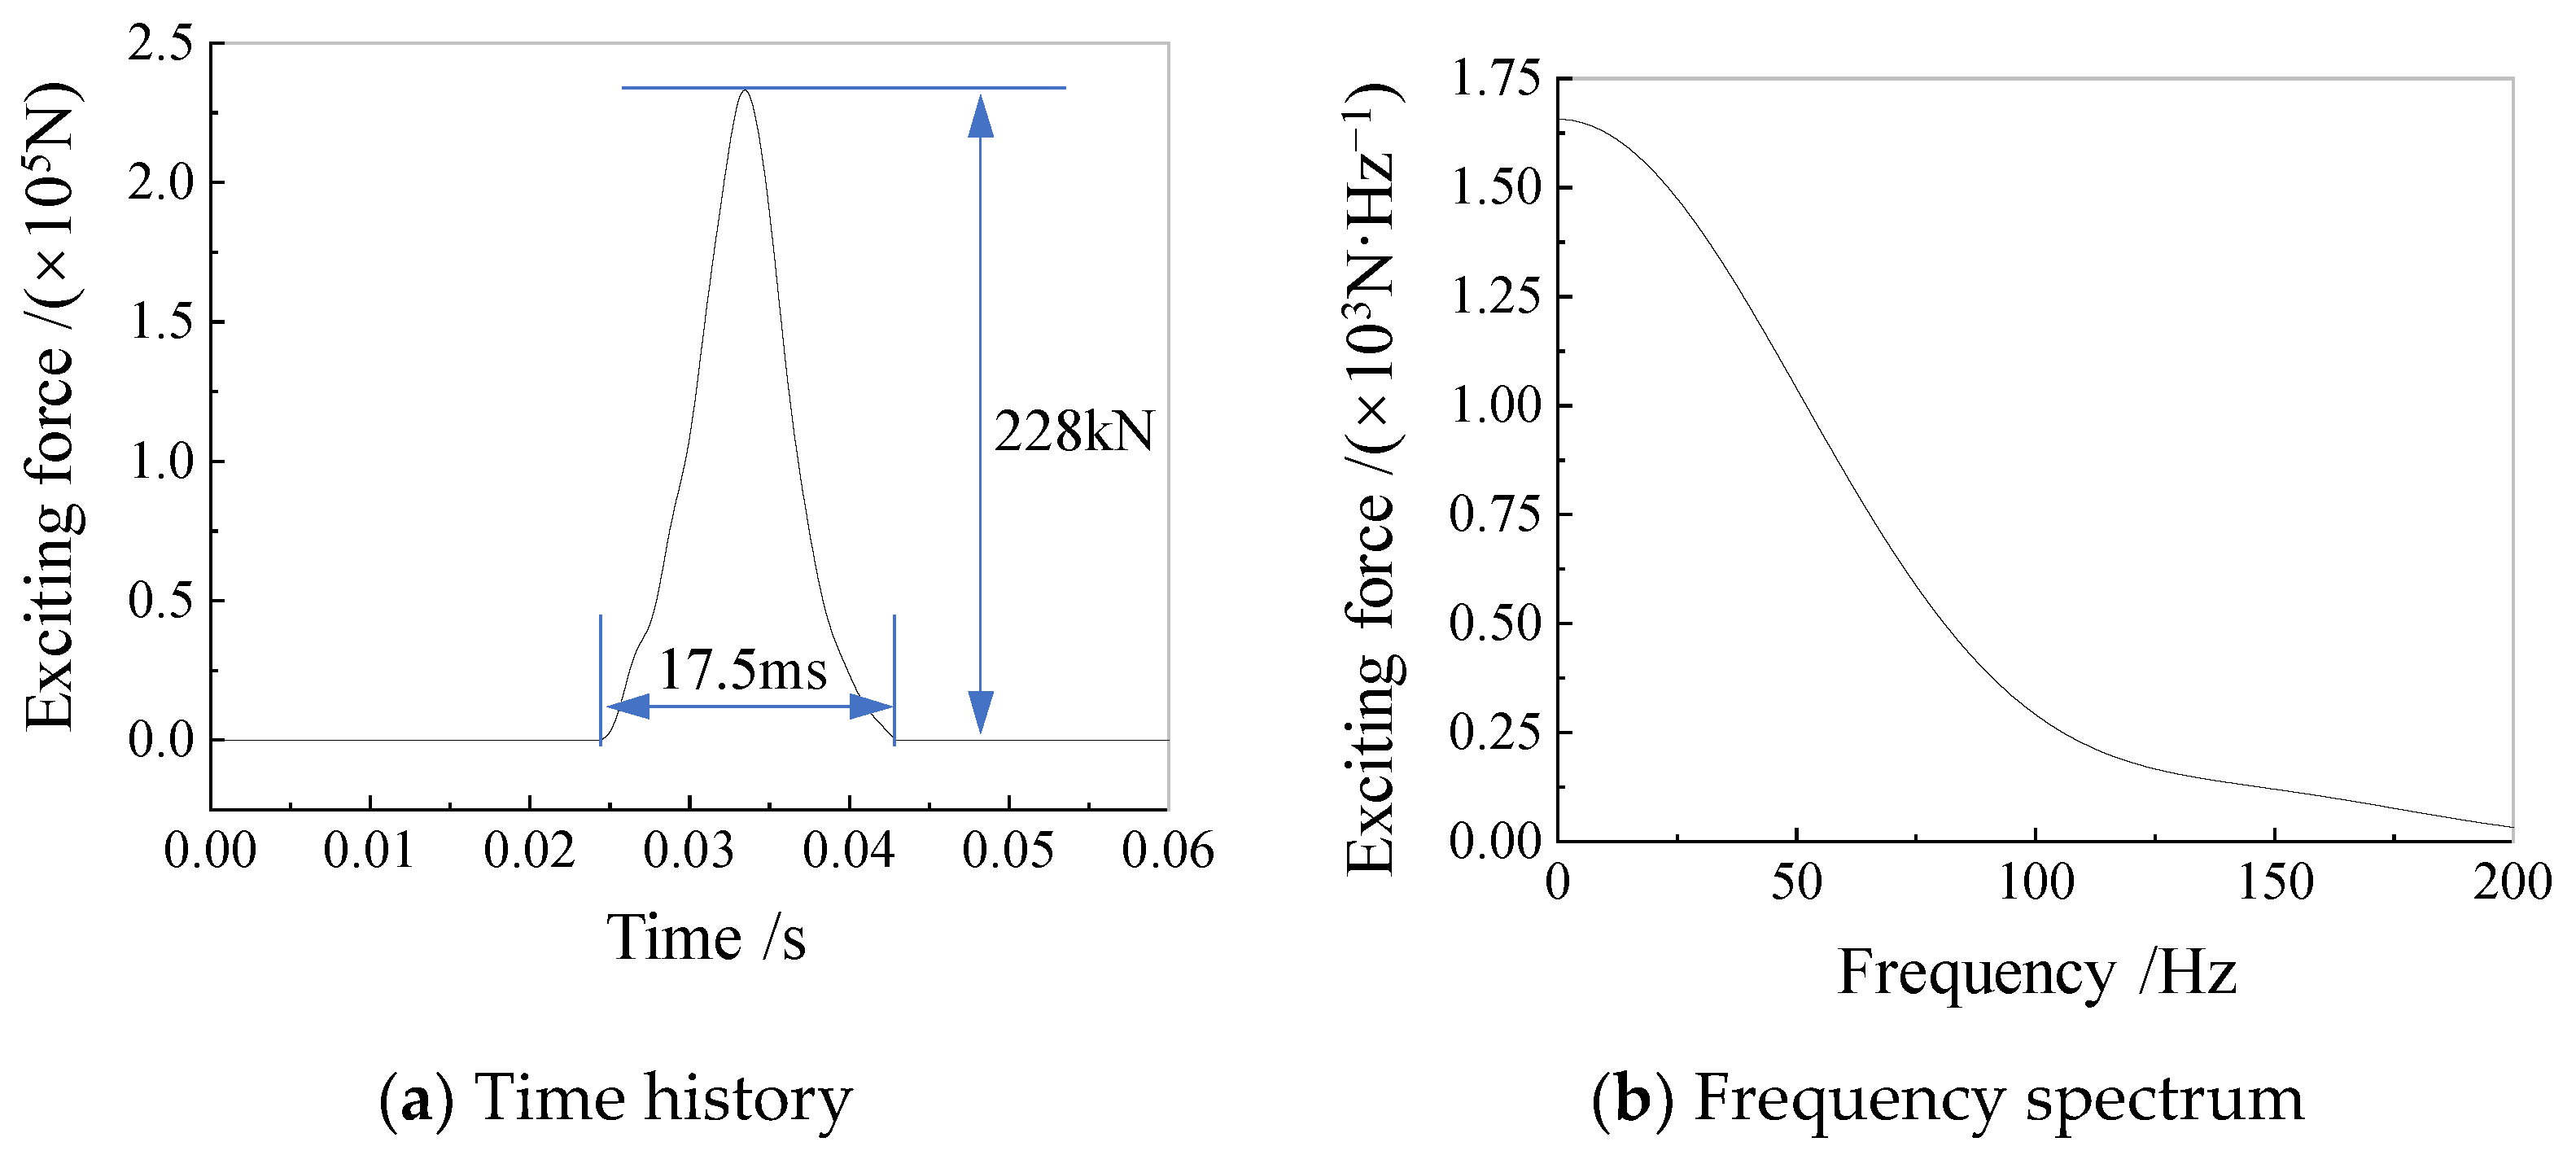
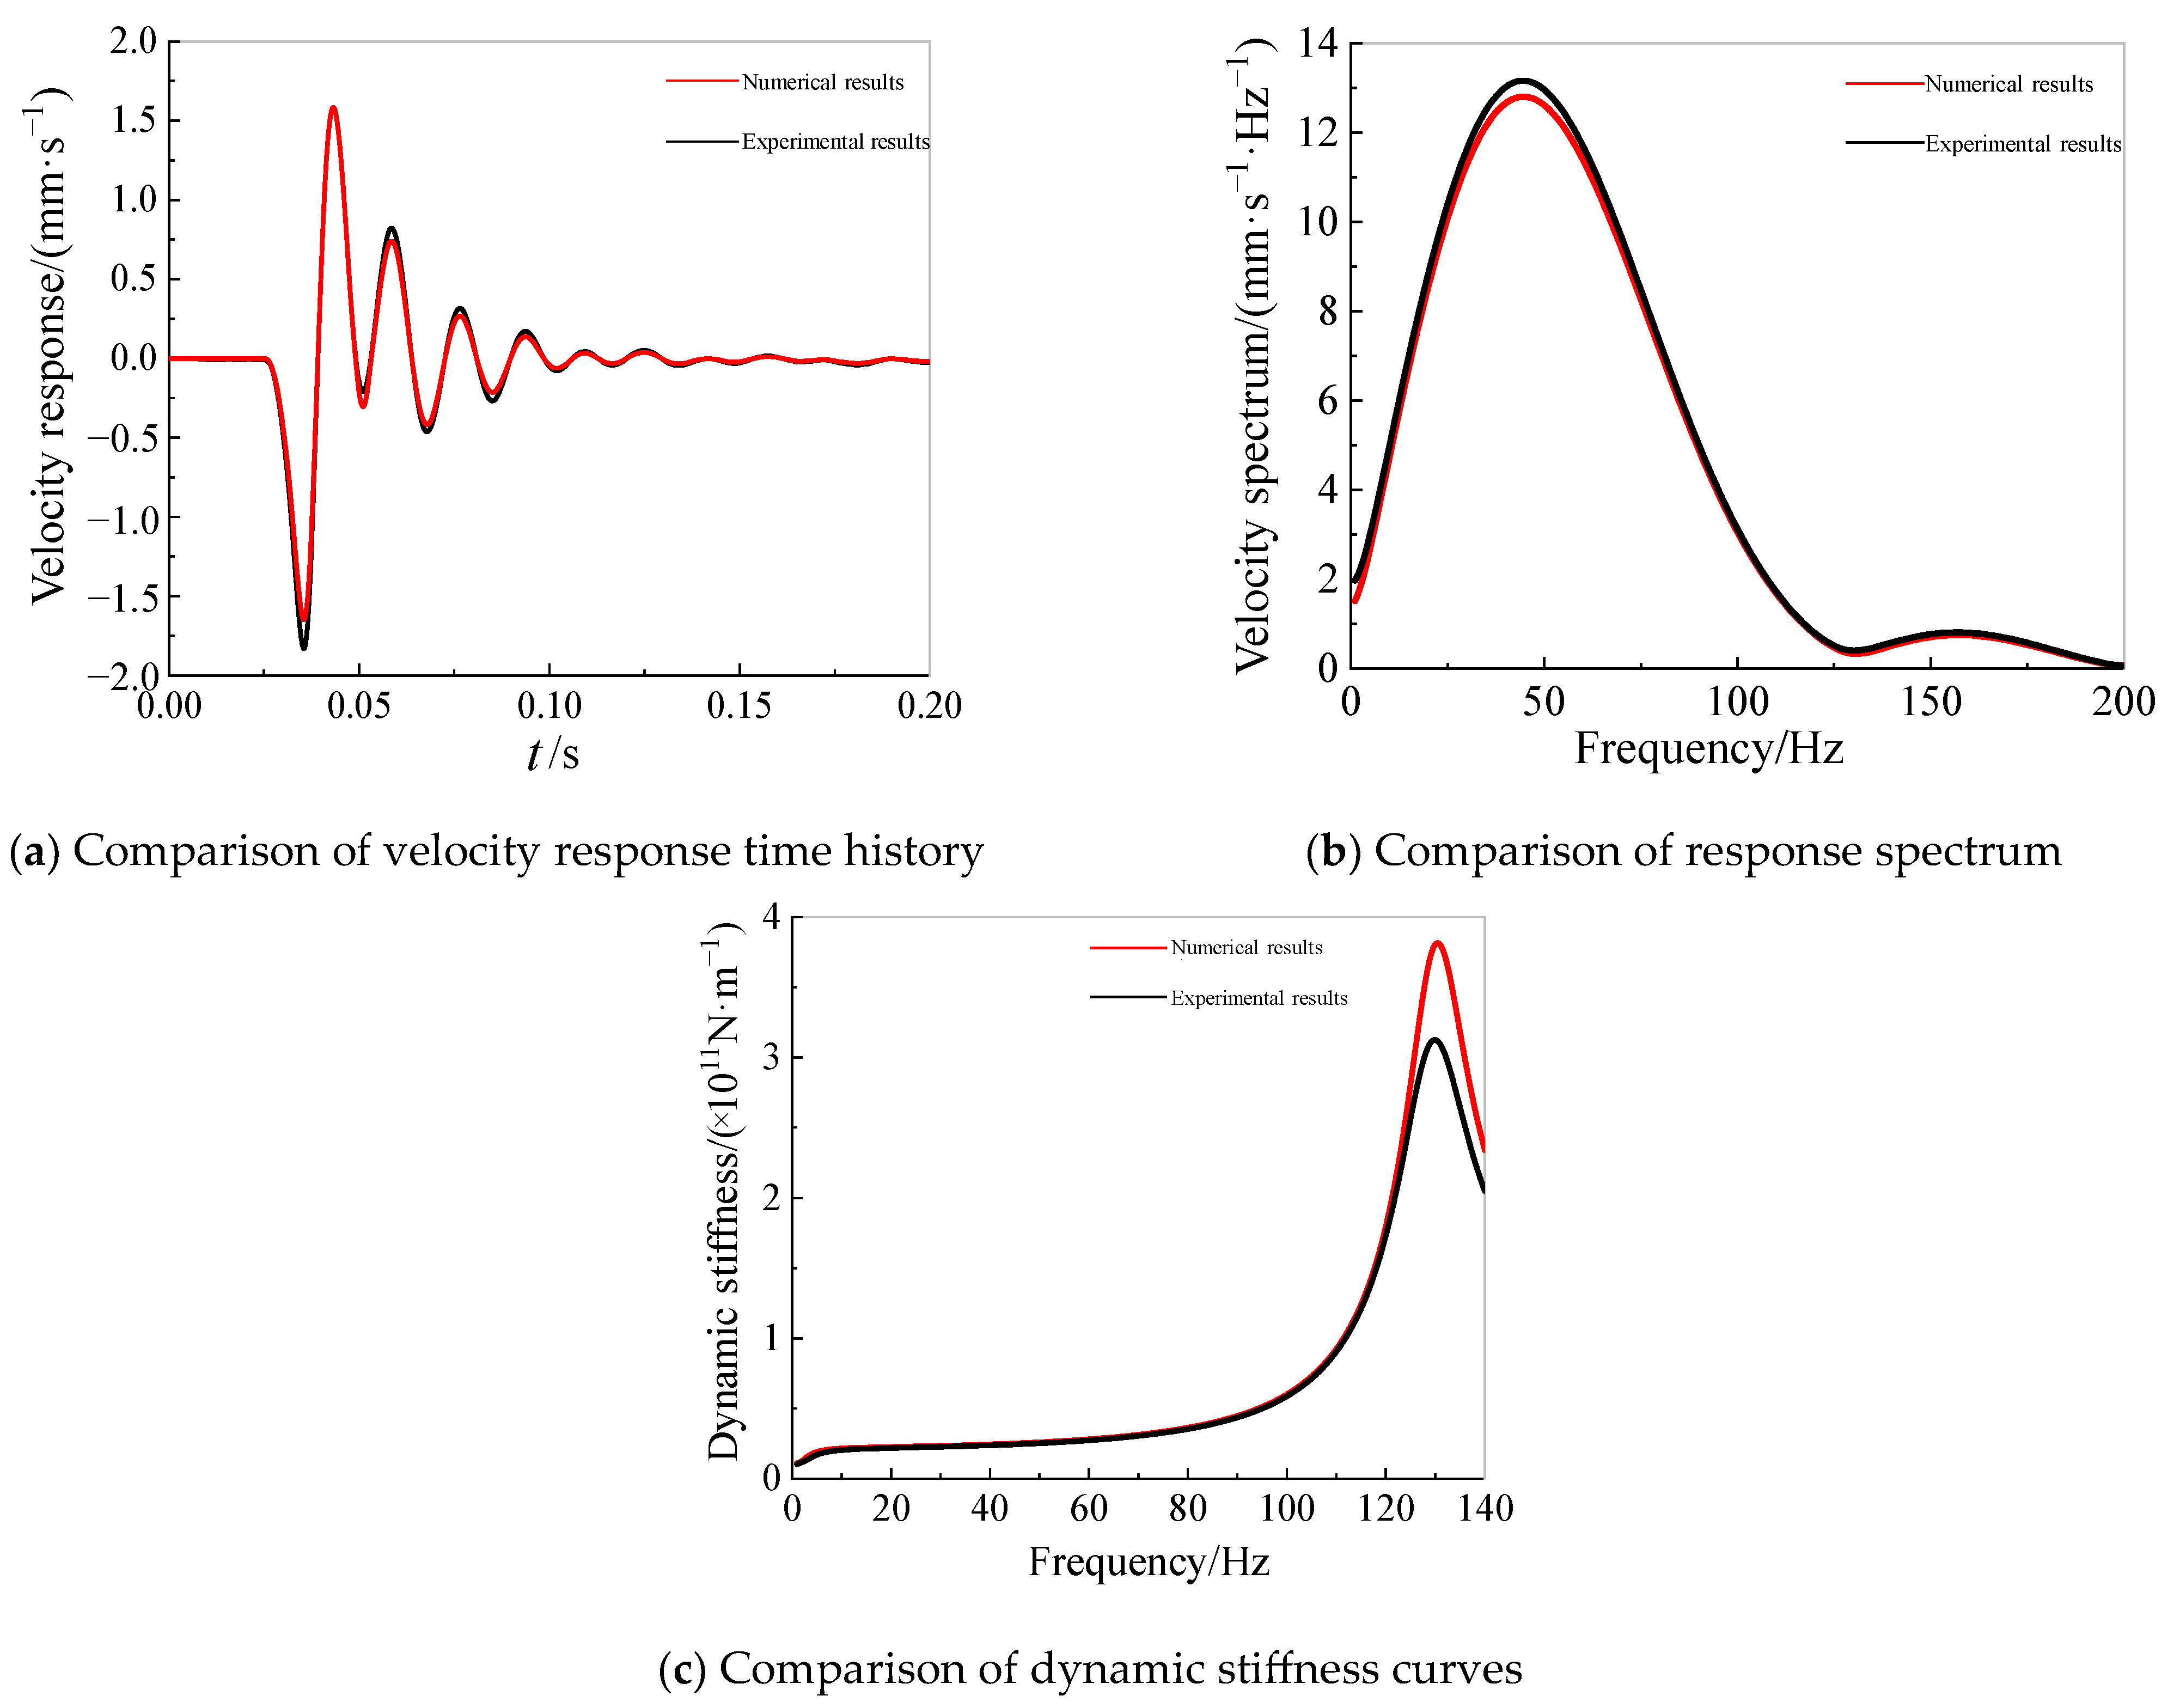
- Verification of bridge pile foundation dynamic stiffness
4. Machine Learning Prediction of Pile Foundation Dynamic and Static Stiffness
4.1. Cross-Application of Numerical and Machine Learning Models
4.2. Machine Learning Prediction of Vertical Static Stiffness
4.3. Machine Learning Prediction of Vertical Dynamic Stiffness
4.4. Learning and Prediction of the Dynamic-to-Static Stiffness Contrast Coefficient of Pile Foundations
5. Simulation and Experimental Verification of Nondestructive Testing Methods for Pile Foundations
5.1. Evaluation of the Vertical Residual Bearing Capacity of a Pile Foundation
5.2. Evaluation of Ultimate Vertical Bearing Capacity for Designing a Pile Foundation
6. Discussion and Conclusions
- (1)
- The numerical analysis model and machine learning algorithms can be integrated to develop a prediction model for the static, dynamic, and dynamic-to-static stiffness ratios of bridge pile foundations, in which numerical simulation provides an approach to forming a training dataset for machine learning, where field testing is impractical.
- (2)
- The vertical residual and ultimate bearing capacities of pile groups can be quickly assessed by using only dynamic stiffness test data and machine learning techniques.
- (3)
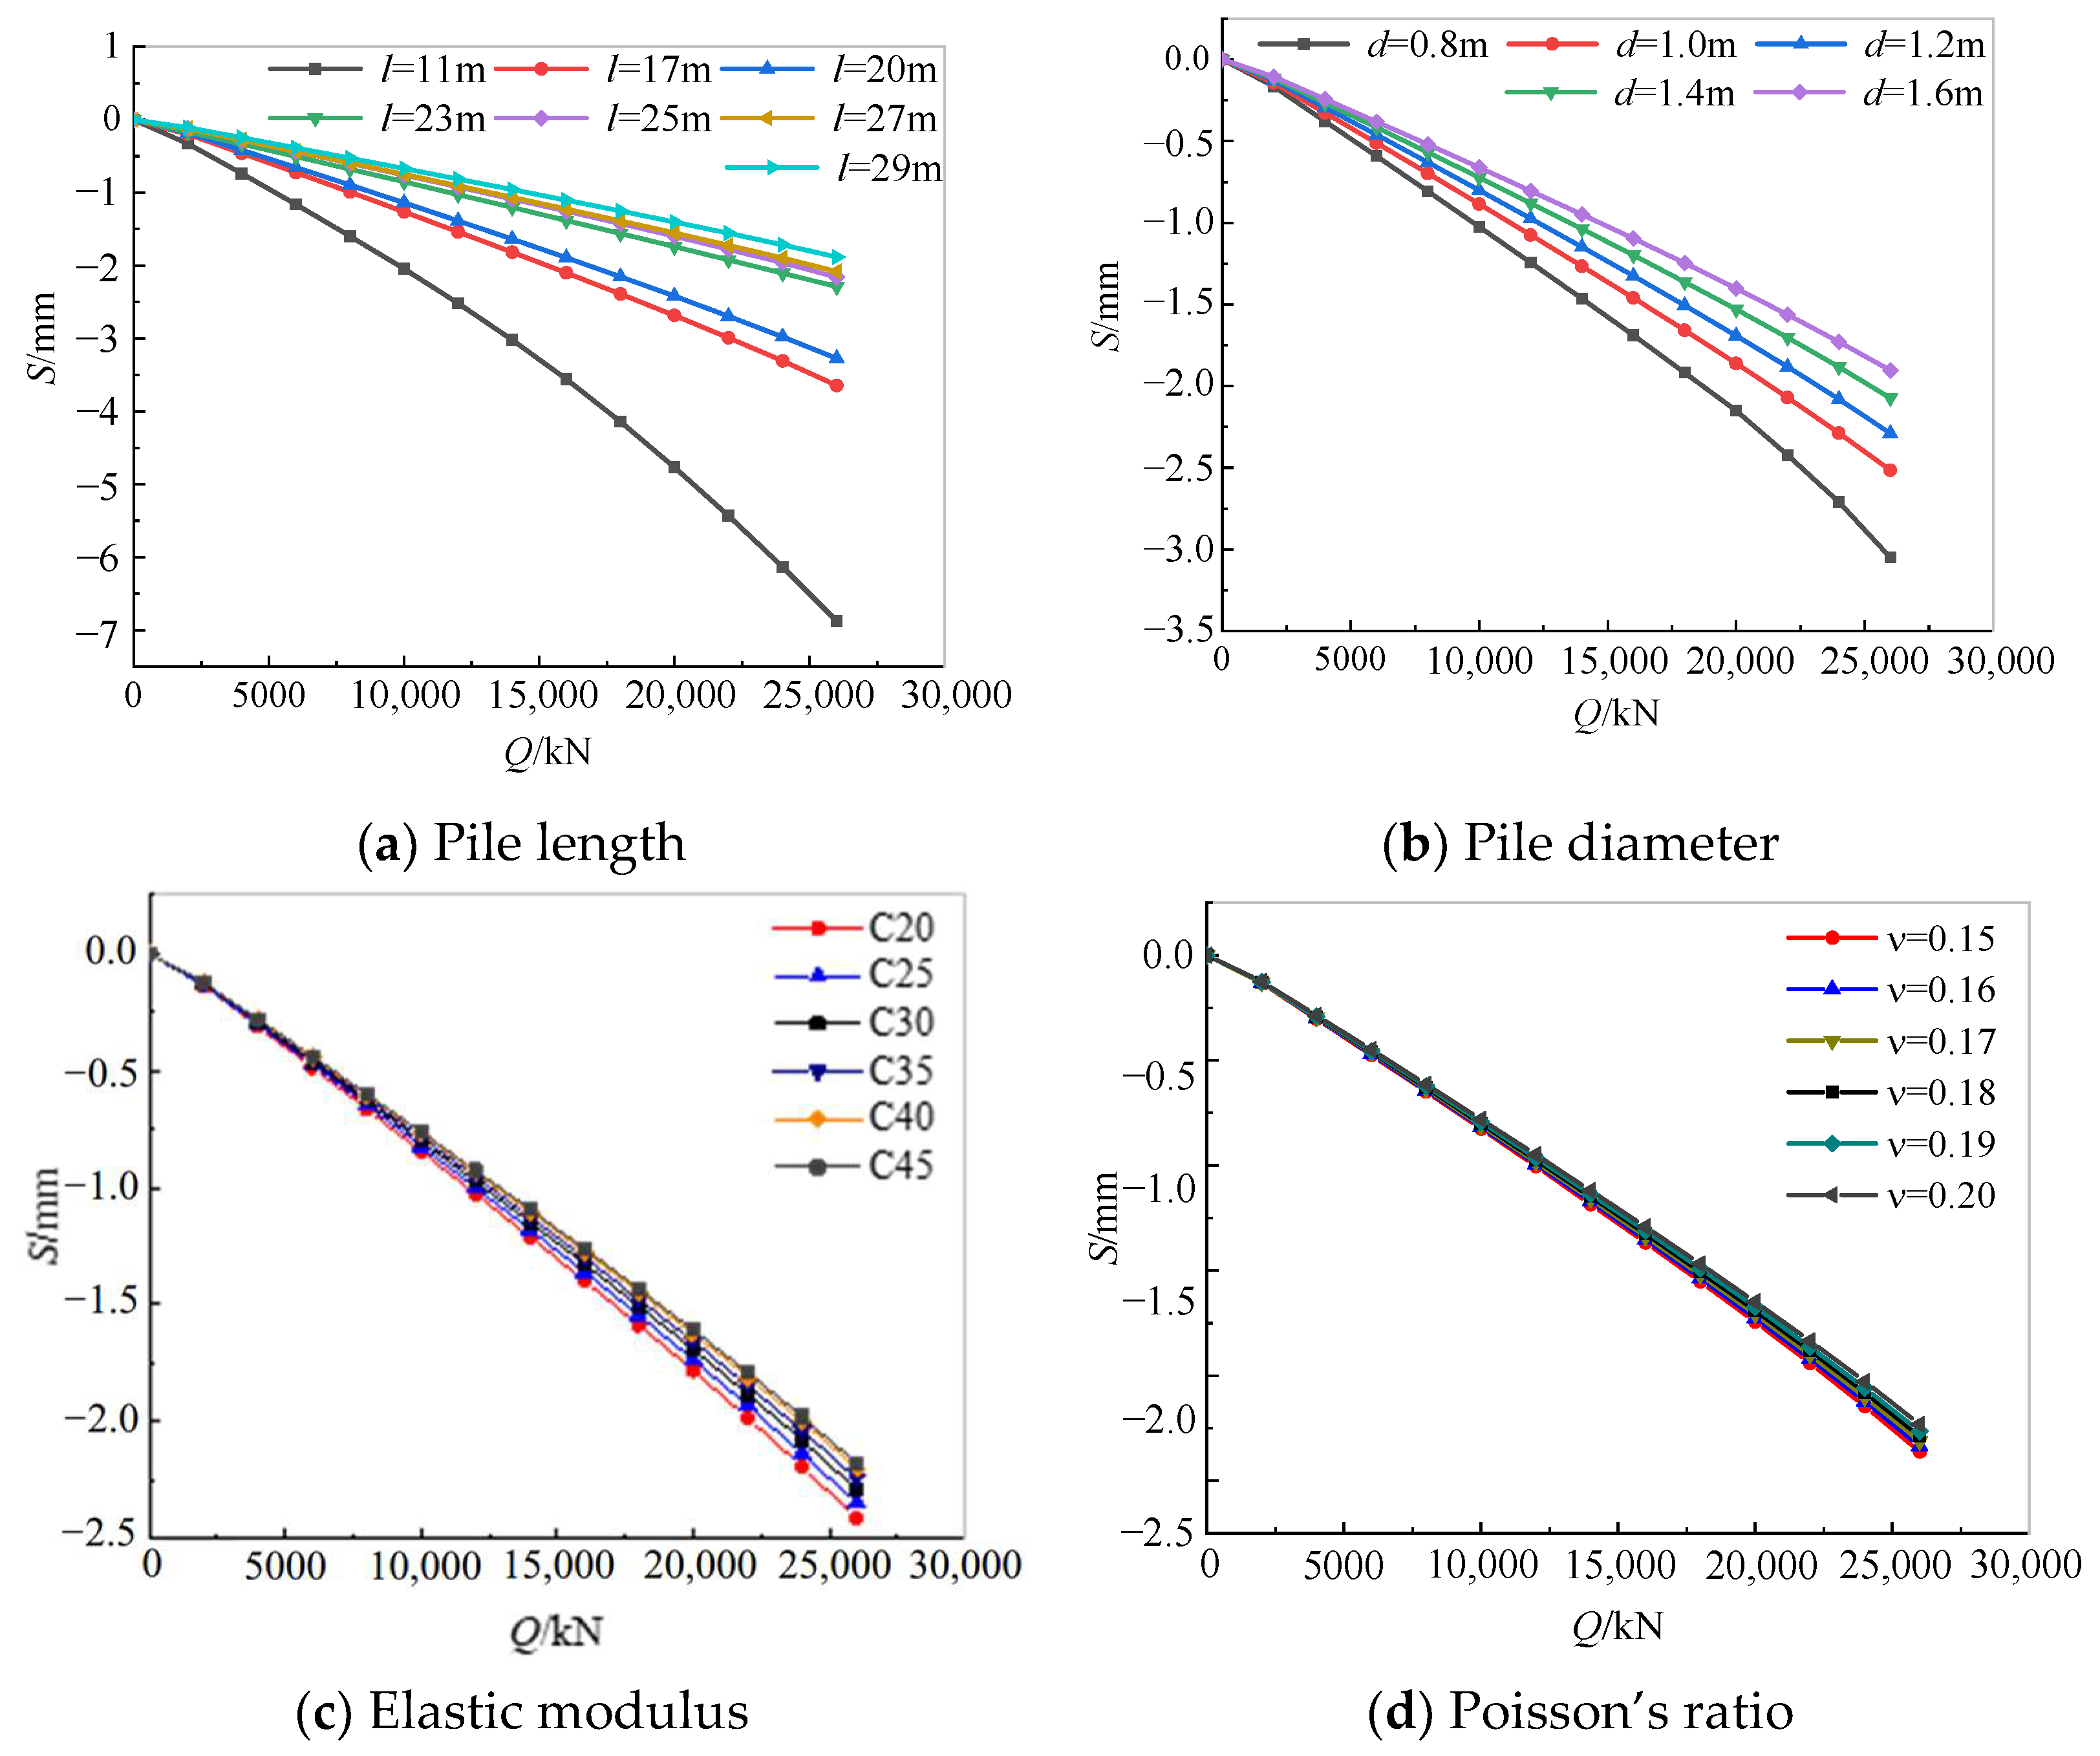
- The dynamic-to-static contrast coefficient is inversely proportional to the pile length, and it first increases and then decreases with the increase in the pile diameter, reaching a maximum coefficient of 1.99 at a pile diameter of 1.2 m.
- (4)
- The dynamic-to-static contrast coefficient is directly proportional to the elastic modulus of the pile concrete. A significant increase is observed when transitioning from C25 to C35 concrete, after which, further increases in the elastic modulus have a negligible effect on the coefficient. Conversely, while the coefficient is inversely proportional to the Poisson’s ratio, this relationship is not sensitive to variations in the Poisson’s ratio.
Author Contributions
Funding
Institutional Review Board Statement
Informed Consent Statement
Data Availability Statement
Conflicts of Interest
References
- Basack, S.; Goswami, G.; Dai, Z.-H.; Baruah, P. Failure-mechanism and design techniques of offshore wind turbine pile foundation: Review and research directions. Sustainability 2022, 14, 12666. [Google Scholar] [CrossRef]
- Nie, R.S.; Tang, S.M.; Leng, W.M.; Yang, Q.; Cheng, L.H. Field measurement of high-speed train-induced vertical loads on bridge pile foundations. J. China Railw. Soc. 2017, 9, 148–154. [Google Scholar]
- Wang, J.; Wang, X.; Liu, T.; Ye, A. Seismic uplift behavior and energy dissipation mechanism of scoured bridge pile-group foundations: Quasi-static test and numerical analysis. Ocean. Eng. 2022, 266, 113172. [Google Scholar] [CrossRef]
- Randolph, M.F.; Wroth, C.P. Analysis of deformation of vertically loaded piles. J. Geotech. Geoenviron. Eng. 1978, 104, 1465–1488. [Google Scholar] [CrossRef]
- Han, F.; Salgado, R.; Prezzi, M.; Lim, J. Shaft and base resistance of non-displacement piles in sand. Comput. Geotech. 2017, 83, 184–197. [Google Scholar] [CrossRef]
- Ai, Z.Y.; Han, J. Boundary element analysis of axially loaded piles embedded in a multi-layered soil. Comput. Geotech. 2009, 36, 427–434. [Google Scholar] [CrossRef]
- Huynh, V.-H.; Nguyen, T.; Nguyen, D.-P.; Huynh, T.-M.; Nguyen, T.-C. A novel direct SPT method to accurately estimate ultimate axial bearing capacity of bored PHC nodular piles with 81 case studies in Vietnam. Soils Found. 2022, 62, 101163. [Google Scholar] [CrossRef]
- Hamzeloo, S.R.; Shamshirsaz, M.; Rezaei, S.M. Damage detection on hollow cylinders by Electro-Mechanical Impedance method: Experiments and Finite Element Modeling. Comput. Rendus Mécanique 2012, 340, 668–677. [Google Scholar] [CrossRef]
- Li, Q.; Yang, Z.J. P–Y approach for laterally loaded piles in frozen silt. J. Geotech. Geoenviron. Eng. 2017, 143, 04017001. [Google Scholar] [CrossRef]
- Gao, X.J.; Wang, J.C.; Zhu, X.R. Static load test and load transfer mechanism study of squeezed branch and plate pile in collapsible loess foundation. J. Zhejiang Univ. 2007, 8, 1110–1117. [Google Scholar] [CrossRef]
- Lai, T.; Zhang, Y.; Zhou, Q.; Yang, J. Field test study on the changes of water, heat, salt, stress and their mutual influence of CFG pile composite foundation in saline soil. Oxid. Commun. 2016, 39, 1215–1225. [Google Scholar]
- Peng, B.; Xu, L.; Connolly, D.P.; Li, Z.; He, X.; Xiao, Y.; Guo, Y. Railway bridge dynamics considering piled foundations in soft soil. Soil Dyn. Earthq. Eng. 2024, 184, 0267–7261. [Google Scholar] [CrossRef]
- Farfani, H.A.; Behnamfar, F.; Fathollahi, A. Dynamic analysis of soil-structure interaction using the neural networks and the support vector machines. Expert Syst. Appl. 2015, 42, 8971–8981. [Google Scholar] [CrossRef]
- Nguyen, T.; Ly, D.K.; Huynh, T.Q.; Nguyen, T.T. Soft computing for determining base resistance of super-long piles in soft soil: A coupled SPBO-XGBoost approach. Comput. Geotech. 2023, 162, 105707. [Google Scholar] [CrossRef]
- Moayedi, H.; Hayati, S. Applicability of a CPT-based neural network solution in predicting load-settlement responses of bored pile. Int. J. Geomech. 2018, 18, 6018009. [Google Scholar] [CrossRef]
- Nejad, F.P.; Jaksa, M.B. Load-settlement behavior modeling of single piles using artificial neural networks and CPT data. Comput. Geotech. 2017, 89, 9–21. [Google Scholar] [CrossRef]
- Shahin, M.A. Load–settlement modeling of axially loaded steel driven piles using CPT-based recurrent neural networks. Soils Found. 2014, 54, 515–522. [Google Scholar] [CrossRef]
- Momeni, E.; Nazir, R.; Armaghani, D.J. Prediction of pile bearing capacity using a hybrid genetic algorithm-based ANN. Measurement 2014, 57, 122–131. [Google Scholar] [CrossRef]
- Román, Q.R.; Álamo, G.M.; Aznárez, J.J. Estimation of pile stiffness in non-homogeneous soils through Artificial Neural Networks. Eng. Struct. 2024, 308, 0141–0296. [Google Scholar]
- Cheng, S.; Gao, J.; Qi, H. Determination of the Pile Drivability Using Random Forest Optimized by Particle Swarm Optimization and Bayesian Optimizer. Comput. Model. Eng. Sci. 2024, 141, 871–892. [Google Scholar] [CrossRef]
- Wang, Z.; Zhou, J.; Du, K.; Khandelwal, M. Enhanced multi-task learning models for pile drivability prediction: Leveraging metaheuristic algorithms and statistical evaluation. Transp. Geotech. 2024, 47, 101288. [Google Scholar] [CrossRef]
- Yan, W.; Tang, R.; Wang, K.; Fu, H.; Chen, C.; Hu, Y. Reliability analysis of bridge pile foundation based on artificial intelligence settlement surrogate model. J. Railw. Sci. Eng. 2024, 21, 4588–4598. [Google Scholar]
- Liao, L.; Yang, X.; Wang, Y.; Wang, X. Research on optimization calculation method of railway bridge pile foundation. J. Railw. Eng. 2023, 40, 47–52. [Google Scholar]
- Nguyen, T.; Ly, D.K.; Shiau, J.; Nguyen-Dinh, P. Optimizing load-displacement prediction for bored piles with the 3mSOS algorithm and neural networks. Ocean Eng. 2024, 304, 117758. [Google Scholar] [CrossRef]
- Xu, X.; Li, Q.; Du, Z.; Rong, H.; Wu, T.; Wang, S.; Li, S.; Zheng, J. Recognition of concrete imperfections in underwater pile foundation based on binocular vision and YOLOv8. KSCE J. Civ. Eng. 2024; 100075, in press. [Google Scholar]
- Medina, C.; Álamo, G.; Padrón, L.; Aznárez, J.; Maeso, O. Application of regression models for the estimation of the flexible-base period of pile-supported structures in continuously inhomogeneous soils. Eng. Struct. 2019, 190, 76–89. [Google Scholar] [CrossRef]
- Zhang, J.; Hu, J.; Li, X.; Li, J. Bayesian network based machine learning for design of pile foundations. Autom. Constr. 2020, 118, 103–295. [Google Scholar] [CrossRef]
- Yousheng, D.; Keqin, Z.; Zhongju, F.; Wen, Z.; Xinjun, Z.; Huiling, Z. Machine learning based prediction model for the pile bearing capacity of saline soils in cold regions. Structures 2024, 59, 105735. [Google Scholar] [CrossRef]
- Hu, X.; Assaad, R.H.; Hussein, M. Discovering key factors and causalities impacting bridge pile resistance using Ensemble Bayesian networks: A bridge infrastructure asset management system. Expert Syst. Appl. 2024, 238, 121677. [Google Scholar] [CrossRef]
- Cao, M.T.; Nguyen, N.M.; Wang, W.C. Using an evolutionary heterogeneous ensemble of artificial neural network and multivariate adaptive regression splines to predict bearing capacity in axial piles. Eng. Struct. 2022, 268, 114769. [Google Scholar] [CrossRef]
- Chen, W.; Sarir, P.; Bui, X.-N.; Nguyen, H.; Tahir, M.M.; Armaghani, D.J. Neuro-genetic, neuro-imperialism and genetic programing models in predicting ultimate bearing capacity of pile. Eng. Comput. 2019, 36, 1101–1115. [Google Scholar] [CrossRef]
- Harandizadeh, H.; Armaghani, D.J.; Khari, M. A new development of ANFIS–GMDH optimized by PSO to predict pile bearing capacity based on experimental datasets. Eng. Comput. 2019, 37, 685–700. [Google Scholar] [CrossRef]
- Kardani, N.; Zhou, A.; Nazem, M.; Shen, S.L. Estimation of bearing capacity of piles in cohesionless soil using optimized machine learning approaches. Geotech. Geol. Eng. 2019, 38, 2271–2291. [Google Scholar] [CrossRef]
- Nguyen, H.; Cao, M.T.; Tran, X.L.; Tran, T.H.; Hoang, N.D. A novel whale optimization algorithm optimized XGBoost regression for estimating bearing capacity of concrete piles. Neural Comput. Appl. 2023, 35, 3825–3852. [Google Scholar] [CrossRef]
- Amjad, M.; Ahmad, I.; Ahmad, M.; Wróblewski, P.; Kamiński, P.; Amjad, U. Prediction of pile bearing capacity using XGBoost algorithm: Modeling and performance evaluation. Appl. Sci. 2022, 12, 2126. [Google Scholar] [CrossRef]
- Maeso, O.; Aznárez, J.J.; García, F. Dynamic impedances of piles and groups of piles in saturated soils. Comput. Struct. 2005, 83, 769–782. [Google Scholar] [CrossRef]
- Lysmer, J.; Richart, F. Dynamic response of footings to vertical loading. ASCE J. Soil Mech. Found. Div. 1966, 92, 65–91. [Google Scholar] [CrossRef]
- Ministry of Housing and Urban-Rural Development of the People’s Republic of China. Technical Code for Testing of Building Foundation Piles (JGJ106-2014); China Architecture and Building Press: Beijing, China, 2014.
- Liu, J.; Cheng, Y.; Li, L. Experimental study on the dynamic stiffness of pier-cap-pile foundation system. Railw. Stand. Des. 2018, 62, 73–76. [Google Scholar]
- Song, N. Study on Dynamic Stiffness Characteristics of Existing Bridge Pier Foundation; China Academy of Railway Sciences Corporation Limited: Beijing, China, 2020. [Google Scholar]


| Name of Soil Layer | Thickness/m | Density/(kg·m−3) | Force of Cohesion/(kPa) | Angle of Internal Friction | Poisson Ratio | Dynamic Elastic Modulus/MPa |
|---|---|---|---|---|---|---|
| Plain fill | 3 | 1800 | 28.8 | 24.2 | 0.32 | 121 |
| Mild clay | 4.1 | 2050 | 83 | 18.4 | 0.41 | 215 |
| Silt | 1.9 | 1930 | 9 | 31.1 | 0.31 | 180 |
| Mild clay | 16 | 2050 | 83 | 18.4 | 0.41 | 215 |
| Pebble bed | 3 | 2000 | 32.5 | 31.3 | 0.26 | 230 |
| Clay | ∞ | 2200 | 50.2 | 20.5 | 0.40 | 449 |
| Algorithm Type | Optimal Function | RMSE | R2 | MSE | MAE | Frequency of Training |
|---|---|---|---|---|---|---|
| Linear regression | Robust regression | 0.036 | 0.93 | 0.001 | 0.025 | 2959 |
| Decision tree | Subdivision tree | 0.121 | 0.34 | 0.014 | 0.088 | 2456 |
| SVM | Secondary SVM | 0.066 | 0.91 | 0.004 | 0.05 | 6323 |
| Gaussian process regression | Matern 3/2 GPR | 0.032 | 0.95 | 0.001 | 0.020 | 3856 |
| Hybrid tree | Boosted tree | 0.157 | 0.11 | 0.024 | 0.133 | 4400 |
| Algorithm Type | Optimal Function | RMSE | R2 | MSE | MAE | Frequency of Training |
|---|---|---|---|---|---|---|
| Linear regression | Robust regression | 0.106 | 0.77 | 0.0111 | 0.089 | 1621 |
| Decision tree | Subdivision tree | 0.153 | 0.51 | 0.0233 | 0.130 | 2163 |
| SVM | Secondary SVM | 0.066 | 0.91 | 0.004 | 0.05 | 6323 |
| Gaussian process regression | Matern 3/2 GPR | 0.053 | 0.94 | 0.003 | 0.035 | 3268 |
| Hybrid tree | Boosted tree | 0.214 | 0.03 | 0.045 | 0.17 | 2891 |
| Algorithm Type | Optimal Function | RMSE | R2 | MSE | MAE | Frequency of Training |
|---|---|---|---|---|---|---|
| Linear regression | Linear regression | 0.097 | 0.78 | 0.009 | 0.074 | 1660 |
| Decision tree | Subdivision tree | 0.164 | 0.38 | 0.027 | 0.131 | 1890 |
| SVM | Secondary SVMR | 0.062 | 0.92 | 0.004 | 0.048 | 1855 |
| Gaussian process regression | Exponential Gaussian | 0.084 | 0.84 | 0.007 | 0.061 | 5568 |
| Hybrid tree | Boosted tree | 0.200 | 0.07 | 0.04 | 0.16 | 1485 |
Disclaimer/Publisher’s Note: The statements, opinions and data contained in all publications are solely those of the individual author(s) and contributor(s) and not of MDPI and/or the editor(s). MDPI and/or the editor(s) disclaim responsibility for any injury to people or property resulting from any ideas, methods, instructions or products referred to in the content. |
© 2025 by the authors. Licensee MDPI, Basel, Switzerland. This article is an open access article distributed under the terms and conditions of the Creative Commons Attribution (CC BY) license (https://creativecommons.org/licenses/by/4.0/).
Share and Cite
Cao, Y.; Ni, J.; Chen, J.; Geng, Y. Rapid Evaluation Method to Vertical Bearing Capacity of Pile Group Foundation Based on Machine Learning. Sensors 2025, 25, 1214. https://doi.org/10.3390/s25041214
Cao Y, Ni J, Chen J, Geng Y. Rapid Evaluation Method to Vertical Bearing Capacity of Pile Group Foundation Based on Machine Learning. Sensors. 2025; 25(4):1214. https://doi.org/10.3390/s25041214
Chicago/Turabian StyleCao, Yanmei, Jiangchuan Ni, Jianguo Chen, and Yefan Geng. 2025. "Rapid Evaluation Method to Vertical Bearing Capacity of Pile Group Foundation Based on Machine Learning" Sensors 25, no. 4: 1214. https://doi.org/10.3390/s25041214
APA StyleCao, Y., Ni, J., Chen, J., & Geng, Y. (2025). Rapid Evaluation Method to Vertical Bearing Capacity of Pile Group Foundation Based on Machine Learning. Sensors, 25(4), 1214. https://doi.org/10.3390/s25041214