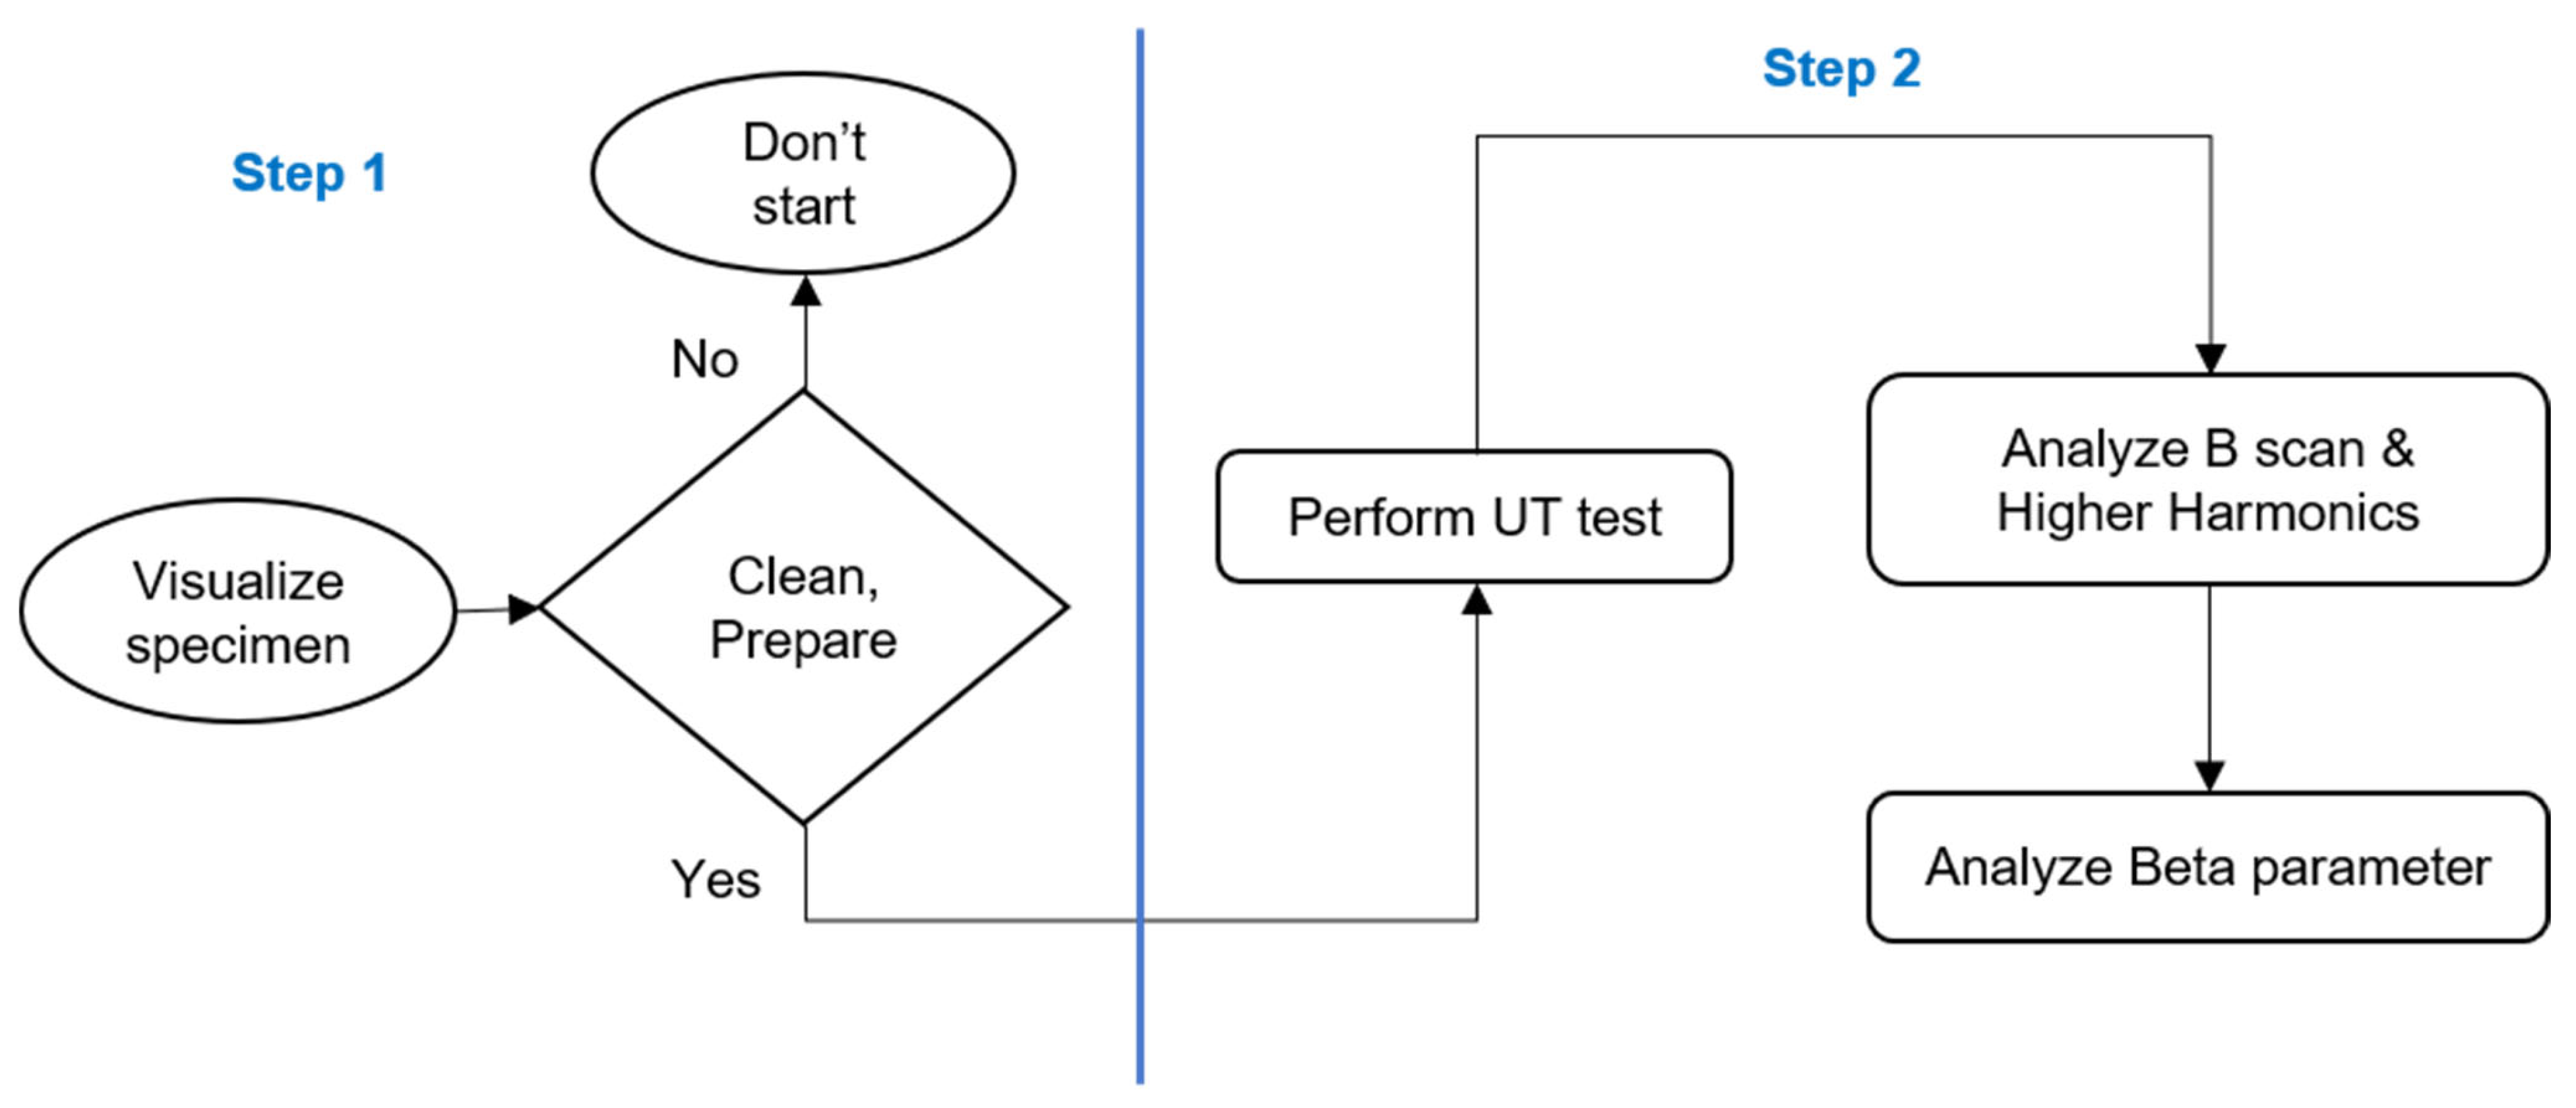
1. Introduction
Residual stresses within steel components can significantly impact their mechanical properties, performance, and longevity. Accurate analysis of these stresses [
1] is essential for ensuring the reliability of steel rolls and bars used in various industrial applications. Traditional methods like X-ray diffraction (XRD) and coercive force measurements have been instrumental in assessing residual stresses. However, these techniques often face limitations in detecting subsurface stresses and capturing detailed microstructural changes, particularly in regions below the surface where XRD typically focuses. Nonlinear ultrasonics offers a promising alternative by probing deeper into the material and providing insights into subsurface residual stresses and associated microstructural variations at greater depths, which conventional non-destructive testing (NDT) methods cannot visualise. Unlike traditional methods, nonlinear ultrasonics can detect subtle stress-induced changes that are sometimes missed by XRD and coercivity measurements.
Various researchers worked on nonlinear ultrasonics to check the residual stress in structures. Ultrasonic nonlinear analysis in steel plates was conducted by Jiao et al. using a collinear Lamb wave mixing technique [
2], which analysed residual stress measurements. A finite element modelling (FEM) study paper by Jiang et al. simulated stress distributions in multilayer composites [
3], showcasing the efficacy of acoustoelastic effects in detecting stress variations across different layers. Sampath et al. explored the application of nonlinear ultrasonics for depth profiling [
4], demonstrating how this method can effectively map residual stress distributions in surface-treated metallic structures. The paper by Geimer et al. introduces white-noise excitation as a novel approach for in situ stress analysis [
5], highlighting the role of nonlinear parameters in enhancing the detection of stress variations.
Kim et al. developed theoretical insights and practical applications of nonlinear ultrasonic phenomena [
6], providing a foundation for understanding material behaviour under stress and during microstructural changes. Gao et al. [
7] developed an analytical model linking acoustic nonlinearity to dislocation characteristics, which is crucial for understanding the microstructural impact on ultrasonic wave propagation. Song et al. [
8] discuss high-energy ultrasonic methods used for both the detection and regulation of residual stress in aluminium alloys, emphasizing the dual functionality of these techniques. Mao et al. in [
9] investigate the use of critically refracted longitudinal waves for steady-state stress evaluation, showcasing their ability to provide accurate stress measurements under constant loading conditions. Dunn et al. [
10] highlighted the effectiveness of vibro-ultrasonic techniques in detecting damage within composite laminates, particularly in regions with pre-existing stress concentrations.
Kim et al. explored the sensitivity of nonlinear ultrasonic methods [
11] to microstructural changes due to second-phase precipitation, which is crucial for monitoring ageing and degradation processes. Kim et al. studied ultrasonic nonlinearity in response to changes in prestress [
12] within the concrete, offering an NDT method to evaluate structural integrity. Zhang et al. in [
13] evaluated the feasibility of using nonlinear properties of critically refracted waves for residual stress detection, presenting a novel approach for NDT. Yee et al. proposed cross-correlation filtering in [
14] to improve nonlinear ultrasonic measurements during fatigue testing, which is critical for monitoring material degradation. Yan et al. investigated the relationship between stress and nonlinear ultrasonic coefficients in 2024 aluminium [
15], providing insights into stress monitoring in aerospace applications.
Nilsson et al. studied corrosion [
16] in steel structures using nonlinear ultrasonics and tried to correlate the nonlinear parameters with corrosion degradation. Yan et al. developed a method of exciting reversed-phase Rayleigh waves in opposite directions [
17] and identified a remarkable increase in the acoustic non-linearity parameter. The research paper [
18] uses a noncontact technique using air-coupled transducers for detecting fatigue cracks in rotating steel shafts. By generating ultrasonic waves at two distinct frequencies, the presence of a crack is identified through nonlinear modulation. The research paper in [
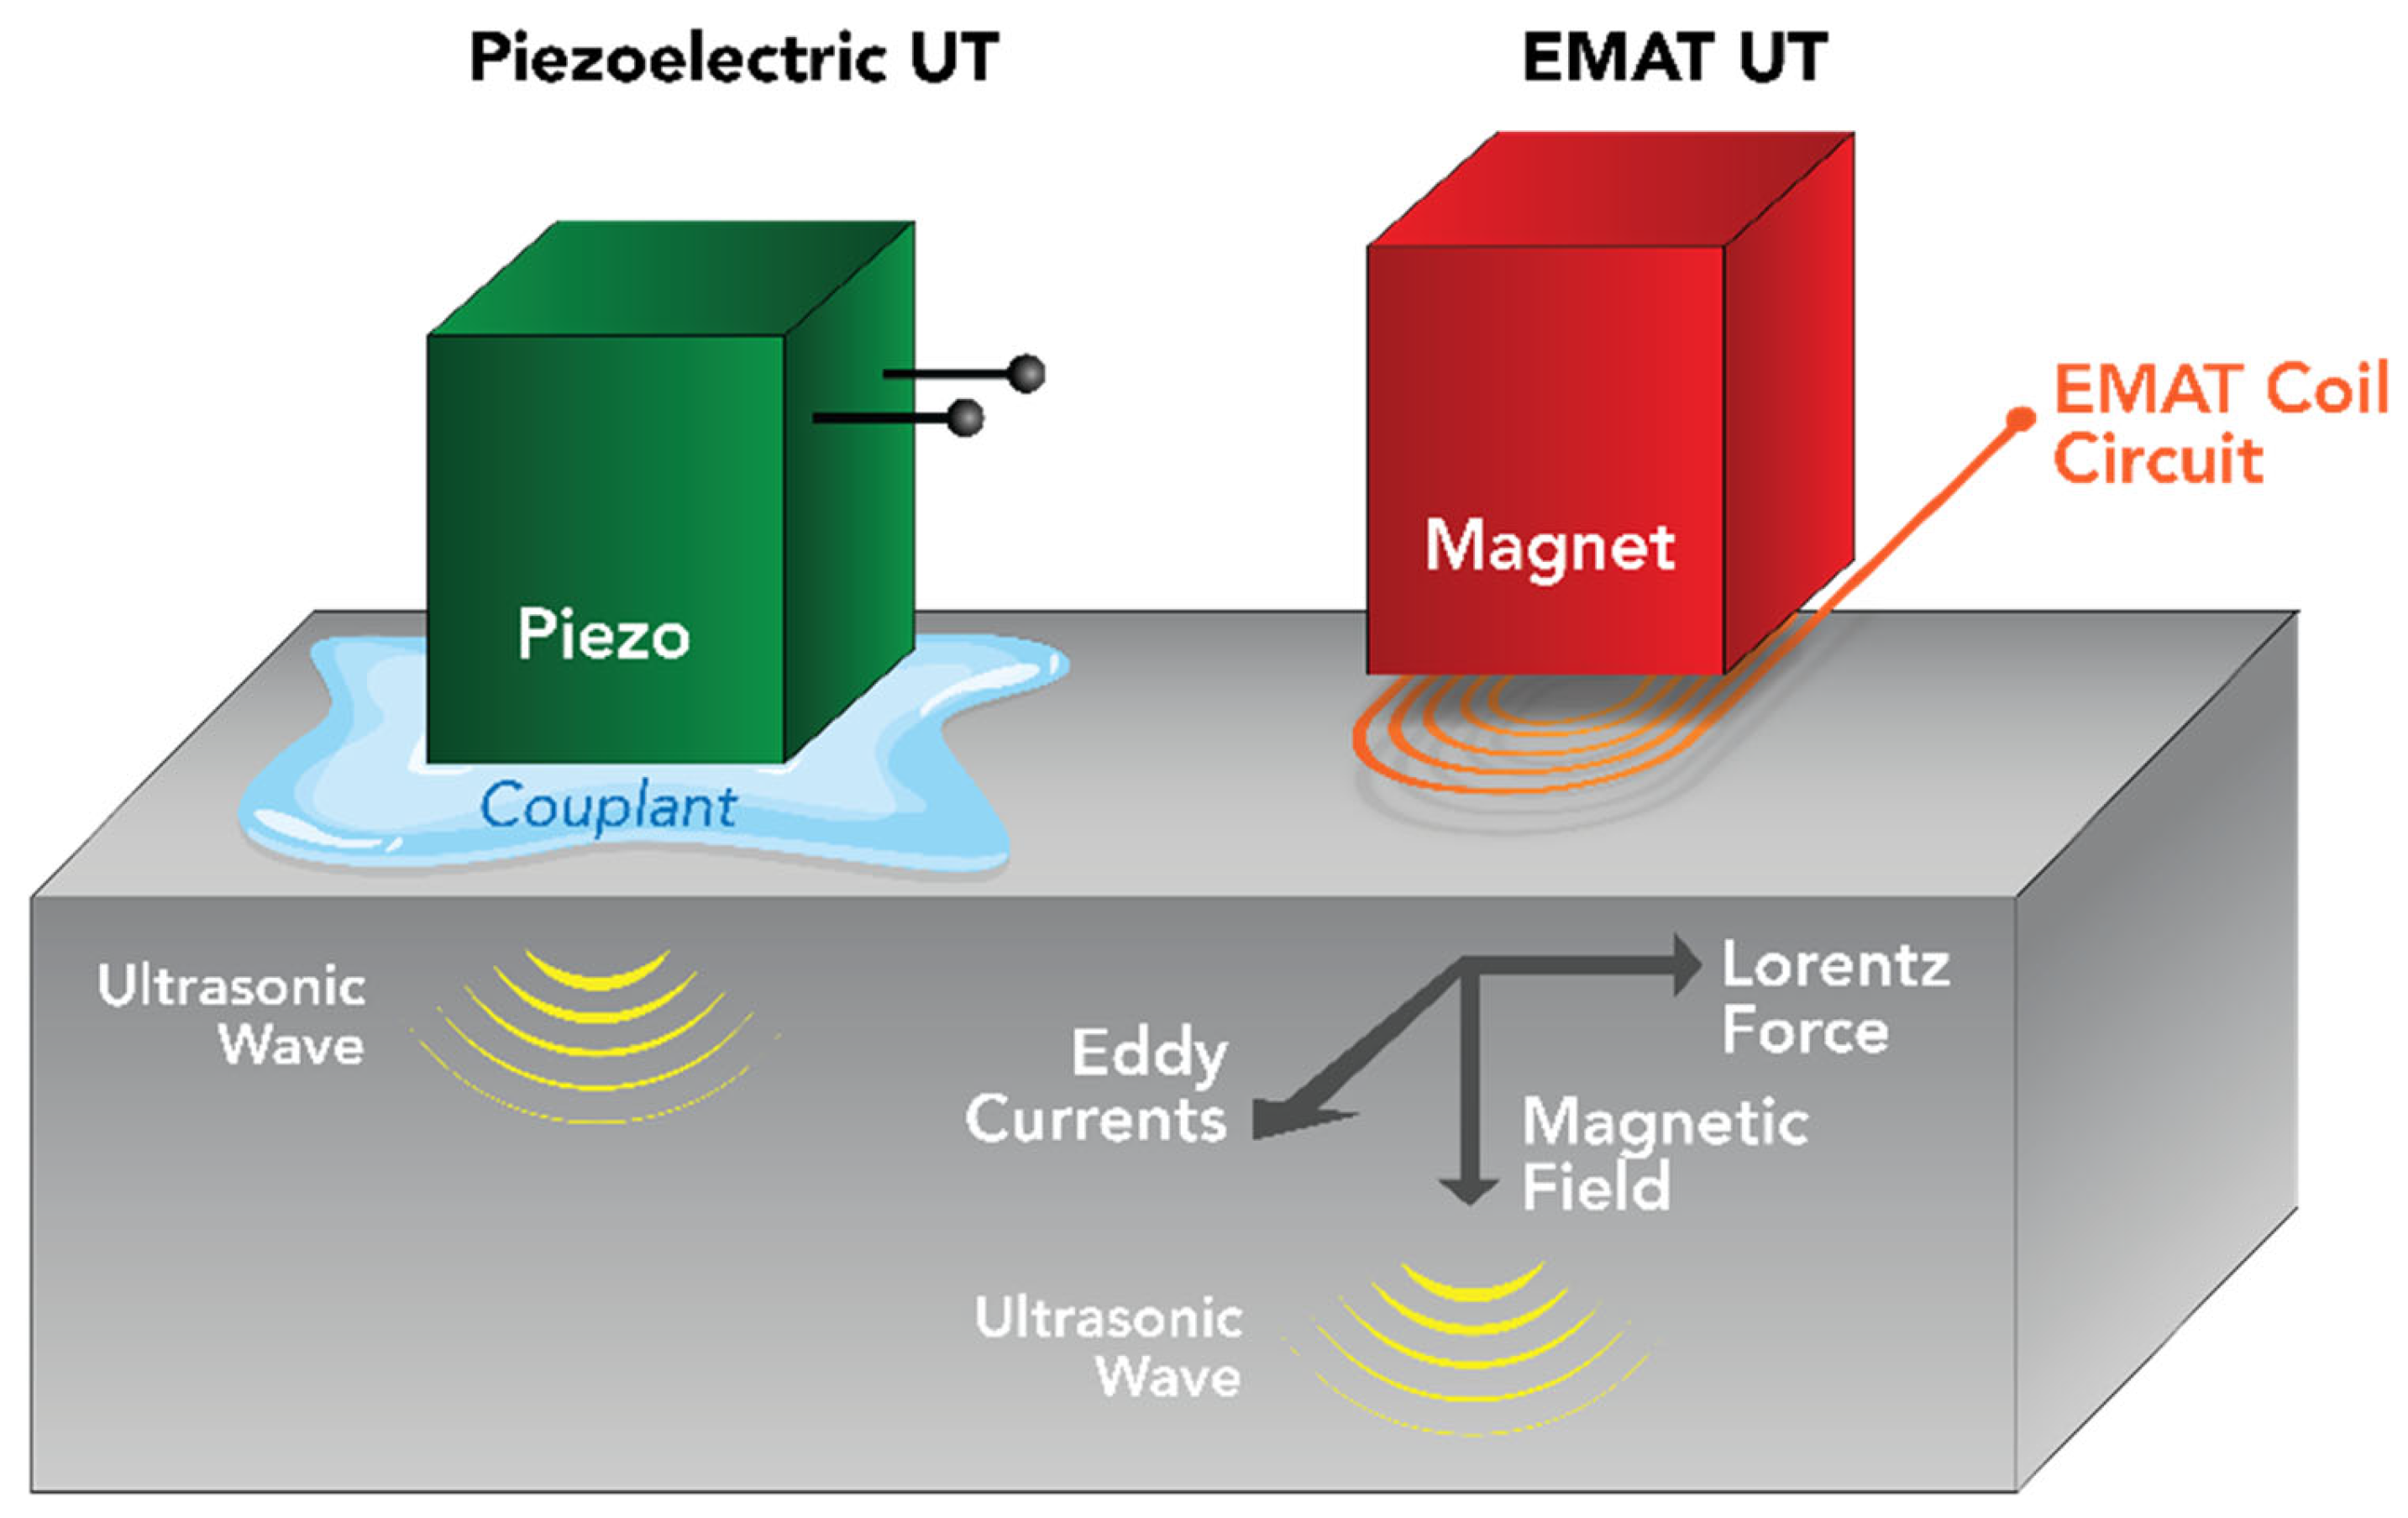
19] studied the nonlinear guided wave propagation in prestressed aluminium plates associated with the second harmonic generation by using 2D FEM simulations. The model employed is a second-order approximation accounting for material and geometric nonlinearities. The best-identified electromagnetic acoustic transducer (EMAT) paper [
20] on nonlinear ultrasonics uses only the second harmonics and the birefringence approach as a monitoring parameter and correlates cuts in the structures with harmonics. The very recent publication [
21] uses the birefringence theory [
22] for monitoring residual stresses in rail wheels.
Each paper contributes to advancing ultrasonic testing techniques for residual stress analysis, impacting material evaluation, structural health monitoring and industrial applications. By integrating theoretical models, advanced signal processing and practical testing, these studies highlight the potential of nonlinear ultrasonics to improve the accuracy and efficiency of residual stress measurements across various materials. However, several drawbacks remain:
Firstly, despite its potential, EMAT technology [
23] has not been extensively utilized or compared with methods like XRD or coercivity measurements in residual stress analysis. There is an opportunity to fully explore EMAT, particularly in non-contact and hard-to-reach environments, and to conduct comparative studies with established techniques.
Secondly, many EMAT studies, such as the one referenced in [
20], focus narrowly on second harmonics in plates and some focus on the birefringence [
23] theory-based solutions (pointwise residual stress analysis). This limits the understanding of EMAT’s broader capabilities in capturing complex stress distributions and microstructural changes. Future research could benefit from exploring additional nonlinear parameters or higher-order harmonics to gain deeper insights into material behaviour under stress.
Thirdly, there is a lack of comprehensive studies comparing nonlinear ultrasonic techniques across various materials and stress conditions. Such comparative research could identify the most effective methods for specific industrial applications, especially in steel manufacturing, where precise residual stress monitoring is crucial. Finally, while some papers concentrate on theoretical modelling or practical applications of nonlinear ultrasonics, there is limited integration between these approaches. Bridging this gap could lead to more robust models that better predict real-world stress distributions, thus improving residual stress measurement accuracy. Most of the proposed methods were time-consuming and were mostly pointwise applications, meaning they were not used for a continuous monitoring process using the NDT technology.
Addressing existing gaps in residual stress analysis presents a significant opportunity to advance the understanding, application, and comparison of nonlinear ultrasonic techniques, especially in critical industries. This research paper is particularly noteworthy as it emphasizes the use of nonlinear ultrasonics generated from transmitting Rayleigh waves [
24] through an EMAT device, for early-stage residual stress monitoring in larger industrial steel structures. To the authors’ knowledge, this study is the first to apply EMAT-based nonlinear ultrasonics for monitoring large industrial steel structures using continuous assessment and to perform a comparative pointwise analysis of industrial samples with traditional NDT methods, such as XRD and coercive force analysis, against the EMAT nonlinear method.
The research demonstrates a positive trend between β (non-dimensional parameter) and XRD between the nonlinear ultrasonic methods and conventional techniques, underscoring the potential of nonlinear ultrasonics for testing larger steel structures. By offering a comparative evaluation, the study highlights the advantages of nonlinear ultrasonics in terms of sensitivity and depth of analysis. This approach not only enhances the understanding of stress distributions within steel components but also provides a more comprehensive view of their structural integrity. The findings from this research emphasize the significant potential of nonlinear ultrasonics as a valuable tool for residual stress analysis. The insights gained could lead to improvements in material performance and extend the lifespan of steel components in industrial settings.
2. Nonlinear Ultrasonics
The acoustoelastic effect [
25] is a useful technique for determining stress within solid materials. This method is based on the fundamental principle that the application of stress or mechanical load alters the propagation of ultrasonic waves through the material. One of the most noticeable consequences of the acoustoelastic effect, particularly in isotropic solid materials, is the emergence of acoustic anisotropy under stress. This phenomenon results in the formation of two distinct shear modes, each with its own velocity and polarization relative to the direction of the applied stress.
The two stress-induced shear modes have different velocities. The difference in shear wave velocities causes a phenomenon known as birefringence [
22] theory. Birefringence is the splitting of a single incident ultrasound wave into two separate waves, each moving at its own speed. The relative shear-wave velocity difference, denoted as ‘a’ and expressed as ∆V/V, is an important parameter in this context. It is critical for quantifying the extent of stress-induced anisotropy while also accounting for any inherent material anisotropy. Equation (1) is used to calculate absolute stress (σ) in a material:
where ‘K’ is the acoustoelastic constant. This constant, ‘K,’ is important in stress calculations and can be determined only experimentally. The formula for ‘K’ is 8μ
2/(4μ + n), where ‘μ’ signifies the material’s shear modulus, and ‘n’ corresponds to Murnaghan’s third-order elastic modulus. It is worth noting that ‘n’ reflects the material’s non-linear behaviour arising from stress.
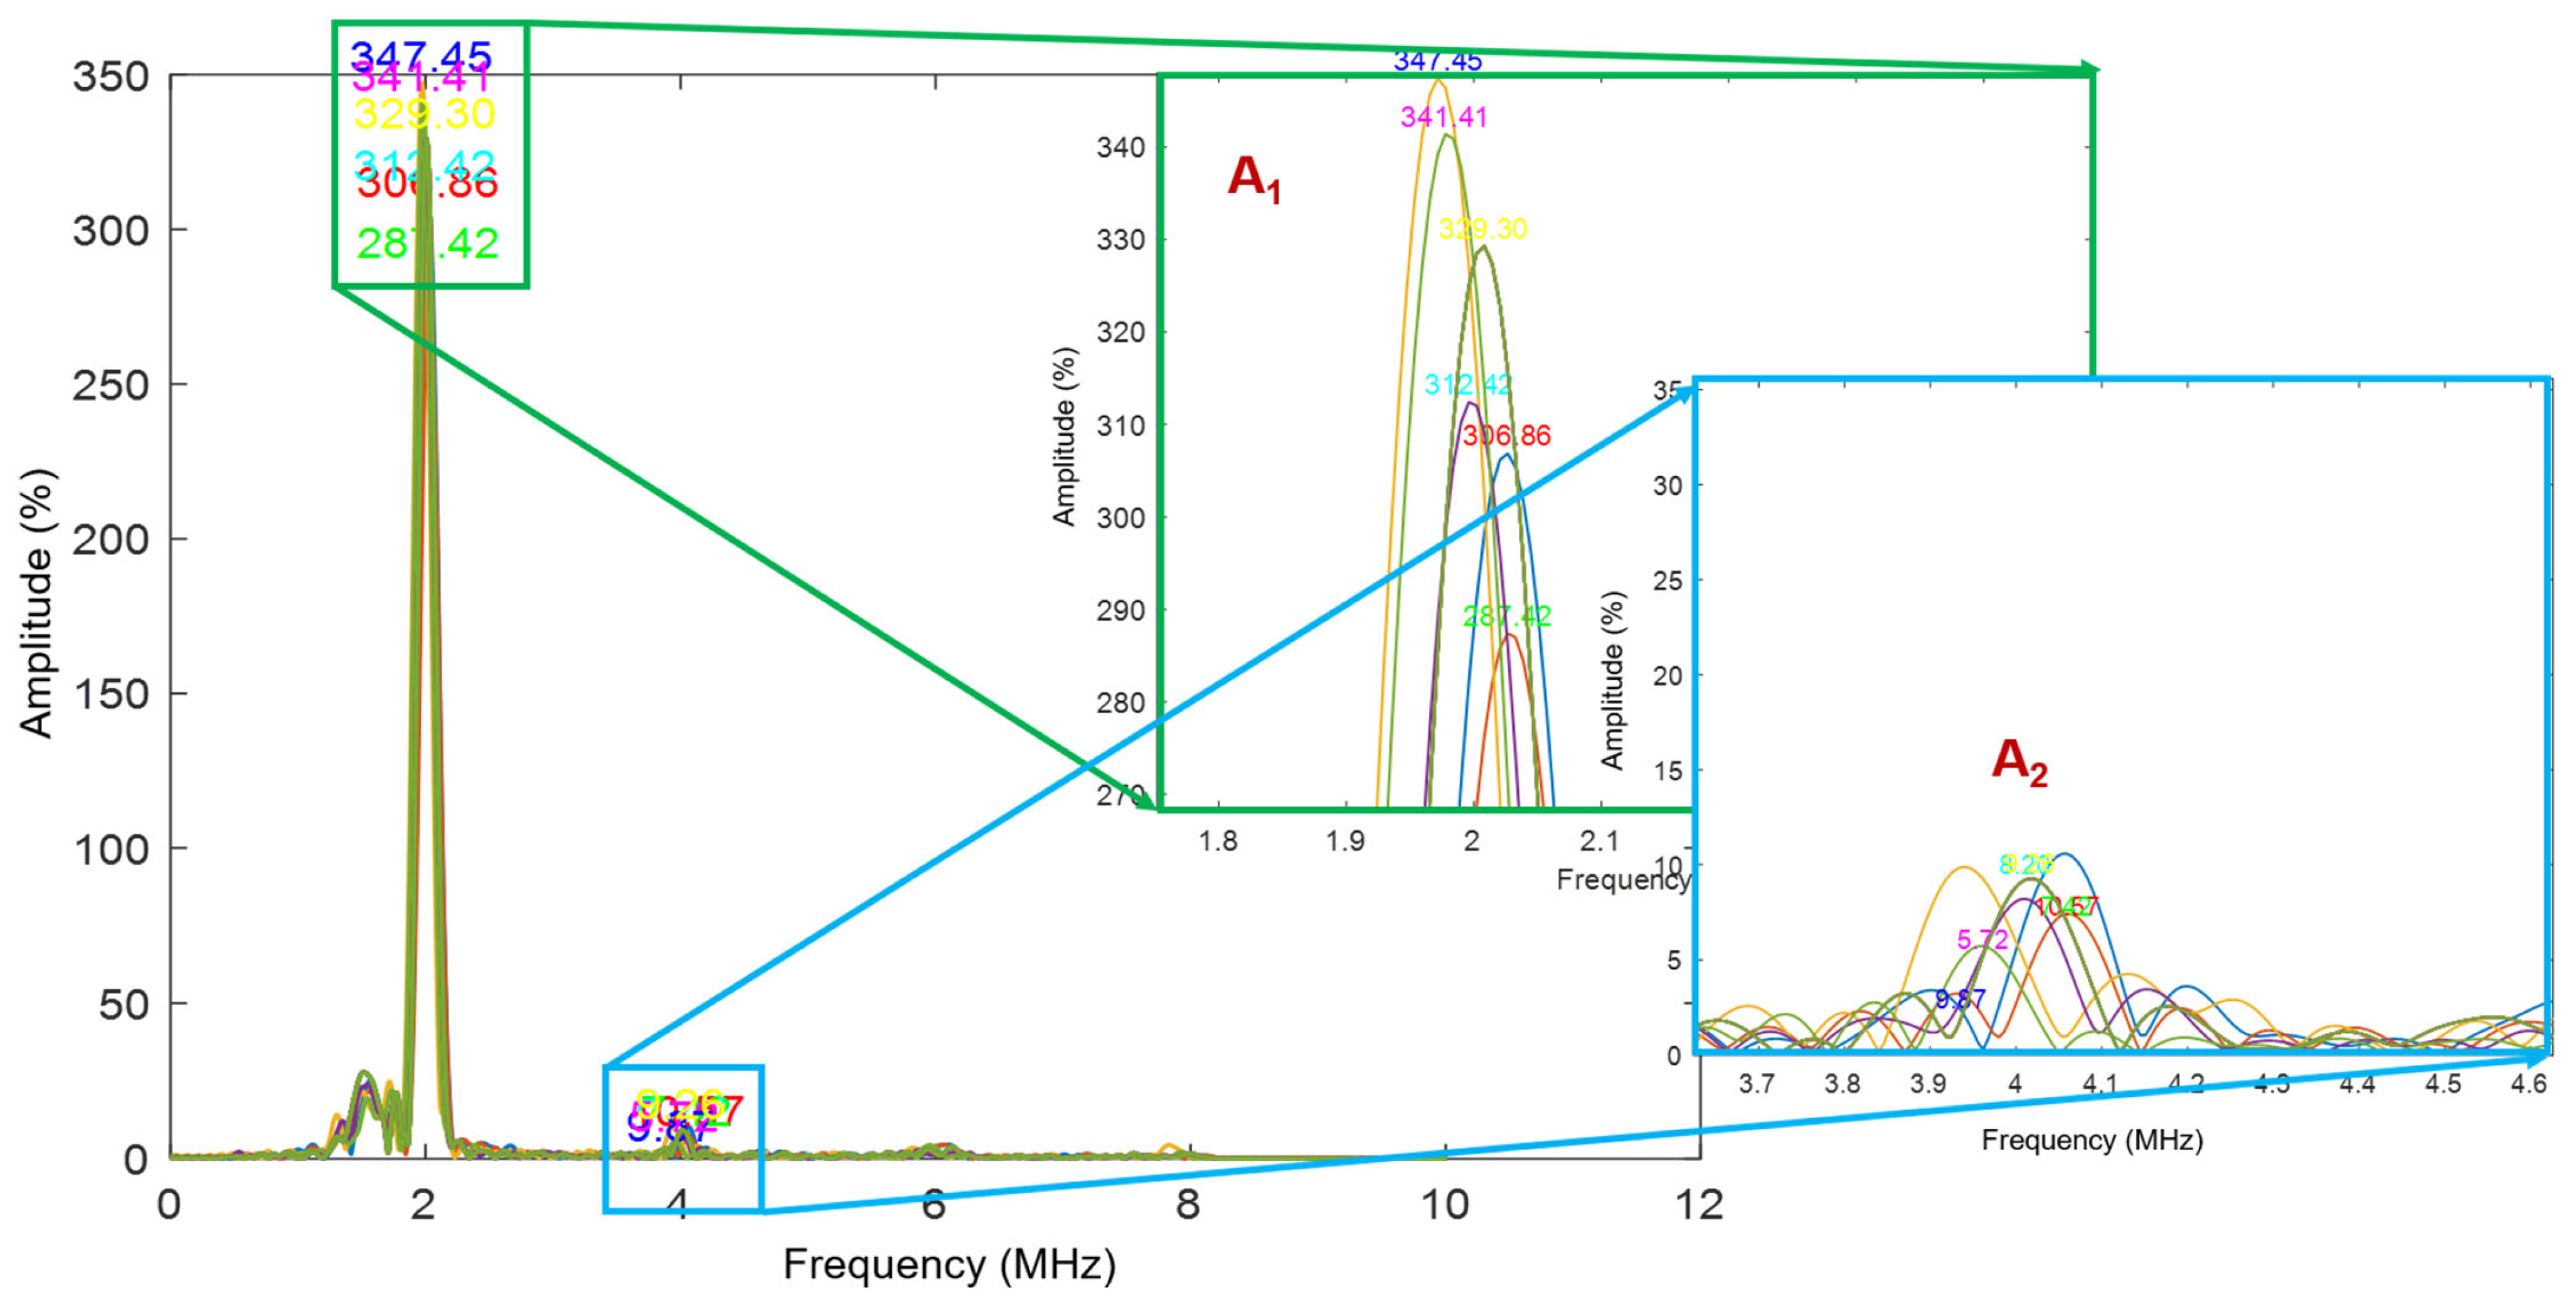
The presence of residual stress within the samples introduces non-linearity into the system, leading to the generation of higher harmonics in the Rayleigh waves, as depicted in the exemplary
Figure 1 (A
2). In nonlinear ultrasonic signal processing, a single-frequency ultrasonic wave (A
1) is sent into a material. In a perfectly elastic (linear) medium, the received signal contains only this fundamental frequency. However, when the material has stresses or microstructural defects such as microcracks, dislocations, or voids, it behaves nonlinearly. This nonlinearity causes part of the energy from the fundamental wave to transfer into higher harmonics, primarily the second harmonic (A
2) at twice the original frequency. By analyzing the amplitudes of A
1 and A
2 typically through the Fourier transform and computing their ratio (A
2/A
12), the level of material nonlinearity can be quantified.
In cases when the material under investigation is extremely thick or elongated, traditional stress measurement methods based on bulk shear waves may be ineffective. In such cases, researchers consider Rayleigh waves as an alternative. To quantify this non-linearity and its relationship to residual stress [
15], the study employed Equation (2):
In this equation, ‘β’ (beta) represents the non-linearity parameter (a non-dimensional value), and it is directly proportional to the relative residual stress present in the material. A
1 is the fundamental frequency (1st harmonics), and A
2 is the second harmonics (as shown in
Figure 1). The parameter is determined by measuring both the amplitude of the main lobe and the harmonics within the Fast Fourier Transform (FFT) [
24] of the Rayleigh wave signals, which are obtained by taking the main signal of the obtained Rayleigh waves in the time domain and converting it to the frequency domain. More details about the time-frequency conversion are shown in
Section 4.2.1. This approach allows for continuous relative residual stress level monitoring in the examined materials.
3. Specimens: Laboratory and Industrial
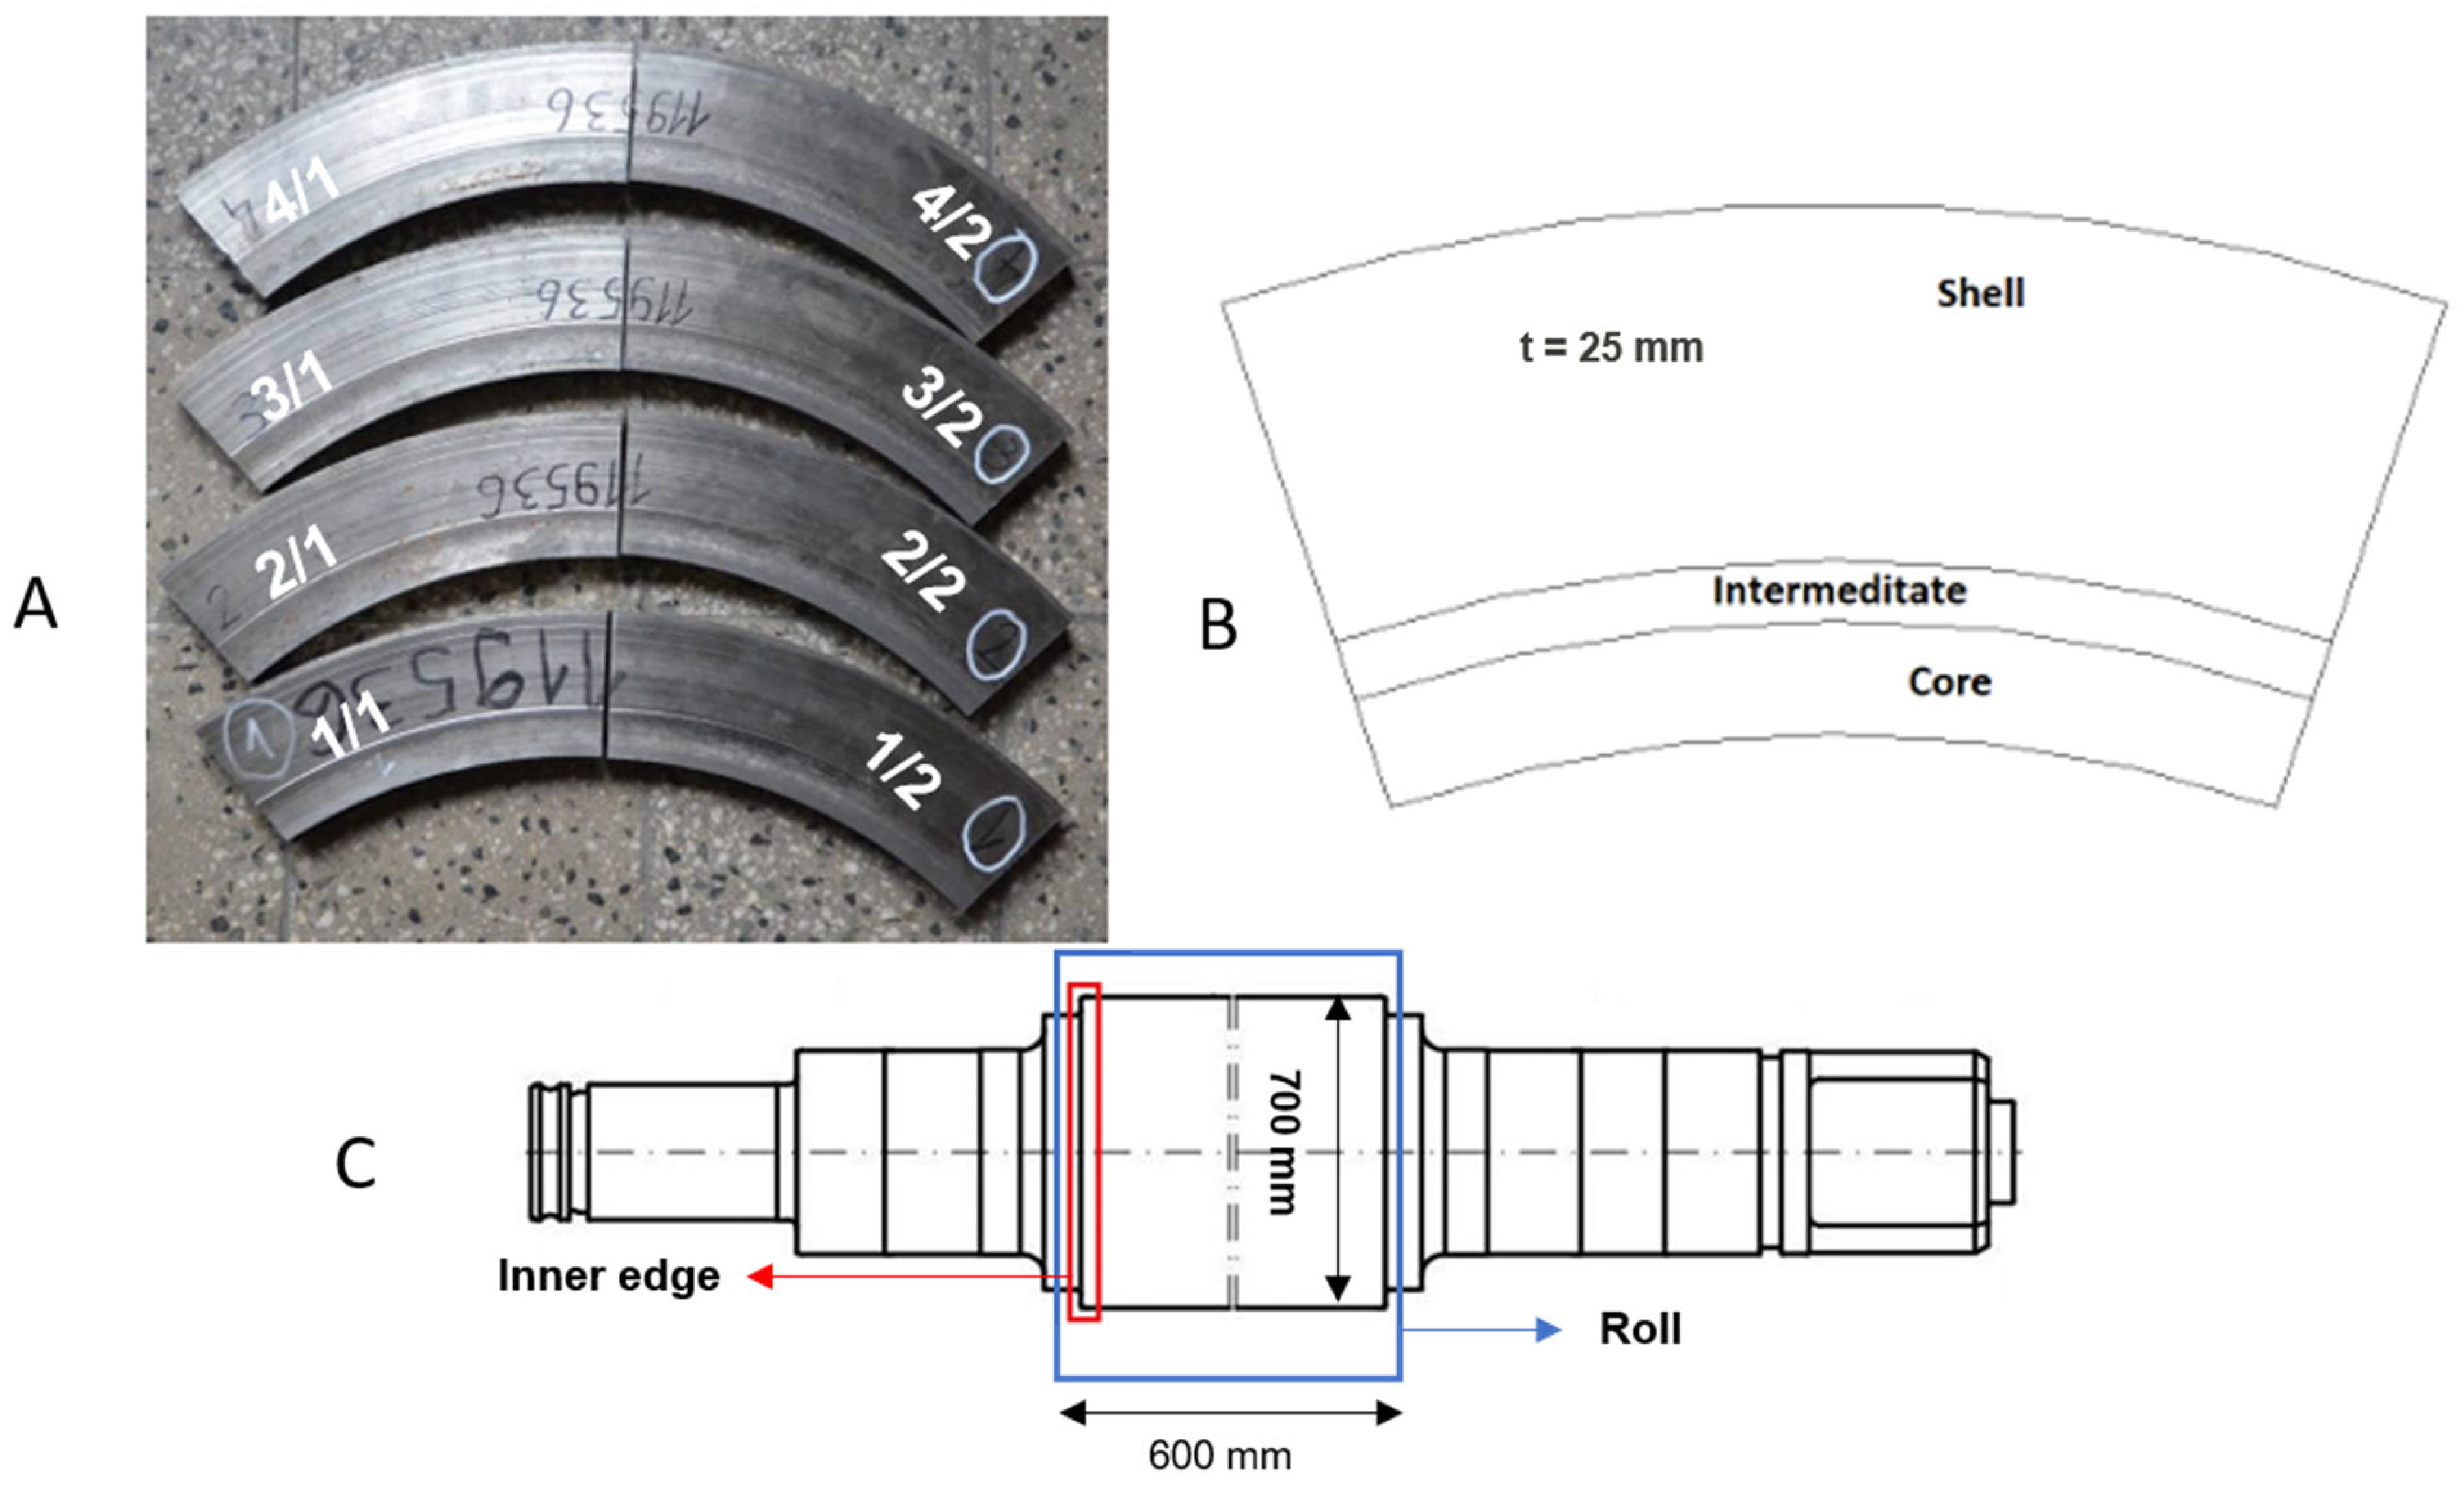
The roll ring samples provided by Valji d.o.o, Slovenia, were cut into four segments in the shape of a ring (
Figure 2A) prepared from the rolled shell as shown in
Figure 2B with a Young’s modulus (E) value of 210 GPa and Poisson’s ratio (ν) of 0.29. The segments were cut from the surface of the roll and contained the working layer (
Figure 2C), the whole transition or intermediate layer, and a small portion of the core material. The ring was cut out before the roll was heated to introduce different levels of residual stress after laboratory heat treatment. According to the information from the supplier of testing pieces, the roll’s heat treatment consists of austenitization at 950 °C and subsequent tempering at 550 °C.
To develop the requested different levels of internal (residual) stress, three cooling regimes of the delivered segments were chosen: quenching into the water, quenching into oil and air cooling. The different heat treatments produce distinct microstructures (e.g., variations in phase, grain size, and dislocation density), which affect the material’s elastic nonlinearity. As a result, the nonlinear ultrasonic signals reflect not only residual stresses but also microstructural differences.
The three delivered samples were divided into two halves by the spark discharge method (EDM) to get pairs of samples in the as-quenched and tempered state. The EDM process minimizes the mechanical and thermal effects. This process causes negligible stress relaxation, and measurements were taken at the central regions, well away from cut edges. Therefore, the prestress field in the specimens was not significantly affected by the removal process. The last segment (segment No. 1/1, 1/2—marked in
Figure 2A) was left in the as-delivered state and served as the reference material. The heat-treatment parameters for the individual segments listed in
Table 1 are provided by Materials and Metallurgical Research sro (MMV) in the Czech Republic.
Steel cylindrical rods Ø 31 × 300 mm made from the steel 41CrMo4FD were obtained from Sidenor S.L., Spain, in the as-rolled state (see
Figure 3) with a Young’s modulus (E) value of 210 GPa and Poisson’s ratio (ν) of 0.29. All these samples were heat-treated to develop different residual stresses by different heat treatment modes, and are used to evaluate the behaviour of the developed sensors to different magnitudes of stress.
To introduce different levels of internal stress, several heat treatment modes were performed based on austenitization at 880 °C and subsequent tempering at 520 °C. Different heat treatments were chosen: stress relieving, quenching into oil (OQ), quenching into water (WQ), Furnace cooling (FC) and air cooling (AC). The delivered rods were cut into two identical halves to get a set of just quenched and quenched and tempered pairs of samples. Parameters of the individual heat treatment modes of rods are stated in
Table 2.
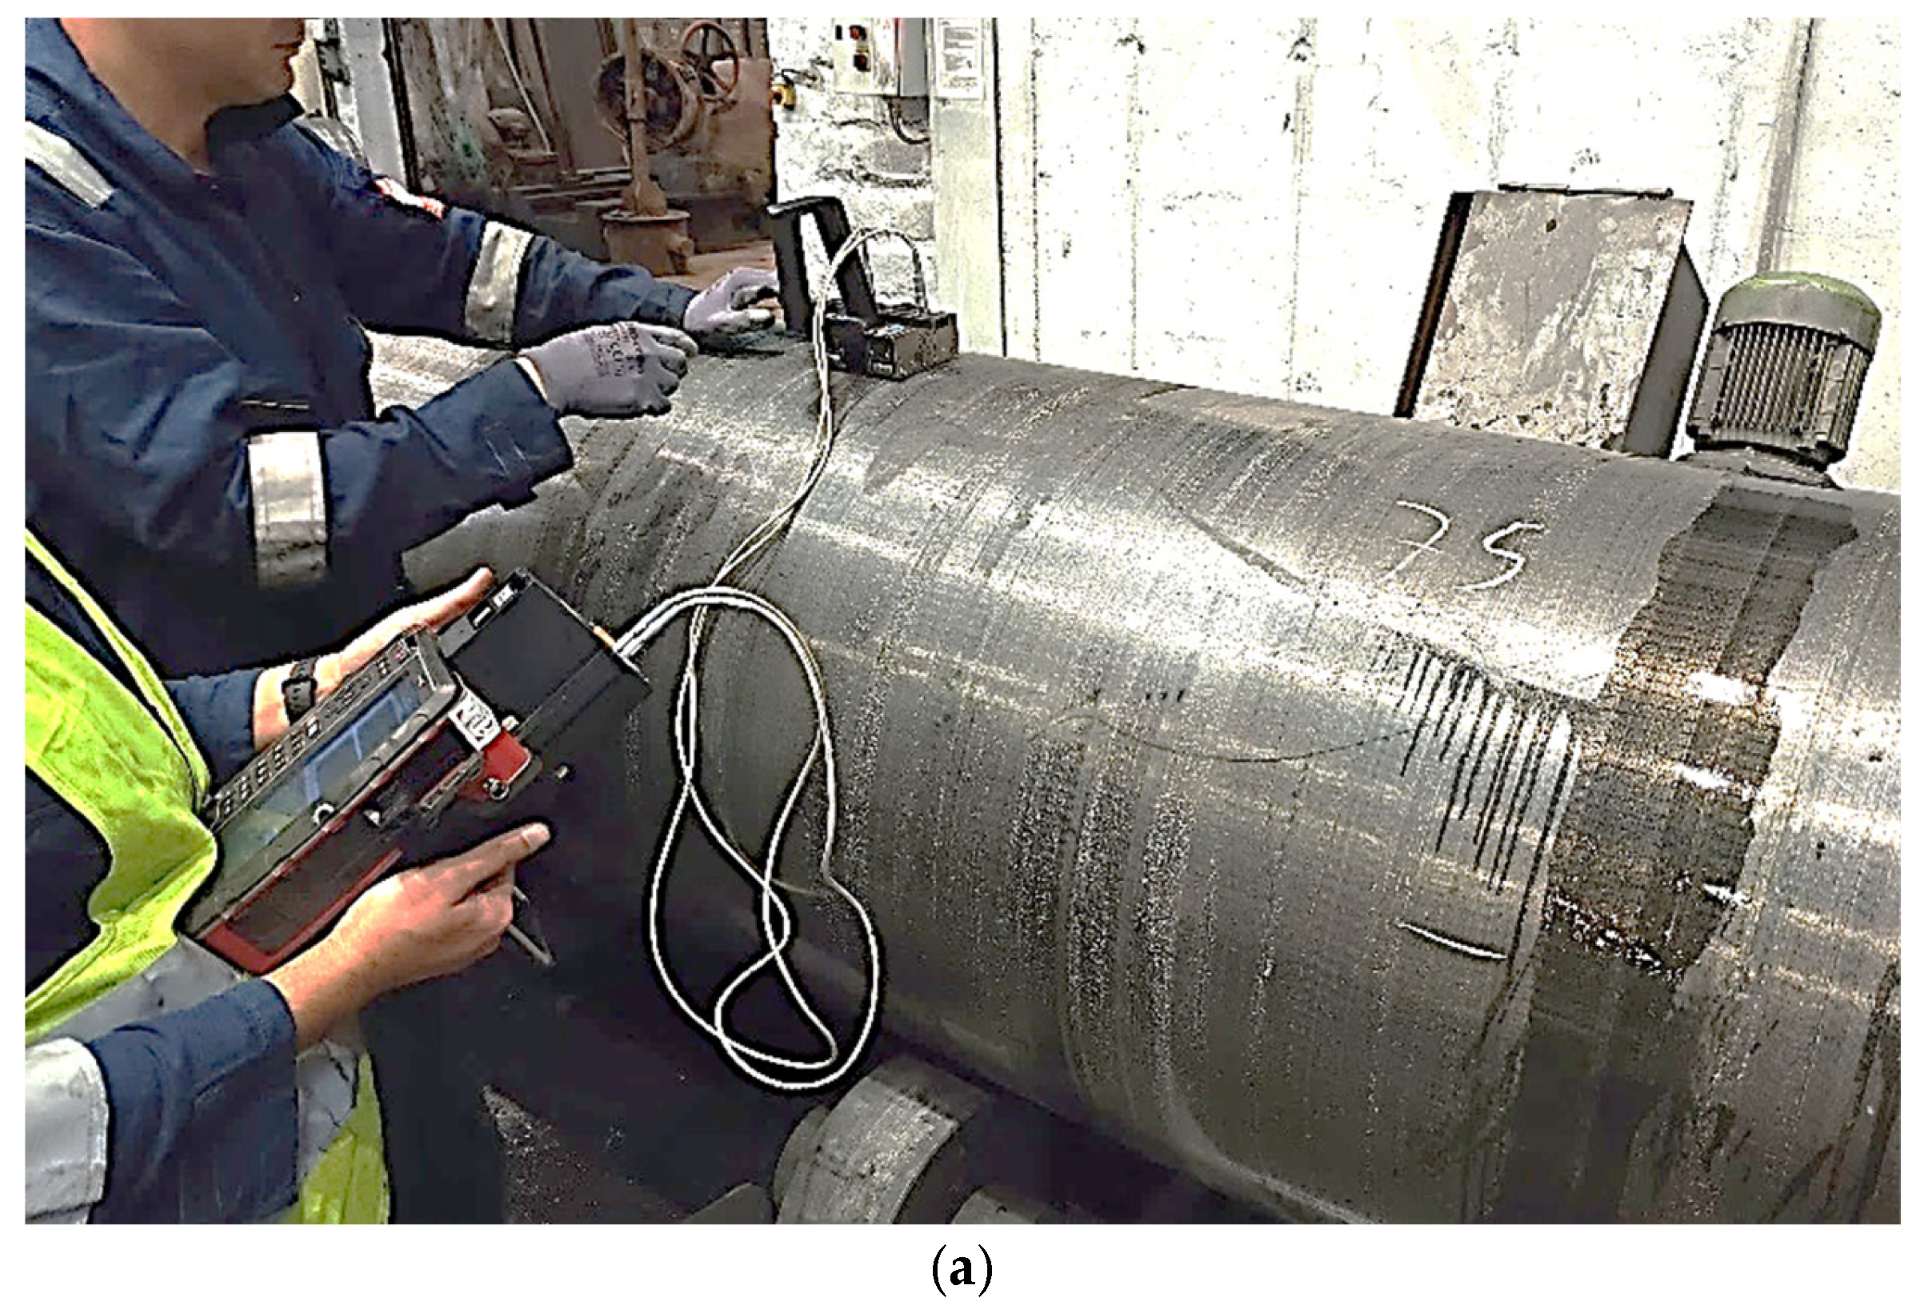
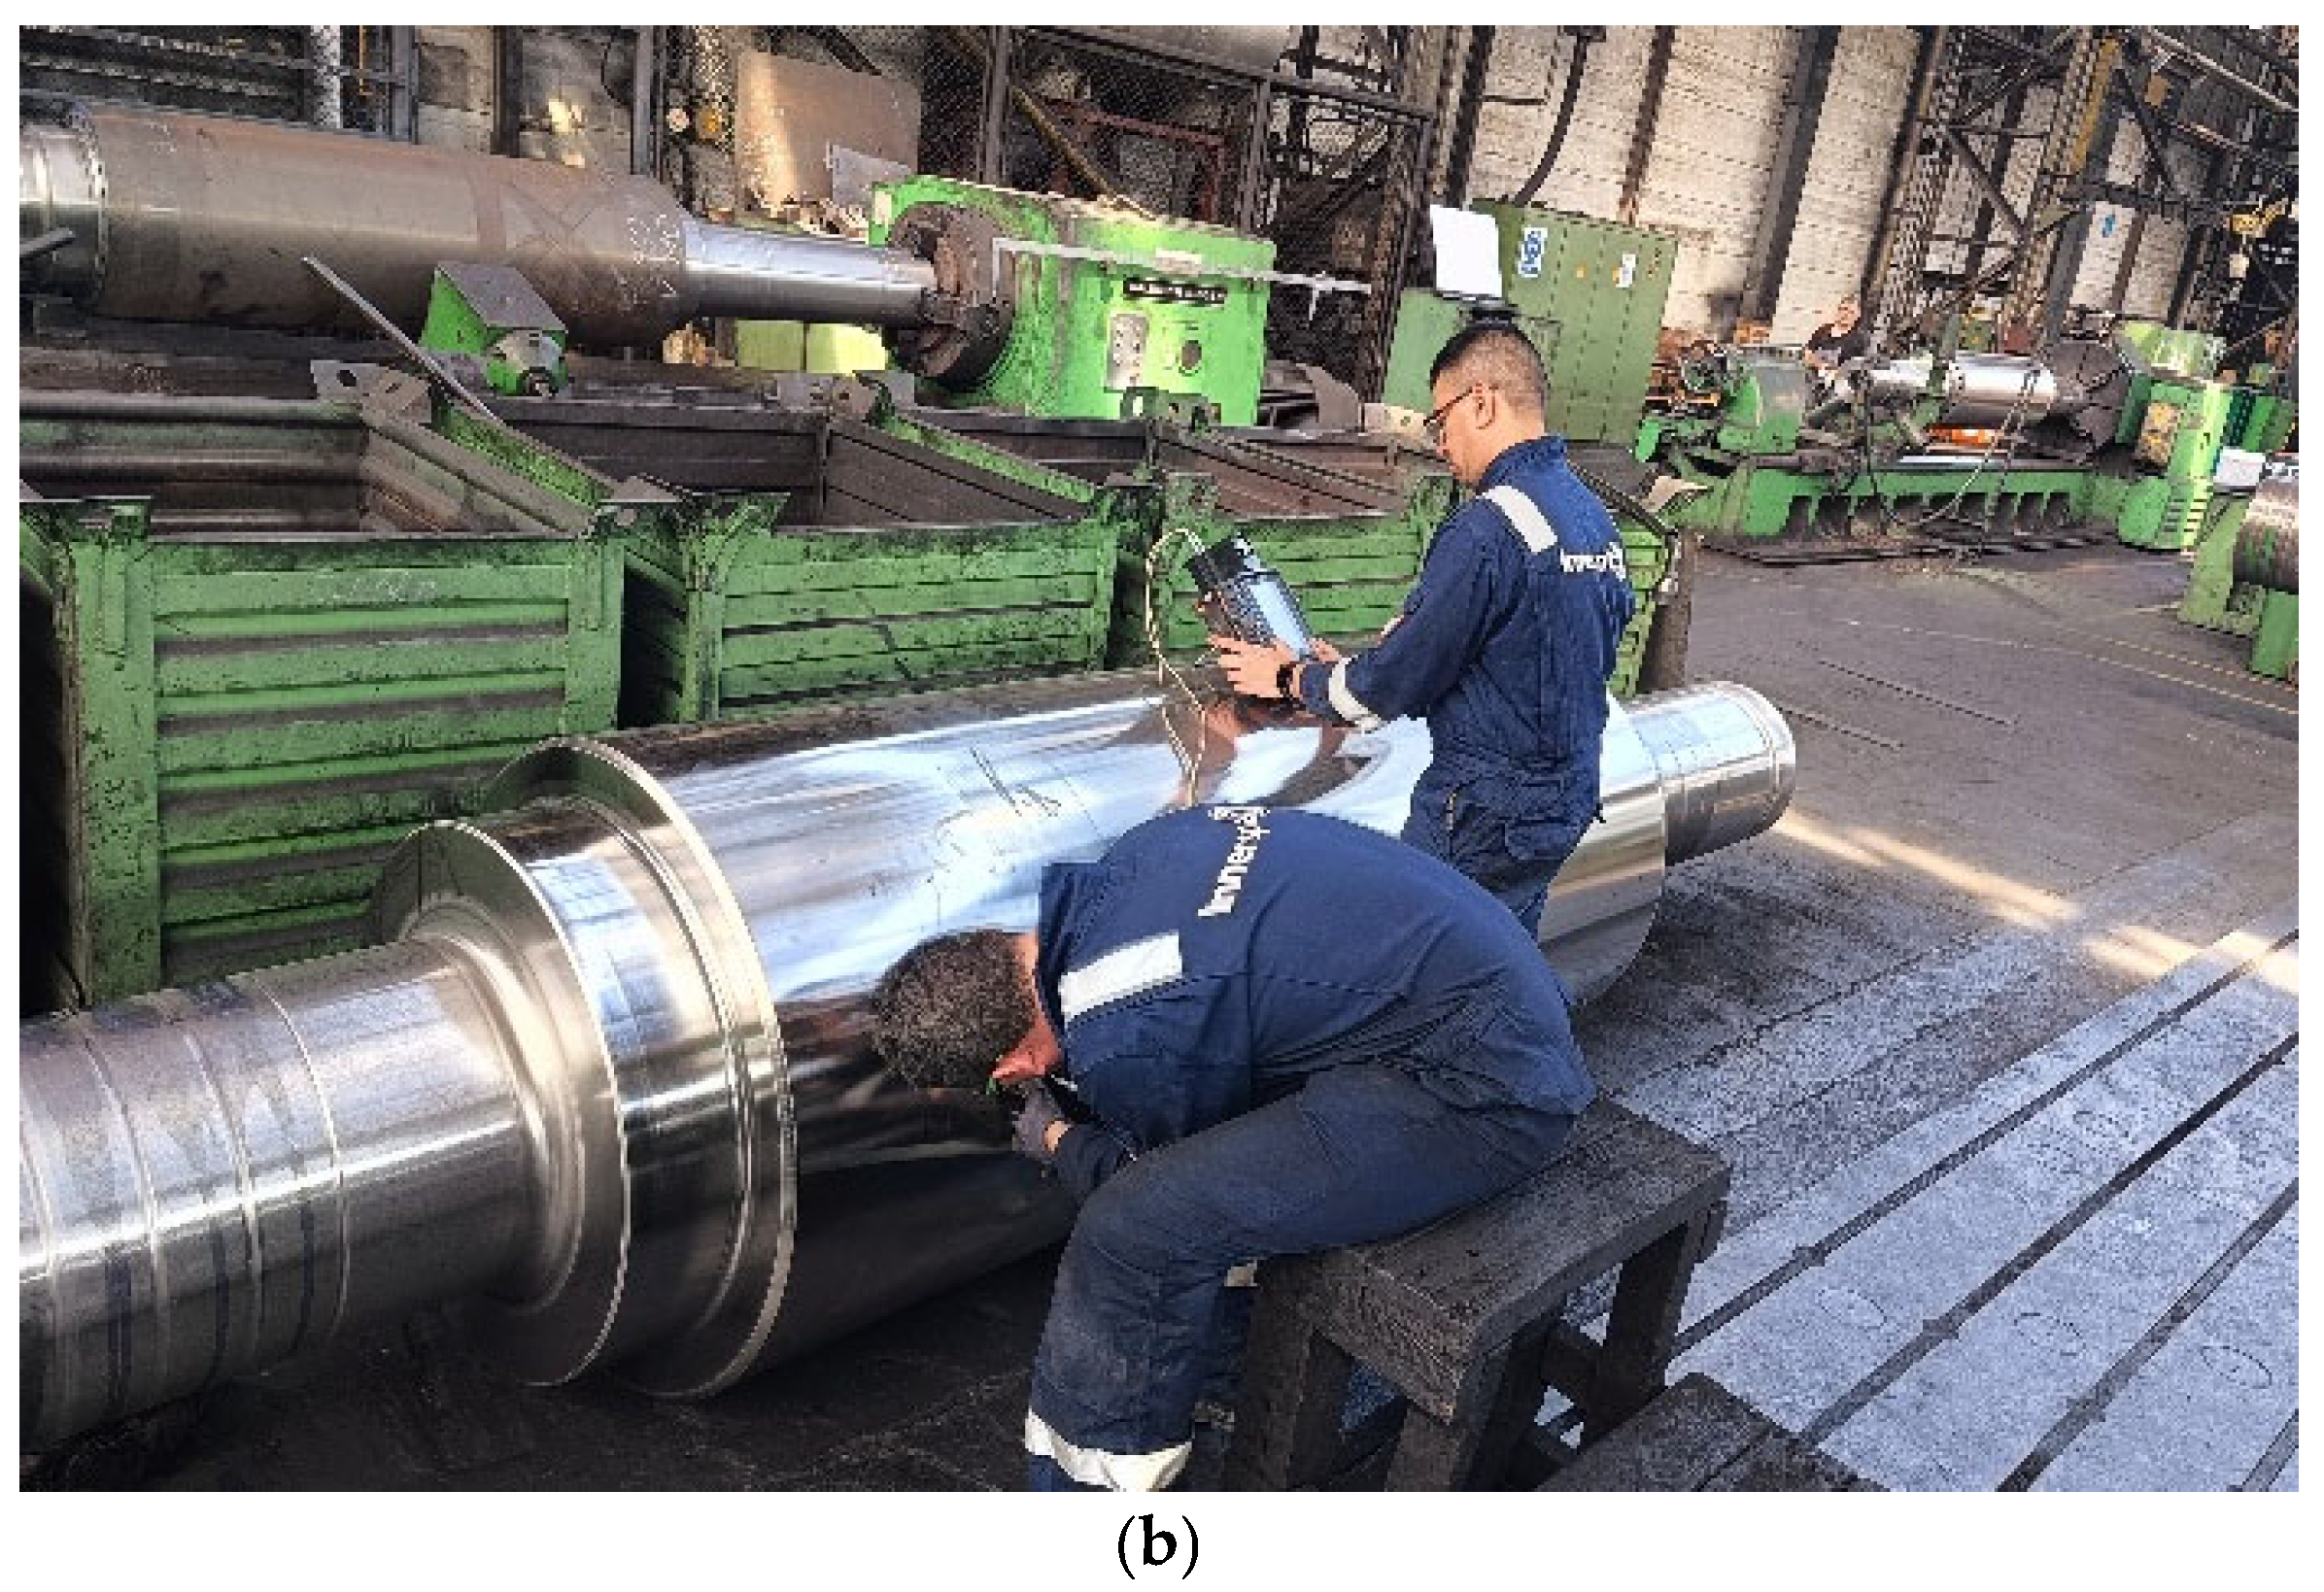
At the Valji steel roll facility, Innerspec personnel have conducted extensive inspections on different steel rolls. The inspections involved measuring samples in both rough ground and polished conditions (as shown in
Table 3). This comprehensive approach provides a thorough understanding of the material’s properties and potential defects across different processing stages and surface finishes.
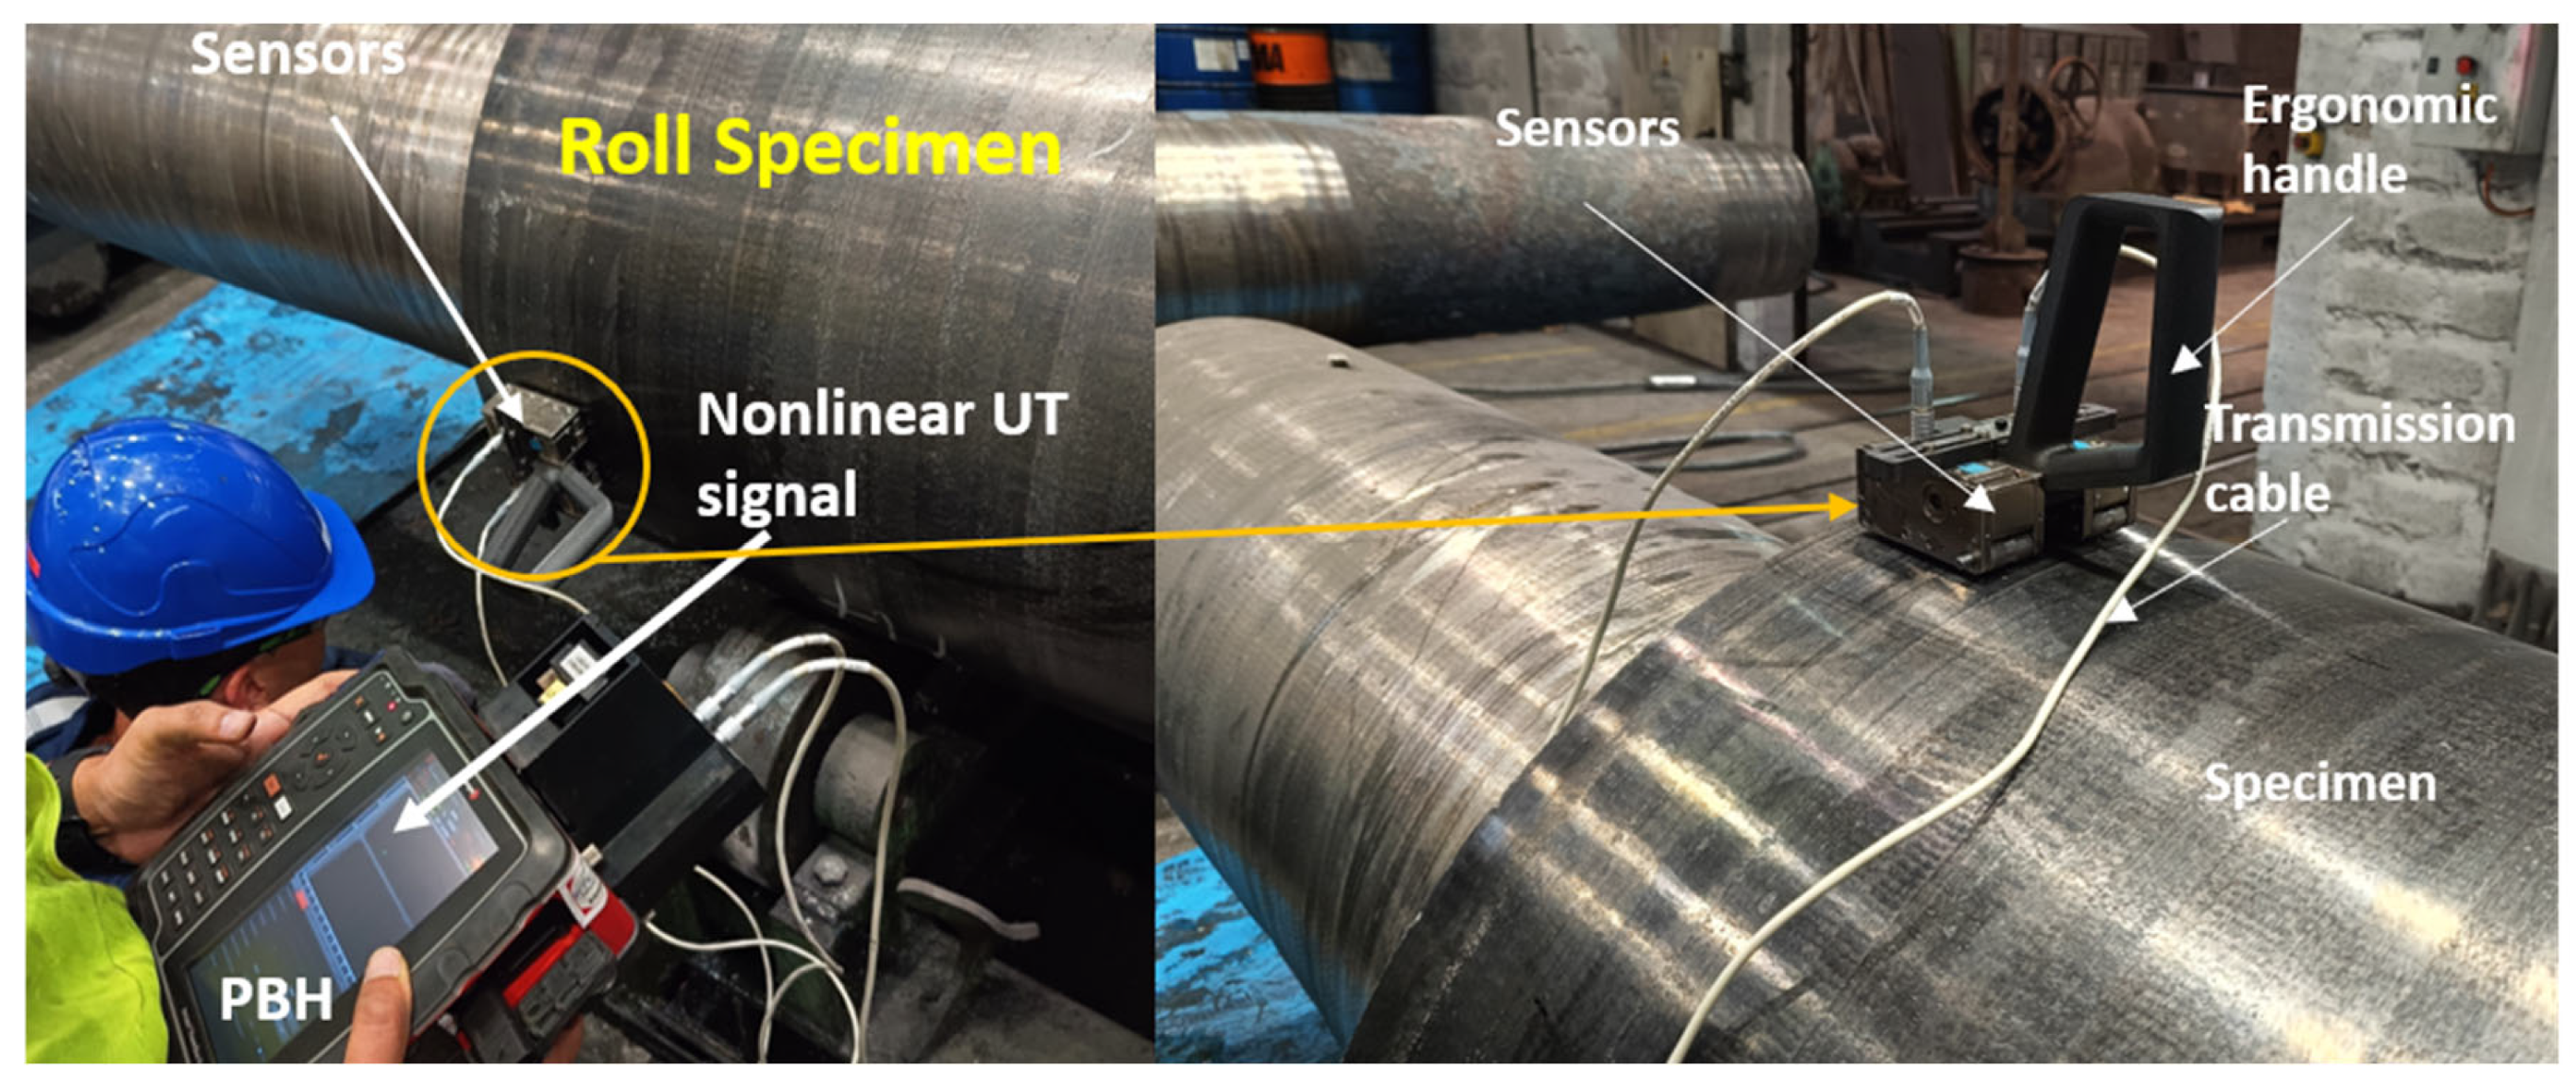
Figure 4 provides a glimpse into the performed continuous inspections, showcasing the capabilities of utilizing EMAT nonlinear ultrasonic technology in evaluating steel rolls.
5. Results and Discussions
5.1. Dispersion Calculations
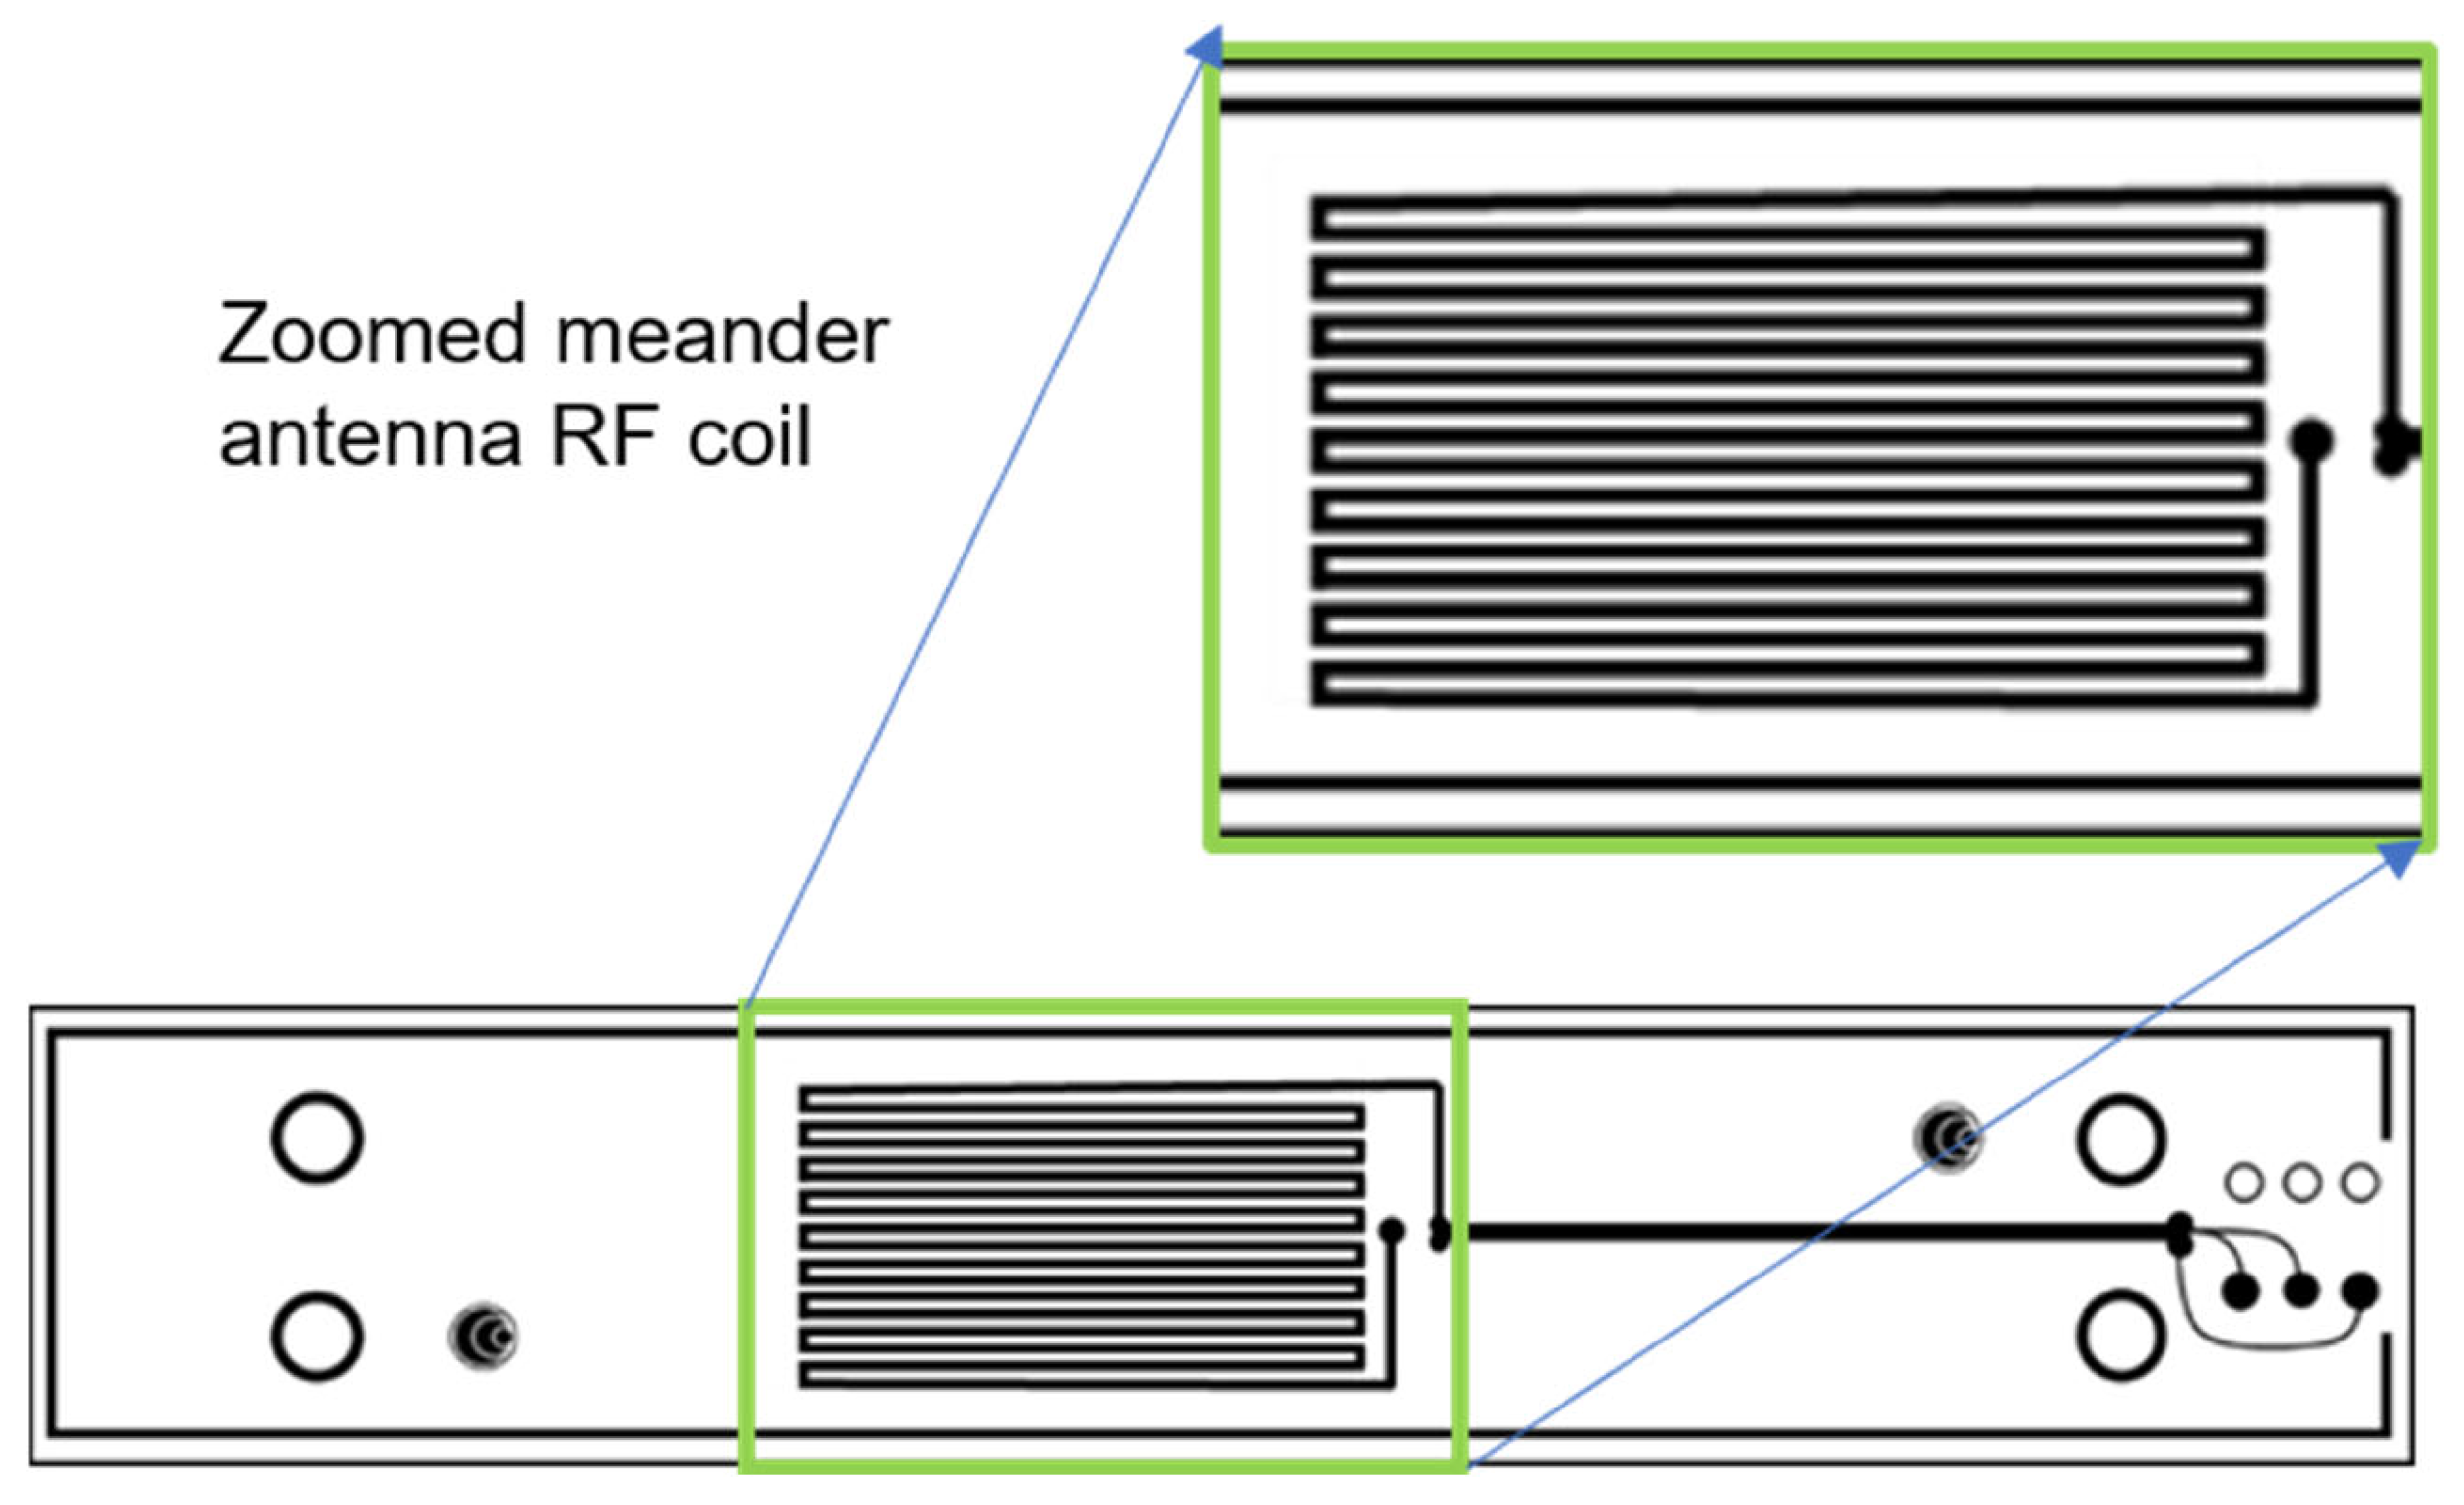
A 0.06-inch wavelength (λ) meander EMAT coil was selected for residual stress monitoring after comparing smaller (0.032-inch) and larger (0.08- and 0.1-inch) coils. This coil offered an ideal penetration depth of approximately ±1.5 mm while providing a higher signal-to-noise ratio than the alternatives, making it most effective for capturing near-surface stress variations. The corresponding Rayleigh wave carrier frequency is determined using Equation (5).
where V
p is the steel’s phase velocity, which is taken as 3.13 mm/µs, λ is the wavelength of the EMAT coil and is taken as 0.06 inches (1.524 mm). The coefficient 0.92 comes from the theoretical relationship between the Vp and λ for a free surface in an isotropic solid. The value 0.92 accounts for the slight difference between the Rayleigh wave velocity and the shear wave velocity of the material. This formulation is widely used in ultrasonic NDT literature, for example, see Rose [
26] and Viktorov [
27].
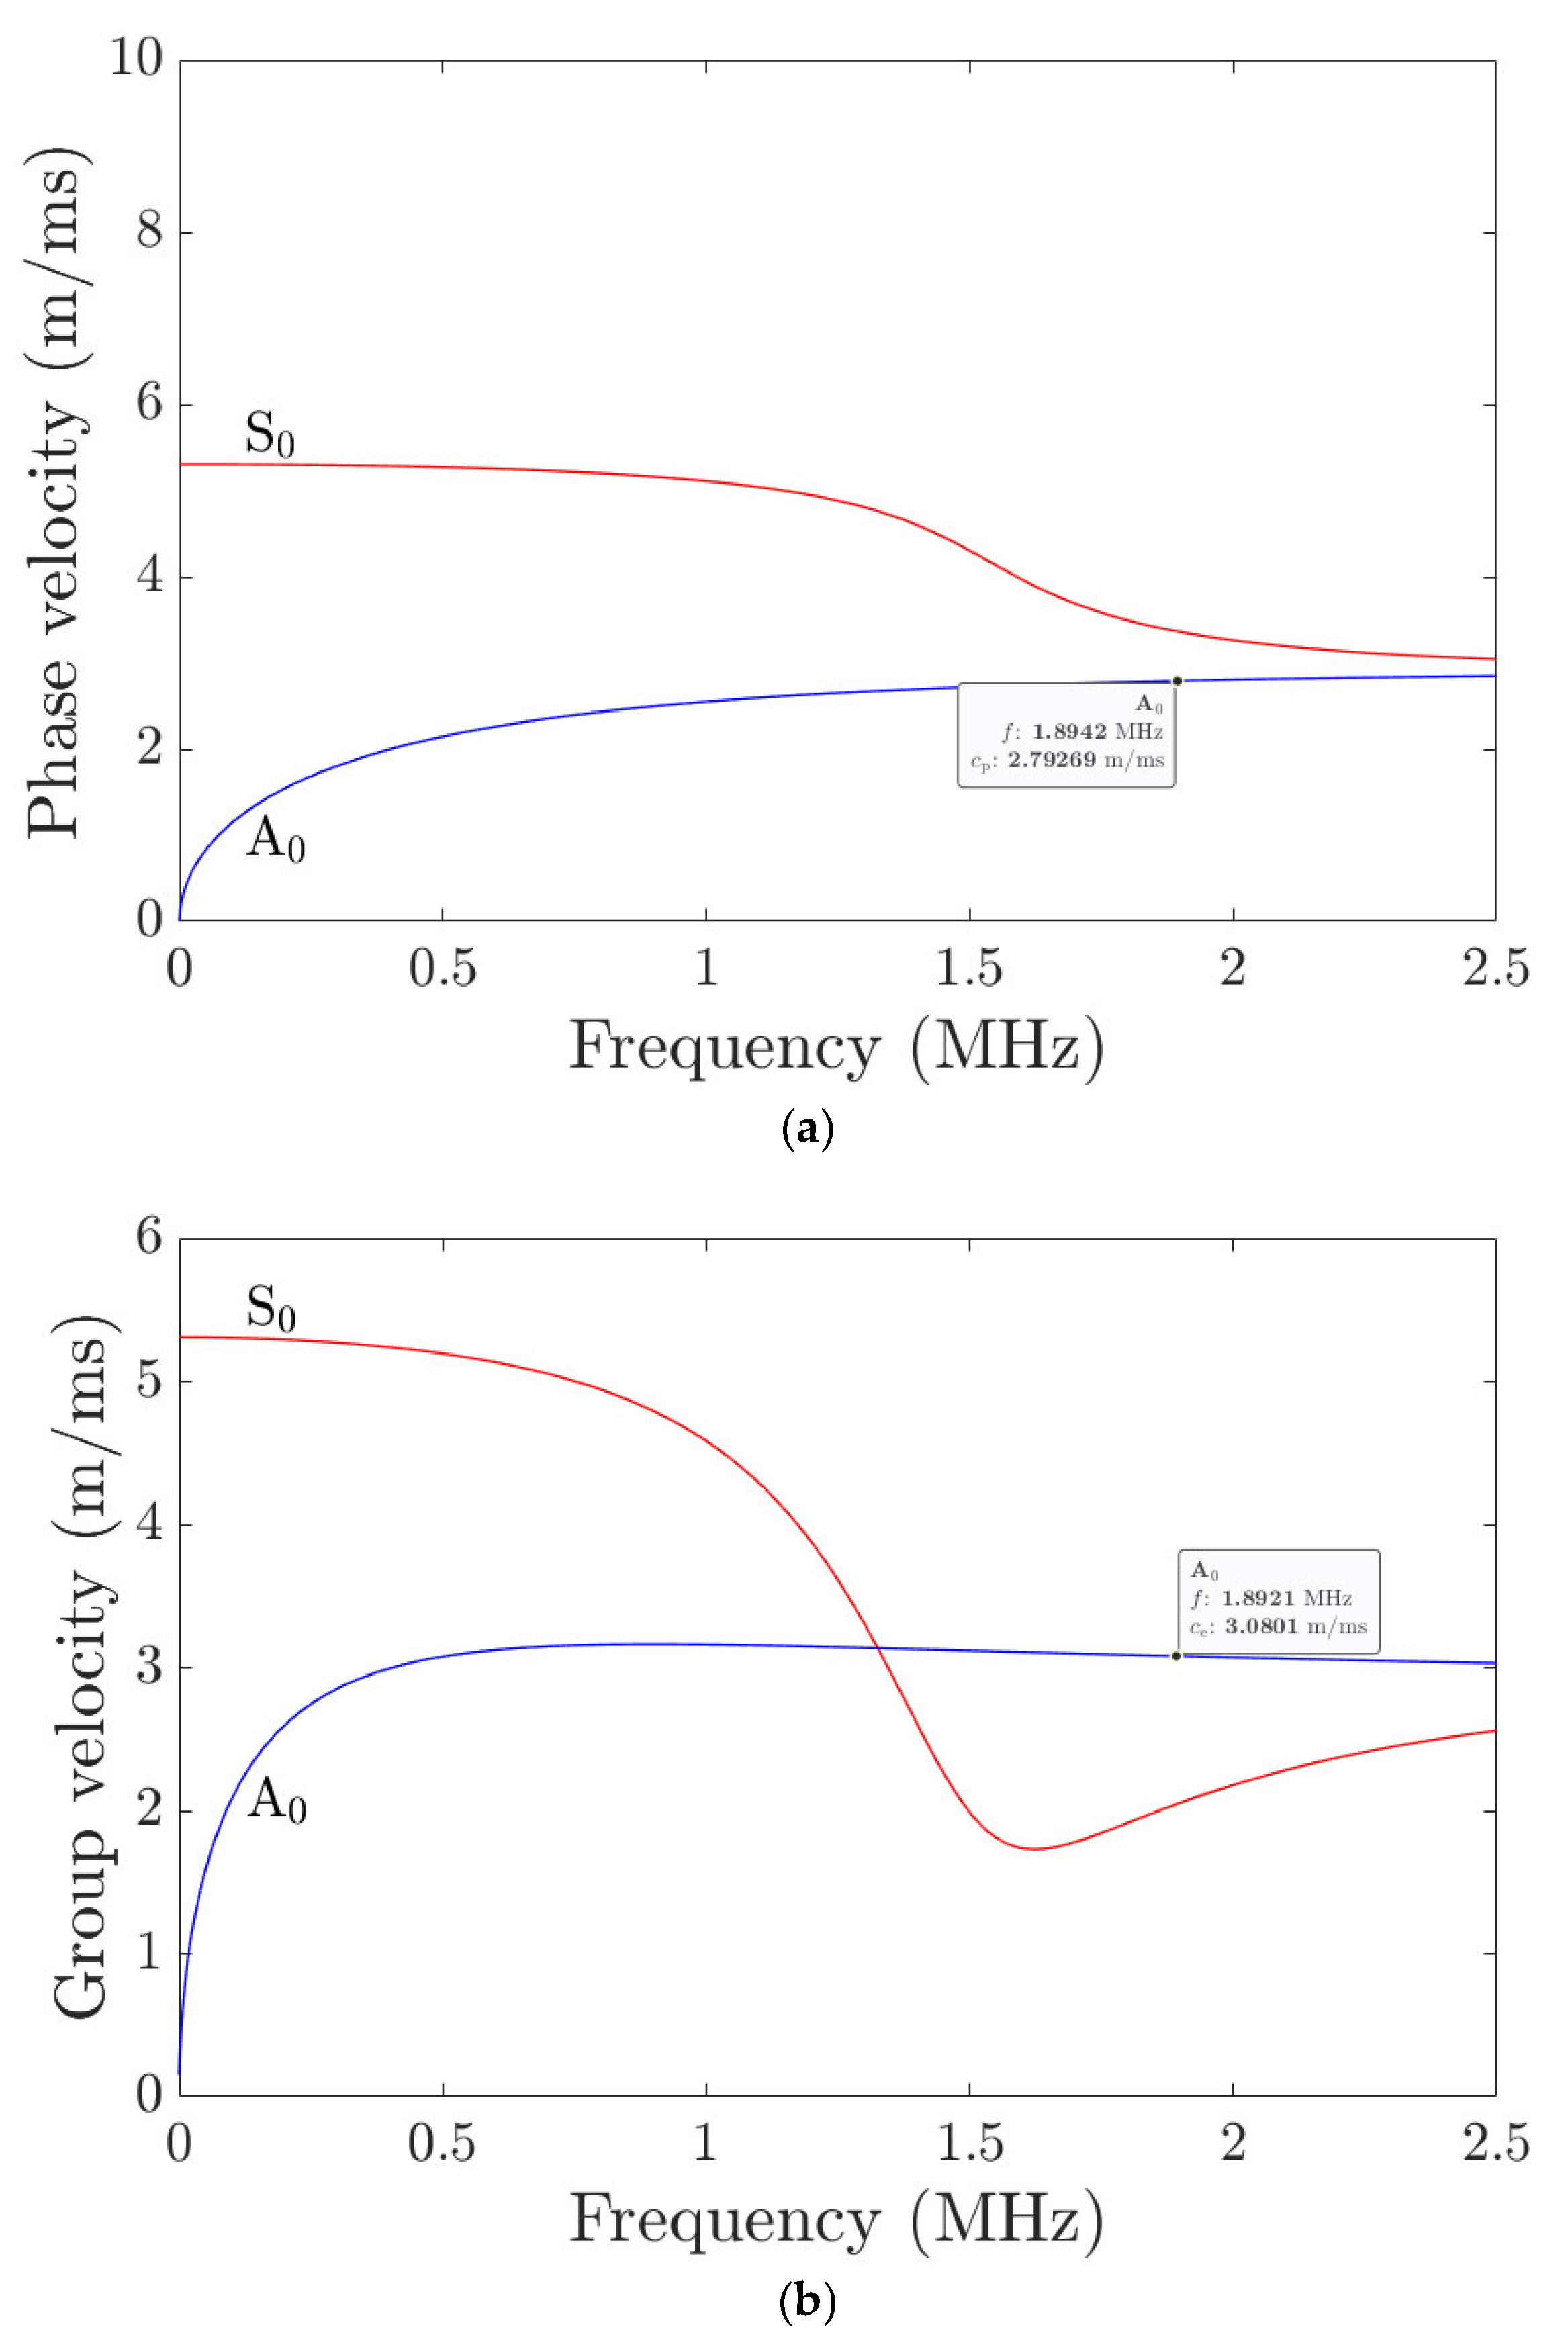
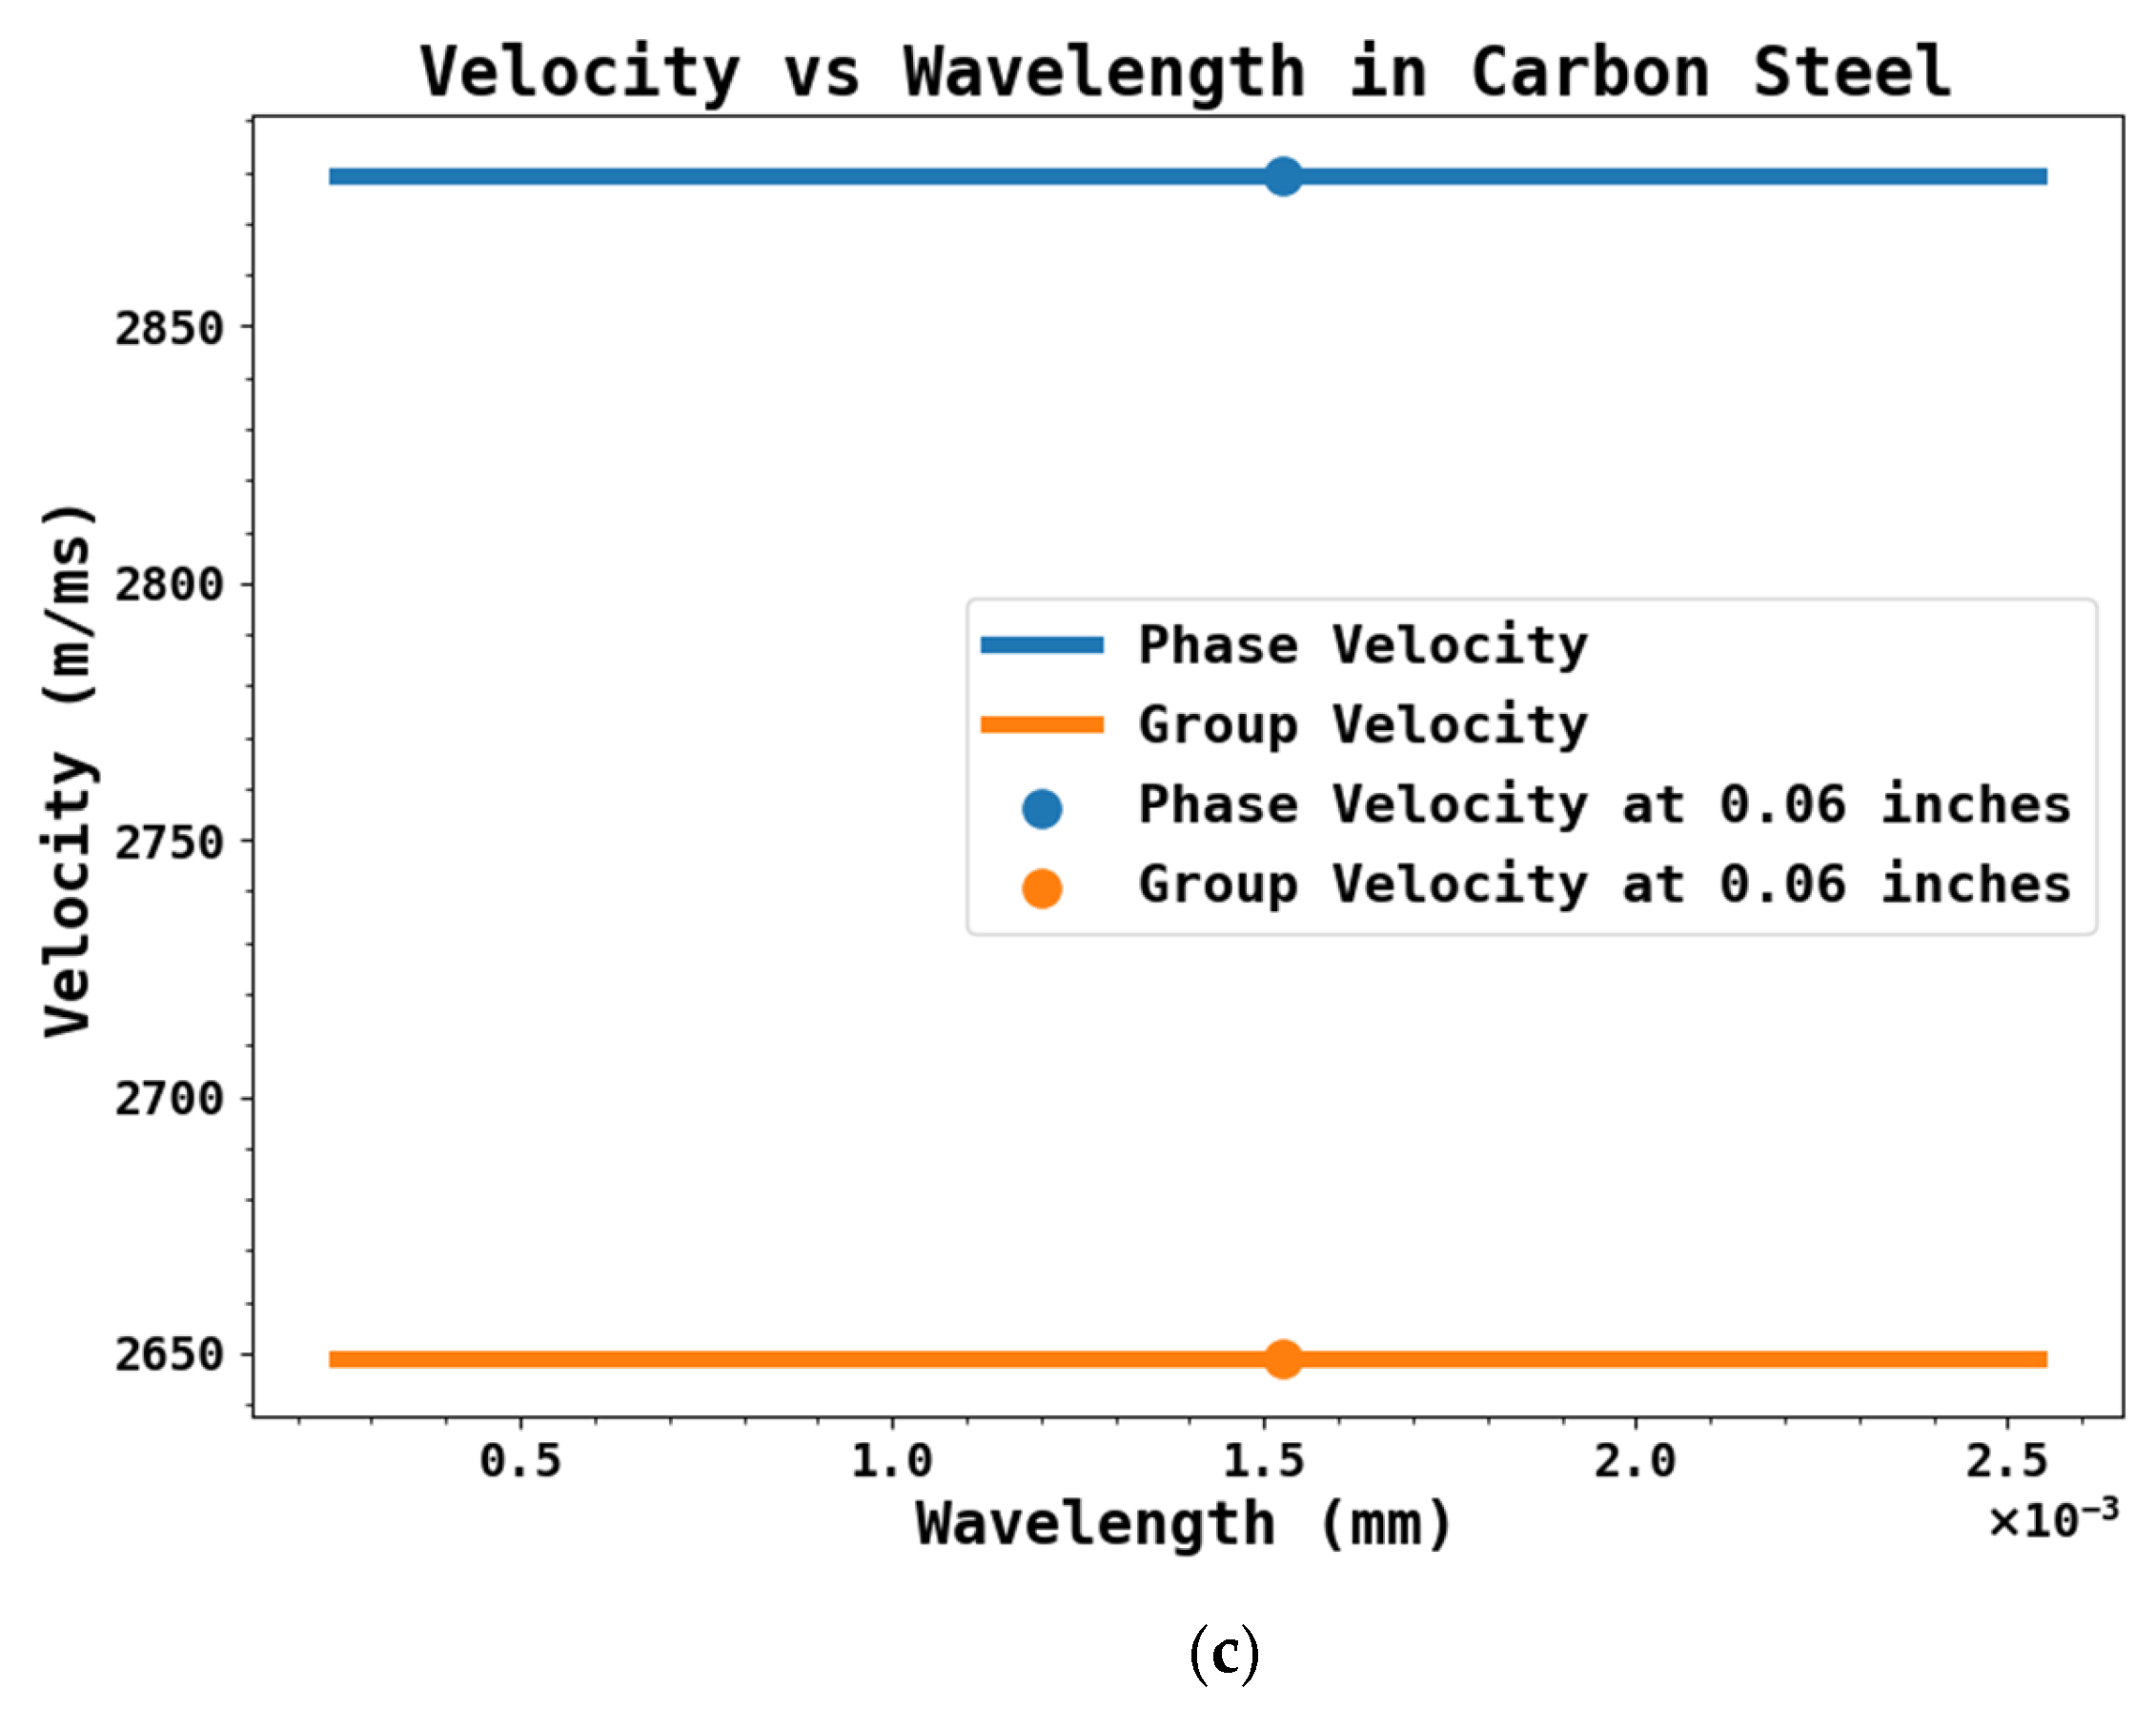
Thus, 1.889 MHz is the obtained carrier frequency (F) for the measurements where Rayleigh waves are generated for the specified wavelength based on Equation (5). In the initial part, the analytical calculations were carried out with the developed equations to obtain the analytical phase and group velocity (V
g) values for Rayleigh surface waves, as shown in
Table 5. The numerical (obtained using a Dispersion calculator [
28]) and analytical results are shown in
Figure 15. The calculations are made for a thickness of 1.524 mm (wavelength 0.06 inch), and Rayleigh waves are primarily sensitive over a depth on the order of the wavelength. The comparative calculations are shown in
Table 6.
The phase velocity calculations obtained from the numerical and analytical methods were also identical, as shown in
Figure 16 polar plot plotted all along the orientations. The difference between the analytical and numerical group velocity was around 200 m/ms, which we assume is due to the change in the material property used in numerical calculations.
5.2. Analysis of Valji Lab Samples
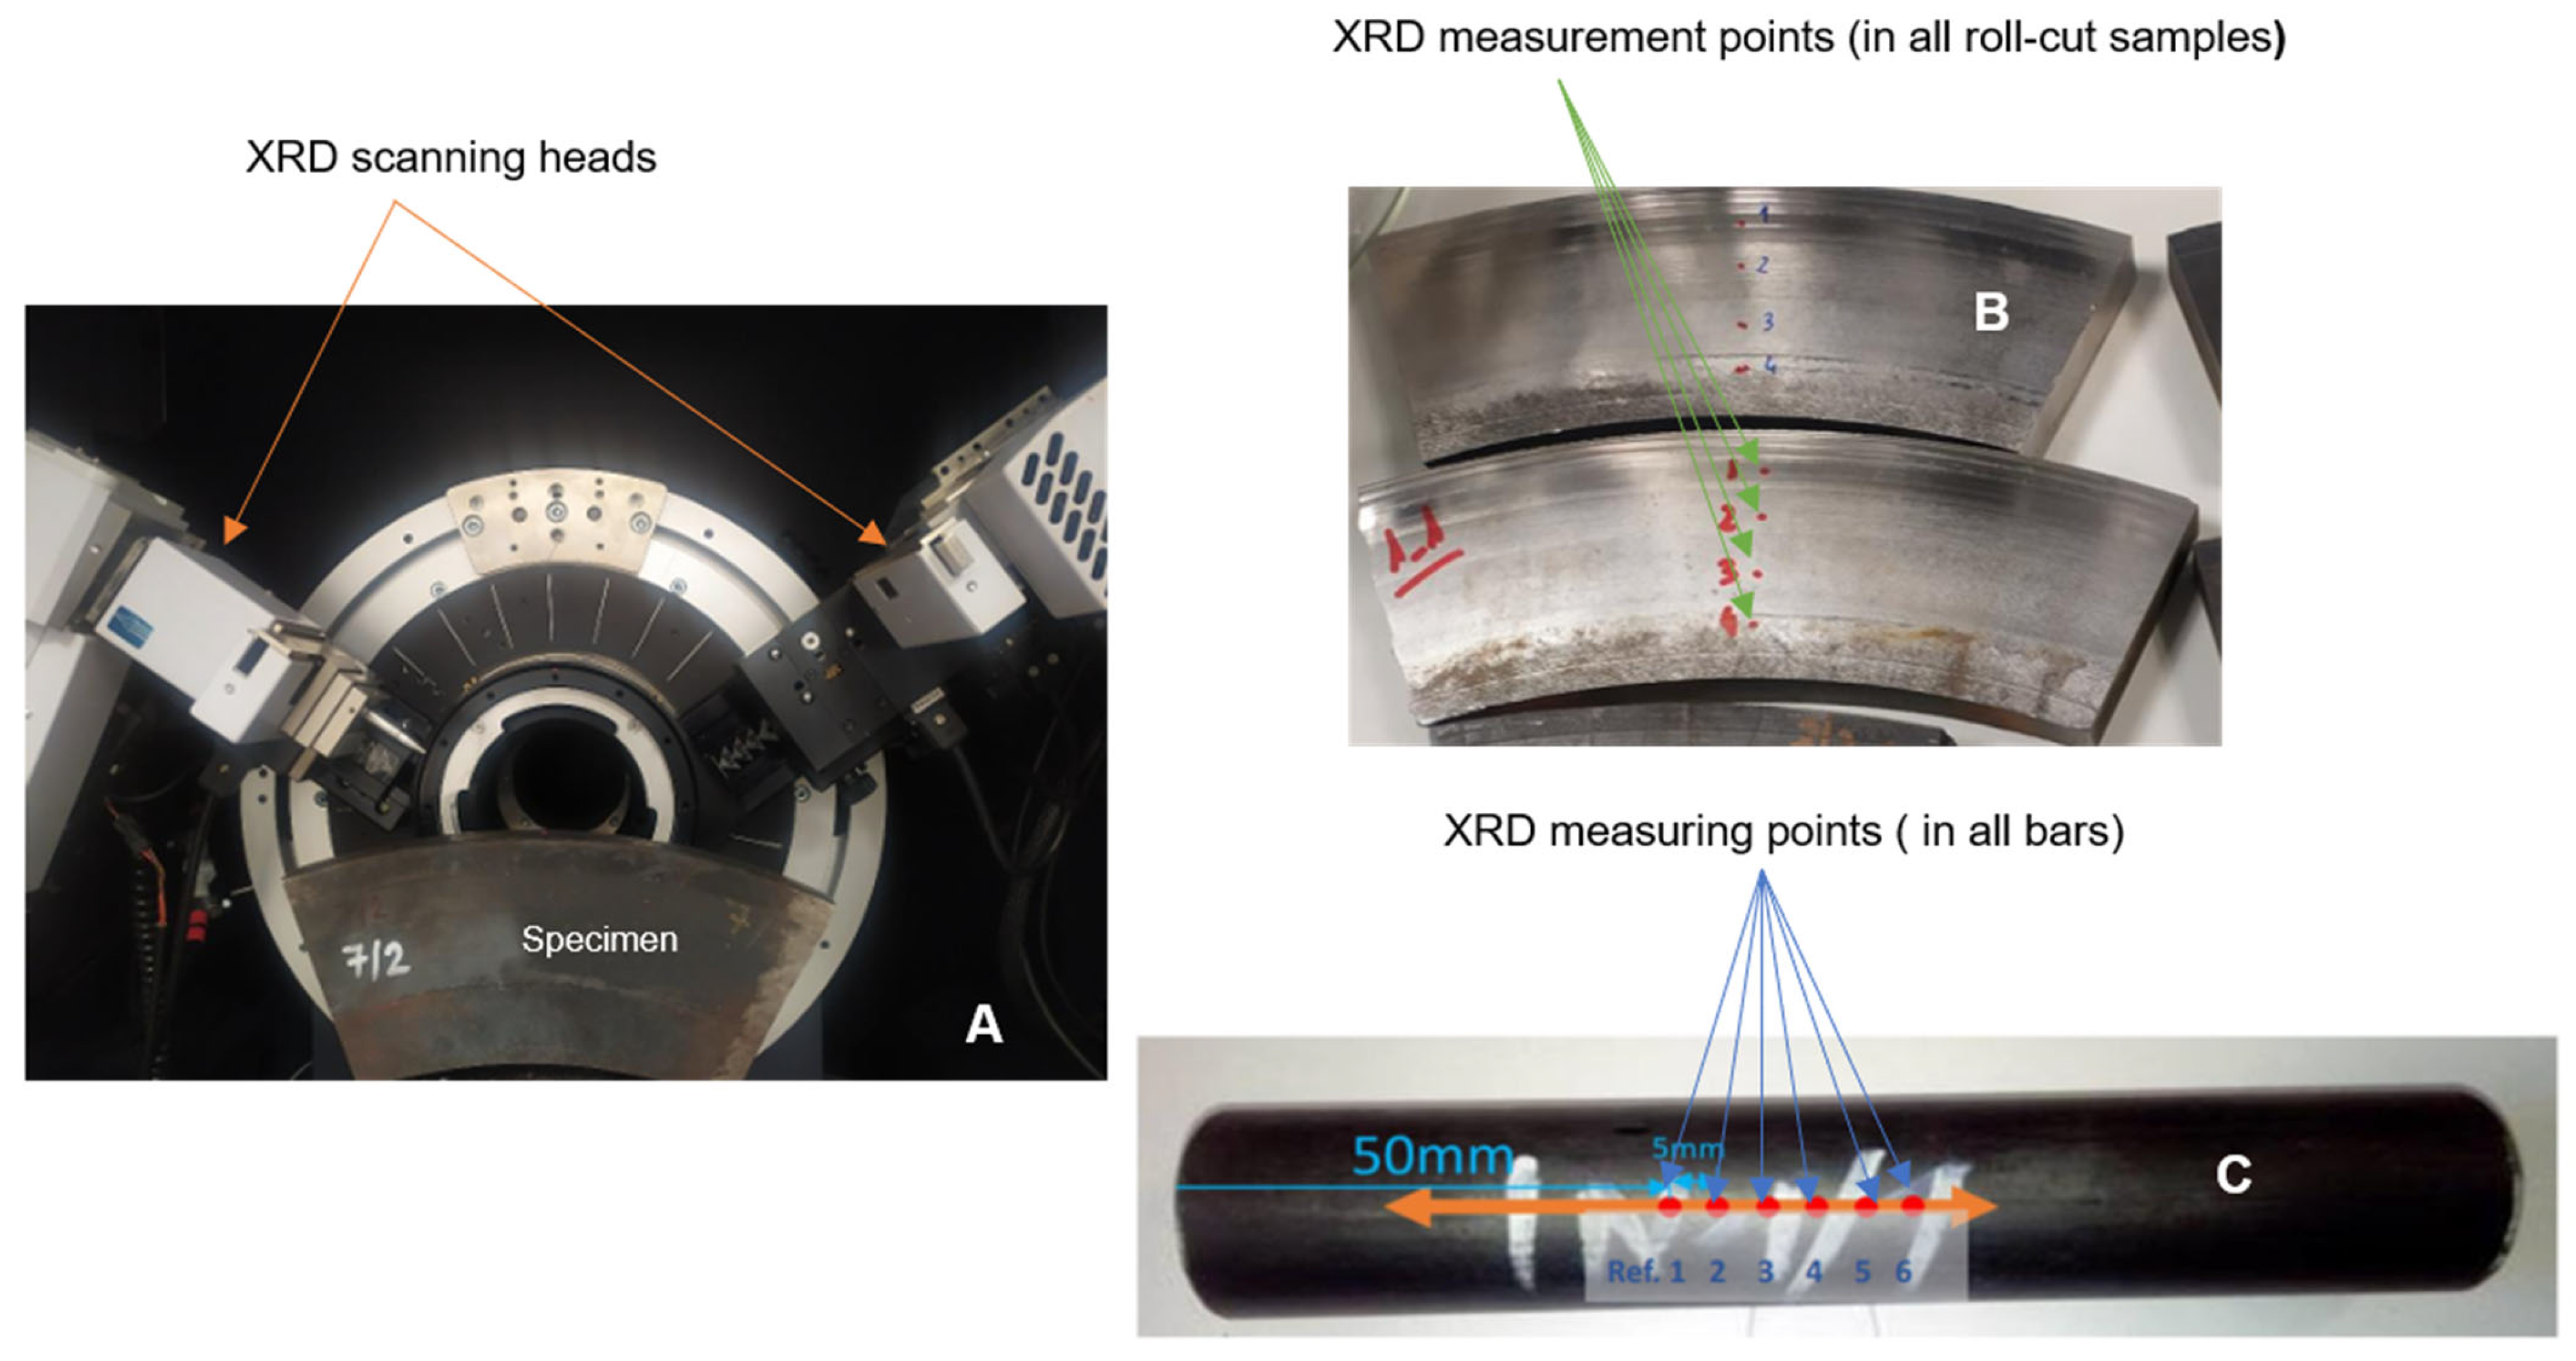
The XRD results from four different points were collected, as detailed in
Table 7 from
Table 1 specimens. The data encompasses multiple stress (σ) measurements at each point, labelled as 1/1, 2/1, 2/2, 3/1, 3/2, 4/1, and 4/2, and are recorded in MPa. These measurements reveal the stress variations at different points across the sample (
Figure 5), highlighting both positive and negative stress values. To streamline the analysis and present a more comprehensive overview, the individual measurements from points 2 and 3 were averaged. This averaging process aimed to condense the data into a single representative value, providing a comparative understanding of the stress distribution at the centre of the samples. The averaged results are shown in
Table 8, offering a simplified depiction of the stress behaviour as observed in the XRD measurements.
In the EMAT study, the A
1 and A
2 parameters (
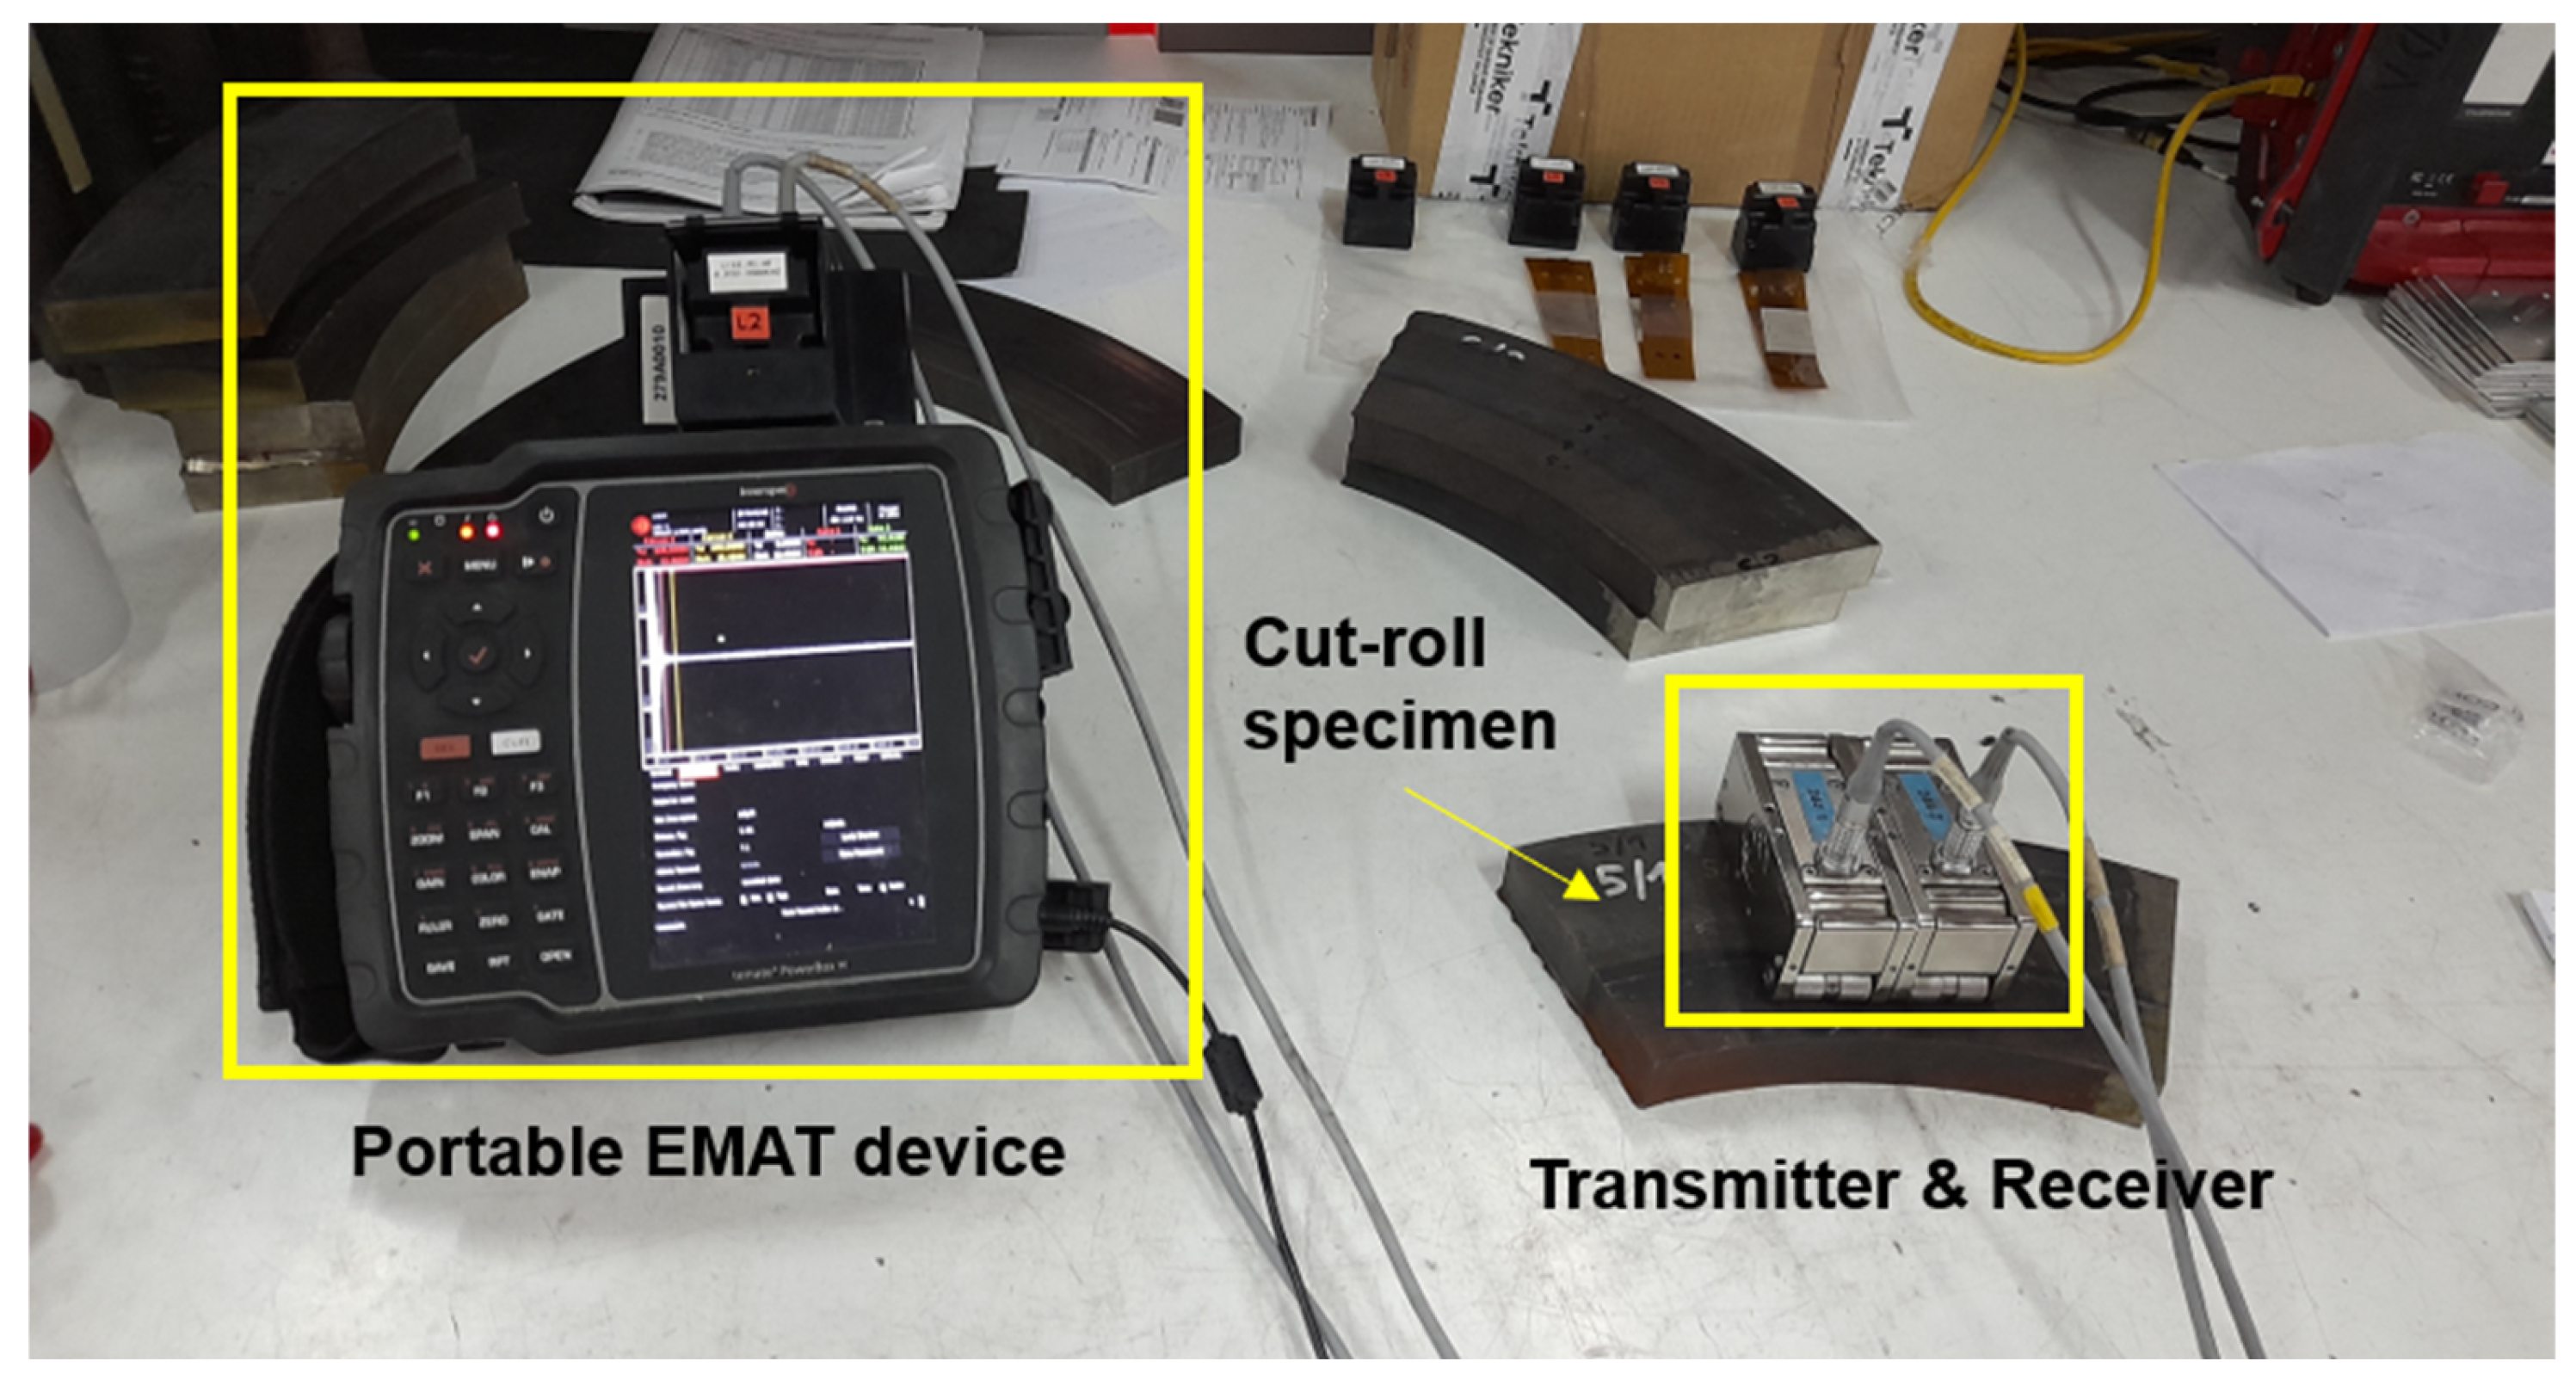
Table 9) were obtained using nonlinear technology, which is particularly effective in capturing the nonlinearity of the material under examination. The parameter β was also determined (Equation (2)) in this analysis. The sensors were strategically placed at the centre of the sample due to their large size (
Figure 6), ensuring that the measurements accurately reflected the central region where stress concentrations and material behaviour are most critical.
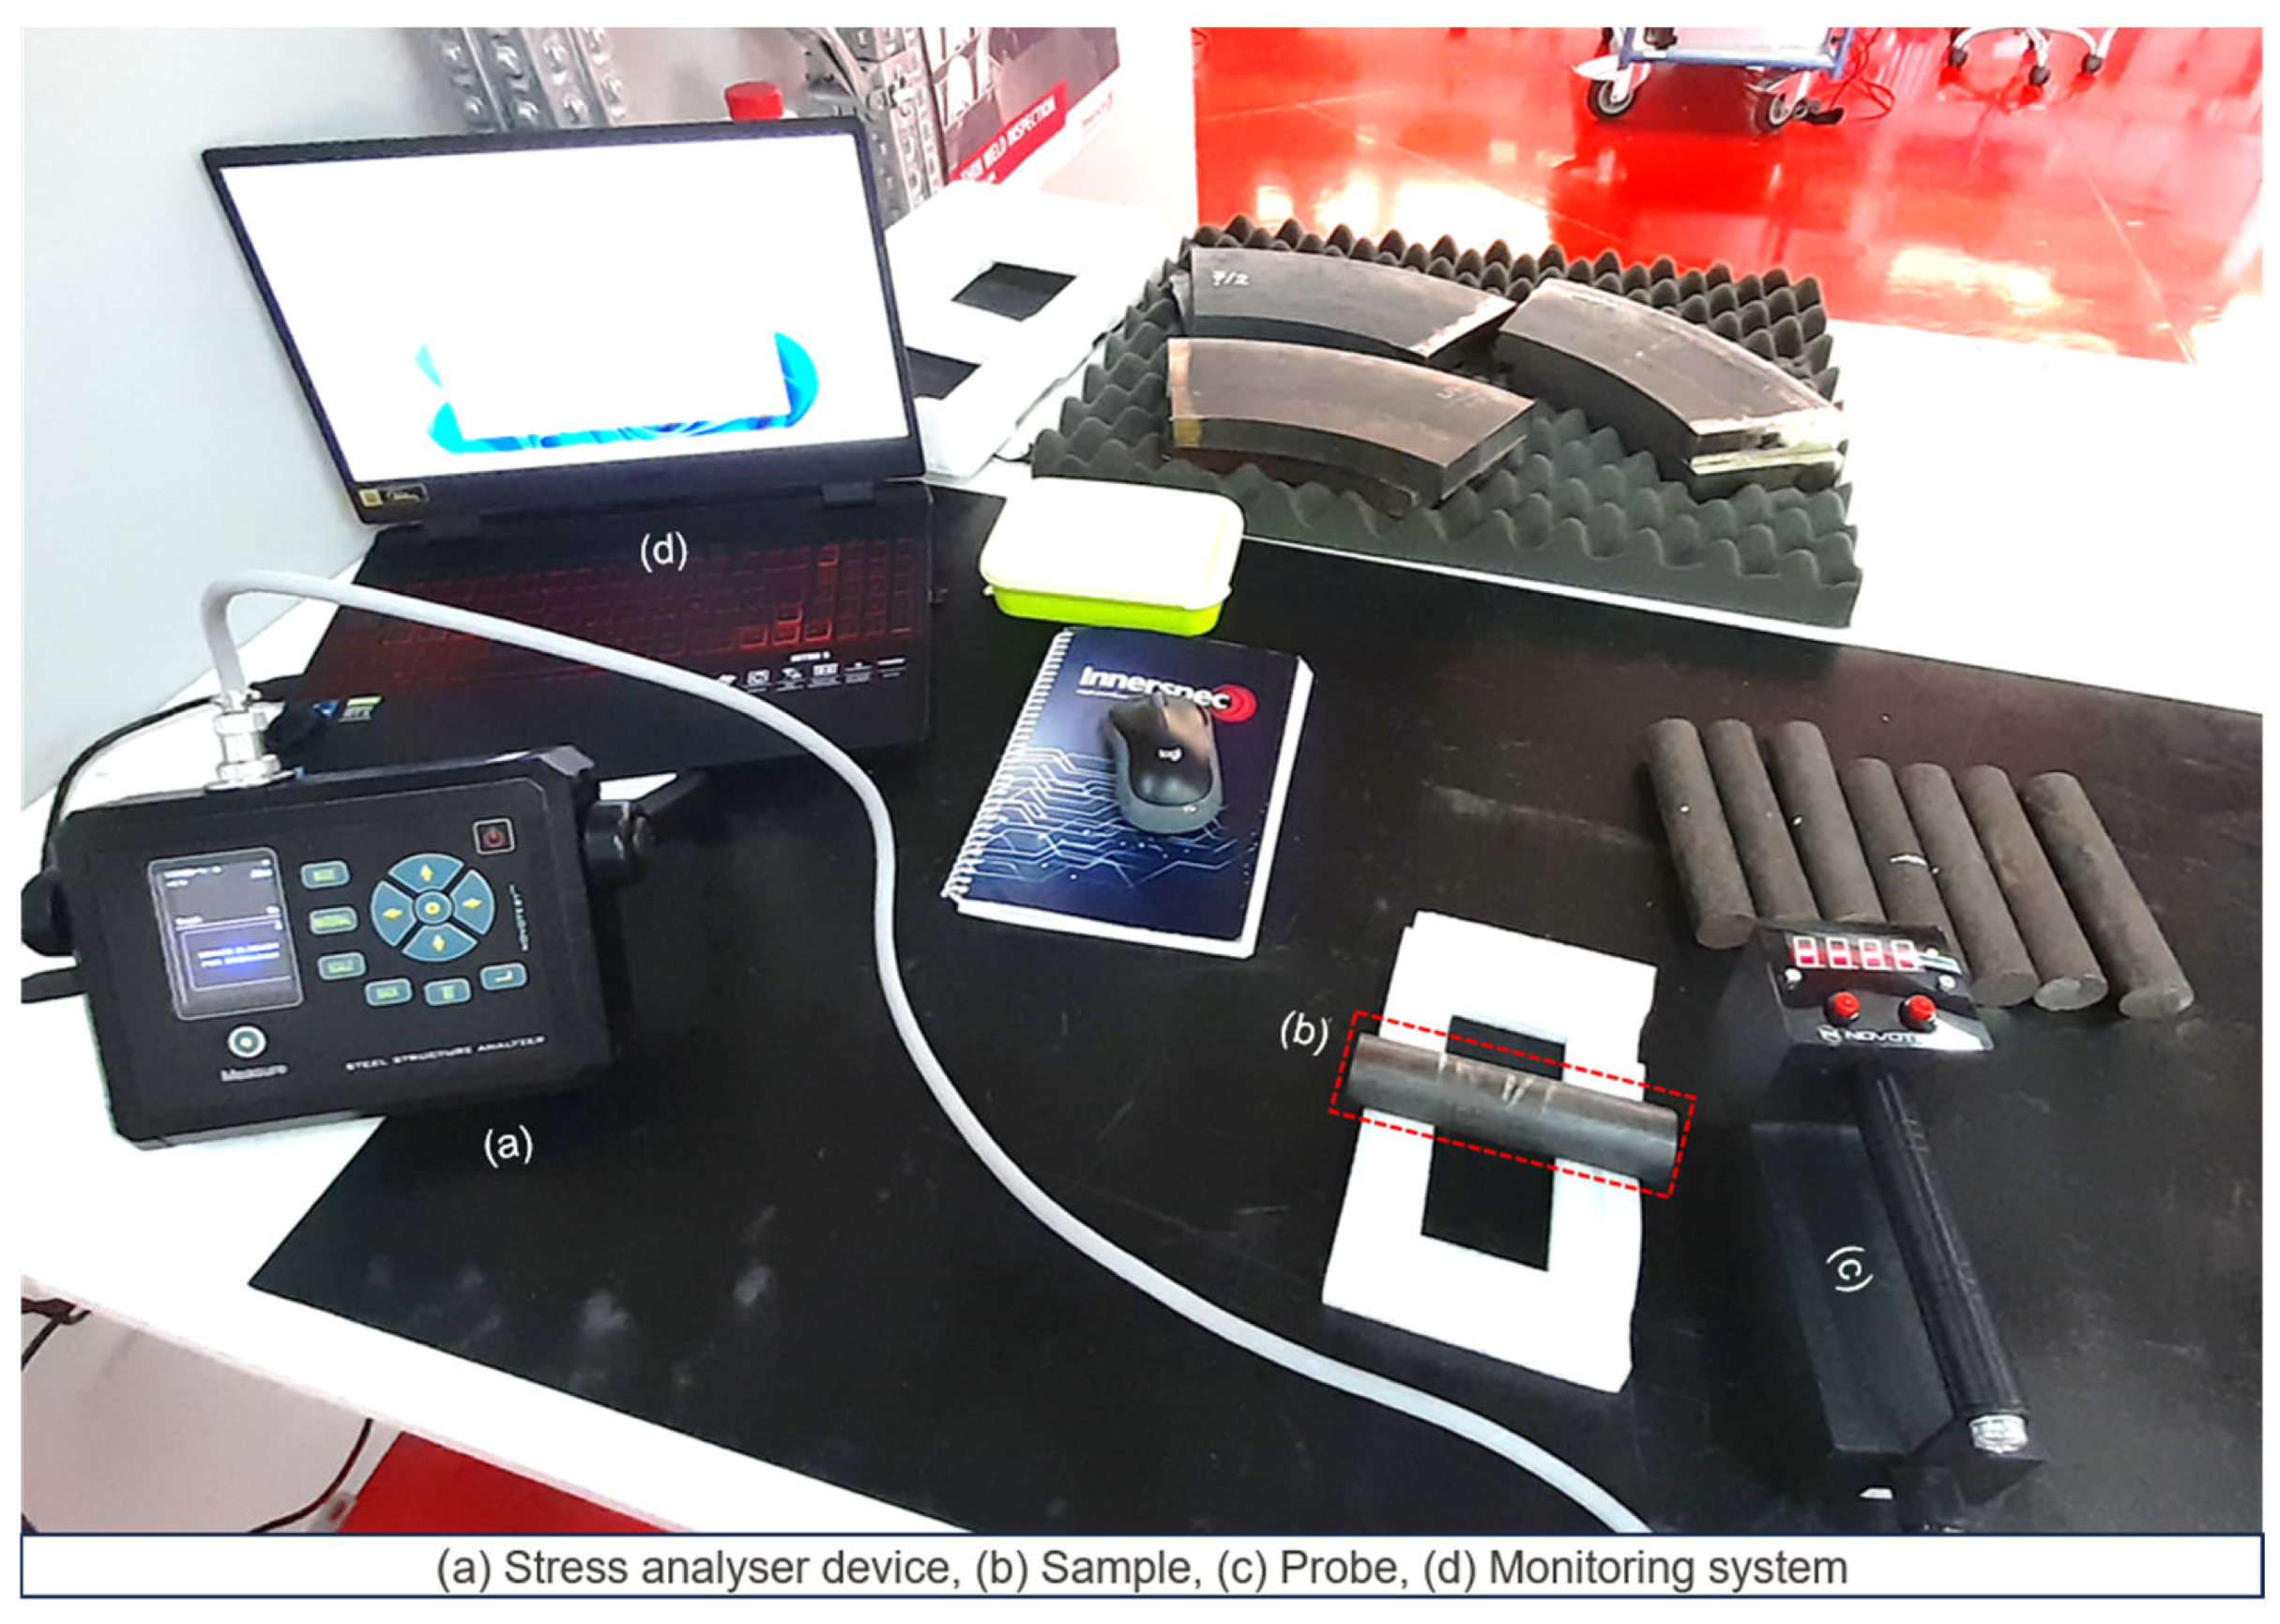
Table 10 represents the coercive force results obtained using the Novotest coercive force analyzer. These results were measured in A/cm for various samples. Similar to the previous approach, a large sensor was placed at the centre of the sample (
Figure 14) to ensure accurate measurement, given the significant size of the material under investigation.
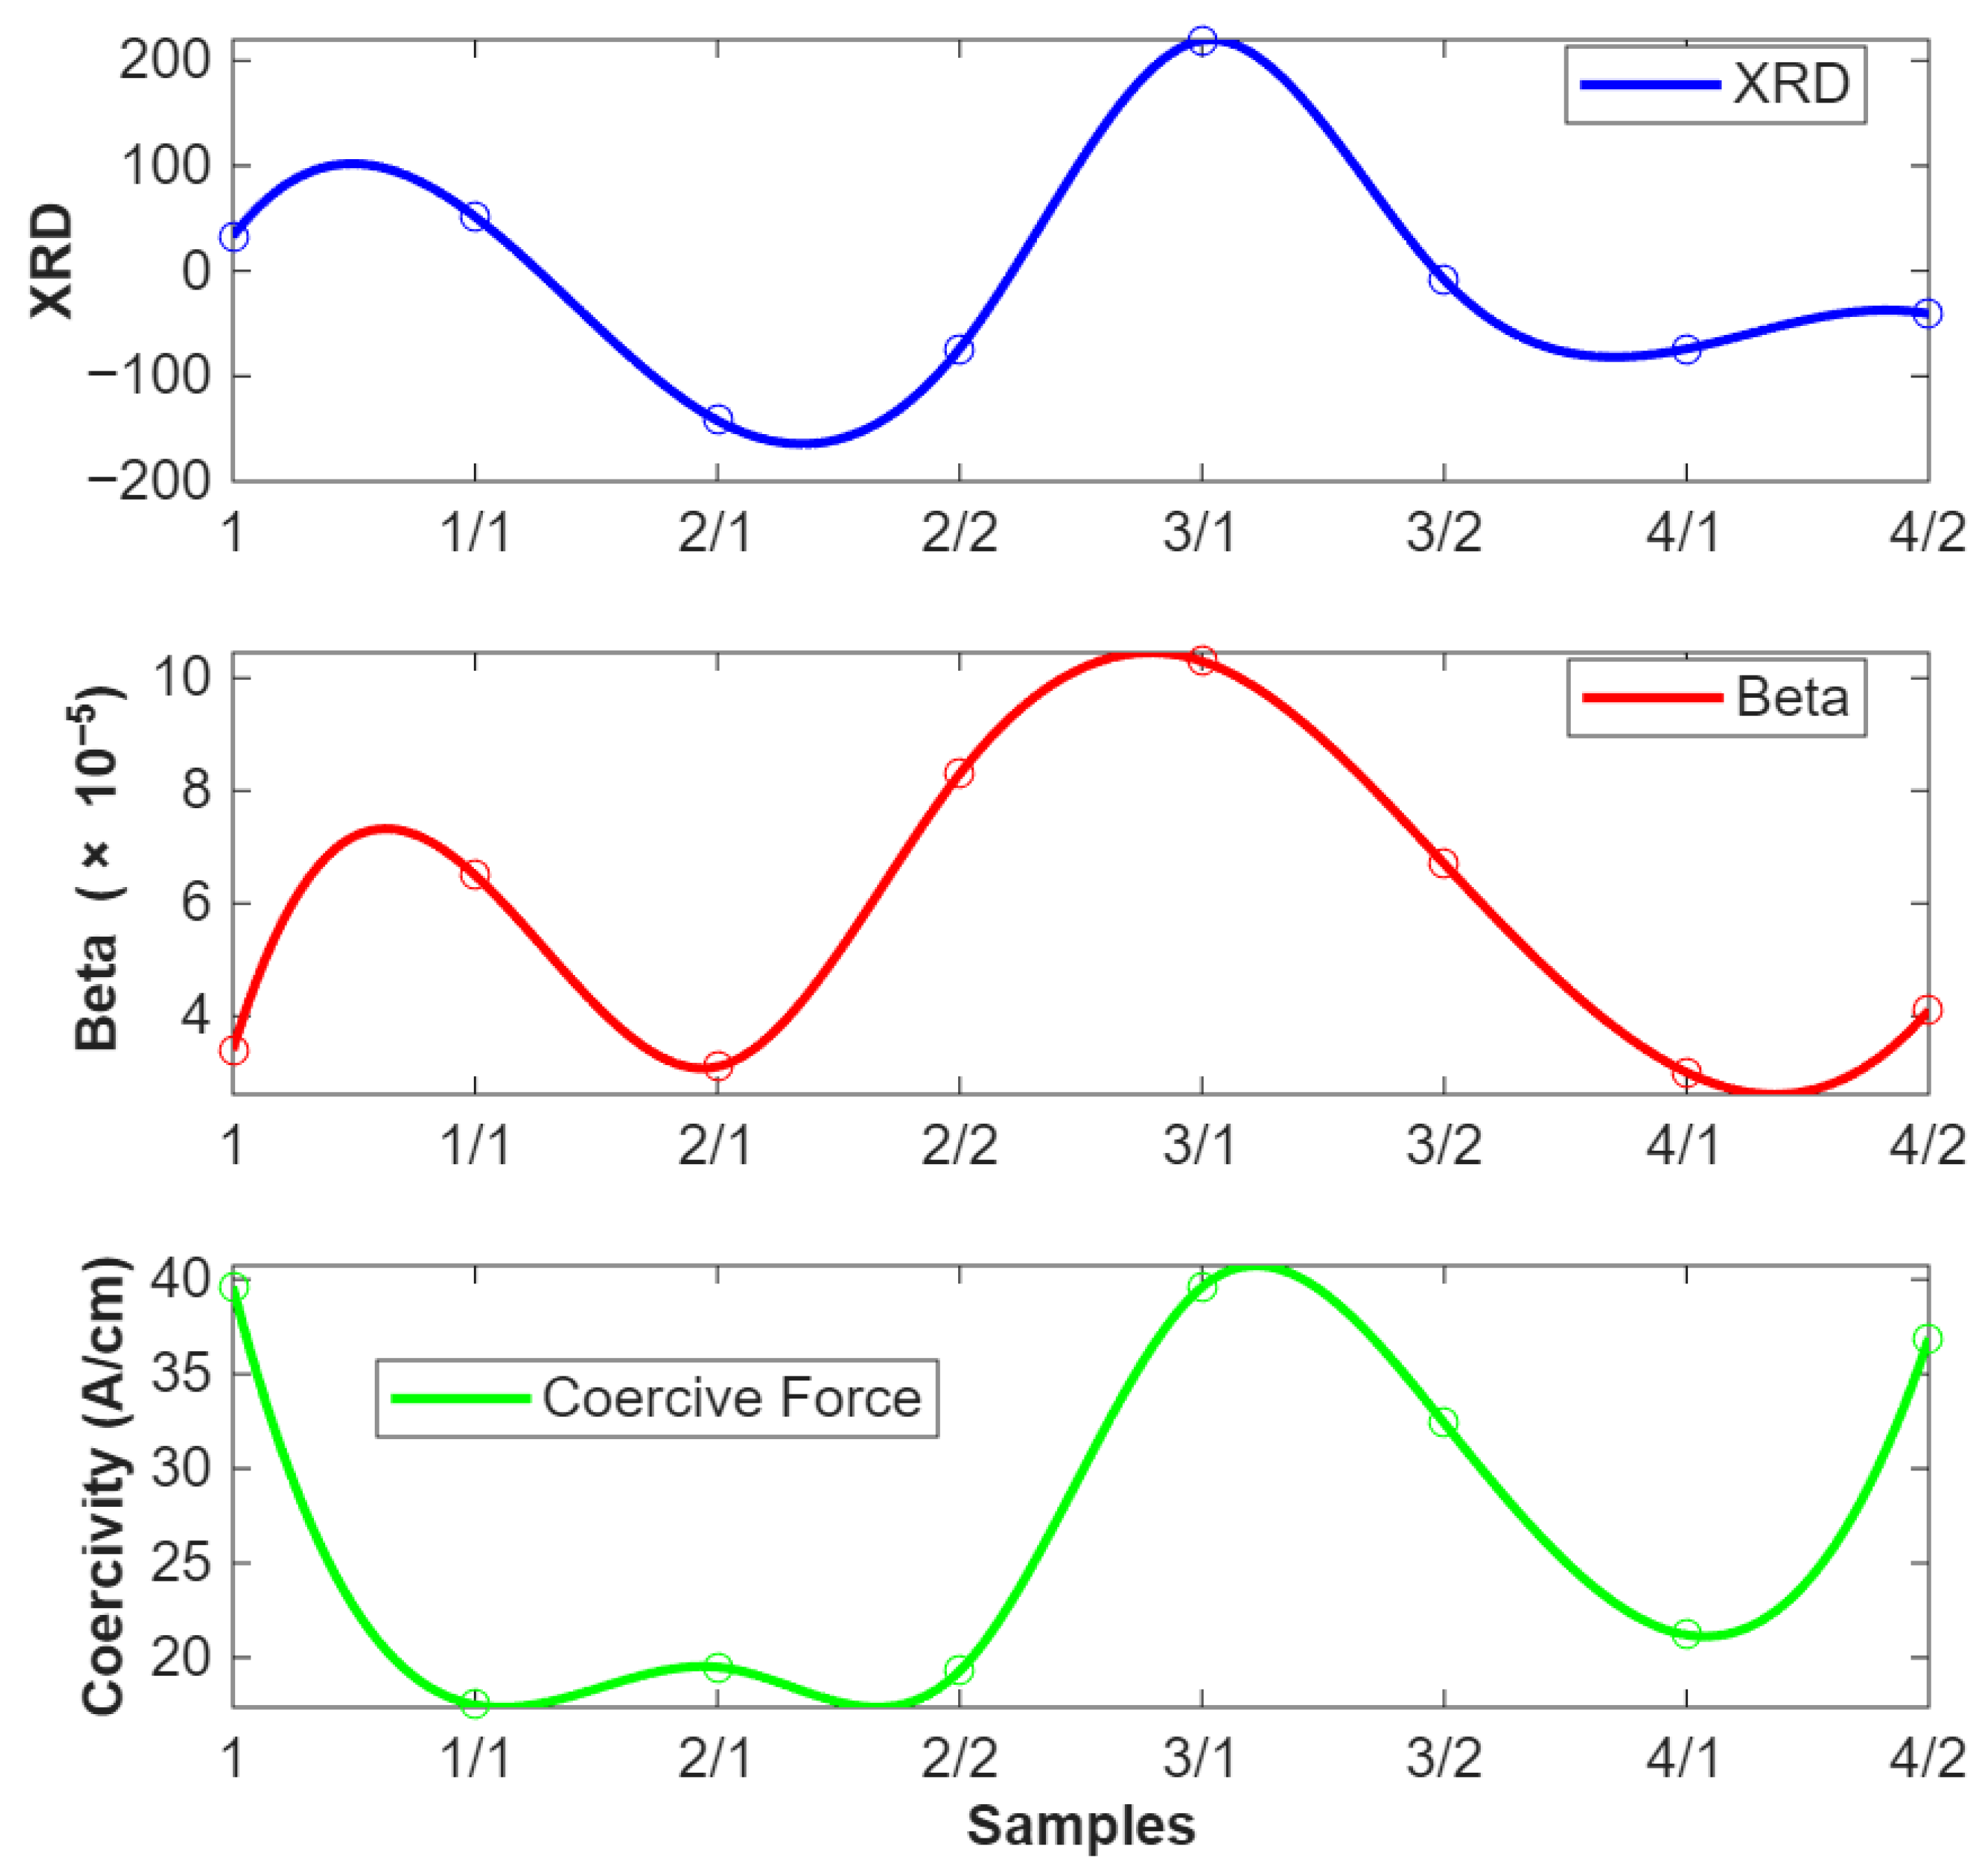
Figure 17 features three-line plots that display measurements of XRD, β, and Coercive force across eight steel roll-cut samples. The top panel shows XRD data, which indicates residual stress, with positive values representing tensile stress and negative values representing compressive stress. For instance, sample 3/1 has a peak in XRD, indicating significant tensile stress, while sample 2/1 shows a trough, suggesting compressive stress.
The middle panel displays the β plot, which reflects variations in crystallite size and is also related to relative residual stress. Higher β values, such as those seen in sample 3/1, are consistent with greater residual stress, echoing the trends observed in the XRD data. In the bottom panel, the Coercive force plot measures the material’s resistance to demagnetization. Variations in coercivity can be associated with changes in residual stress, with samples showing lower coercivity (like 1/1 and 2/1) potentially having less residual stress, while higher coercivity in samples such as 3/1 indicates more significant residual stress. Overall, the plots show a similar trend across the measurements, with XRD, β, and Coercivity all reflecting variations in residual stress.
5.3. Analysis of Sidenor Lab Samples
The XRD results from six different points (
Figure 5C) were collected, as detailed in
Table 11 of
Table 2 Specimens. The data encompasses multiple stress (σ) measurements at each point, labelled as 1/1, 1/2, 2/1, 2/2, 3/1, 3/2, 4/1, and 4/2 and are recorded in MPa. These measurements reveal the stress variations at different points across the sample, highlighting both positive and negative stress values. To streamline the analysis and present a more comprehensive overview, the individual measurements from points 2 and 3 were averaged from the XRD results. This averaging process aimed to condense the data into a single representative value, providing a comparative understanding of the stress distribution at the centre of the samples. The averaged results are shown in
Table 11. The β and coercive force values obtained at point 3 from all the samples are also added to the comparative table.
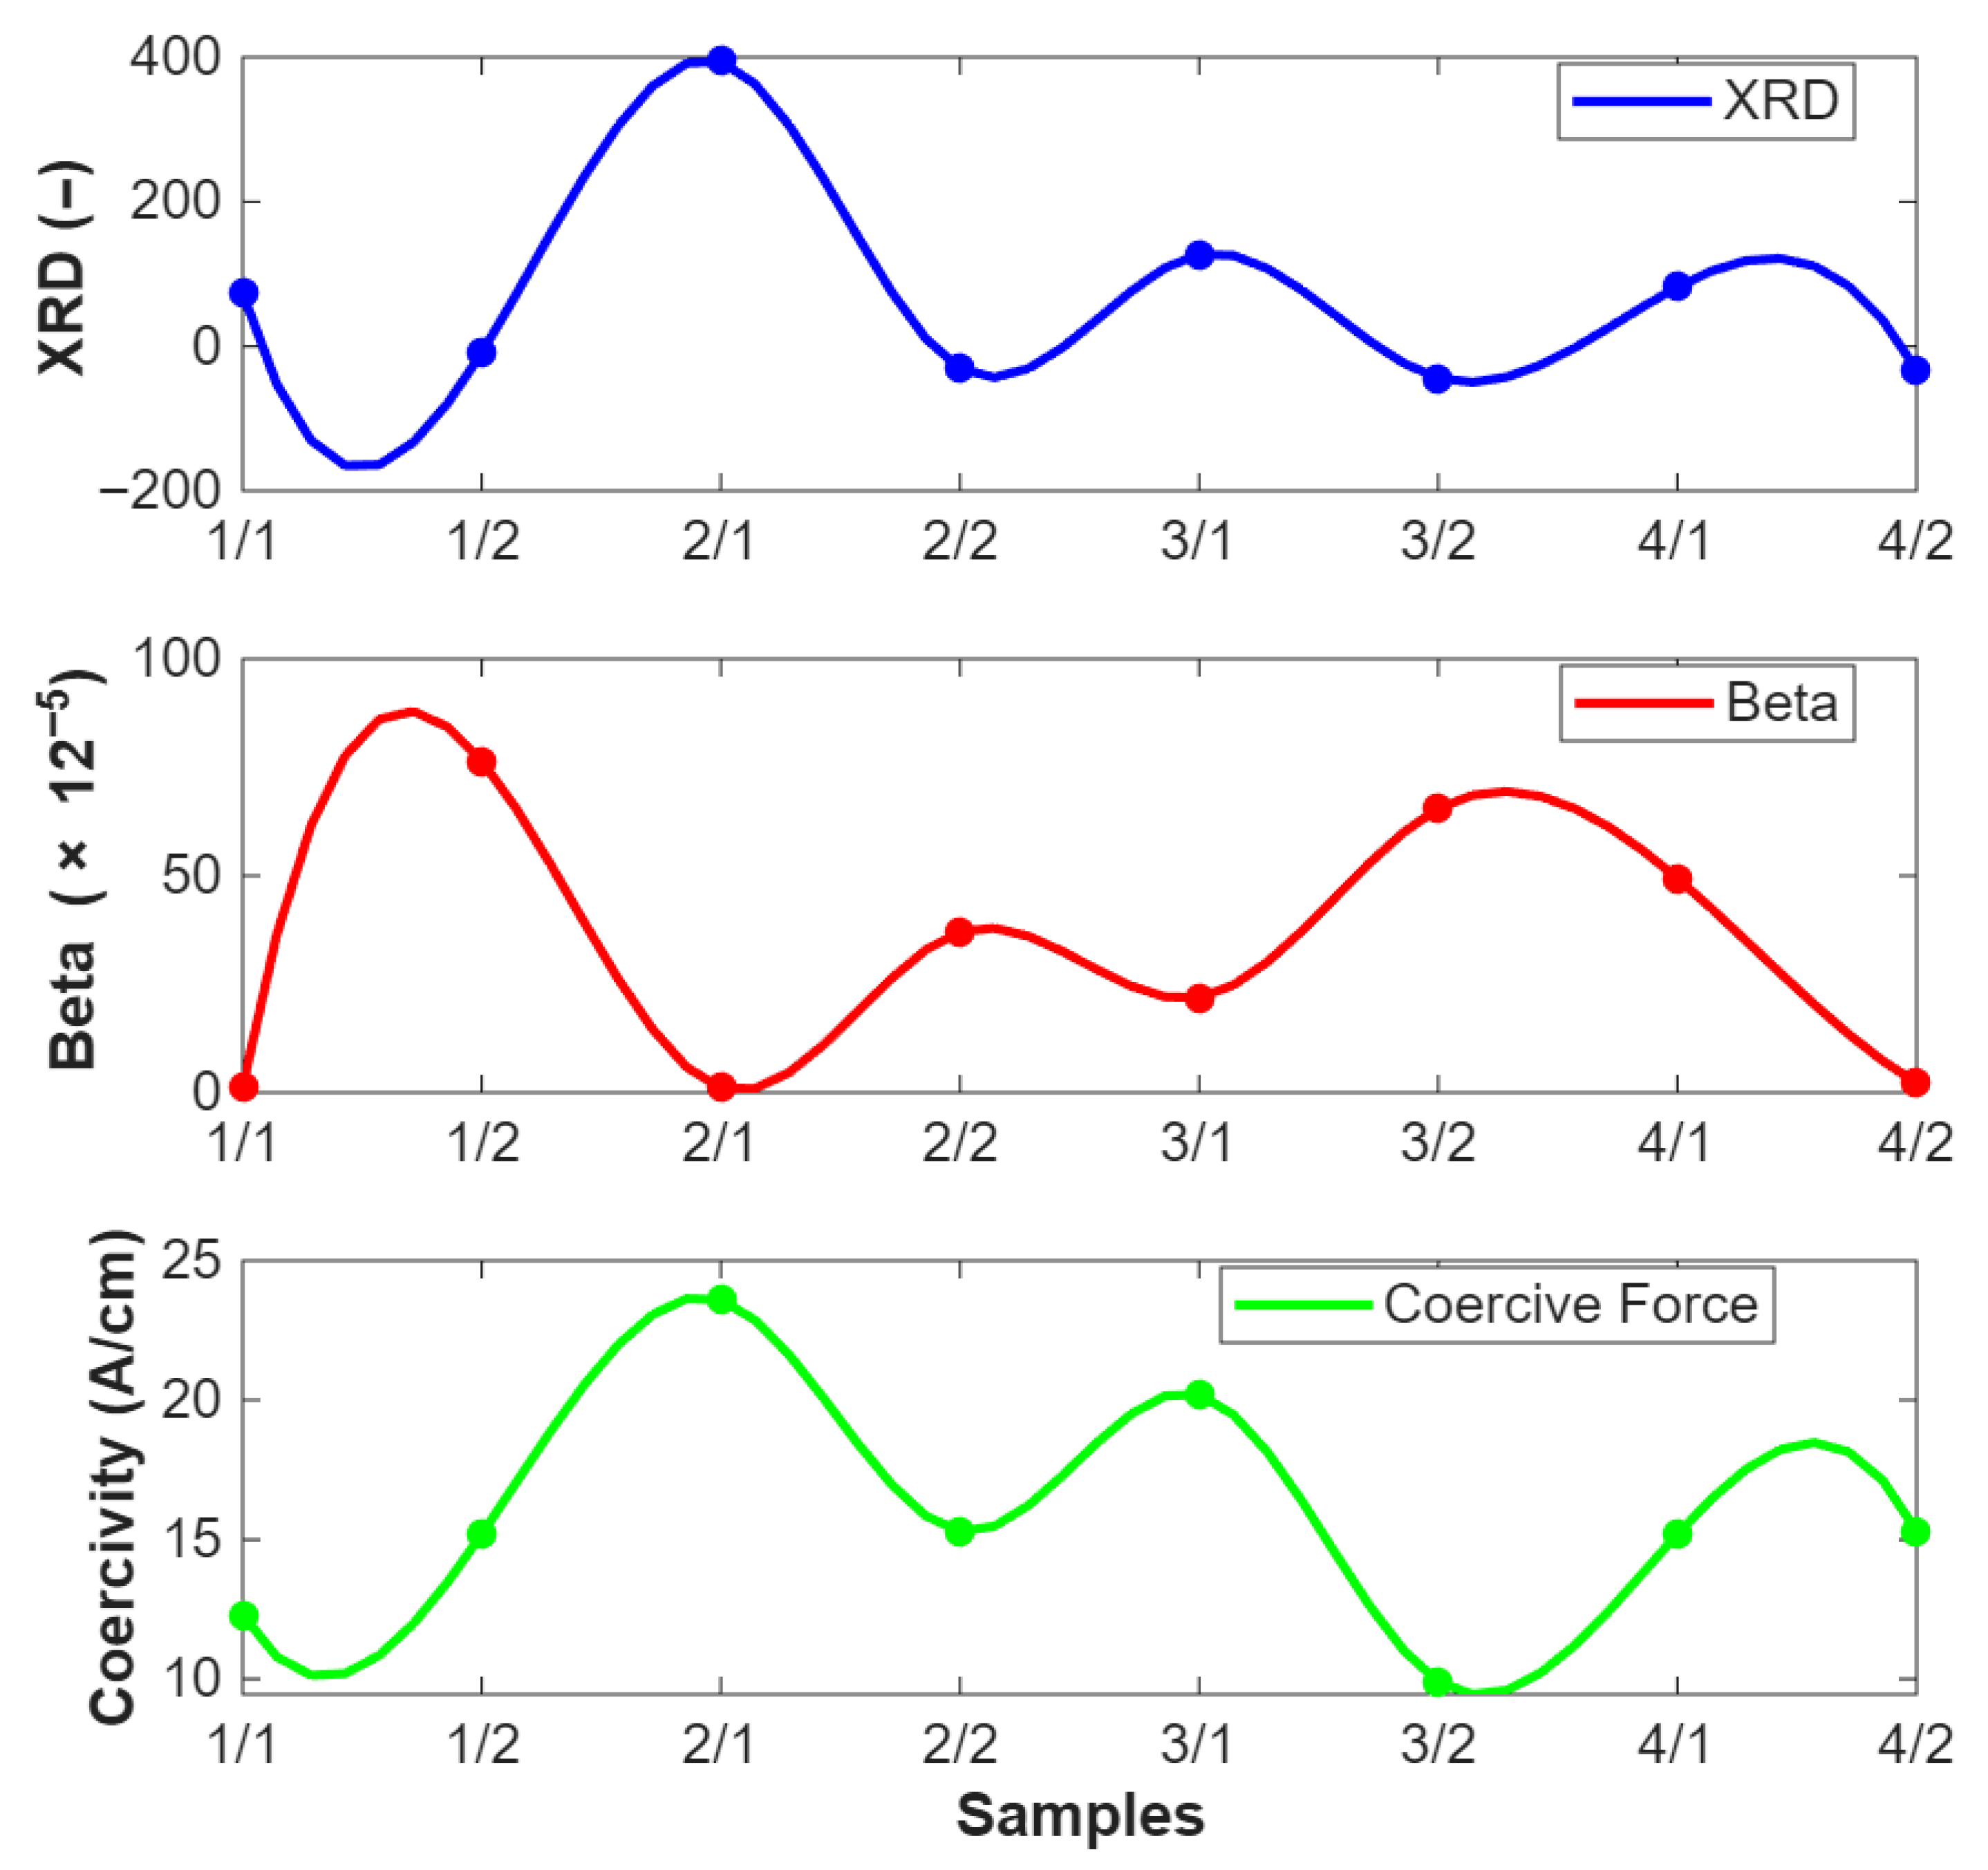
The top graph in
Figure 18 shows XRD measurements across various samples. The values vary significantly across samples, indicating differences in the lattice strain and hence the residual stress. The middle graph represents the nonlinear ultrasonic parameter β. The trend here also shows variation across samples, with some positive trend to the XRD data, suggesting that this method is sensitive to the same types of internal changes. The bottom graph shows Coercivity measurements, which indicate how the material’s magnetic properties are affected by internal stresses. The trend in this graph appears to be a good fit with the other two methods to some extent, especially in samples where the XRD and β values are high.
All three methods, XRD, β, and Coercivity, are sensitive to changes in the material’s microstructure, which are often induced by residual stresses. This similarity suggests that each method is capable of detecting the internal stress state of the material from different perspectives. While there is some positive trend between the methods (e.g., high XRD values often coincide with high β or Coercive force values), the differences also highlight that each method might be more sensitive to different types of microstructural changes. This variability is crucial for gaining a complete picture of the residual stress distribution and its effects on the material.
5.4. Continuous Monitoring of Industrial Rolls
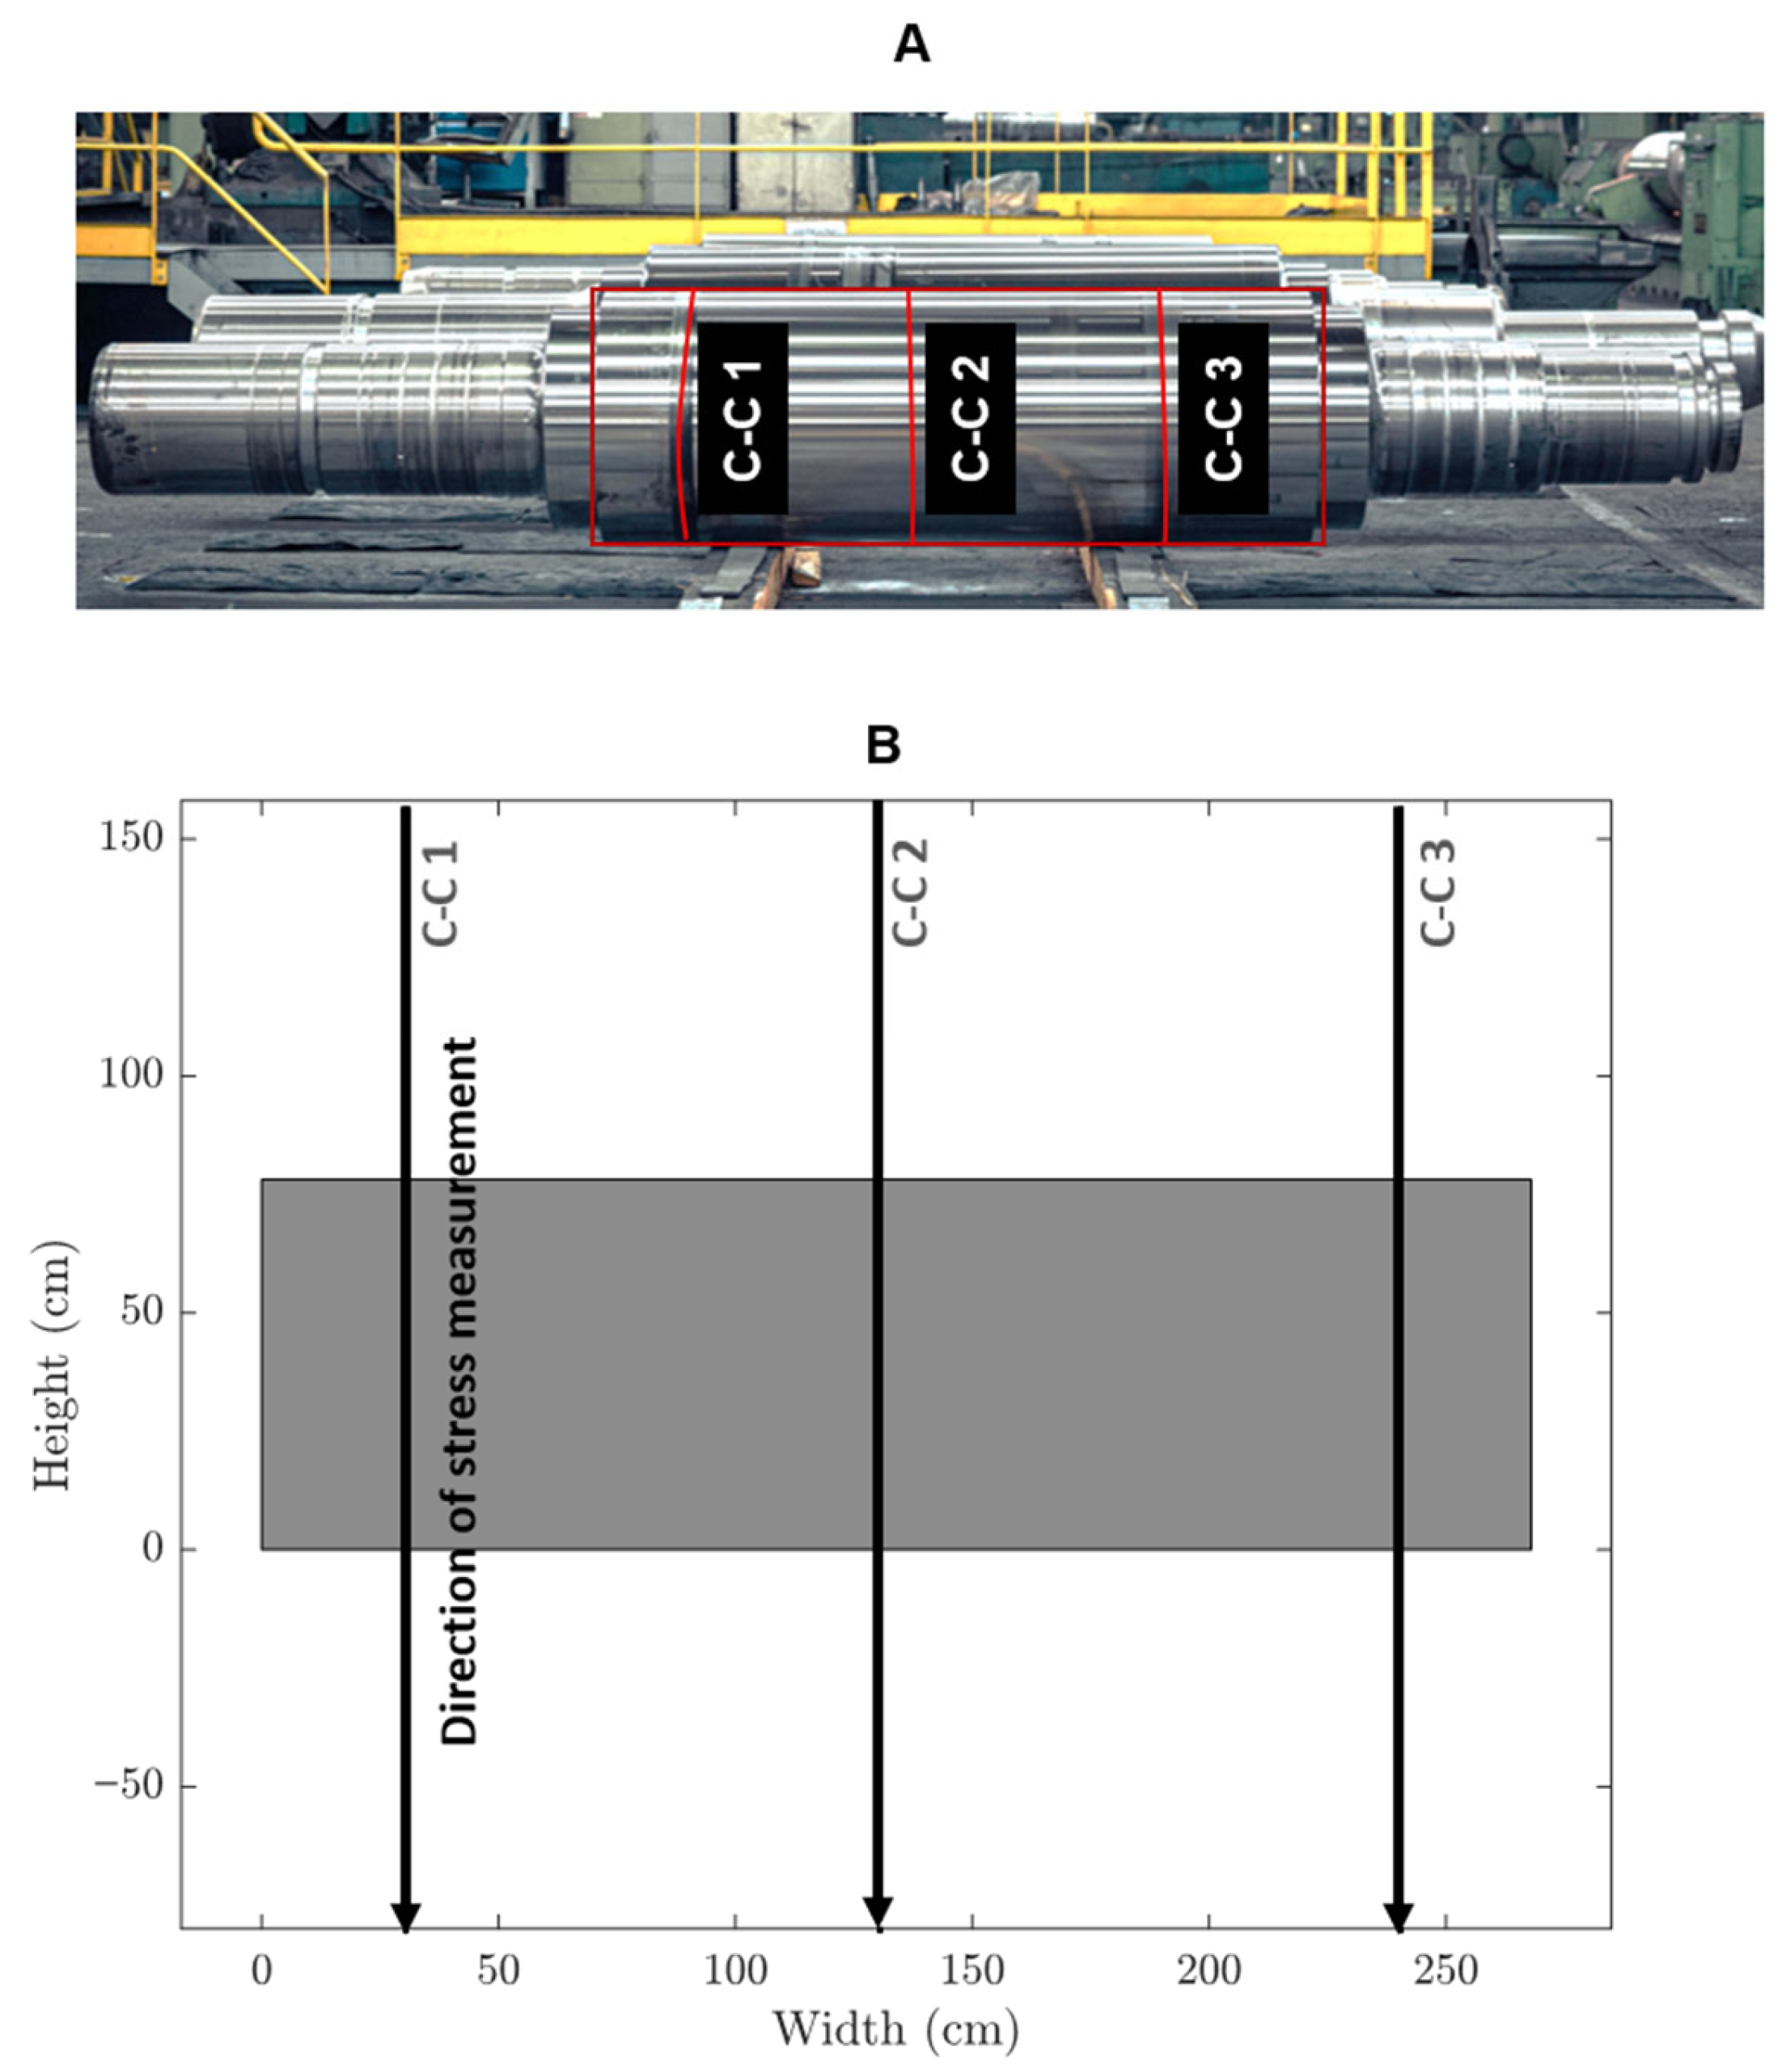
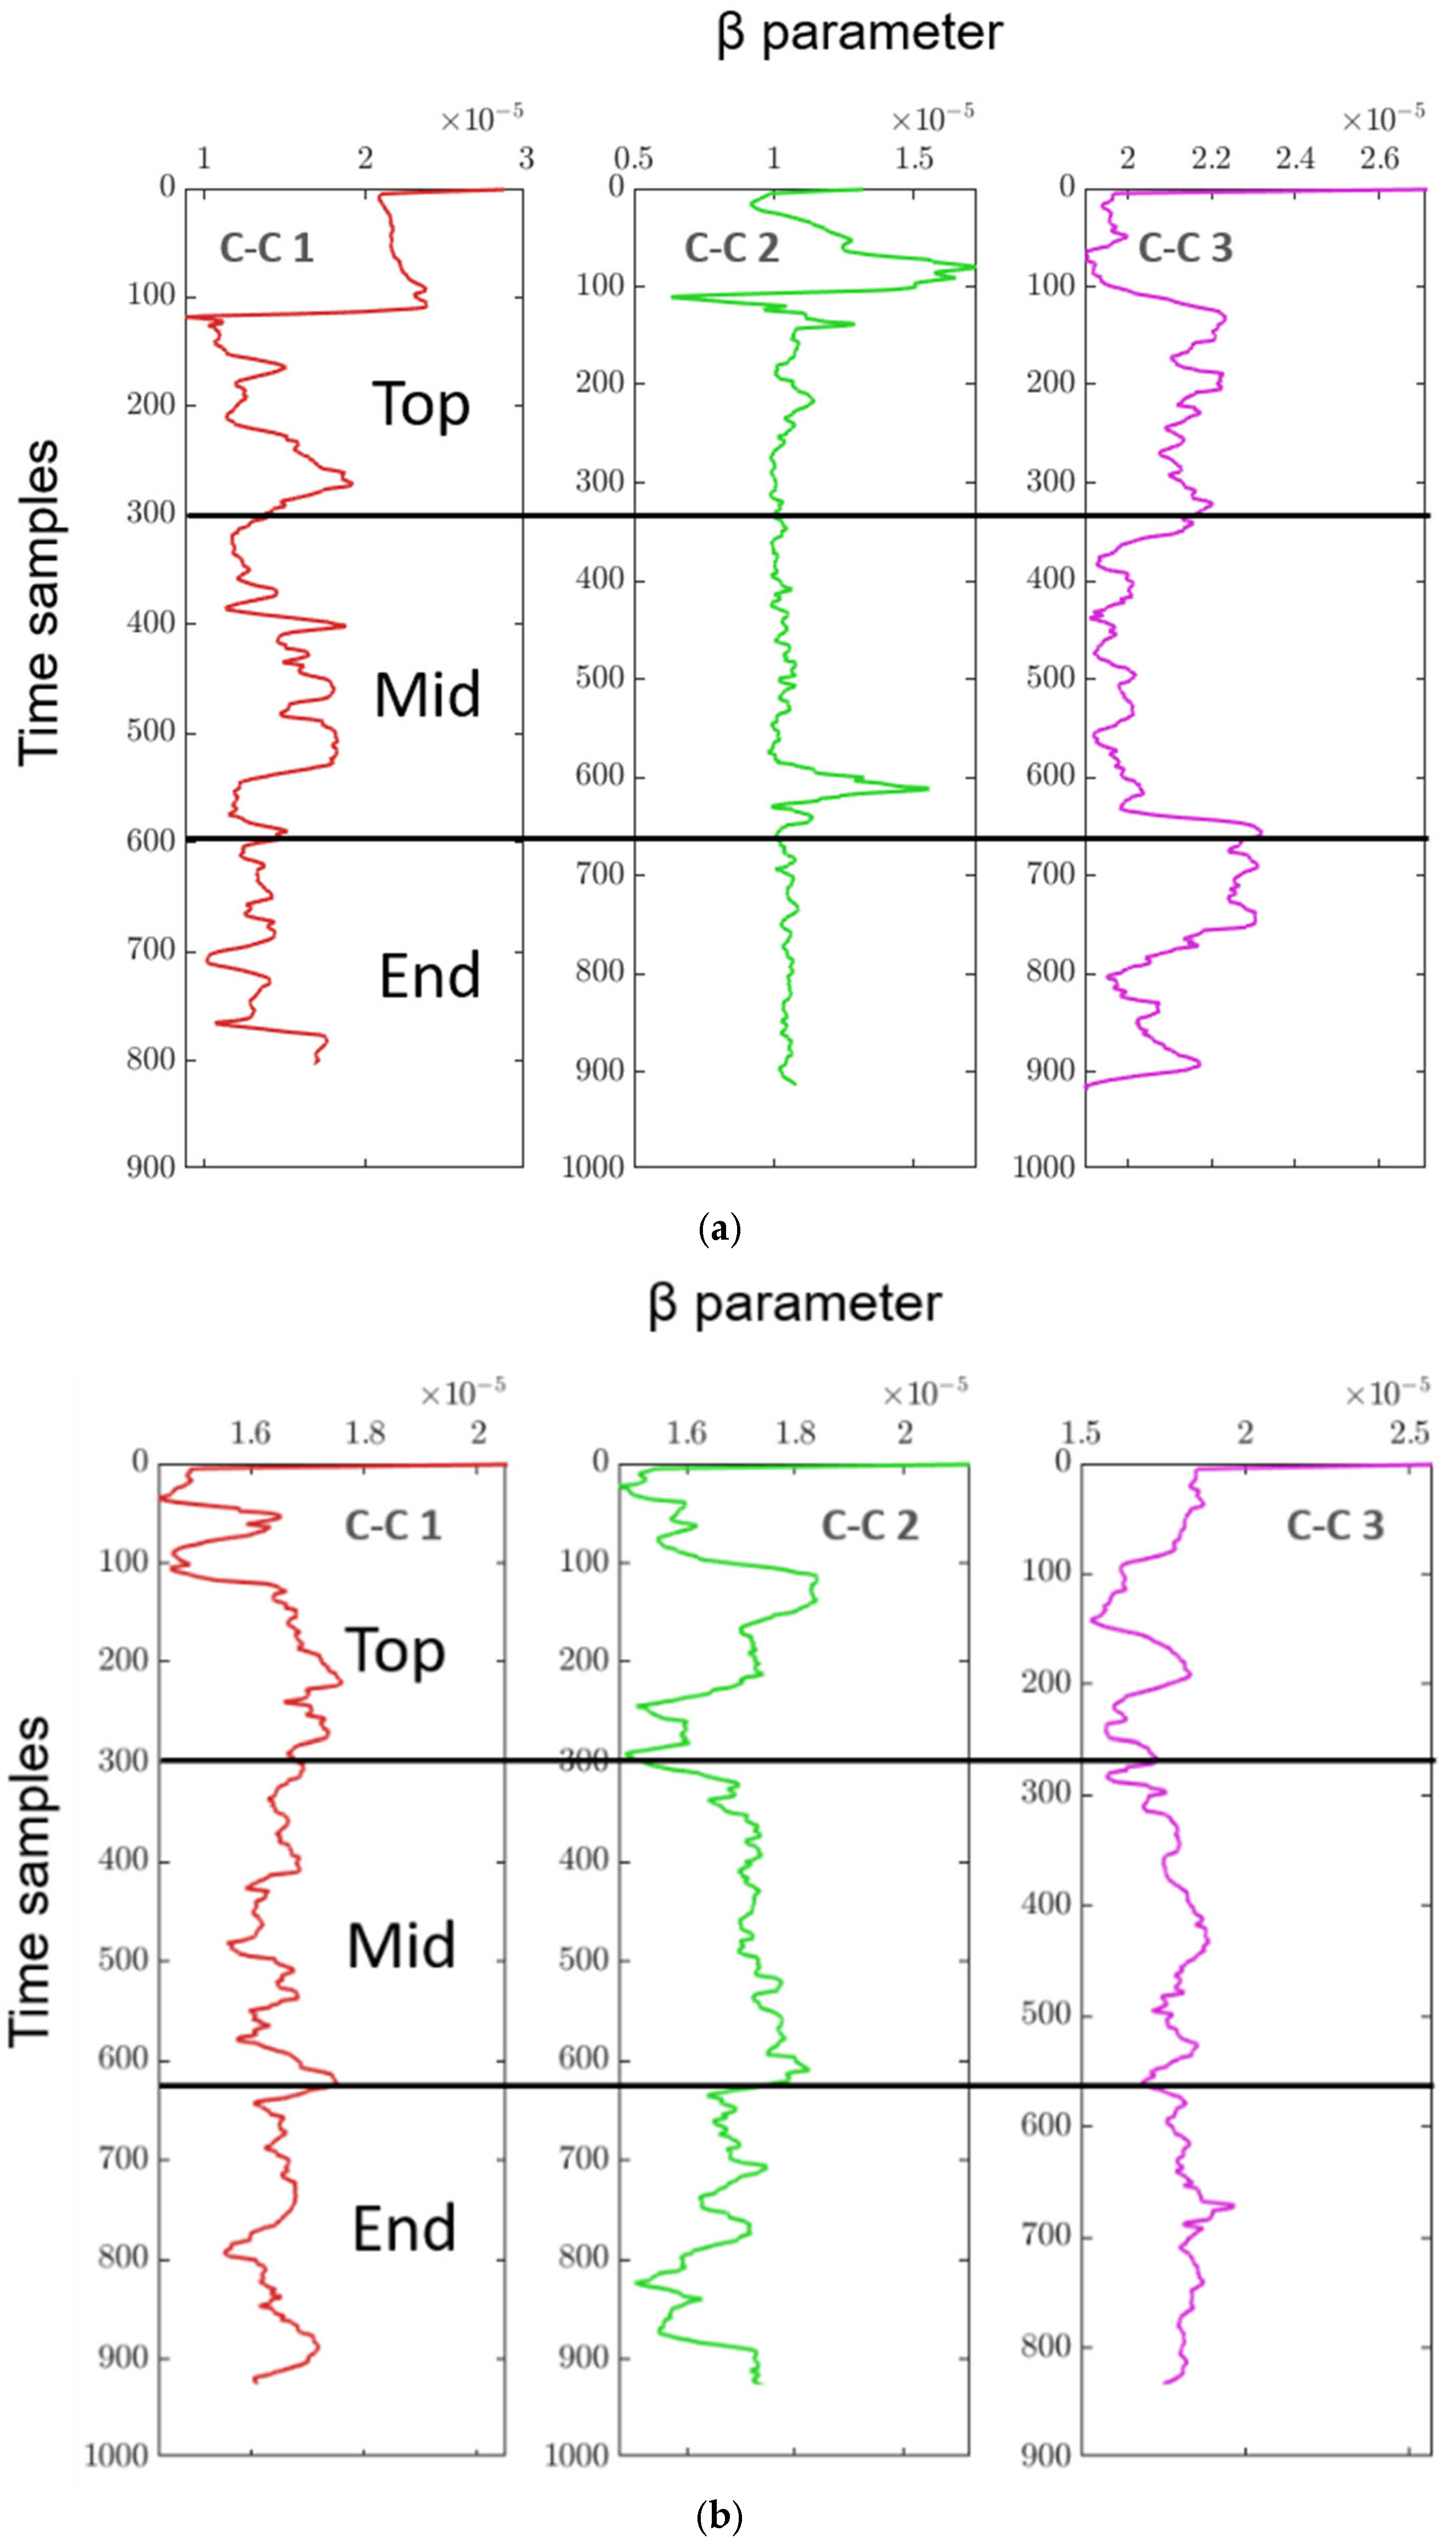
In
Figure 19, the continuous monitoring results of the β parameter are shown for three columns (C-C 1, C-C 2, and C-C 3 as shown in
Figure 12) at different positions (Top, mid, and End) before and after a grinding process.
Figure 19a shows the β values before grinding for the top, mid, and end sections of the columns of a steel roll. The β parameter fluctuates continuously for each column and section, indicating the nonlinear behaviour of the specimen material. For each of the three columns (C-C 1, C-C 2, C-C 3), the time samples on the
y-axis represent the progression of continuous inspection over time, while the
x-axis shows the measured β parameter values.
Figure 19b displays the β parameter measurements after grinding of the same steel roll. Similar to
Figure 19a, the results for the top, mid, and end positions are presented for each column. The fluctuations of the β parameter still exist but are notably smoother in some regions compared to before grinding, suggesting a change in material properties due to the grinding process. In both figures, the analysis was performed continuously across the columns, as explained in
Figure 12, to monitor the specimen’s condition in real time. Further observation of the probable tension and compression in the measured whole specimen is explained in
Table 12 (T: probable region of tension, C: probable region of compression). The data helps highlight the changes in material behaviour both pre- and post-grinding, showing how the nonlinear characteristics evolve through continuous β parameter evaluation across different sections of the columns.
Table 12 presents an analysis of steel rolls before and after grinding, comparing different surface states (from the foundry and after finishing) across three positions on the roll: Top, Mid, and End. The focus is on the variation in β values, which seem to indicate stress states related to T and C in these regions.
Steel roll before grinding:
The steel rolls are in a heat-treated state and roughly ground. Across the different sections of the sample (C-C 1, C-C 2, and C-C 3), similar patterns are observed:
Top: There is a noticeable fluctuation in β values, suggesting both T and C regions. This indicates that the surface is under varied mechanical stress, where certain areas are being stretched (tension) while others are compressed.
Mid: The β values show fluctuation, indicating a mix of T and C states. This combined stress profile may result from uneven cooling or handling during heat treatment, leading to residual stresses in the steel.
End: Like the mid-section, the β values indicate a combination of T and C regions.
The variation in β values before grinding suggests that the steel rolls, while heat-treated, have not reached a balanced or uniform stress state. This could impact the material’s structural integrity if left untreated, possibly causing issues during later processing steps.
Steel roll after grinding:
Top: The β values continue to fluctuate, but there is still a suggestion of combined T and C regions, indicating that the grinding process has not fully relieved the stress in this part.
Mid: The β values remain fluctuating, showing a persistent mix of T and C states, similar to before grinding.
End: Interestingly, the β values are now more stable, suggesting a more balanced stress state after grinding. This is especially notable in the C-C 2 section of the sample, where the end section exhibits stable values, pointing to a significant improvement in reducing residual stresses.
Overall, grinding does affect the stress profile of the steel rolls, particularly at the ends, where a more balanced stress state is achieved post-grinding. This might be due to the removal of surface irregularities or defects that were present in the rough state. Despite this, the top and mid-sections continue to show combined T and C regions, which suggests that grinding alone may not be sufficient to eliminate all residual stresses in these areas. The persistence of fluctuating β values in the top and mid-regions even after grinding may indicate the need for additional stress-relief processes, such as further heat treatment or controlled machining. While the grinding helps in balancing the stress state, particularly at the ends of the rolls, tension and compression remain a challenge in the top and mid-sections. These areas may require further attention to achieve a uniform stress distribution, which is critical for the roll’s performance and durability during its service life.
5.5. Statistical Correlation and Limitations
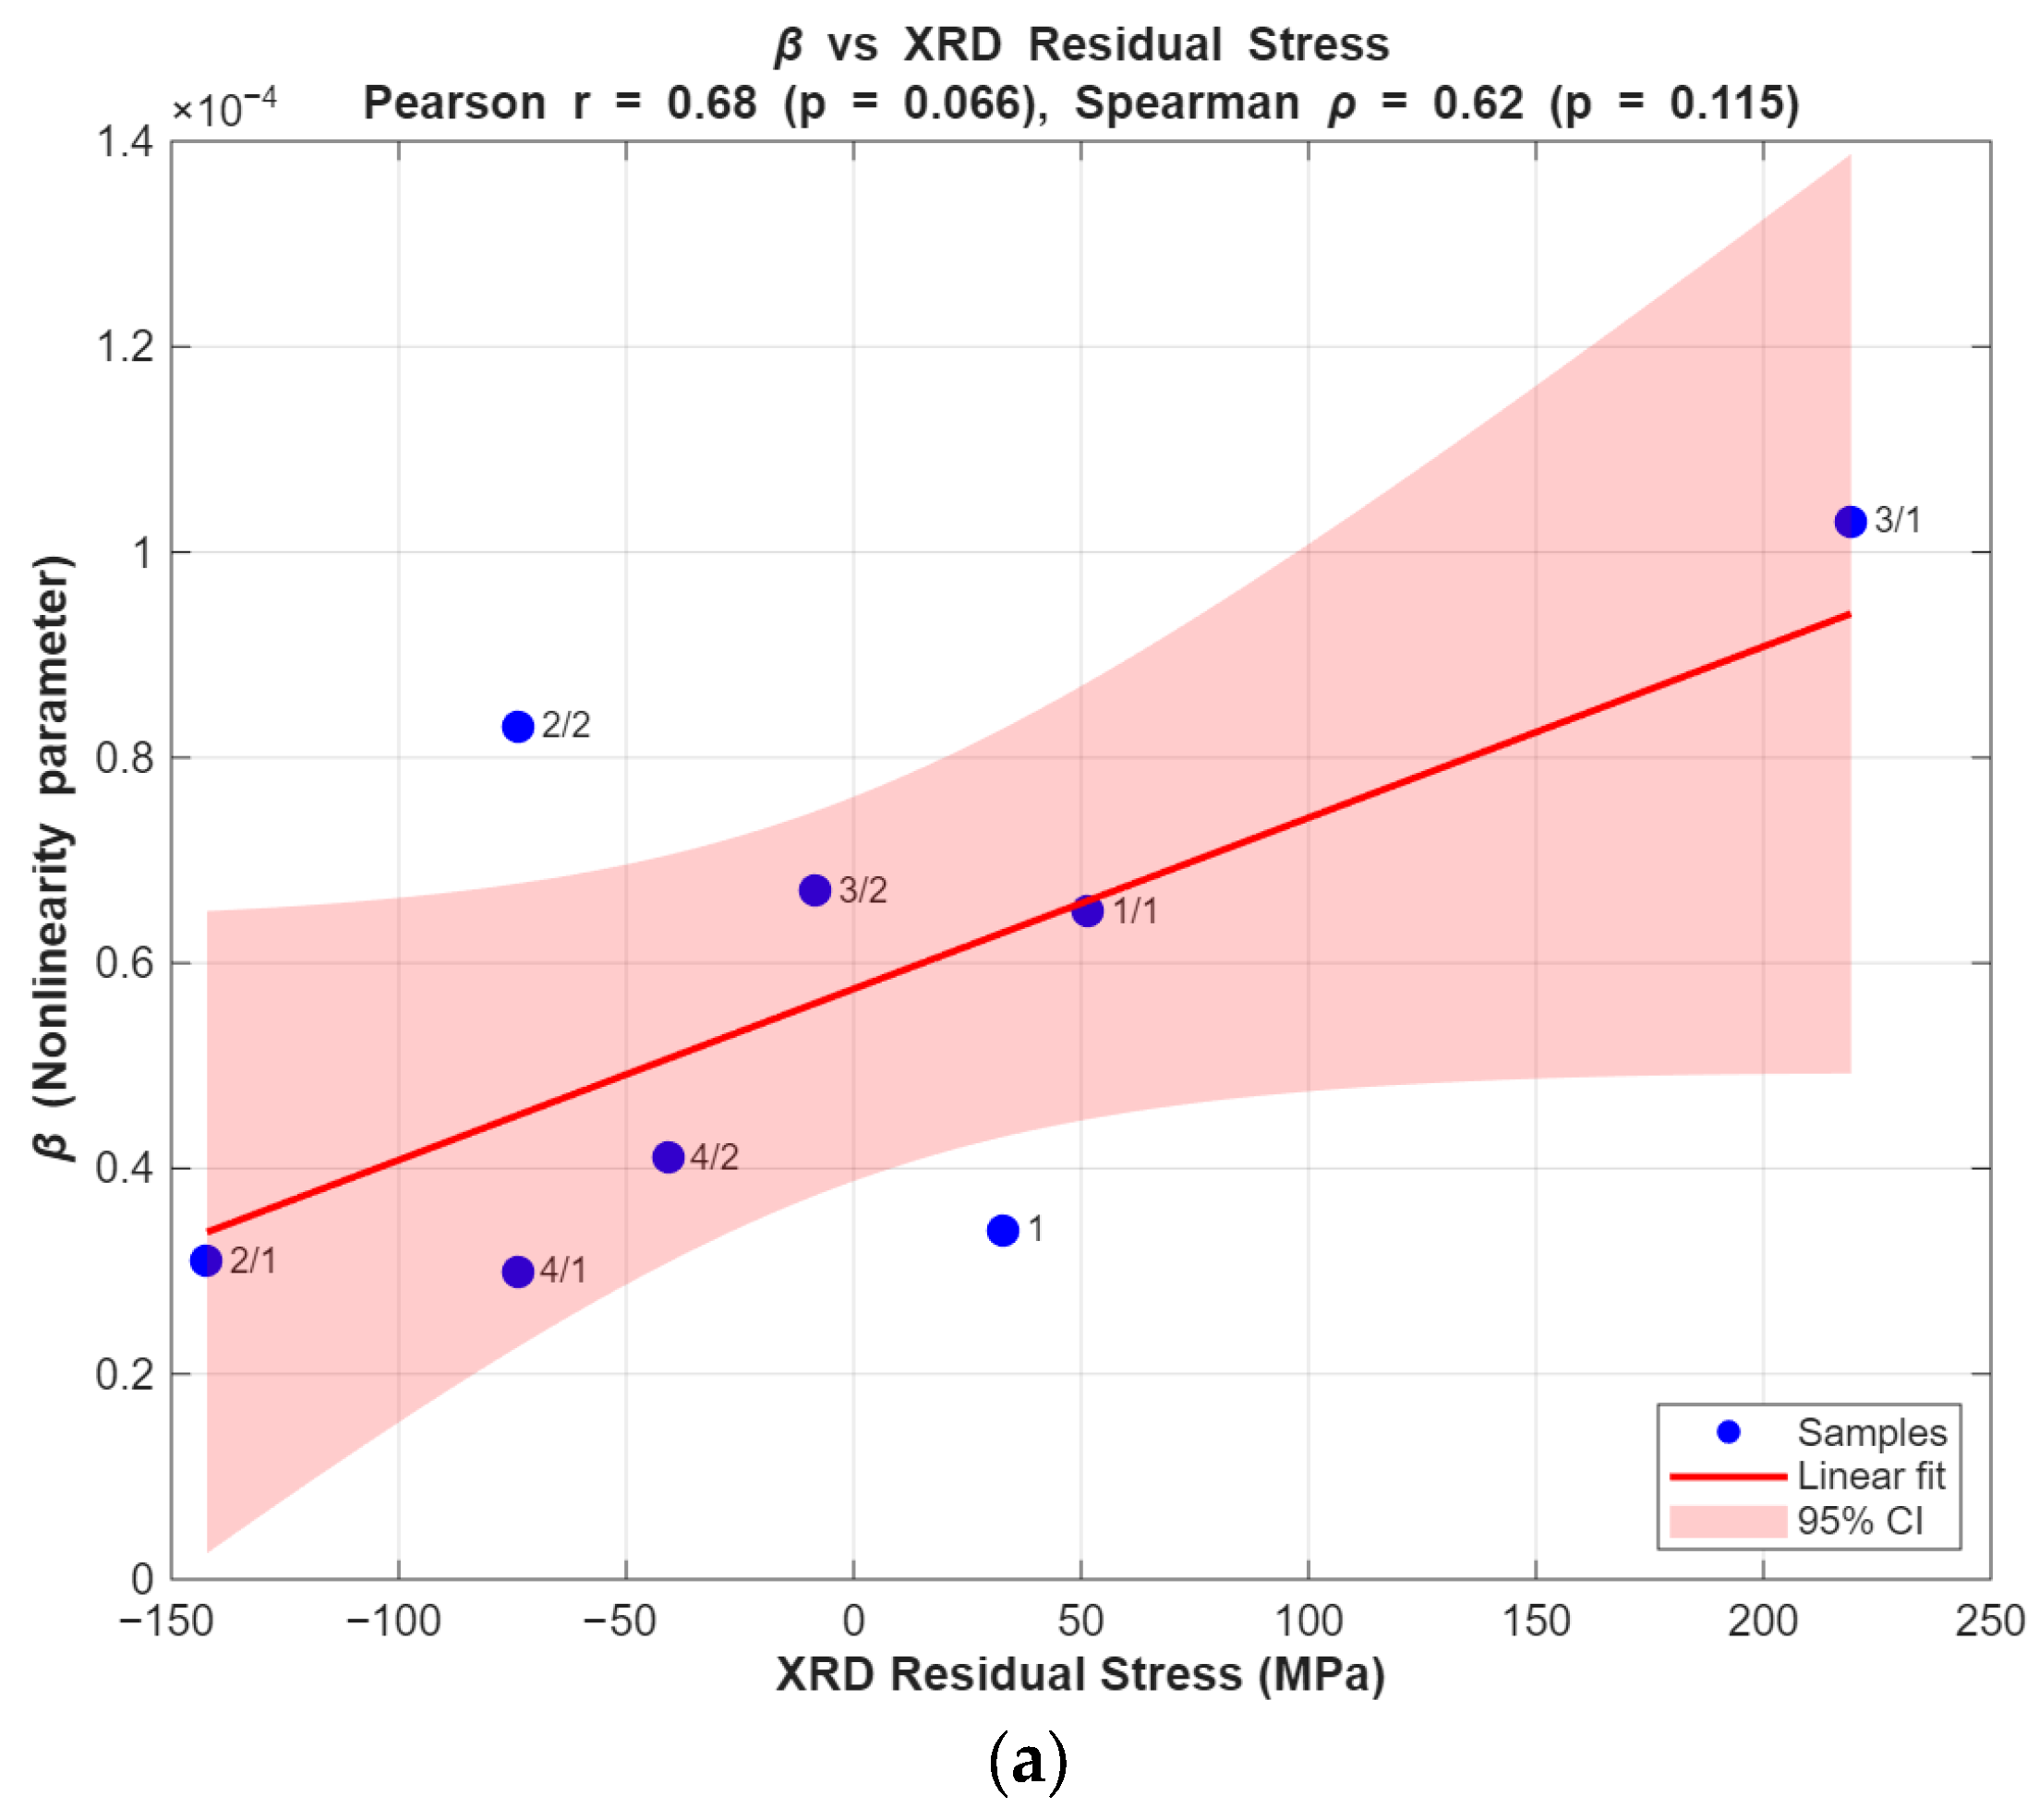
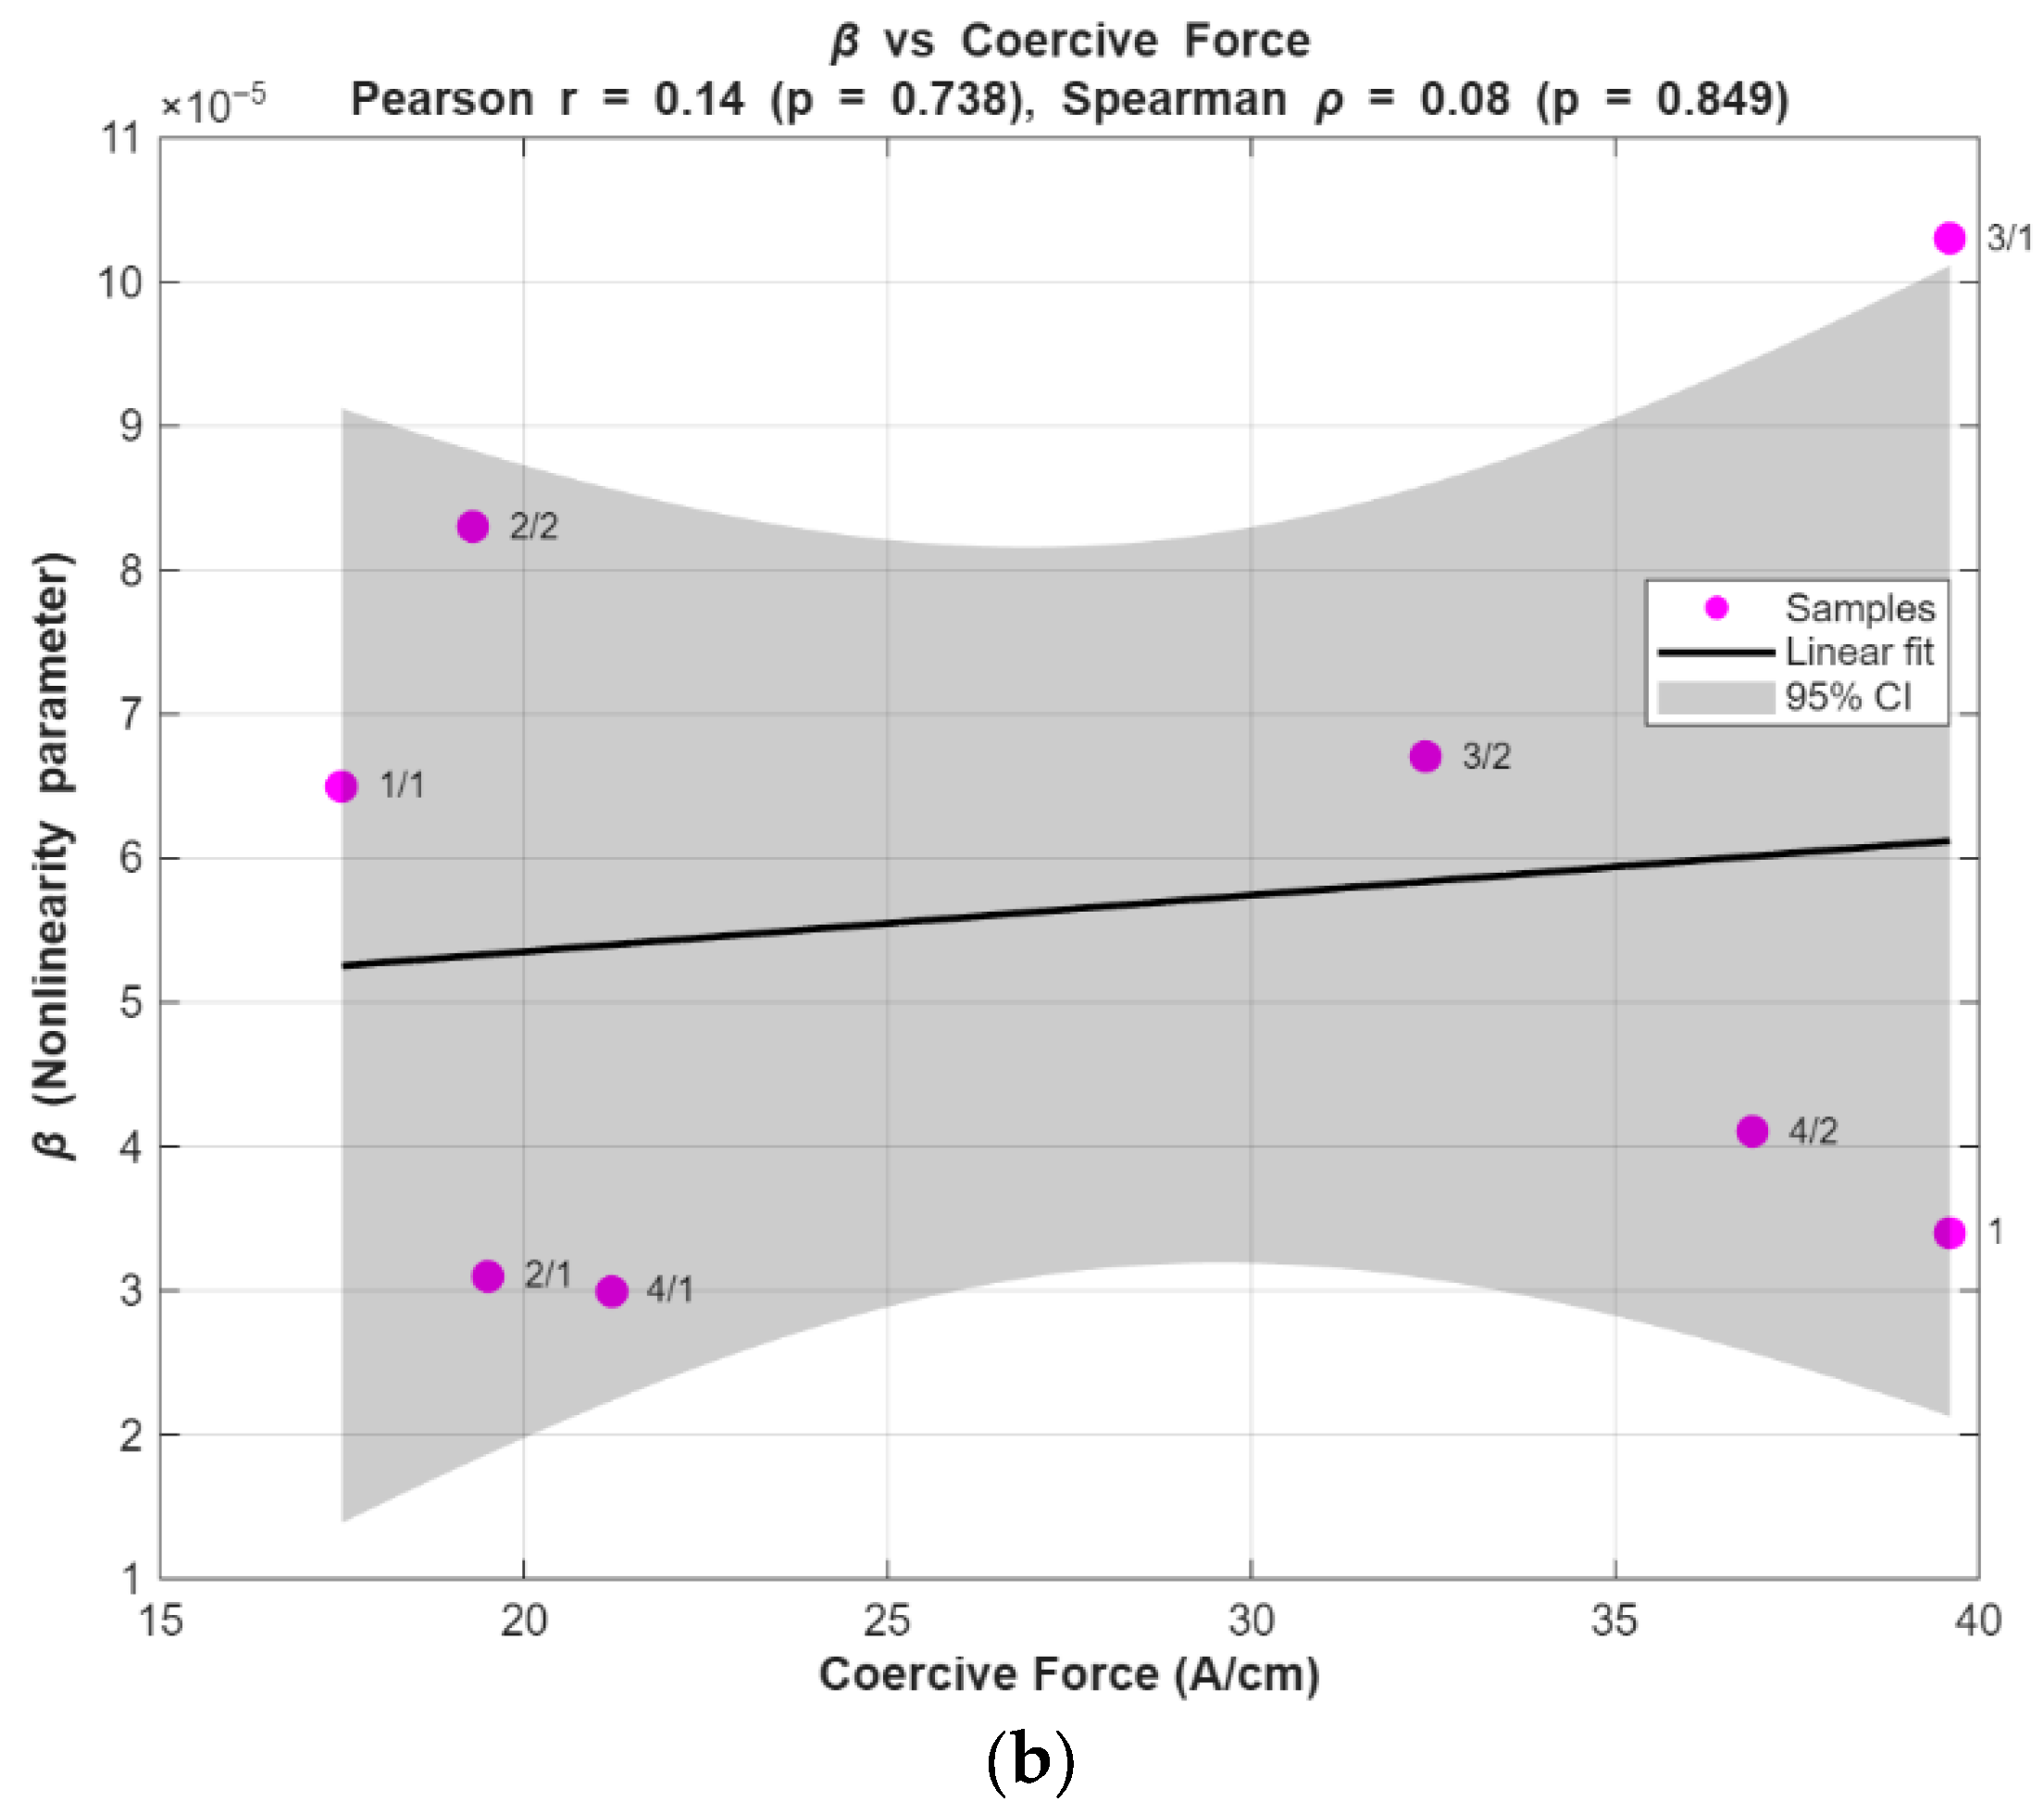
To quantify the relationship between the β and the reference measurements, Pearson and Spearman correlation coefficients were calculated for the Valji laboratory samples (n = 8). The Pearson correlation between β and XRD-measured residual stress is r = 0.68 (
p = 0.066), and the Spearman rank correlation is ρ = 0.62 (
p = 0.10), indicating a moderate positive association between β and XRD stress values. By contrast, the correlation between β and coercive force is weak (Pearson r = 0.14,
p = 0.74; Spearman ρ = 0.08,
p = 0.84). The plots obtained using the linear regression model are shown in
Figure 20 with a broader confidence level (CL) of 95%.
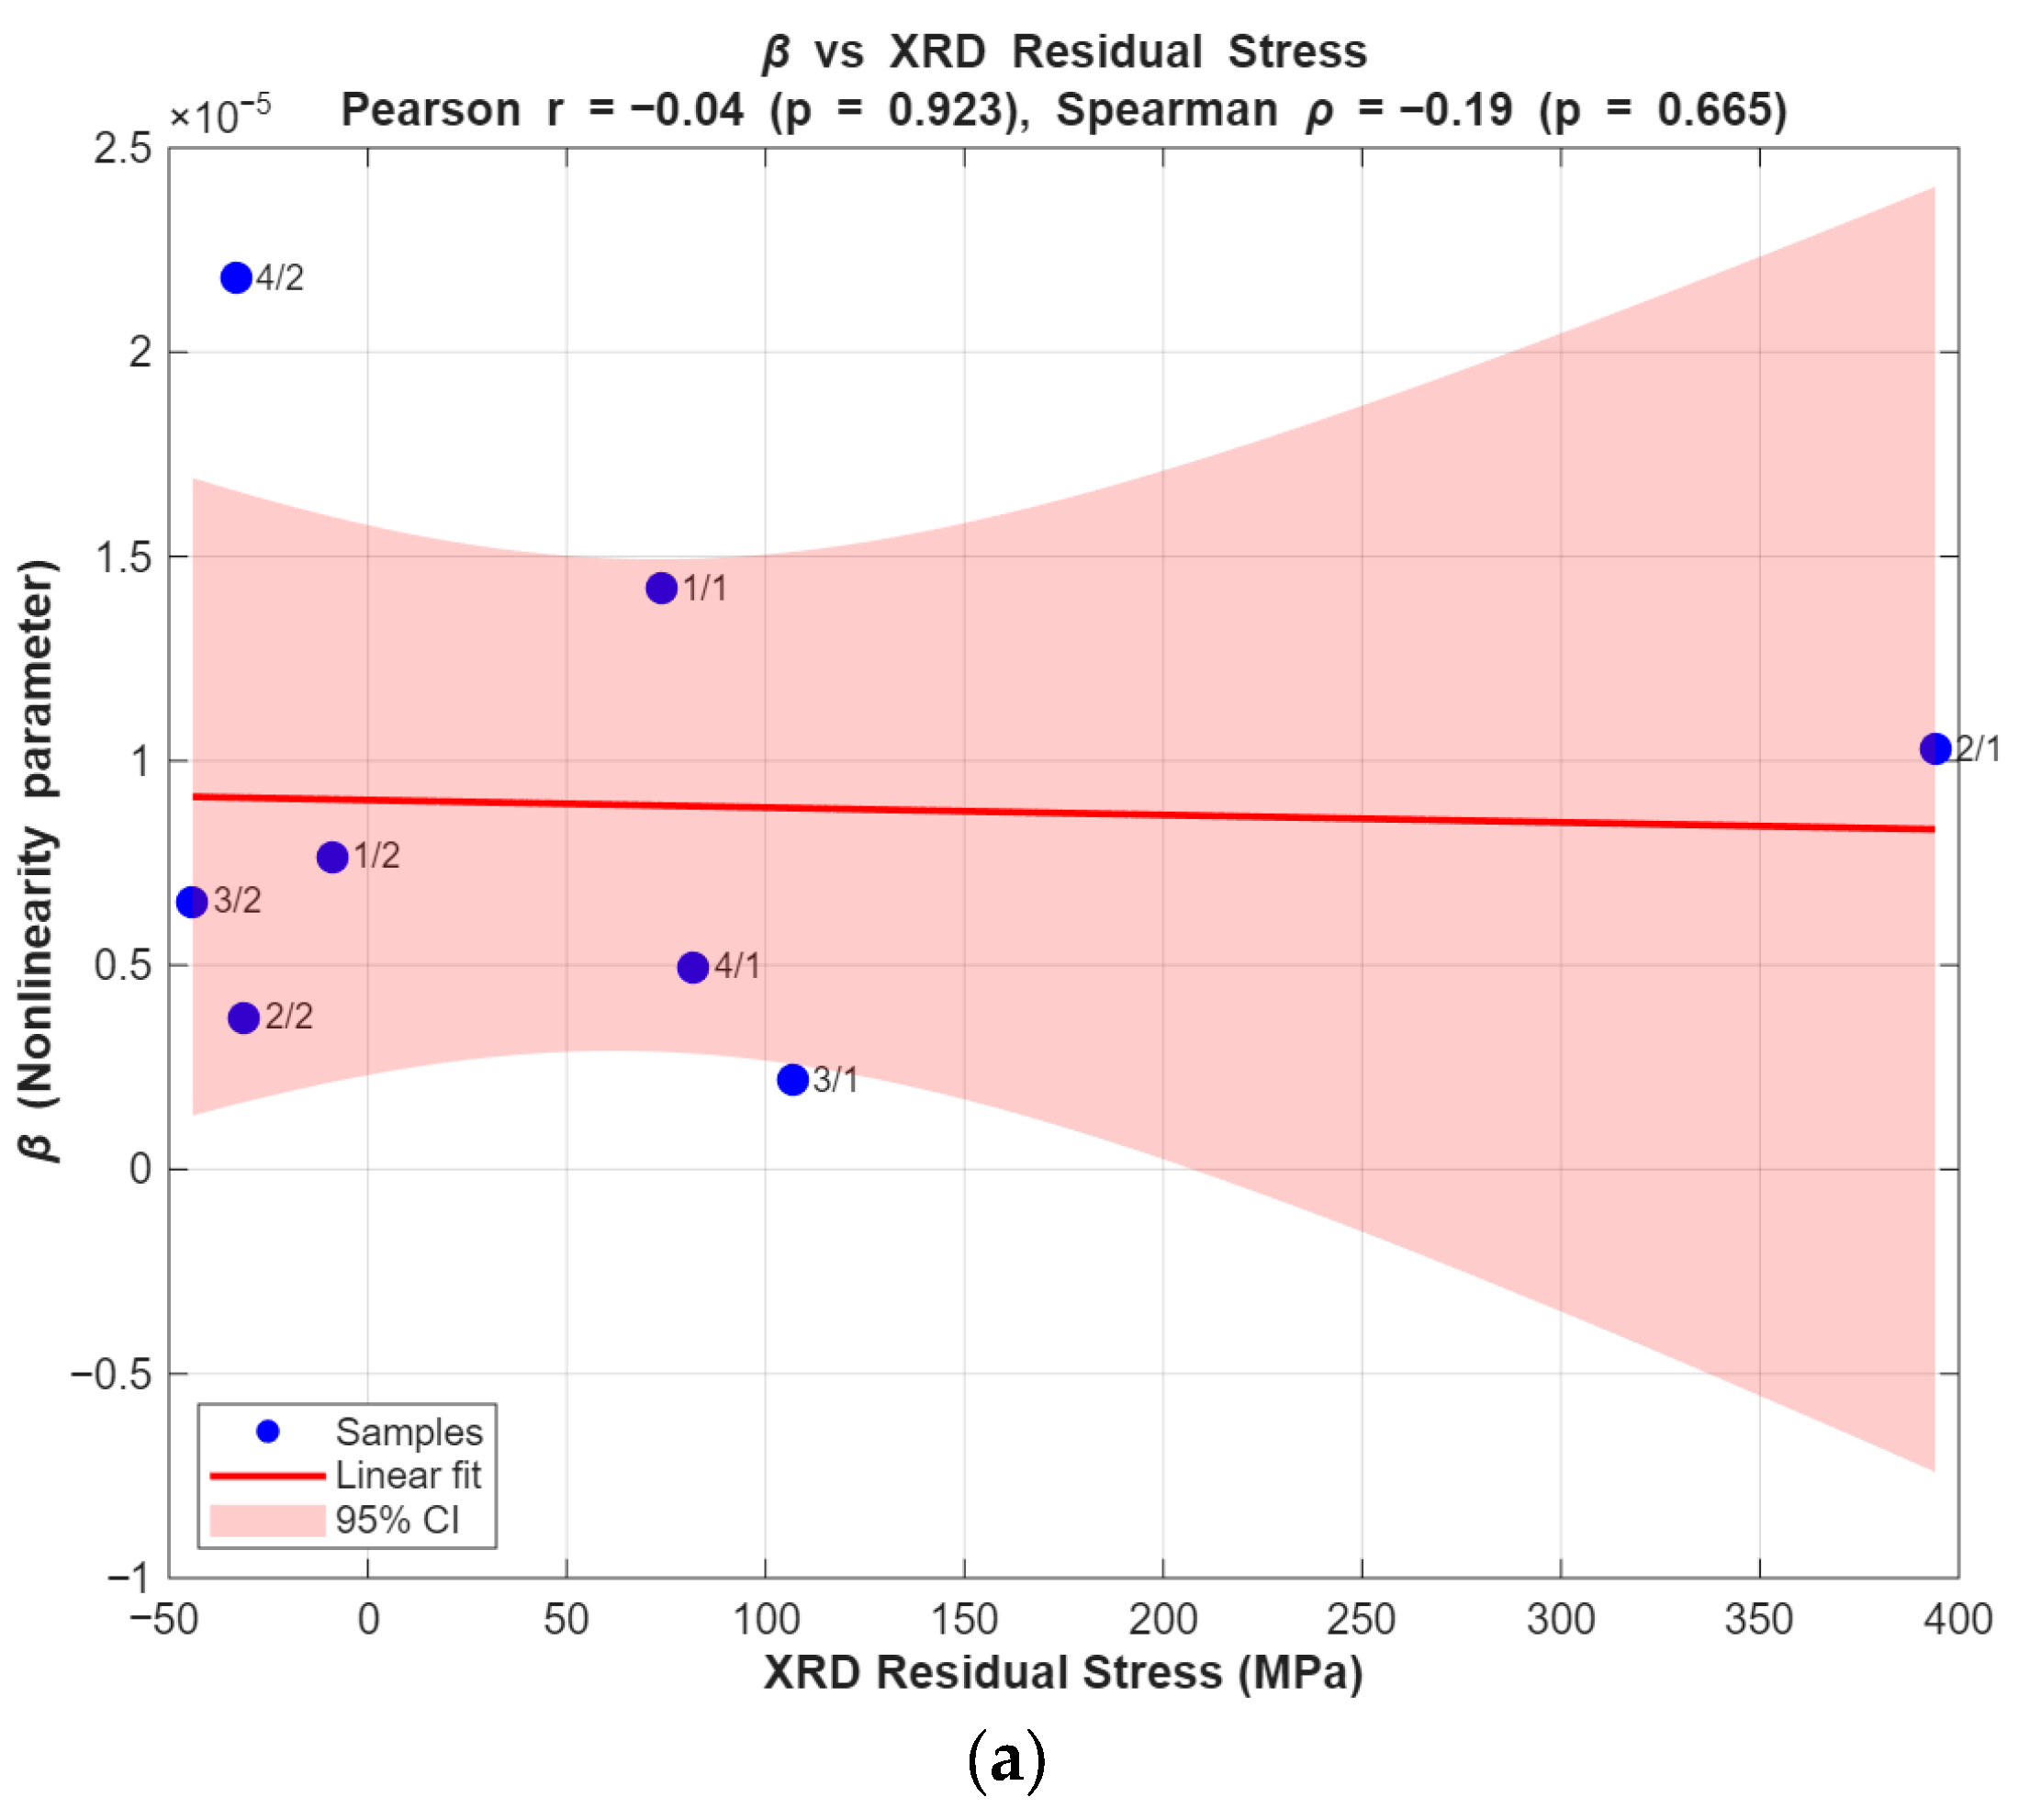
To evaluate the above relationship for the available steel bars, eight samples (n = 8) similar to the above-mentioned parameters were used. The correlation between β and XRD-measured residual stress was negligible, with Pearson r = −0.04 (
p = 0.923) and Spearman ρ = −0.19 (
p = 0.651), indicating no meaningful association. Similarly, the correlation between β and coercive force was weak, with Pearson r = 0.14 (
p = 0.74) and Spearman ρ = 0.08 (
p = 0.84). Linear regression plots with 95% confidence intervals are shown in
Figure 21.
These results indicate that the relationship between β and XRD is a trend rather than a robust statistically significant correlation with the current dataset. The lack of statistical significance at the 0.05 level is likely due to the small sample size (n = 8) and the presence of mixed tensile/compressive states in the dataset, which increases variance.
Important limitations that may explain deviations between methods are: (1) measurement depth mismatch EMAT Rayleigh-wave sensitivity extends to roughly 1.5 mm beneath the surface (meander coil used), whereas XRD probes only the near-surface (order of ~10 µm); (2) different physical contrast mechanisms β quantifies acoustic nonlinearity related to microstructural features and dislocations, XRD quantifies lattice strain, and coercivity depends on magnetic domain behavior and surface finish; (3) surface condition and roughness can affect coercivity and XRD more strongly than EMAT; (4) mixed tension/compression regions within a single sample can reduce linearity of correlation; and (5) limited sample size reduces statistical power.
5.6. Prototype Development
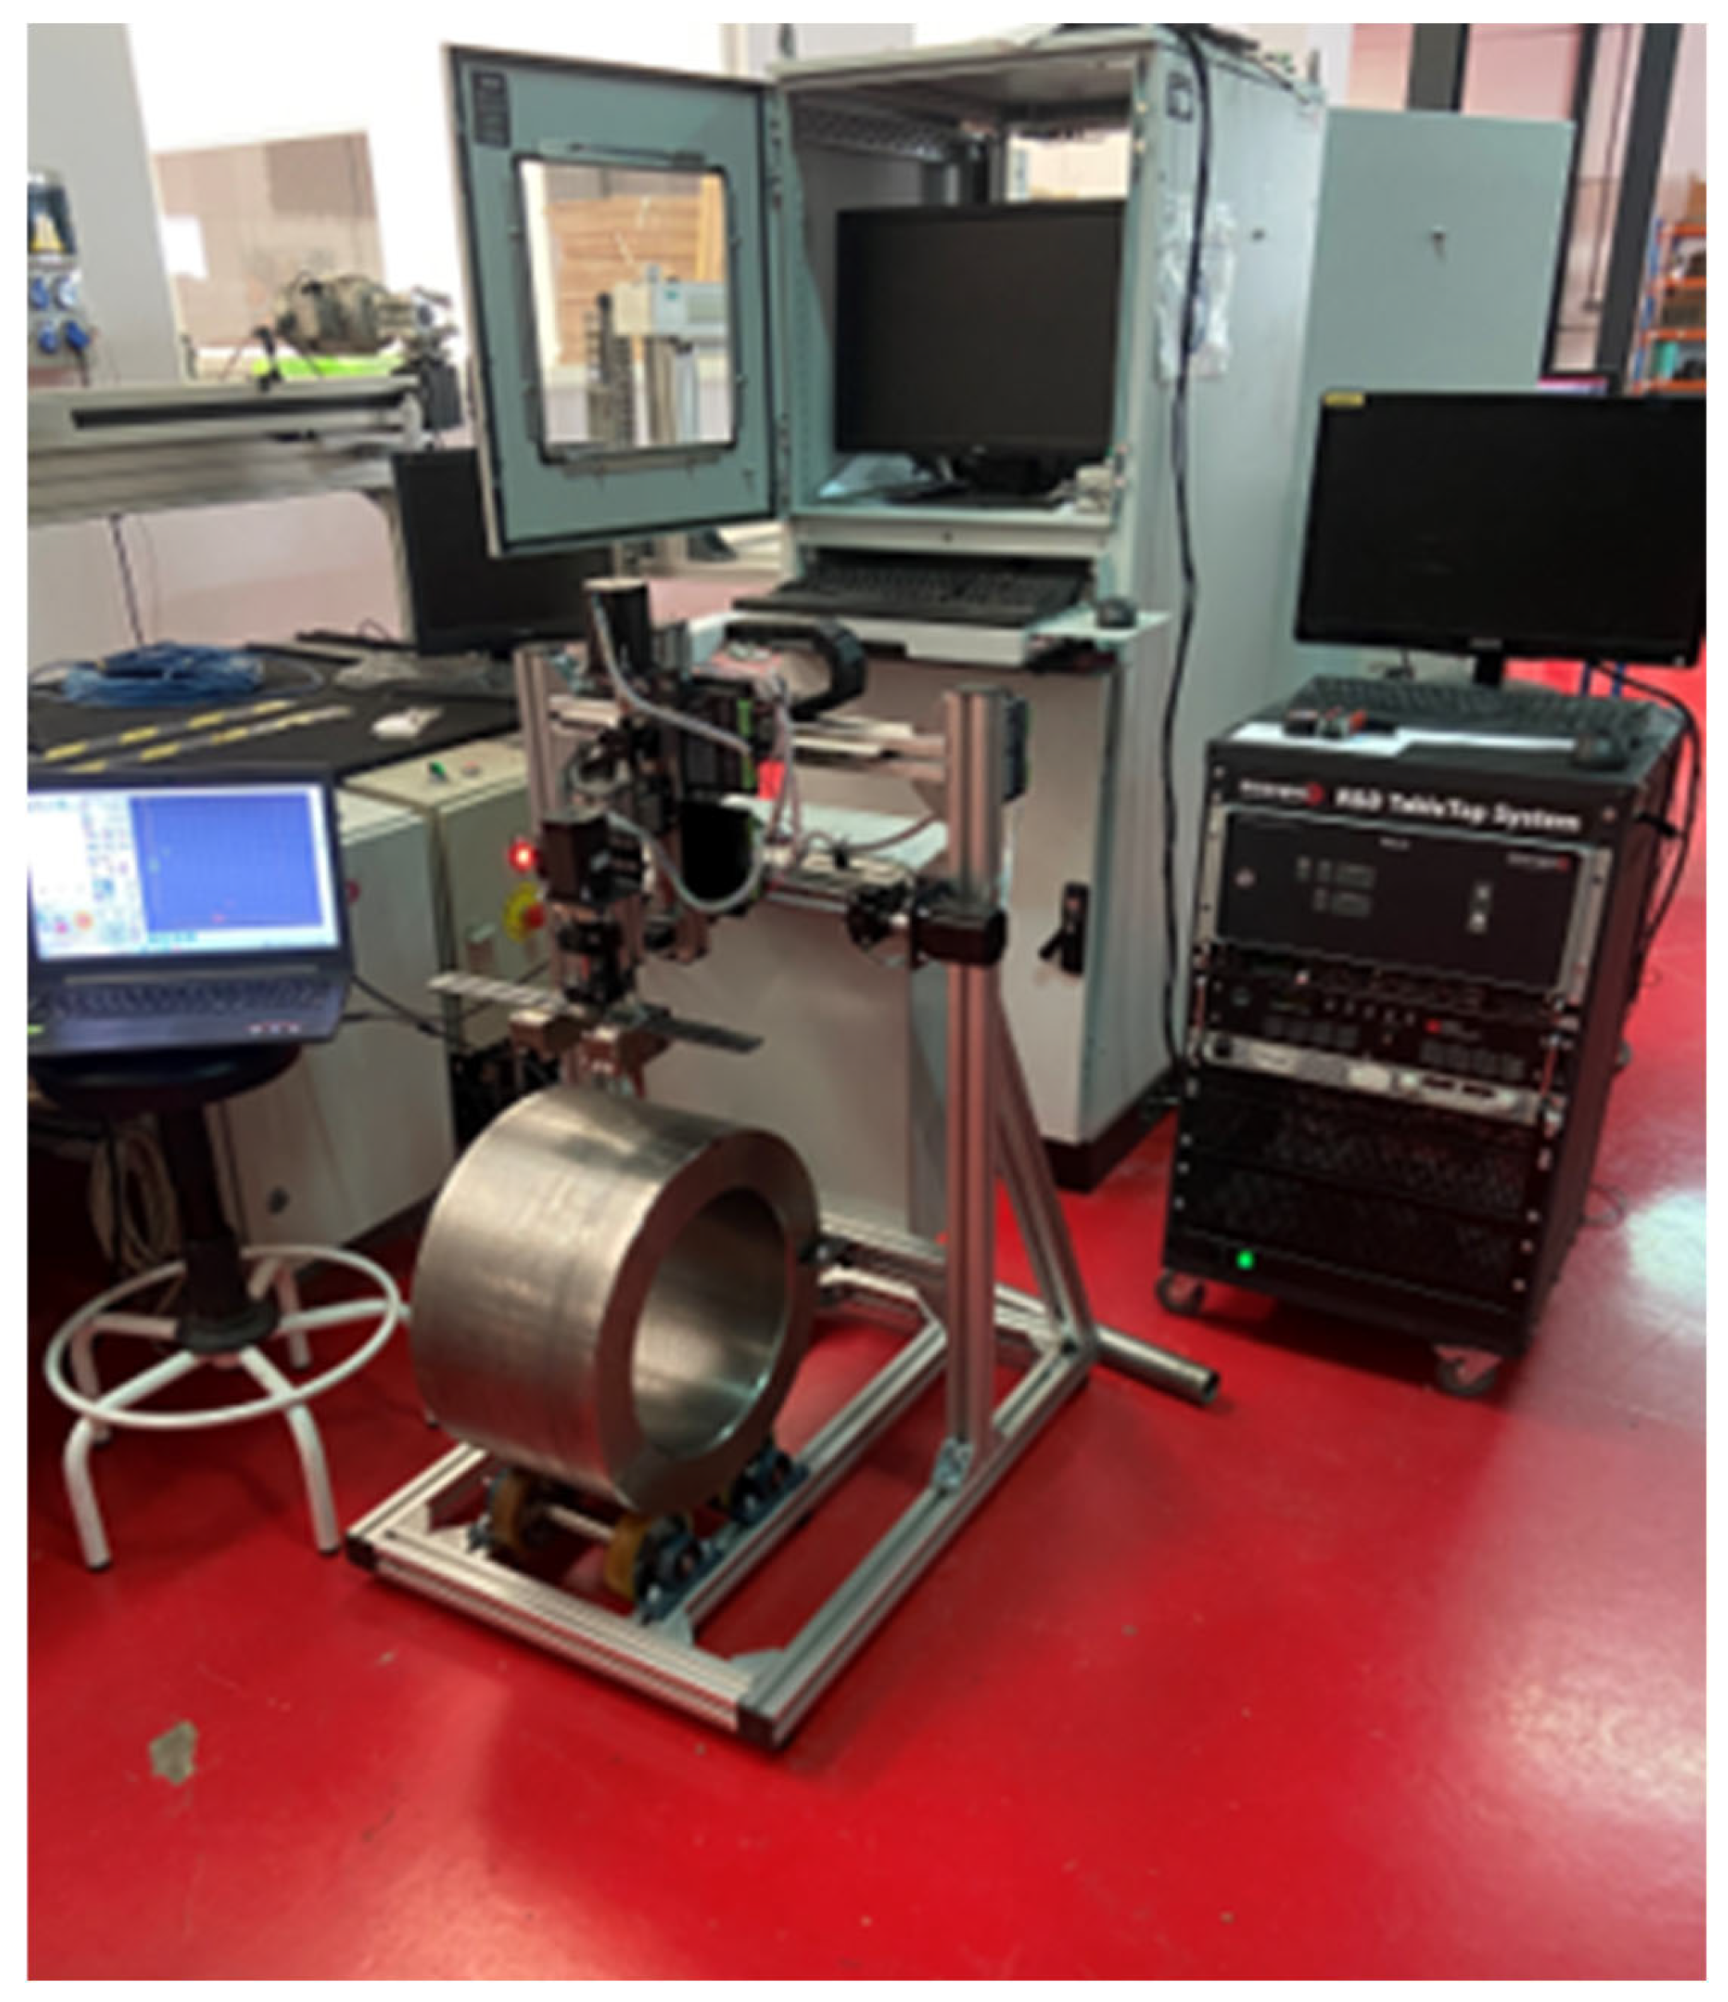
The research project led to the development of a specialized prototype system aimed at performing continuous nonlinear ultrasonic testing on roll samples, as illustrated in
Figure 22. The system consists of a mechanical setup that positions the roll sample for precise ultrasonic wave transmission, utilizing an EMAT to generate and receive Rayleigh waves. This continuous testing approach allows for real-time monitoring of residual stresses within the material, enabling immediate data collection and analysis. The prototype, which integrates various components such as a computer interface, data acquisition systems, and imaging equipment, provides instant results on the stress distribution across the roll.
This capability is particularly valuable for industrial applications, where quick assessments of structural integrity can lead to more informed decision-making and improved maintenance strategies for large steel structures. The continuous nature of the testing, coupled with immediate results, enhances the effectiveness of the method for long-term monitoring and offers a significant advantage over traditional techniques that may require longer processing times.
6. Conclusions
The study provides a comprehensive analysis of residual stress in steel rolls and bars, employing nonlinear ultrasonics as the primary investigative technique. This method was compared with traditional approaches such as XRD and coercivity measurements. The study meticulously details the methodology, including the preparation of steel samples, the specific heat treatments applied to induce varying levels of residual stress, and the subsequent analysis using different techniques. The research demonstrates that nonlinear ultrasonics, particularly when used in conjunction with Rayleigh waves and EMATs, offer significant advantages in terms of sensitivity and depth of analysis, especially for subsurface residual stresses that are often challenging to detect with conventional methods.
This research validates nonlinear ultrasonics, using EMAT, as an effective tool for monitoring stress distributions in steel components.
The technique’s capability to detect subsurface residual stress with a positive trend compared to XRD and coercivity measurements is particularly significant. This suggests that nonlinear ultrasonics can often serve as a good and rapid alternative for residual stress analysis in industrial steel components, rather than merely a complementary method.
Unlike traditional methods, which are slow and limited to pointwise measurements, EMAT-based nonlinear ultrasonics enables fast and continuous monitoring.
Through comprehensive comparison, the study shows that nonlinear ultrasonics not only detects stress variations with greater precision but also provides deeper insights into the material’s internal condition, which other methods may overlook.
In both steel roll and bar samples, EMAT effectively identified variations in residual stress caused by different heat treatments, demonstrating pattern recognition.
The continuous monitoring capability of EMAT technology makes it a highly valuable tool for real-time residual stress analysis in industrial environments, minimizing downtime and improving the structural integrity of essential steel components.
The continuous monitoring was performed at a 15 km/hr speed, which was crucial in rapid analysis.
Before grinding, the steel rolls exhibit fluctuating β values, indicating a mix of T and C across all sections, with an unbalanced stress profile. After grinding, the end sections show a more balanced stress state, but the top and mid-sections still have combined T and C, suggesting residual stress remains. Grinding improves stress distribution, particularly at the ends, but further treatment may be needed for uniformity.
By significantly enhancing the accuracy of residual stress measurements, nonlinear ultrasonics contributes to a deeper understanding of material behaviour, ultimately increasing the reliability and lifespan of steel components used in industrial settings.
The research also developed a prototype system for continuous nonlinear ultrasonic monitoring, enabling real-time, efficient analysis of residual stresses in industrial steel components. This prototype’s integration with EMAT technology ensures immediate results, enhancing decision-making and maintenance strategies for critical steel components.
In conclusion, this research study successfully positions nonlinear ultrasonics as a valuable and potentially superior tool for residual stress analysis in steel. The findings suggest that its broader adoption in industrial settings could lead to more effective monitoring and maintenance of steel components, ultimately leading to improved safety and performance in critical applications.
Further work involves expanding the application of this technology to other materials and more complex structural geometries, refining the prototype system for even greater accuracy and usability in industrial environments. Additionally, long-term studies on the effectiveness of continuous monitoring in real-world conditions will be crucial for validating its potential for widespread use in various sectors.
