5.1. Environment Setting
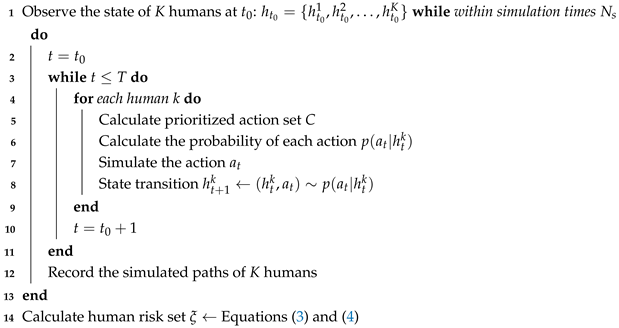
To evaluate the effectiveness of the proposed methods, we conducted a series of scenario simulations and systematically compared the results with established algorithms such as A*, RRT and RL methods (MDP (Markov Decision Process), DQN (Deep Q-network), DDQN (Double Deep Q-network)). Note that we only perform simulations at the current stage and the experiments in real-world has not been performed. The simulations were performed on a high-performance computing system equipped with an Intel Core i9-10900 CPU running at 2.80 GHz and 32 GB of memory, ensuring sufficient computational resources for reliable assessment.
For all methods under evaluation, we adopted a consistent reward structure to maintain comparability for path quality evaluation. Specifically, the reward parameters were set as follows:
goal achievement reward ,
step penalty , which incentivizes shorter paths,
conflict penalty , imposed when the agent encounters a collision with a human.
The robot receives a reward for the achievement of the goal within the given time step budget T. Throughout the navigation process, each step incurs a penalty of , discouraging unnecessary movements and promoting efficiency. Additionally, to simulate the shared environment with humans, any collision with a human results in a penalty of .
Parameters of multi-policy
are unknown.
Table 1 presents the investigation results for several combinations of the parameters
,
, and
. We find that the performance differences among these combinations are minor and it is difficult to determine the best parameter set. Therefore, a random number generator (RNG) is adopted to randomly assign the values of
,
, and
under the following constraints:
, and
.
Table 1.
Performances of different parameter values .
Table 1.
Performances of different parameter values .
| Parameters | Average Conflict Number | Task Success Rate |
|---|
| , , | 0.04 ± 0.20 | 0.96 ± 0.20 |
| , , | 0.05 ± 0.26 | 0.96 ± 0.20 |
| , , | 0.04 ± 0.20 | 0.96 ± 0.20 |
| , , | 0.05 ± 0.22 | 0.95 ± 0.22 |
| , , | 0.04 ± 0.20 | 0.96 ± 0.20 |
| , , | 0.06 ± 0.24 | 0.94 ± 0.24 |
| , , | 0.04 ± 0.20 | 0.96 ± 0.20 |
| , , | 0.06 ± 0.24 | 0.94 ± 0.24 |
| : randomly generated | 0.04 ± 0.20 | 0.96 ± 0.20 |
We verify the proposed methods in three scenarios:
Scenario 1: verification on a small size map;
Scenario 2: verification with different size maps;
Scenario 3: verification on increasing human numbers.
Figure 5 shows the configuration of three different maps:
,
, and
, which are warehouse grid environment. We run
times simulations to calculate human risks
. The diversity threshold
is set as 0.25.
The evaluation metrics of different algorithms vary depending on the specific problem and scenario being addressed. For the shortest path planning problem [
24,
25], the primary metric is typically the path length. In the case of multi-agent path planning [
54,
55], commonly used metrics include the makespan or the sum of costs of all paths. Moreover, the task success rate and path reward are two widely adopted metrics in the literature for assessing overall performance and path quality.
In this paper, we focus more on the safety of the path. Therefore, the performance of the proposed method is evaluated using the following metrics: the average conflict number, conflict distribution, task success rate, and path reward. To ensure statistical reliability, each scenario was simulated 100 times, and the mean values of these metrics were calculated. A random seed set is applied for 100 simulations, .
5.2. Verification on Scenario 1: Human Number K = 1 and Small Size Map
This experiment was conducted in a
grid world (
Figure 5a) environment to evaluate the performance of the proposed method against three baseline methods: A*, MDP, RRT, DQN, and DDQN. The agent starts from
= (0, 0), and
= (9, 9) is its goal position. A human moves stochastically from position
= (9, 0) to his/her goal position
= (0, 9). The time budget
. The results, summarized in
Figure 6 and
Table 2.
(1) Average conflict number.
Figure 6a shows the results for the average number of conflicts. With an average of only 0.04 ± 0.20 conflicts, our proposed method significantly outperforms all baselines: A* (0.22 ± 0.67), MDP (0.16 ± 0.48), RRT (0.25 ± 0.59), DQN (0.07 ± 0.26), and DDQN (0.05 ± 0.22). The low standard deviation further indicates that this performance is consistent and reliable. It shows that our method is much better than A*, MDP and RRT methods; slightly better than DQN and DDQN methods with the small size map.
(2) Conflict distribution.
Figure 6b illustrates the time step distribution of conflicts that occurred during the simulations. Our proposed method MP-RRT demonstrates a significantly superior performance, with the first conflict occurring at
far behind other methods. Its distribution is nearly towards zero conflicts. In contrast, the baseline methods (A*, MDP, RRT, DQN, and DDQN) show a much wider spread and a higher frequency of conflicts, which indicate that their strategies are less effective at predicting and avoiding the stochastically moving human. This shows a great advantage of the proposed method in proactively resolving future conflicts. As the time step increases, conflict resolution becomes more challenging due to the inherent uncertainty and dynamic nature of future.
(3) Average task success rate.
Figure 6c presents the average task success rate, which measures the agent’s ability to reach its goal within the allotted time budget (
). The proposed method achieves the highest success rate of 96% (standard deviation ± 0.20), surpassing the performance of A* (87%), MDP (88%), RRT (80%), DQN (93%), and DDQN (94%). This indicates that our method’s strategy for avoiding conflicts does not come at the cost of failing its primary objective; instead, it more effectively navigates the dynamic environment to reach the goal reliably.
(4) Average reward.
Figure 6d depicts the average path reward. Our method achieves the highest average reward of −1.98 ± 0.39, which is notably better than the rewards of A* (−2.34 ± 1.34), MDP (−2.23 ± 0.97), RRT (−2.40 ± 1.18), DQN (−2.04 ± 0.51), and DDQN (−2.00 ± 0.44). The average path reward shows that the path quality of our method is better than the other methods.
The combination of the highest success rate, lowest conflict number, and highest reward confirms that the proposed method offers a more robust and optimal solution for safe path planning in a human-shared space.
5.3. Verification on Scenario 2: Different Size Maps
In Scenario 2, we evaluate the performance of the proposed algorithm on larger grid maps of sizes
and
, as illustrated in
Figure 5b,c. This scenario considers only one human in this scenario. The time budgets allocated for the agent are set to
and
for the
and
maps, respectively. The simulation results are summarized in
Table 2.
(1) Results of
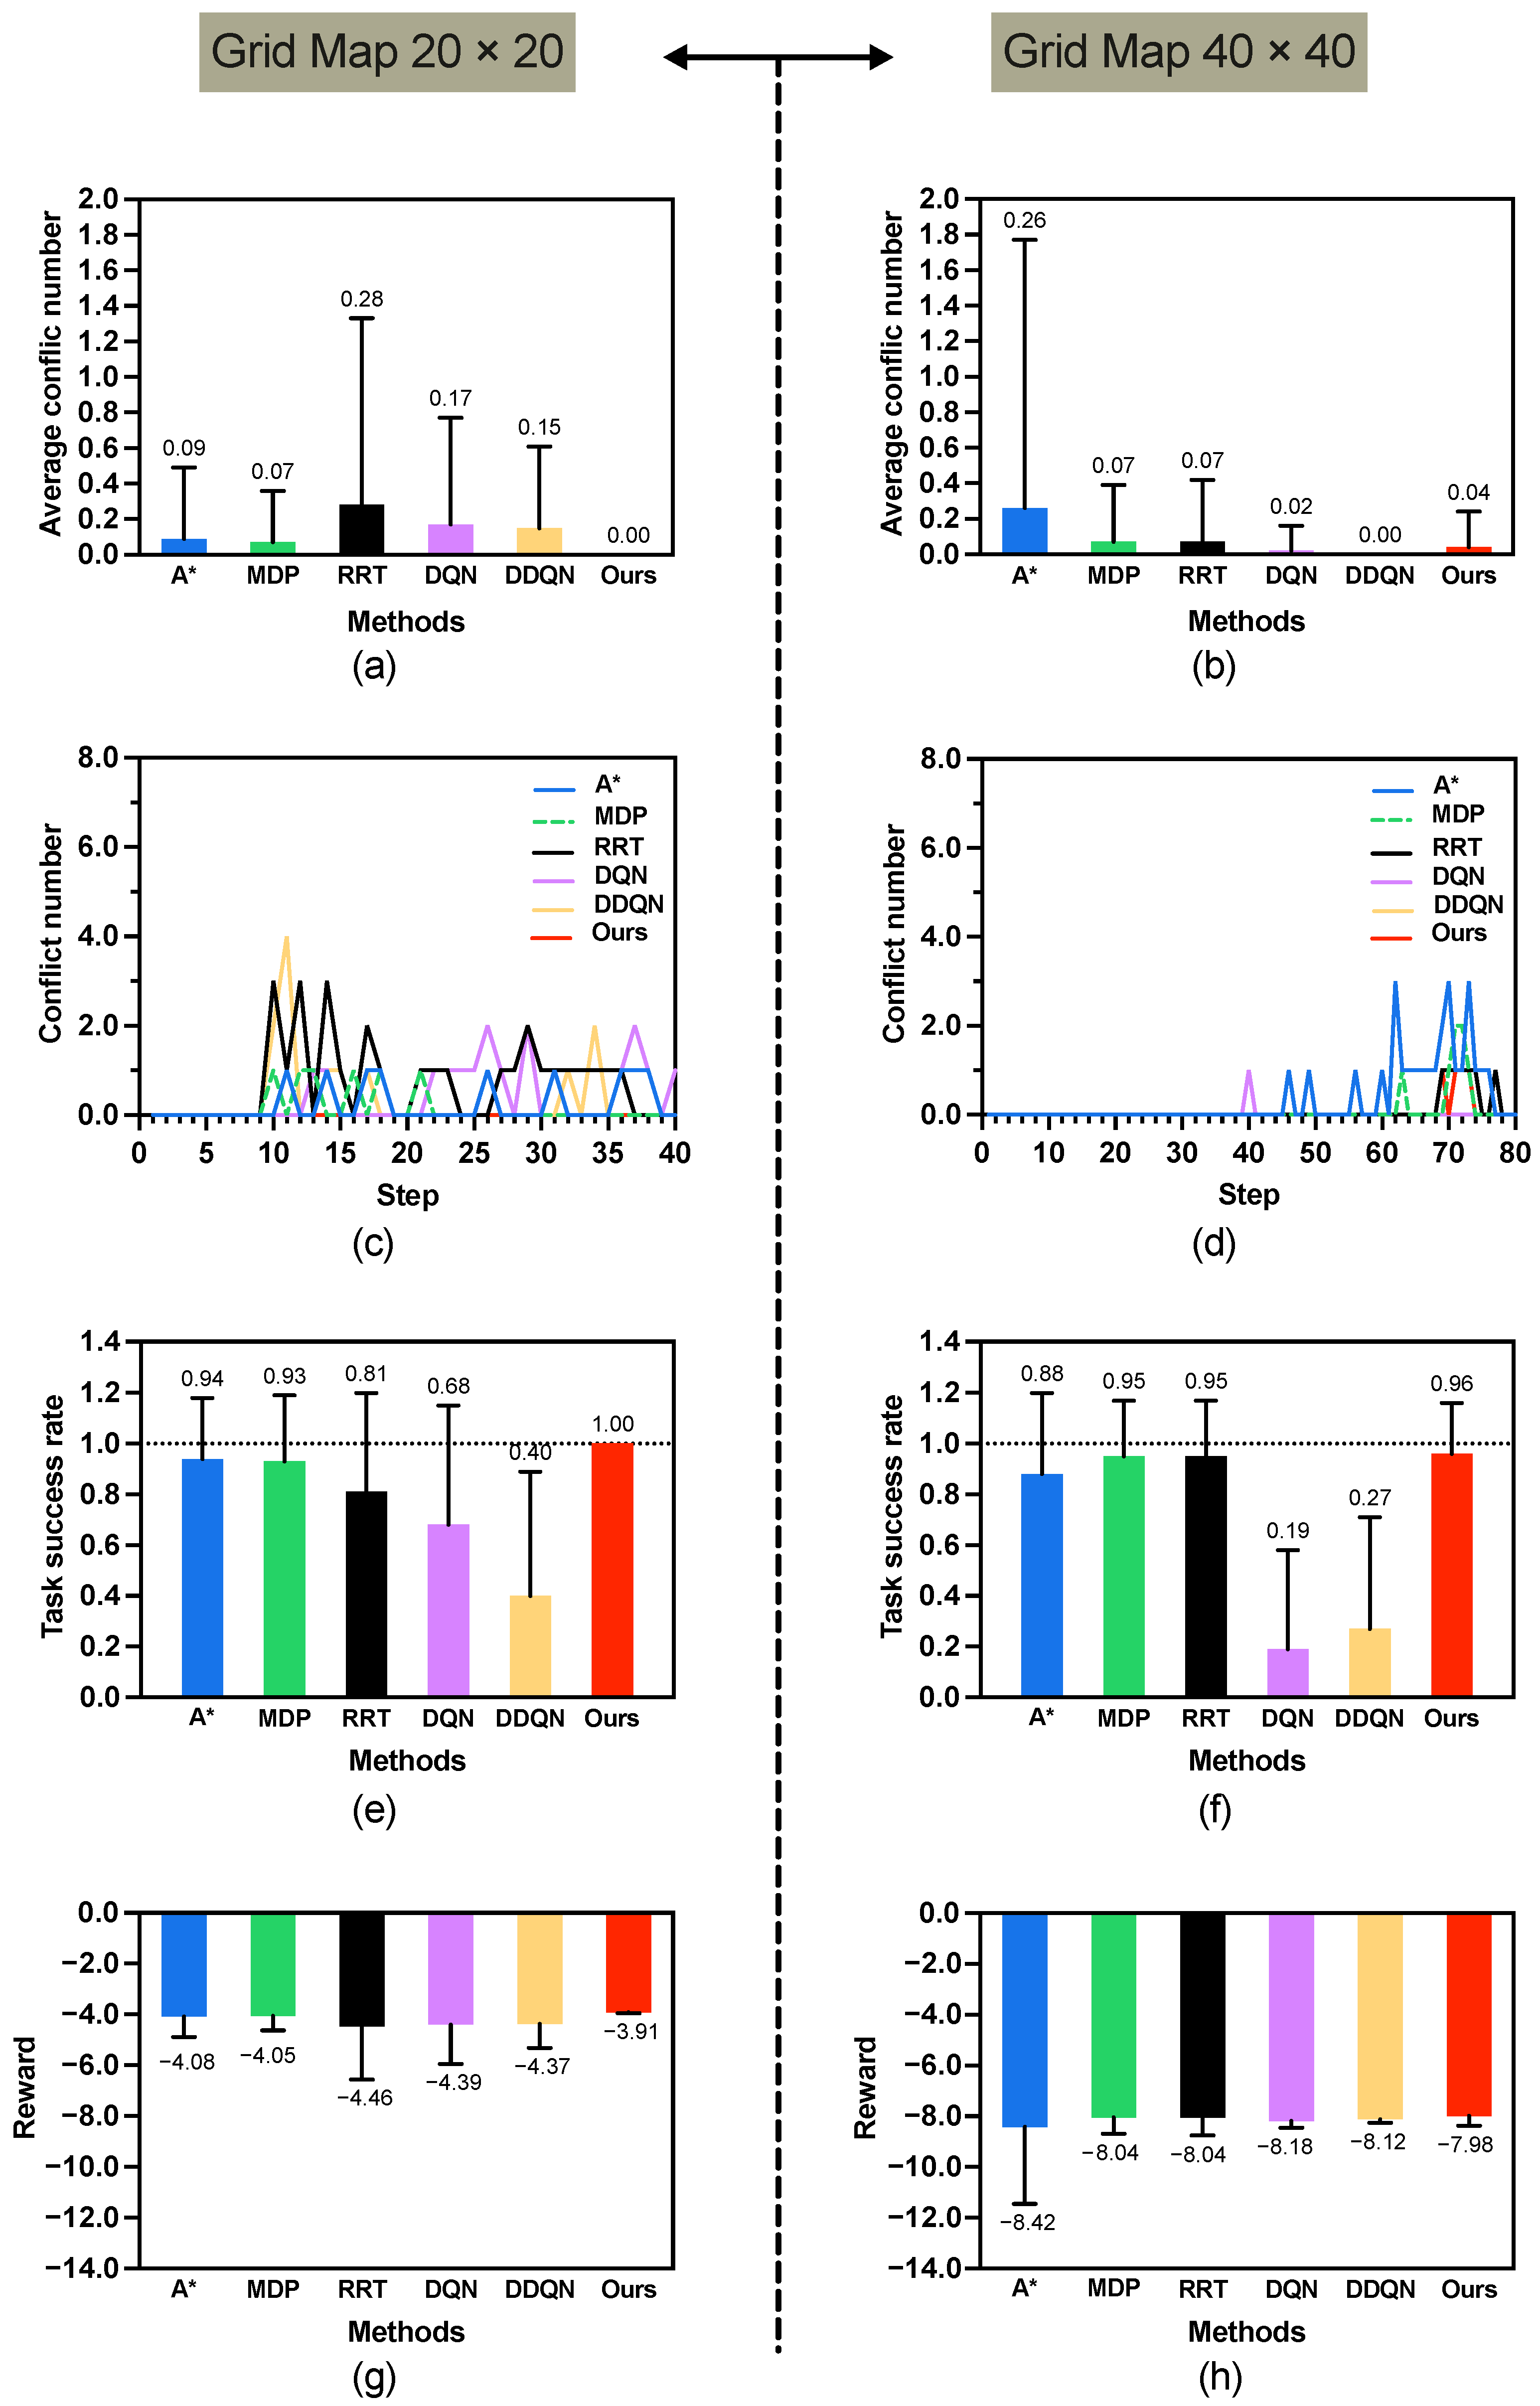
map. As shown in
Figure 7 left and
Table 2, the proposed method achieves perfect performance in both task success rate (1.00 ± 0.00) and conflict avoidance (0.00 ± 0.00), significantly outperforming all baseline methods across all three metrics. The obtained reward of −3.91 ± 0.04 is also the highest among all approaches, with statistically significant differences observed in every comparative case. This indicates that the method is highly effective in medium-scale environments.
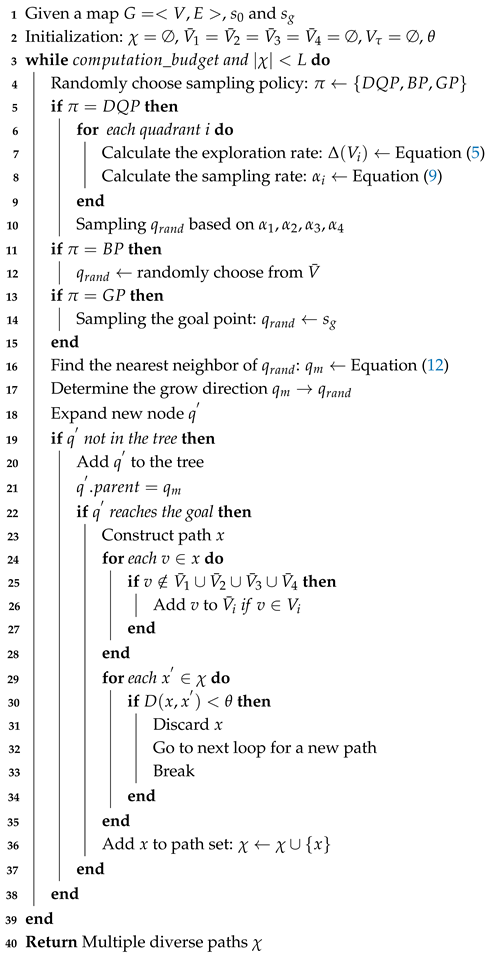
Figure 8 illustrates a set of diverse paths generated by our MP-RRT algorithm. As can be seen from the figure, every location on the map has been explored.
(2) Results of
map. In contrast, on the larger map (
Figure 7 right and
Table 2), while the proposed method still attains the highest overall reward (−7.98 ± 0.39) and a strong task success rate (0.96 ± 0.20). In terms of conflict number, although the proposed method (0.04 ± 0.20) is slightly higher than DDQN (0.00 ± 0.00), the task success rate of DDQN reduces to a low-level of (0.27 ± 0.44). Similarly, in task success rate, it performs comparably to MDP and RRT, with no significant differences detected. These results suggest that as environmental complexity increases, although the conflict number of our method is not the minimal, the results demonstrate that it achieves the highest task success rate.
Table 2 indicates that our method achieves superior performance on the
map compared to the
map. To verify this observation, we changed the human’s start and goal positions and conducted a new simulation,
,
. The results are as follows: average task success rate
, average conflict number
, and average reward
. Compared with the results in
Table 2, it is difficult to conclude that our algorithm performs better in the
map. Nevertheless, it can be confirmed that the proposed method performs consistently well in both
and
map environments.
Table 2 also shows that DQN and DDQN do not have good performances when map size increases to
and
. As the grid map size increases, the performance of DQN and DDQN degrades due to the enlarged state space, sparse reward signals, and insufficient exploration, which hinder the convergence of value estimation. In contrast, model-based approaches such as MDP maintain stable performance owing to their explicit transition modeling and global optimization nature.
From
Figure 6 and
Figure 7, it can be observed that increasing the map size has little impact on our method, which consistently maintains a low number of conflicts and a high task success rate. This robustness arises from the use of the MP-RRT diverse path generator, which computes multiple diverse paths across the entire environment. As a result, our method is able to identify safe paths by considering the global environment rather than being restricted to local regions.
5.4. Verification on Scenario 3: Increasing Human Number K
In this setting, we evaluate the proposed method in a more challenging environment by increasing the number of humans to
. The simulation is a 40 × 40 grid world (
Figure 5c), where the agent starts at
and aims to reach
within a time budget of
steps. Human start and goal locations are randomly initialized; a representative instance uses
= (30, 39),
= (39, 0),
= (4, 2),
= (1, 37),
= (29, 31),
= (2, 33),
= (14, 4),
= (21, 8),
= (30, 10),
= (33, 12); with corresponding goals
= (15, 2),
= (0, 39),
= (35, 35),
= (32, 6),
= (6, 12),
= (30, 2),
= (38, 29),
= (5, 27),
= (6, 25), and
= (17, 35). The time budget is configured as
.
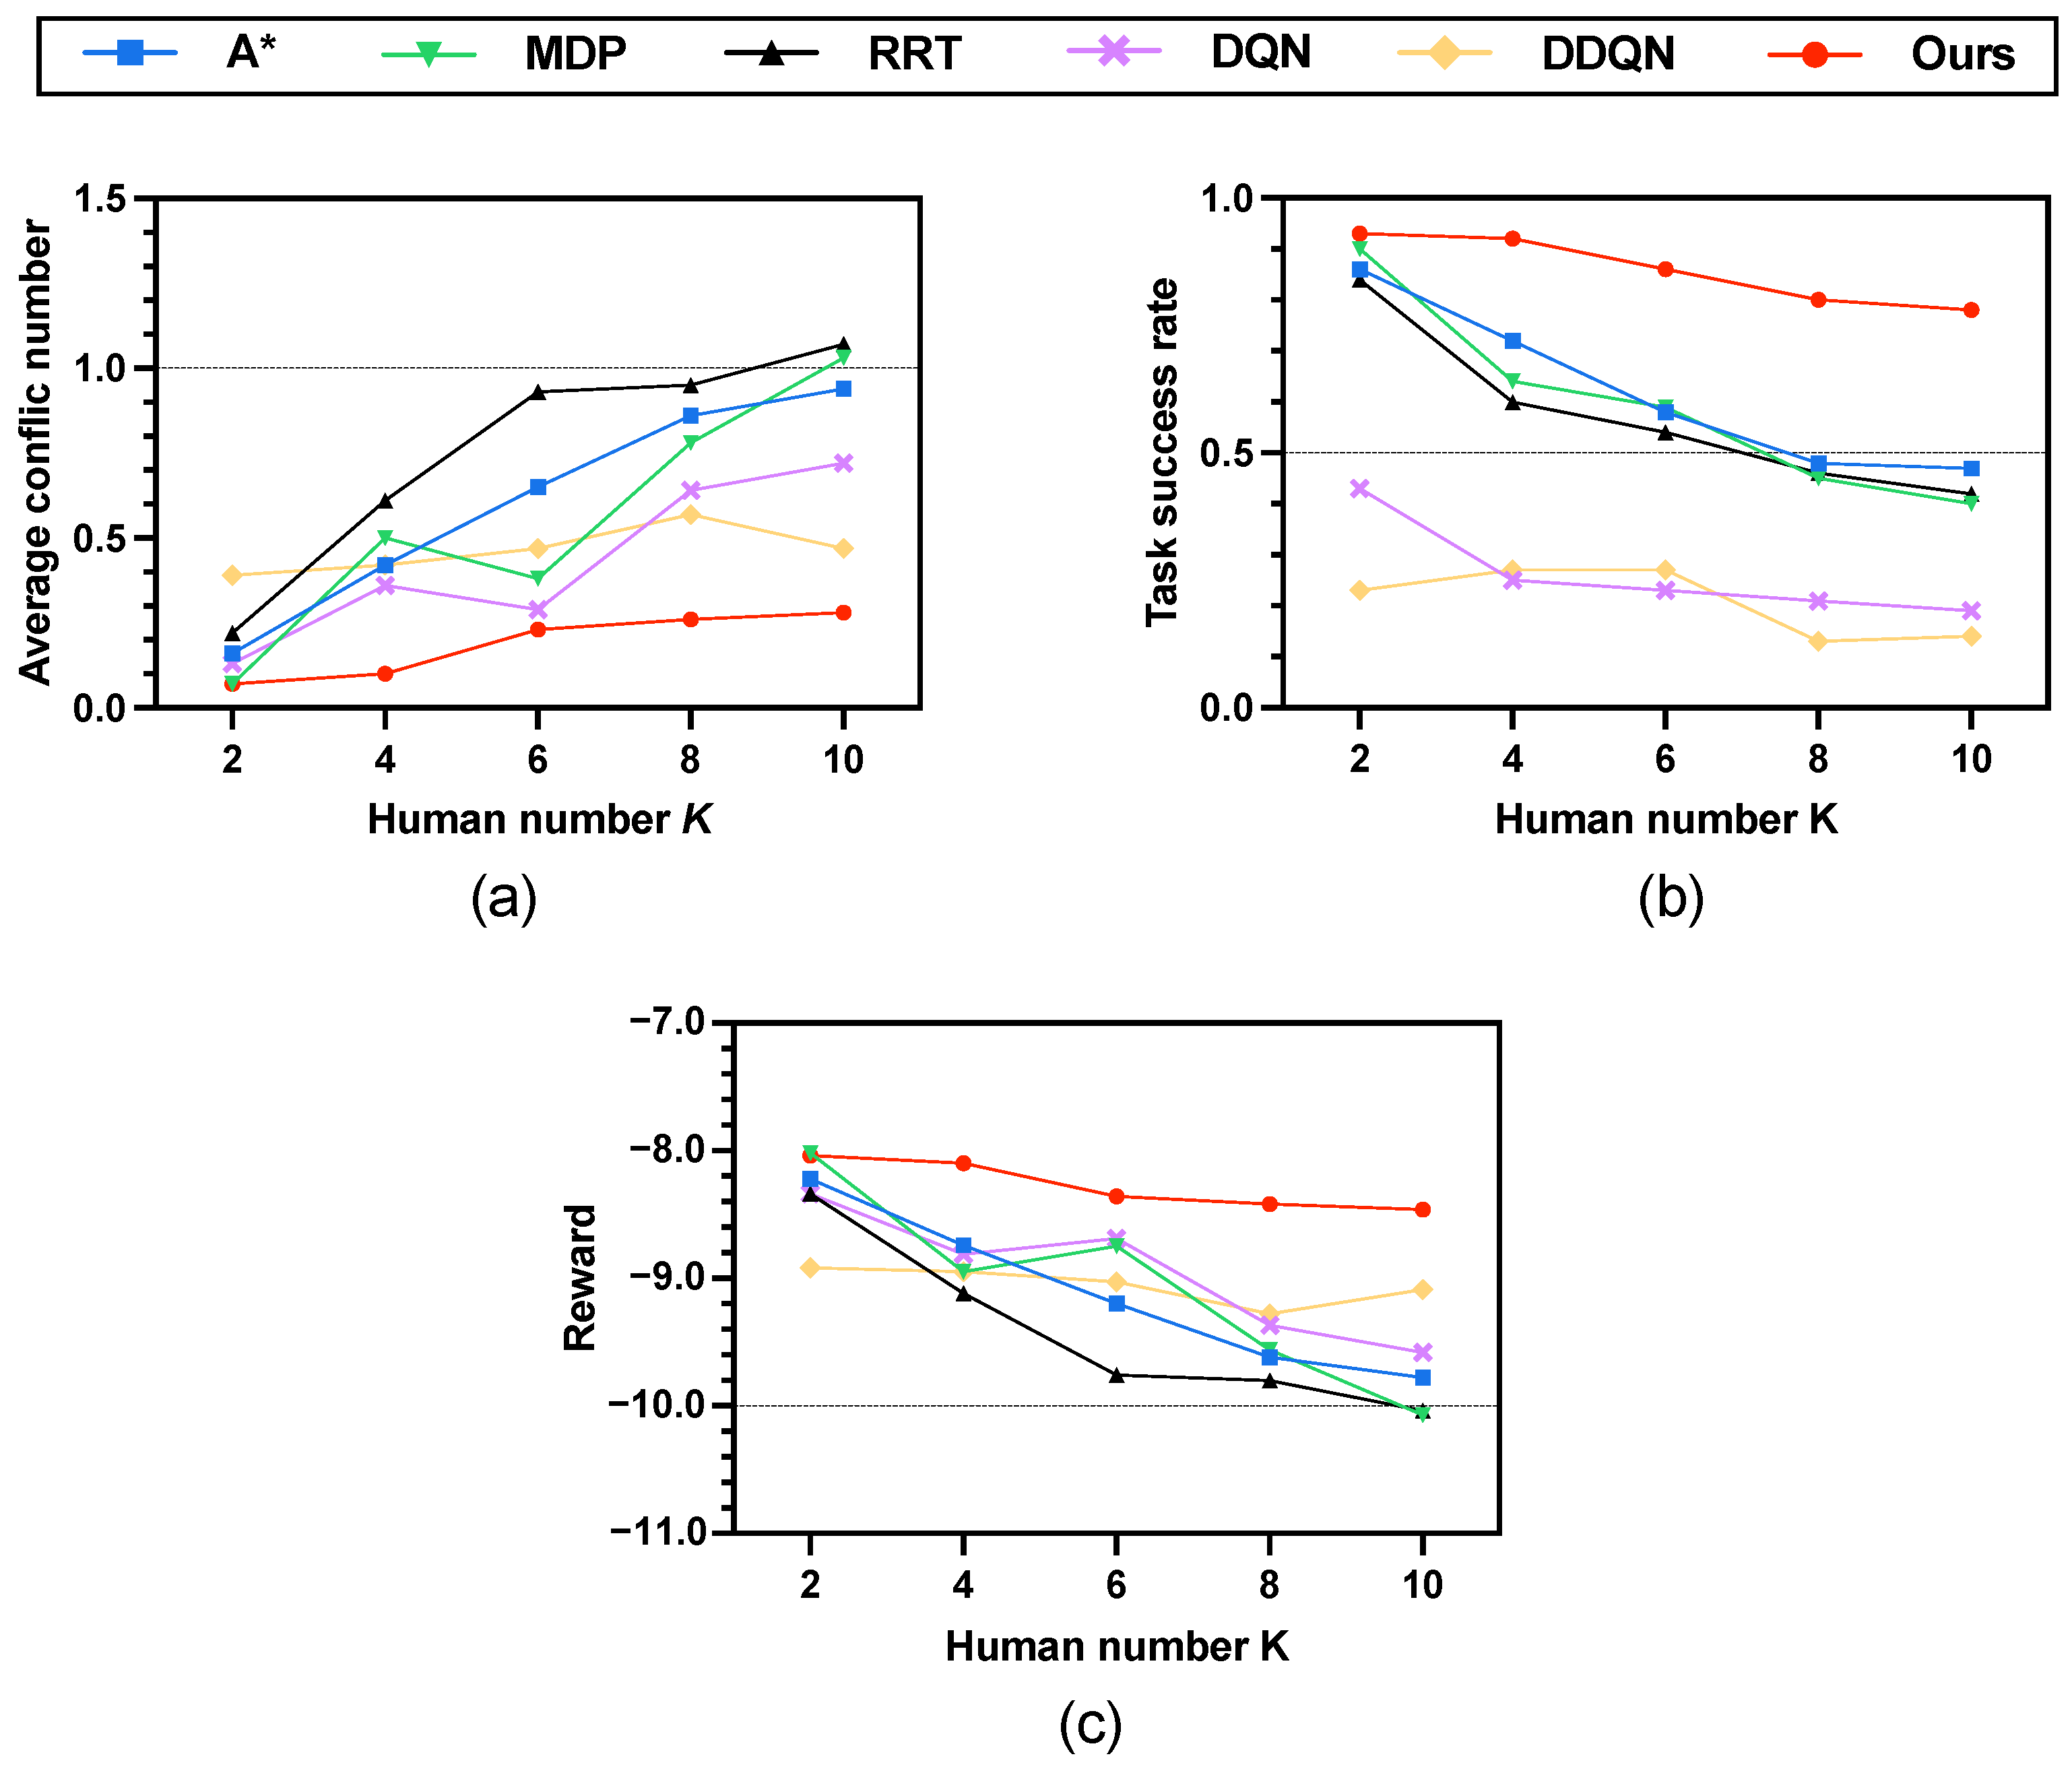
Figure 9 illustrates the simulation results across three key metrics, while
Table 3 provides a detailed summary.
(1) Average conflict number. As shown in the
Figure 9a, all baseline methods exhibit a steady increase in collisions as the human number grows, with RRT suffering the most. In contrast, our method maintains consistently low conflict numbers across all scenarios.
(2) Average task success rate. For the task success rate (
Figure 9b, the baselines experience a sharp decline as the environment becomes more crowded. Success rates of A*, MDP, and RRT all drop below 0.5 when
. By comparison, the proposed method sustains a high success rate above 0.8 even in the most challenging case with 10 humans.
(3) Average reward.
Figure 9c shows the results of average reward. Our method consistently outperforms the baselines. Although rewards decrease slightly with larger
K, the reduction is marginal compared with the steep declines observed for A*, MDP, and RRT. This indicates that our approach not only achieves higher success rates but also balances efficiency and safety better than the alternatives.
In
Table 3, when the number of humans is
, both the MDP method and the proposed method achieve the same average conflict number (
). This mainly results from two factors: (1) the
map is relatively sparse with only two humans, and (2) both methods adopt similar conflict resolution mechanisms based on soft constraints. The RL method learns an optimal path by penalizing conflicts in the reward function, while our method optimizes the risk level of each path candidate using Equation (
14) under simulated risk constraints. With such sparse human distribution and similar mechanisms, both methods yield comparable results. As
K increases and human-induced risks become stronger, their performance differences become more distinct. As shown in
Table 3, the performances of DQN and DDQN remain poor for the same reason as discussed previously, which is consistent with the results in
Table 2.
Figure 10 illustrates the conflict distribution across varying human numbers
K ranging from 2 to 10 in a
grid map. The proposed method consistently demonstrates robust performance as
K increases, maintaining a notably low conflict frequency across all scenarios. For smaller human numbers (e.g.,
and
), conflicts are exceptionally rare with the majority of trials resulting in zero conflicts. With
K increasing to 6 and 8, there is a marginal increase in the occurrence of conflicts. That said, the distribution still exhibits a strong skew toward lower counts—an observation that underscores the effectiveness of conflict avoidance, even as environmental complexity intensifies. Even at
, where the environment is most crowded and dynamic, the proposed method reduces conflicts by 70.2%, 72.8%, and 73.8% compared with A*, MDP, and RRT, respectively
. Furthermore, it achieves a significant improvement in the average task success rate, outperforming A* by 66.0%, MDP by 95.0%, and RRT by 85.7%
. This contrast underscores the superiority of the proposed approach in handling scalability and uncertainty in multi-human environments. The results confirm that our proposed method effectively balances path efficiency and safety.
In highly dynamic environments, such as those scenarios involving stochastically moving humans, depth-first search (DFS) methods struggle to handle the pathfinding problem efficiently. In contrast, a key advantage of our approach is the use of a breadth-first search (BFS) scheme to generate multiple diverse path candidates. The proposed multi-policy sampling strategy ensures that these candidates are distributed across the entire map where classic RRT, A*, and RL methods cannot. Thereby, it enhances the ability to cope with dynamic changes. Thus, the algorithm is more robust to the dynamic environment. The safety of the generated path is ensured from the human risks with stochastic evaluation module. Such that we can classify the dangerous areas and find an optimal path. Note that there may be no safe path exists as the humans can move anywhere. In such a case our algorithm return a path with lowest risk . That is why a conflict still occurs in the results.
It should be noted that, for safety considerations of both the robot and humans, we conducted only simulation experiments for method validation at the current stage, and the proposed approach has not yet been tested in real-world environments. The simulation results demonstrate the efficiency of our algorithm in resolving conflicts at the planning level. However, it still cannot guarantees no conflict occur with planning only one time. The conflict distribution reveals an interesting observation: in our algorithm, conflicts, when they occur, tend to arise much later compared with traditional approaches. In this paper, our algorithm cannot provide a safety guarantee for the entire path theoretically. We only use soft-constraints and calculate the risk level of each path candidates. An optimal path is obtained by minimizing the risk level with Equation (
14). However, it still cannot provide the safety guarantee. It is difficult to guarantee 100% safety for the entire path. To improve our algorithm, we will take hard-constraints to provide a safety guarantee in future. Another solution is to divide the path planning problem into several time-horizon sub-problems to ensure the safety for each time-horizon which is much easier. Dividing the path planning problem into several time-horizon sub-problems may be a compromise approach to balance the safety and efficiency.
A limitation of this work is that the computational cost has not been taken into consideration. At the current stage, our primary focus is on ensuring path safety. Once safety can be reliably guaranteed, our next objective will be to accelerate the search process and reduce computational cost. Therefore, in this stage of our research, ensuring the safety of the generated path in human-shared environments is our foremost priority, while computational efficiency will be addressed in our future work.


