Abstract
The article addresses the challenges of beam position tracking in Free-Space Optical Communication (FSOC) systems. A review of available photodetector technologies is presented, highlighting their operating principles and applications in optical links. The analysis indicates that most current monitoring devices function with the visible and near- or short-infrared ranges. However, due to the propagation characteristics of radiation in terrestrial environments, the mid-wave infrared (MWIR) region offers particularly promising opportunities. To the end, the work introduces a novel detector module based on an MWIR quadrant detector capable of simultaneously performing two essential tasks: monitoring beam position and receiving transmitted data. Such an integrated approach has the potential to significantly simplify the design of mobile FSOC systems, especially those requiring accurate transceivers’ tracking. The concept was validated through laboratory experiments on an MWIR link model, where both the signal bandwidth and position transfer function of the quadrant detector were examined.
1. Introduction
The dynamic development of optoelectronics has enabled the development of sophisticated free-space optical communications (FSOC). FSOC is a line-of-sight technology that transmits information through the atmosphere using modulated optical signals. Modern commercially available systems can achieve data rates ranging from 100 Mbps to 2.5 Gbps, while experimental demonstrations employing wavelength multiplexing (WDM) have reached a bandwidth of up to 1.2 Tbps [1].
The FSOC systems offer numerous advantages, including high data rates, immunity to electromagnetic interference, unlicensed spectrum usage, enhanced data security, resistance to interception, protection against wiretapping, compact design, low energy consumption, easy and rapid installation, and health risks comparable or lower than those of other technologies [2]. However, their performance is strongly affected by weather conditions such as rain, fog, and turbulence. Moreover, they require high-quality stabilization of the transceiver alignment, which is why they are typically deployed in static scenarios.
To summarize, FSOC technology faces significant challenges in severe weather conditions and mobile communication scenarios. Various methods have been employed to mitigate weather-related effects, including optimizing the transmission spectrum, applying advanced coding techniques, and adjusting the configuration and number of transmitters and receivers [3].
The primary challenge with FSOC technology is ensuring availability during accidental shifts in the position of optical beams. These phenomena can result from fluctuations in the position of transceiving heads (due to wind strength or vibrations from carrier platforms) or from beam wandering caused by air turbulence. To address this, Pointing, Tracking & Acquisition (PAT) systems are developed, with a sensing unit that detects changes in beam positions [4].
A key component of this unit is an extra sensor that detects signal changes caused by additional reference light (beacon) or a beam splitter. Position Sensitive Detectors (PSDs) are often used as sensors. They provide high position resolution, fast response, a wide dynamic range, real-time position measurement, and are compact and lightweight. However, their main limitations include sensitivity to operating conditions, which can reduce accuracy, a nonlinear response, and potential reliability issues in position measurements. Additionally, some sensors have a small active area, which can significantly limit their radiation detection capabilities.
The technology proposed in this paper enables both data transmission and beam position tracking using a single detector, thereby greatly simplifying the design of FSOC heads and expanding their potential for mobile applications.
The analysis of state-of-the-art technology additionally indicates that FSOC systems typically operate in the near- or short-infrared ranges (NIR, SWIR), which broadly define the spectral range of tracking systems. However, adverse weather effects have driven growing interest in medium- or long-wave infrared (MWIR, LWIR) technologies. Several studies have highlighted the advantages of these links, particularly in terrestrial scenarios. Nevertheless, there is no available information on the use of beam position detectors operating in these spectral ranges. Therefore, the key points of this work are as follows:
- Practical verification of beam tracking capability using a quadrant detector (QD) in the mid-infrared spectrum (QD-MWIR),
- Demonstration of the potential of using a QD-MWIR detector for simultaneous beam tracking and data signal reception.
2. Study of PSD Technologies for FSOC Systems
2.1. Quadrant and Lateral Detectors
Optoelectronic devices are essential components and primary sources of information for beam tracking systems. Commonly used position-sensitive detectors (PSDs) include quadrant detectors, lateral-effect detectors (L-PSDs), and detector arrays [5]. Image sensors, such as CCDs, can also be employed to determine both the power level and the position of a light beam using algorithms based on photon counting or image analysis [6]. However, a major limitation of this method is the high background noise, which reduces detection performance. Furthermore, the limited frame rate and the processing time required for large pixel arrays increase the response time for beam position determination. These challenges are particularly critical for the development of simple, low-power, and compact FSOC devices. Therefore, the following analysis focuses exclusively on PSD technologies.
The quadrant detector measures the relative position of a light spot on its surface. Its simple design consists of four identical p-n junction photodiodes (ABCD) arranged symmetrically around the center, separated by narrow gaps (Figure 1). The generated photocurrents are proportional to the power of the incident beam. When the QD is illuminated centrally, the output currents of all four quadrants are equal. As the laser spot shifts across the detector surface, the quadrant currents vary accordingly. By analyzing the photocurrents, the position of the spot relative to the QD center can be determined.
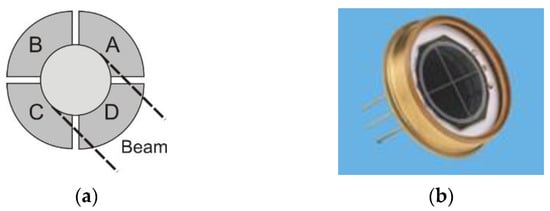
Figure 1.
(a) The structure of a quadrant detector; (b) photo [7].
Position sensing is performed by comparing the ratios of the photocurrents from the four elements. The beam position is then estimated using the conventional formula [8]:
where and represent the estimated beam position in the x and y directions, respectively. The parameter k is the slope constant, which depends on the beam profile. IA, IB, IC, and ID denote the photocurrents measured in each quadrant. More advanced formulas can be applied to improve linearity in both directions and enhance the accuracy of QD-based position detection [9,10,11].
Figure 2 shows the block diagram of the integrated beam position unit with a quadrant detector. Light passing through the interference filter is collected and focused by a lens onto the QD, which detects photons and generates photocurrents corresponding to the spot position. These photocurrents are then converted into voltage signals (VA, VB, VC, and VD) and processed using a dedicated configuration of sum and difference voltage amplifiers.
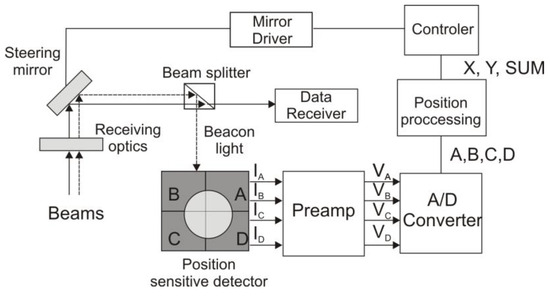
Figure 2.
Block diagram of a typical satellite terminal showing the beacon channel with digital values of each quadrant’s signal (A, B, C, D), position coordinates (X, Y), and the summarized detector signal (SUM) (adopted from [11]).
As a result, three voltage signals (Ex, Ey, and SUM) are generated. The SUM signal compensates for light fluctuations caused by instabilities in the radiation source or atmospheric effects such as scintillations. Figure 2 shows the schematic of the beam position unit [11]. The voltage signals represent the horizontal Ex and vertical Ey deviation of the transmitter position, respectively:
and are converted into digital formats.
The PSD output data are used to control other parts of the PAT system, ensuring proper FSOC beam alignment. The system employs two optical beams: the first is dedicated to data transmission, while the second (a beacon beam) provides a fixed reference position for the data beam.
The position accuracy of a laser beam is limited by photon noise, background noise, and dark current noise. For the x-axis, this uncertainty can be expressed by [11]
where erf is the error function, ω is the beam radius, and x0 is the beam’s central position. The variance of Δx equals
The uncertainty of the beam position is therefore inversely proportional to the signal-to-noise ratio. Certain processing methods applied to PSD output signals can further reduce this uncertainty, for example, by employing Kalman filter-based signal filtering [12].
The lateral PSD serves the same function in PAT devices; however, certain differences may affect its application compared to quadrant detectors. The L-PSD determines beam position by measuring photocurrent flowing through resistive elements. Two design variants exist: Duolateral (DL-PSD) and Tetralateral (TL-PSD) [13]. The DL-PSD incorporates a resistive layer at both the anode and cathode junctions of the photodiode. This configuration separates the detector’s x- and y-position signals, providing high linearity and precise transfer characteristics. However, the additional resistive layers significantly increase manufacturing costs.
In contrast, the TL-PSD employs a single resistive layer with a common cathode and anode on each side of the detection area. While this design reduces production costs, it compromises response linearity, particularly away from the detector center. This decline results from the placement of the anodes along the detector edge [14]. The electrostatic field in the detector generated by the charge Q is equal to [15]
where ε is the dielectric constant of the medium and r is the distance from the charge Q. For boundary conditions extending to infinity, the potential at distance r is given by
The equipotential lines have a circular shape around the charge Q. However, the conducting anodes that define the boundary conditions distort the field, resulting in square-shaped field lines (Figure 3).
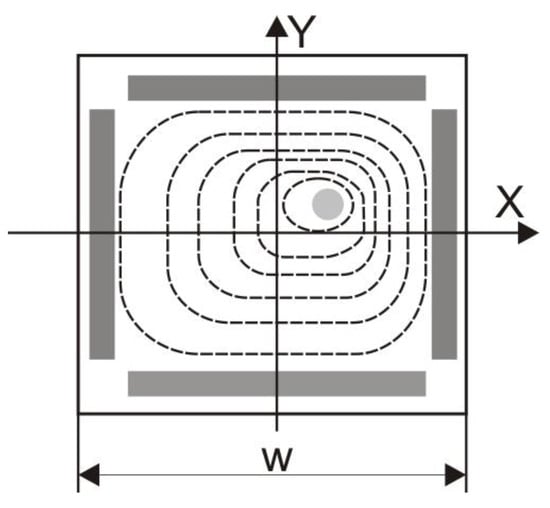
Figure 3.
Equipotential line distribution in an L-PSD detector [15].
The formula gives the potential difference in the x direction:
where w is the distance between the anodes, and for i x << w, this difference is proportional to x. In the region near the detector center, Equation (7) can be further approximated by
In practice, several methods are used to enhance the performance of these detectors. For example, Thorlabs Company describes a specialized edge design of detectors to improve linearity (Figure 4).
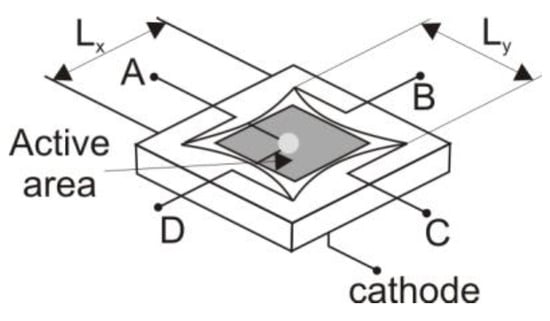
Figure 4.
Edge shape of the PSD detector as presented by Thorlabs [16].
The corresponding distances in both directions are determined:
where x and y denote the distances from the detector center to the spot position, and Lx and Ly represent the lengths of the detector edges. It should be noted that the edge dimensions differ from the active area. Unlike QD detectors, L-PSD detectors provide information about the spot position independently of the spot shape and size, as long as the light reaches the detector. The position resolution (ΔR) depends on both the edge lengths and the signal-to-noise ratio, as expressed by
where Vn is the output noise voltage.
2.2. Detectors Comparison
Analysis of PSD detector properties shows that lateral detectors are more suitable for precise, continuous position measurements, but they are generally more expensive and complex. Quadrant detectors, on the other hand, are more straightforward, more affordable, and more robust, making them well-suited for applications where ultra-high precision and continuous tracking are not critical. Table 1 summarizes the key characteristics of these technologies.

Table 1.
Comparison of PSD detectors’ performance.
Currently, numerous PSD detectors are available on the market for beam tracking applications. Table 2 presents a comparison of several models and their key performance characteristics.

Table 2.
Performance comparison of selected PSD detectors.
In summary, the primary function of beam tracking systems is to maintain the optical alignment between the transmitting and receiving paths. This alignment can be disrupted by unintentional shifts in the position of the transceiver heads, resulting from ground vibrations, temperature fluctuations, wind effects, or atmospheric turbulence. To compensate for these disturbances, PAT systems are employed in practice for both coarse and fine tracking. In coarse tracking, the position signal is typically derived from inertial sensors, GPS, or cameras, whereas fine tracking most often relies on PSD detectors to provide high accuracy and fast response. Consequently, the following analysis focuses on this class of detectors.
2.3. Position-Sensitive Detectors in FSOC
In principle, identifying the key PSD detector technologies used in FSOC systems is a challenging task, with the primary criterion being their availability. Table 3 presents data on additional examples of PSD-based systems reported in the literature.

Table 3.
Beam position-sensitive detectors are used in selected FSOC systems.
In practice, such a rapid analysis of position changes is not crucial given the time scales of the phenomena that can cause beam position changes and the response times of the devices used to compensate for these shifts [31]. Fluctuation rates of several Hz characterize the air turbulence that may occur, while the actuator systems operate at around several kHz. An example analysis of requirements for fine beam steering mechanisms for free-space optical system communication on satellites was presented in [32].
In the literature, several concepts of advanced PSD technologies dedicated to FSOC systems have also been described. For example, Patent EP 3 469 740 B1 presents a design with five sensitive surfaces, where a quadrant detector monitors changes and the fifth surface receives data signals. A simplified version of this approach is described in Patent No. US 9,810,862 B2, where instead of the detector element, a special “hole” in the array structure serves as the entrance aperture for the photodetection module.
A similar design is described in detail in [33]. It employs InAlAs/InGaAs APD arrays with various geometries (Figure 5). Each array consists of elements 100 µm in diameter, with a minimum optical fill factor of 80%. In laboratory tests using a 1550 nm laser, the central pixel of the circle-quad configuration exhibited a sensitivity of −42.2 dBm for a bit error rate of 2 × 10⁻⁹ and a data rate of 155 Mbps.

Figure 5.
Geometries of three InAlAs/InGaAs APD arrays.
A comparison of current PSD technologies can be made according to several criteria. The most straightforward is cost, where detectors operating in the NIR or SWIR range are generally more affordable. The higher price of MWIR detectors stems from both their more complex manufacturing process and from still relatively limited market demand. From an application perspective, however, systems operating in the MWIR band can provide significant advantages, including longer operational ranges and a greater number of transmission channels under conditions of reduced visibility or atmospheric turbulence. These capabilities are often critical in terrestrial communication systems as well as in data links for ground-based platforms and airborne systems. The application-related benefits of this technology have already been documented in the literature and will not be discussed here in detail [34,35,36,37,38].
3. Materials
QM-4 is a multi-channel infrared (IR) detection module incorporating a photovoltaic, four-element quadrant geometry detector based on mercury cadmium telluride (MCT) heterostructure grown using the MOCVD technique (AIXTRON, Herzogenrath, Germany).
To achieve a module frequency bandwidth of up to 100 MHz, a dedicated detecting wafer architecture was developed (Table 4).

Table 4.
MCT wafer architecture of PSD-MWIR detector.
The four-segment photodiode geometry was fabricated using wet etching. The structure and the corresponding edge heterostructure image are shown in Figure 6a and Figure 6b, respectively.
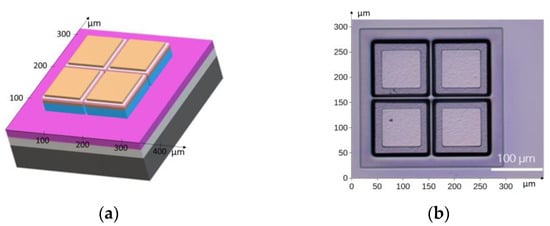
Figure 6.
(a) Schematic diagram of the four-channel photodiode used in the IR detection module; (b) photograph of the edged mesa structure.
A (111)-oriented Hg1−xCdxTe heterostructure, containing a lightly doped p-type narrow-gap absorber with the material composition x = 0.312, optimized for position detection of about the 4 μm radiation at 210 K and sandwiched between wide-gap, heavily doped contact layers [39], was grown by metalorganic chemical vapor deposition (MOCVD) on a CdTe-buffered semi-insulating (100) GaAs substrate [40,41]. The structure was doped with iodine and arsenic, incorporated in situ during growth, as stable and well-behaved donor and acceptor dopants, respectively. The absorber thickness was reduced approximately 0.8 μm to increase the differential impedance of this large MWIR photodiode.
Due to the internal reflection from the top of the detector mesa—covered with the indium electrode—the input radiation beam essentially passed through the absorber twice. Photodetector fabrication involved optical and electrical characterization of the epi-wafers, photolithography, mesa etching, sidewalls passivation, contact metallization, dicing into chips with four-element devices, indium bump bonding to sapphire carriers with metal leadouts, mounting on Peltier coolers with cold fingers, and sealing of the detector elements in packages filled with xenon or xenon/krypton mixtures. For practical use, the TO-8-based detector packages and associated electronics are integrated into detection modules. While the impact of the MCT heterostructure on noise was described in works [42,43,44,45], an analysis of its effect on crosstalk and noise lies beyond the scope of this manuscript.
4. Results
4.1. Characterization of the QD-MWIR Detector
Figure 7 presents the dark current–voltage (I–V) characteristics of the four-segment photodiode measured at T = 210 K. All the segments exhibit similar I–V behavior, indicating low series resistance and nearly voltage-independent saturation currents under reverse bias. As shown in the inset of Figure 7, the saturation currents are approximately 135 nA, with a uniformity better than 10% across the segments.
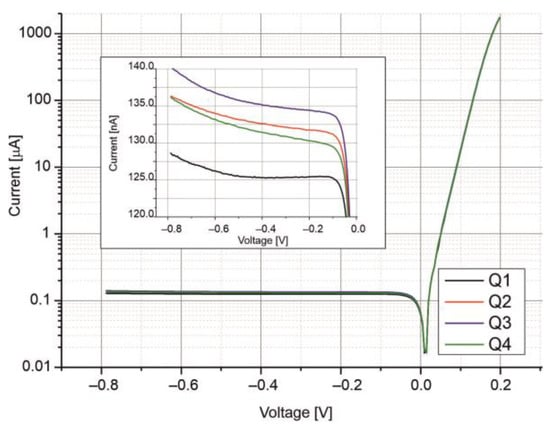
Figure 7.
Current–voltage characteristics of the four-channel photodiode measured at T = 210 K. Q1, Q2, Q3, and Q4 represent the individual segments of the photodiode.
Figure 8 presents the detectivity (D*) spectra of the four-segment photodiode, measured at a temperature of 210 K. The spectra are uniform, with a 10% cut-on at 2.7 μm and a 10% cut-off at 4.6 μm, reaching a peak detectivity at 3.2 μm.
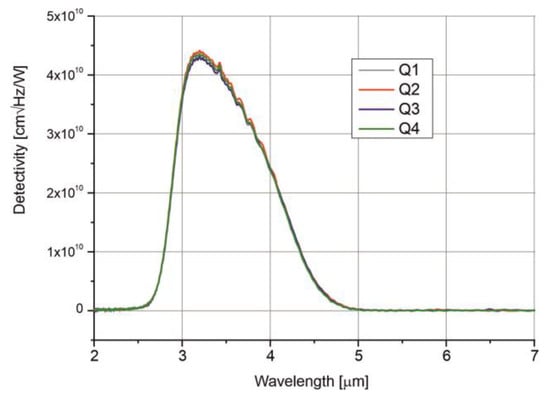
Figure 8.
Detectivity spectra of the four-channel photodiode measured at T = 210 K.
The detectivity of each channel reaches D* = 4.3⋅× 1010 J at the peak wavelength and D* = 2.4⋅× 1010 J at the optimal wavelength.
Figure 9 shows the photodiode’s time response to 5 μm laser excitation at zero bias at three different temperatures. As the temperature decreases, the photodiode’s bandwidth increases (rise time decreases), reaching 50 MHz at T = 300 K, 200 MHz at T = 230 K, and 260 MHz at T = 210 K.
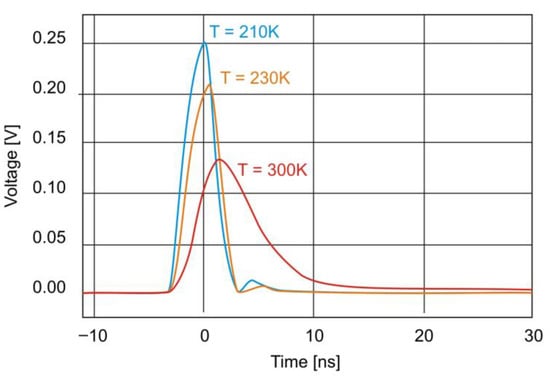
Figure 9.
Temporal response of the photodiode at zero bias for three different temperatures.
Figure 10 presents the capacitance–voltage characteristics measured at three different temperatures using an Agilent E5061B network analyzer and a specialized test fixture designed for TO-8 reflection coefficient measurement. The measurement frequency range was set from 1 kHz to 3 GHz. The capacitance is extracted by fitting the broadband reflection coefficient data to a model consisting of four parameters: series resistance RS, parallel resistance RP, parallel capacitance CP, and series inductance LS, forming a broadband equivalent circuit of the photodiode. As shown in Figure 10a, the CP value strongly depends on the applied reverse bias. Even a low reverse voltage causes the capacitance to decrease significantly, stabilizing at a few picofarads. The temperature also has a noticeable impact—particularly at zero bias—where CP decreases by nearly an order of magnitude, as illustrated in Figure 10b.
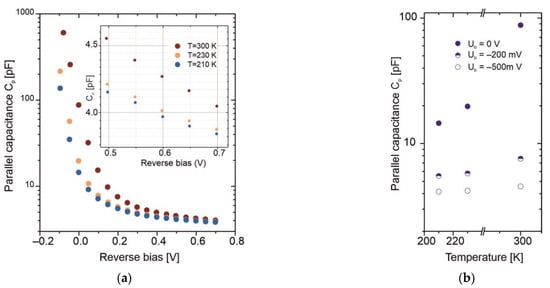
Figure 10.
(a) Capacitance–voltage characteristics at various temperatures; (b) parallel capacitance as a function of temperature for three reverse bias voltages.
4.2. Research on the QD-MWIR Detection Module
The segmented photodiode was integrated with the DC-coupled, four-channel preamplifier and a thermoelectric cooler controller. The reverse bias voltage applied to the diode was Ub = −500 mV. The integrated detection module exhibits a voltage responsivity of RV = 2.75 × 10⁴ V/W at 4 μm, and a detectivity of D* = 1.8 × 10⁹ J. Its low- and high-cutoff frequencies range from 1 kHz to 100 MHz. As shown in Figure 11, each channel maintains an output noise density below 160 nV/√Hz at f = 10 MHz.
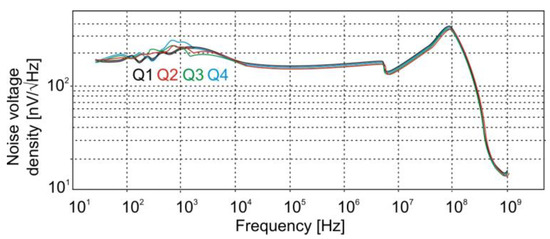
Figure 11.
Frequency dependence of the noise voltage density for the four channels of the QM-4 detection module.
4.3. Beam Tracking Operation
The functionality of the QD-MWIR detection module as a beam tracking device was verified in a laboratory setup, as shown in Figure 12. The transmitter utilizes a pulsed quantum cascade laser (model QCL834) developed at the Institute of Microelectronics and Photonics (Łukasiewicz Research Network). The laser is housed in a hermetically sealed HHL casing, which also contains a TEC module and a temperature sensor. Radiation is emitted through an optical window and has a divergence of 350 (full-width at half maximum). The system generates radiation pulses at a wavelength of approximately 3.9 µm, with a peak power of up to 600 mW and a duty cycle of less than 5%. The operating point of the laser is controlled by adjusting the current and temperature using the LDP-V 03-100 V4 from Picolas and the TEC WTC32ND 2.2 A from Wavelength Electronics, respectively. The light signals are triggered by the PICOSECOND model 12,000 generator, which, during the initial phase of the research, was operated in pulse mode with adjustable duration and frequency.

Figure 12.
Laboratory setup for testing the PSD-MWIR detection module.
The pulse from each QD’s channel was recorded to determine the signal bandwidth. The rise time ranged from 4.1 ns to 4.4 ns. Figure 13 shows the pulse shapes of each channel as well as their combined signal. Considering the laser pulses’ rise time of 3 ns, the approximate bandwidth of the QD-MWIR module is estimated to be around 110 MHz.
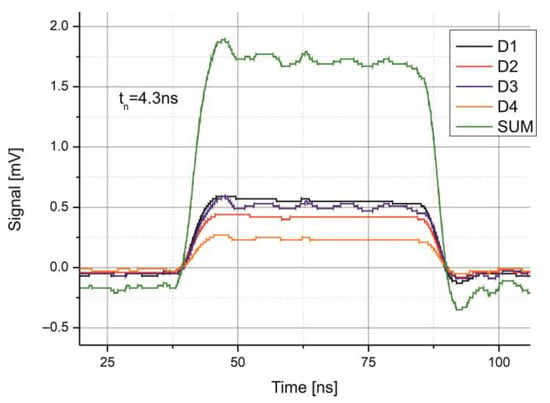
Figure 13.
Recorded signals from each segment of the QD-MWIR module and their combined sum.
The transfer characteristic of the QD-MWIR module during beam tracking was also measured. In this phase of the research, the Picosecond generator again operated in pulse mode. A collimated QCL laser beam was focused onto the detector surface using a Ge lens (25 × 40, Edmund Optics). The optical path length was 1 m. Angular adjustments of the beam position were made using a Standa rotary stage (model 8MR-151). Output signals from the QD-MWIR module were recorded with a four-channel Tektronix oscilloscope (MSO 6), which also calculated their sum. The axial position difference signal was automatically computed by inputting formula [2] into the oscilloscope math function editor. The resulting transfer characteristic is shown in Figure 14.
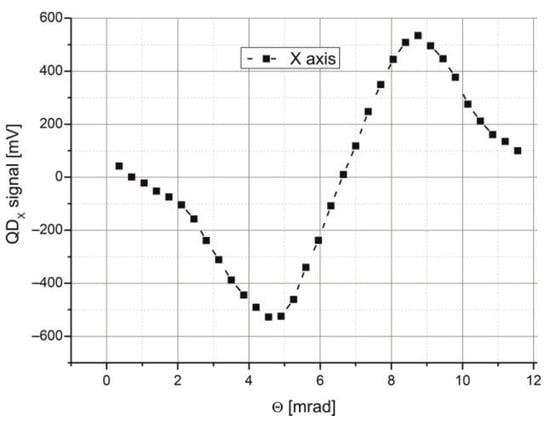
Figure 14.
Transfer characteristic of the beam tracking procedure with the QD-MWIR module.
Based on this characteristic, the laboratory setup can detect changes in the beam’s angular position with a sensitivity of 320 mV/mrad. However, this sensitivity depends not only on the intrinsic parameters of the QD-MWIR module but also on the beam spot size on the detection surface. This issue was previously analyzed and was not the subject of further research. In summary, the results demonstrate that the detection module is capable of monitoring changes in beam position and recording data signals with a signal bandwidth of approximately 110 MHz.
4.4. Data Signal Registration
The laboratory setup also verified the potential for transmitting pulsed signals using a QCL laser-based transmitter. The transmitter generated optical pulses with a duration of 7 ns at a repetition rate of 17 MHz. This configuration enables a minimum data rate of 51 Mb/s, for example, when using PPM modulation. Figure 15 shows the recorded pulse shapes for two different beam spot positions. The shapes are achieved at the optimal operating point of the laser, where both high power and modulation frequency are maintained. These parameters are then used to define the sequence of frame bits and their timing details for further eye diagram tests.
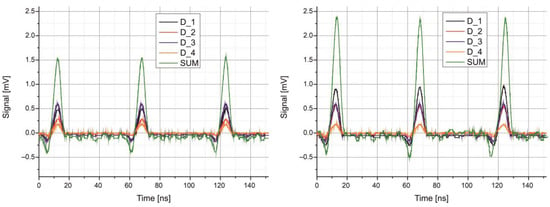
Figure 15.
Registered optical signals for two different beam positions on the QD detector surface.
Although the signal amplitudes from individual QD detector segments changed with beam displacement, the summed signal remained constant. This characteristic can be effectively used for tracking the direction of the optical beam.
To evaluate the data transmission performance of the FSOC laboratory setup, the Picosecond generator was switched to ‘Pattern mode’. In this mode, it generates a pseudo-random binary sequence (PRBS) of pulses with either Return-to-Zero (RZ) or Non-Return-to-Zero (NRZ) encoding. The instrument allows for the random creation of a specified bit frame, with the user defining the number of bits and their positions within the frame. For testing, it was assumed that the 100 ns frame contains 10 bits, each lasting 8 ns. Given the limited duty cycle of the transmitter’s light pulses, only one bit in the frame was assumed to have a value of “1” [0 0 0 1 0 0 0 0 0 0 0 0 0]. A built-in oscilloscope communication analysis tool on the oscilloscope processed the signal recorded by the QD-MWIR module, enabling the identification of the key link parameters.
Figure 16 shows a screenshot of the oscilloscope with the measurement results. The data indicate a minimum time slot for RZ (return-to-zero) encoding of approximately 6 ns, and a jitter of less than ±600 ps.
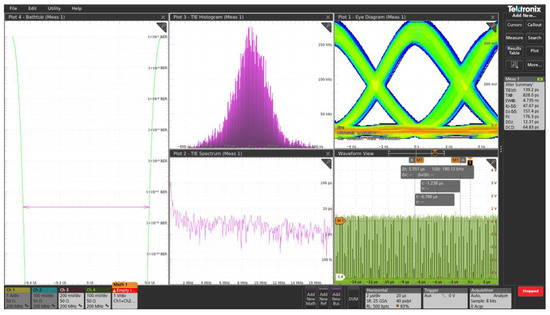
Figure 16.
Oscilloscope screenshot of the measurement results.
Although these results confirm the system’s ability to record short laser pulses, the main limitation on the available data rate is the low duty cycle (below 5%) of the QCL transmitter output.
5. Discussion
The paper presents the results of research on a laboratory optical link operating in the MWIR range, which could represent a new direction for developing FSO technology. Currently, however, commercial FSOC devices utilize radiation in the NIR or SWIR ranges. In real-world conditions, the performance of these links is mainly influenced by their operational environment. For example, when analyzing the effects of scattering—such as when visibility decreases—the use of longer wavelengths reduces radiation attenuation [46,47]. The level of the so-called refractive index structure parameter Cn2 defines the influence of atmospheric turbulence. This phenomenon can cause scintillation, beam wandering, and beam spreading. However, the most crucial impact on the link’s parameters is due to scintillations, which describe unpredictable changes in the amplitude and phase of an optical signal propagating in a turbulent atmosphere. These changes are described as the scintillation index:
where k = 2π/λ is the wave number, λ is the wavelength, and R is the link range. Based on this parameter, the levels of weak (σI < 1), moderate (σI ∼ 1), and strong (σI > 1) scintillation are defined. The σI level can generally influence the value of the bit error rate. However, in the MWIR range, a smaller deterioration of this parameter occurs compared to NIR and SWIR [48,49,50]. When analyzing the influence of background radiation in the MWIR range, it turns out that it depends on atmospheric conditions, as with other wavelength ranges. The level of this radiation is slightly lower than that observed in the SWIR range, and much lower than in the NIR range [51].
The results demonstrate that the developed detection module can be effectively used in FSOC systems operating in the MWIR range. The use of a QD detector enables two functions to be performed simultaneously: data signal acquisition and beam position tracking, both within a bandwidth of 110 MHz.
Integrating these two functionalities significantly simplifies the overall design of the FSOC system. Additionally, using the same spectral radiation to perform both functions allows for more accurate compensation of disturbance factors with a spectral origin. Combining signals from the four detector segments also helps reduce the impact of uncorrelated noise, thereby improving the SNR. However, analyzing these signals will require more advanced readout electronics equipped with ultra-high-speed A/D converters. Future research will focus on developing an integrated platform capable of modulating laser radiation, demodulating the received signal, and detecting beam position changes—specifically for FSOC systems operating in the MWIR range.
Author Contributions
Conceptualization, J.M. and W.G.; methodology, J.M.; validation, D.S. and A.P.; investigation, D.S. and A.P.; resources, W.G.; writing—original draft preparation, J.M.; writing—review and editing, W.G. and Z.B.; visualization, A.P.; supervision, Z.B.; funding acquisition, J.M. All authors have read and agreed to the published version of the manuscript.
Funding
This research received no external funding.
Data Availability Statement
The original contributions presented in this study are included in the article. Further inquiries can be directed to the corresponding authors.
Acknowledgments
This research was performed with the support of the Polish National Centre for Research and Development (grant number DOB- BIO-12-09-010-2023).
Conflicts of Interest
The authors declare no conflicts of interest.
References
- Rahman, M.T.; Jahid, M.A.; Anha, S.Y.; Rahman, M.S.; Orpy, F.A.; Akibillah, A.S.M. High-Capacity DWDM Transmission System for Free-Space Optical Network. In Proceedings of the 2024 6th International Conference on Electrical, Control and Instrumentation Engineering (ICECIE), Pattaya, Thailand, 23 November 2024. [Google Scholar] [CrossRef]
- Jain, V.; Reddy, B.V.R.; Payal, A. A Comprehensive Review Of Satellite Communication System And RF-FSO Wireless Technologies. J. Opt. 2025, 1–9. [Google Scholar] [CrossRef]
- Maswikaneng, S.P.; Owolawi, P.A.; Ojo, S.O.; Mphahlele, M.I. Atmospheric effects on free space optics wireless communication: Applications and challenges. In Proceedings of the 2018 International Conference on Intelligent and Innovative Computing Applications (ICONIC), Mon Tresor, Mauritius, 6–7 December 2018. [Google Scholar] [CrossRef]
- Kaymak, Y.; Rojas-Cessa, R.; Feng, J.; Ansari, N.; Zhou, M.; Zhang, T. A survey on acquisition, tracking, and pointing mechanisms for mobile free-space optical communications. IEEE Commun. Surv. Tutor. 2018, 20, 1104–1123. [Google Scholar] [CrossRef]
- Dwik, S.; Sasikala, G.; Natarajan, S. Advancements and applications of position-sensitive detector (PSD): A review. Optoelectron. Lett. 2024, 20, 330–338. [Google Scholar] [CrossRef]
- Jakobs, J.P.; Schmidt, C. Image sensor-based pointing, acquisition, and tracking for optical satellite links. In Environmental Effects on Light Propagation and Adaptive Systems VII; SPIE: Edinburgh, UK, 2024; p. 13194. [Google Scholar] [CrossRef]
- Photodetectors. Available online: https://www.osioptoelectronics.com/products/photodetectors (accessed on 2 September 2025).
- Li, D.; Zhang, Y. Research on factors influencing the positioning accuracy of four-quadrant detector. J. Phys.Conf. Ser. 2021, 1983, 012087. [Google Scholar] [CrossRef]
- Guanghui, W.; Shum, P.; Guoliang, X.; Xuping, Z. Position detection improvement of position sensitive detector (psd) by using analog and digital signal processing. In Proceedings of the 2007 6th International Conference on Information, Communications & Signal Processing, Singapore, 10–13 December 2007. [Google Scholar] [CrossRef]
- De-La-Llana-Calvo, Á.; Lázaro-Galilea, J.L.; Alcázar-Fernández, A.; Gardel-Vicente, A.; Bravo-Muñoz, I.; Iamnitchi, A. Accuracy and precision of agents orientation in an indoor positioning system using multiple infrastructure lighting spotlights and a PSD sensor. Sensors 2022, 22, 2882. [Google Scholar] [CrossRef]
- Li, Q.; Xu, S.; Yu, J.; Yan, L.; Huang, Y. An improved method for the position detection of a quadrant detector for free space optical communication. Sensors 2019, 19, 175. [Google Scholar] [CrossRef]
- Luo, Y.; Shen, Y.; Cordero, J.; Zaklit, J. Enhancing measurement accuracy of position sensitive detector (PSD) systems using the Kalman filter and distortion rectifying. In Proceedings of the SENSORS, 2013, Baltimore, MD, USA, 3–6 November 2013; IEEE: Baltimore, MD, USA, 2013. [Google Scholar] [CrossRef]
- Solal, M.C. The origin of duo-lateral position-sensitive detector distortions. In Nuclear Instruments and Methods in Physics Research Section A: Accelerators, Spectrometers, Detectors and Associated Equipment; Elsevier: Amsterdam, The Netherlands, 2007; Volume 572, pp. 1047–1055. [Google Scholar] [CrossRef]
- Position-Sensing Detectors Characteristics. Available online: https://www.osioptoelectronics.com/media/pages/knowledgebase/899d94b819-1730291341/an01-psd-characteristics-202441.pdf (accessed on 2 September 2025).
- Wang, X.; Sun, X.; Zhai, T.; Yang, Q.; Cui, S.; Zhang, J.; Wu, B.; Deng, J.; Xie, Y.; Ruotolo, A. A bias-free, lateral effect position sensor photodetector. Sens. Actuators A Phys. 2021, 330, 112846. [Google Scholar] [CrossRef]
- Position-Sensing Detectors. Available online: https://www.thorlabs.com/newgrouppage9.cfm?objectgroup_id=4400 (accessed on 2 September 2025).
- Wang, X.; Su, X.; Liu, G.; Han, J.; Wang, R. Research on photoelectric signal preprocessing of four-quadrant detector in free space optical communication system. In Proceedings of the IEEE 5th International Conference on Signal and Image Processing (ICSIP), Nanjing, China, 3–5 July 2020. [Google Scholar] [CrossRef]
- Wu, J.; Chen, Y.; Gao, S.; Li, Y.; Wu, Z. Improved measurement accuracy of spot position on an InGaAs quadrant detector. Appl. Opt. 2015, 27, 8049–8054. [Google Scholar] [CrossRef]
- Harris, A.; Sluss, J.J.; Refai, H.H.; LoPresti, P.G. Alignment and tracking of a free-space optical communications link to a UAV. In Proceedings of the 24th Digital Avionics Systems Conference, Washington, DC, USA, 30 October–3 November 2005. [Google Scholar] [CrossRef]
- Trinch, P.V.; Casado, A.C.T.; Okura, H.; Tsuji, D.R.; Kolev, K.; Shiratama, Y.; Munemasa, M. Toyoshima. Experimental channel statistics of drone-to-ground retro-reflected FSOC links with fine-tracking systems. IEEE Access 2021, 9, 137148–137164. [Google Scholar] [CrossRef]
- Quintana, C.; Erry, G.; Gomez, A.; Thueux, Y.; Faulkner, G.E.; O’Brien, D.C. Design of a holographic tracking module for long-range retroreflector free-space systems. Appl. Opt. 2016, 55, 7173–7178. [Google Scholar] [CrossRef]
- Zhang, W.; Guo, W.; Zhang, C.; Zhao, S. An Improved Method for Spot Position Detection of a Laser Tracking and Positioning System Based on a Four-Quadrant Detector. Sensors 2019, 19, 4722. [Google Scholar] [CrossRef]
- Part Description QP50-6-SM. Available online: https://www.mouser.pl/datasheet/2/418/9/First_Sensor_09292017_qp50_6_sm_-3305353.pdf (accessed on 2 September 2025).
- Bekkali, A.; Fujita, H.; Hattori, M.; Hara, Y.; Umezawa, T.; Kanno, A. All-optical Mobile FSO Transceiver with High-Speed Laser Beam Steering and Tracking. In European Conference on Optical Communication (ECOC); IEEE: Basel, Switzerland, 2022. [Google Scholar]
- Bekkali, A.; Fujita, H.; Hattori, M. New Generation Free-Space Optical Communication Systems with Advanced Optical Beam Stabilizer. J. Light. Technol. 2022, 40, 1509–1518. [Google Scholar] [CrossRef]
- Medina, I.; Hernández-Gómez, J.J.; Couder-Castañeda, C. Fine Pointing and Tracking Onboard System for CubeSat Optical Satcom. Int. J. Aeronaut. Space Sci. 2023, 24, 1452–1464. [Google Scholar] [CrossRef]
- Kappala, V.K.; Pradhan, J.; Turuk, A.K.; Silva, V.N.H.; Majhi, S.; Das, S.K. A Point-to-Multi-Point Tracking System for FSO Communication. IEEE Trans. Instrum. Meas. 2021, 70, 5504110. [Google Scholar] [CrossRef]
- Park, S.; Yeo, C.I.; Heo, Y.S.; Ryu, J.H.; Kang, H.S.; Lee, D.-S.; Jang, J.-H. Tracking Efficiency Improvement According to Incident Beam Size in QPD-Based PAT System for Common Path-Based Full-Duplex FSO Terminals. Sensors 2022, 22, 7770. [Google Scholar] [CrossRef] [PubMed]
- Quintana, C.; Wang, Q.; Jakonis, D.; Oberg, O.; Erry, G.; Platt, D.; Thueux, Y.; Faulkner, G.; Chun, H.; Gomez, A.; et al. A High Speed Retro-Reflective Free Space Optics Links with UAV. J. Light. Technol. 2021, 39, 5699–5705. [Google Scholar] [CrossRef]
- Moll, F.; Horwath, J.; Shrestha, A.; Brechtelsbauer, M.; Fuchs, C.; Navajas, L.A.M.; Souto, A.M.L.; Gonzalez, D.D. Demonstration of High-Rate Laser Communications From a Fast Airborne Platform. IEEE J. Sel. Areas Commun. 2015, 33, 1985–1995. [Google Scholar] [CrossRef]
- Chen, L.; Zhu, L.; Du, H.; Wang, X.; Shen, S.; Wang, Y.; Zhao, S.; Wang, X. Pointing Acquisition and Tracking System for Free Space Optical Communication Based on Integrated Optical Phased Array. IEEE Photonics J. 2025, 17, 4. [Google Scholar] [CrossRef]
- Milaševičius, M.; Mačiulis, L. A Review of Mechanical Fine-Pointing Actuators for Free-Space Optical Communication. Aerospace 2024, 11, 5. [Google Scholar] [CrossRef]
- Ferraro, M.S.; Clark, W.R.; Rabinovich, W.S.; Mahon, R.; Murphy, J.L.; Goetz, P.G.; Thomas, L.M.; Burris, H.R.; Moore, C.I.; Waters, W.D.; et al. InAlAs/InGaAs avalanche photodiode arrays for free space optical communication. Appl. Opt. 2015, 54, F182–F188. [Google Scholar] [CrossRef]
- Grillot, F.; Poletti, T.; Pes, S. Progress in mid-infrared optoelectronics for high-speed free-space data throughput. APL Photonics 2025, 10, 010905. [Google Scholar] [CrossRef]
- Sauvage, C.; Robert, C.; Sorrente, B.; Grillot, F.; Erasme, D. Study of short and mid-infrared telecom links performance for different climatic conditions. In Environmental Effects on Light Propagation and Adaptive Systems II; Proc. SPIE: Strasbourg, France, 2019; Volume 11153, p. 111530I. [Google Scholar] [CrossRef]
- Leitgeb, E.; Plank, T.; Awan, M.S. Analysis and evaluation of optimum wavelengths for free-space optical transceivers. In Proceedings of the 2010 12th International Conference on Transparent Optical Networks, Munich, Germany, 27 June–1 July 2010. [Google Scholar] [CrossRef]
- Mikołajczyk, J.; Weih, R.; Motyka, M. Optical Wireless Link Operated at the Wavelength of 4.0 µm with Commercially Available Interband Cascade Laser. Sensors 2021, 21, 4102. [Google Scholar] [CrossRef]
- Flannigan, L.; Yoell, L.; Xu, C. Mid-wave and long-wave infrared transmitters and detectors for optical satellite communications—A review. J. Opt. 2022, 24, 4. [Google Scholar] [CrossRef]
- Pawluczyk, J.; Piotrowski, J.; Pusz, W.; Kozniewski, A.; Orman, Z.; Gawron, W.; Piotrowski, A. Complex Behavior of Time Response of HgCdTe HOT Photodetectors. J. Electron. Mater. 2015, 44, 3163–3173. [Google Scholar] [CrossRef]
- Gawron, W.; Martyniuk, P.; Kębłowski, A.; Kolwas, K.; Stępień, D.; Piotrowski, J.; Madejczyk, P.; Pędzińska, M.; Rogalski, A. Recent progress in MOCVD growth for thermoelectrically cooled HgCdTe medium wavelength infrared photodetectors. Solid-State Electron. 2016, 118, 61–65. [Google Scholar] [CrossRef]
- Madejczyk, P.; Gawron, G.; Kębłowski, A.; Młynarczyk, K.; Stępień, D.; Martyniuk, P.; Rogalski, A.; Rutkowski, J.; Piotrowski, J. Higher Operating Temperature IR Detectors of the MOCVD Grown HgCdTe Heterostructures. J. Electron. Mater. 2020, 49, 6908–6917. [Google Scholar] [CrossRef]
- Ciura, Ł.; Kolek, A.; Gawron, W.; Kowalewski, A.; Stanaszek, D. Measurements of low frequency noise of infrared photodetectors with transimpedance detection system. Metrol. Meas. Syst. 2014, 21, 461–472. [Google Scholar] [CrossRef]
- Ciura, Ł.; Kolek, A.; Wrobel, J.; Gawron, W.; Rogalski, A. 1/f Noise in Mid-Wavelength Infrared Detectors with InAs/GaSb Superlattice Absorber. IEEE Trans. Electron Devices 2015, 62, 2022–2026. [Google Scholar] [CrossRef]
- Ciura, Ł.; Kolek, A.; Keblowski, A.; Stanaszek, D.; Piotrowski, A.; Gawron, W.; Piotrowski, J. Investigation of trap levels in HgCdTe IR detectors through low frequency noise spectroscopy. Semicond. Sci. Technol. 2016, 31, 035004. [Google Scholar] [CrossRef]
- Achtenberg, K.; Gawron, W.; Bielecki, Z. Low-frequency noise and impedance measurements in Auger suppressed LWIR N+p(π)P+n+ HgCdTe detector. Infrared Phys. Technol. 2024, 137, 105110. [Google Scholar] [CrossRef]
- Delga, A.; Leviandier, L. Free-space optical communications with quantum cascade lasers. In Quantum Sensing and Nano Electronics and Photonics XVI; Proc. SPIE: Bellingham, WA, USA, 2019; Volume 10926, p. 1092617. [Google Scholar] [CrossRef]
- Tabirian, A.M.; Stanley, D.P.; Roberts, D.E.; Thompson, A.B. Atmospheric propagation of novel MWIR laser output for emerging free-space applications. In Atmospheric Propagation V; Proc. SPIE: Bellingham, WA, USA, 2008; Volume 6951, p. 69510T. [Google Scholar] [CrossRef]
- Rahm, M.; Kullander, F.; Björck, M.; Sjöqvist, L. Turbulence and transmission effects on laser beam propagation in the SWIR and LWIR bands. In Environmental Effects on Light Propagation and Adaptive Systems VI; Proc. SPIE: Bellingham, WA, USA, 2023; Volume 12731, p. 127310G. [Google Scholar] [CrossRef]
- Trichili, A.; Cox, M.A.; Ooi, B.S.; Alouini, M.-S. Roadmap to free space optics. J. Opt. Soc. Am. B 2020, 37, A184–A201. [Google Scholar] [CrossRef]
- Mikołajczyk, J. A Comparison Study of Data Link with Medium-Wavelength Infrared Pulsed and CW Quantum Cascade Lasers. Photonics 2021, 8, 203. [Google Scholar] [CrossRef]
- Manor, H.; Arnon, S. Performance of an optical wireless communication system as a function of wavelength. In Proceedings of the 22nd Convention on Electrical and Electronics Engineers in Israel, Tel-Aviv, Israel, 1 December 2002. [Google Scholar] [CrossRef]
Disclaimer/Publisher’s Note: The statements, opinions and data contained in all publications are solely those of the individual author(s) and contributor(s) and not of MDPI and/or the editor(s). MDPI and/or the editor(s) disclaim responsibility for any injury to people or property resulting from any ideas, methods, instructions or products referred to in the content. |
© 2025 by the authors. Licensee MDPI, Basel, Switzerland. This article is an open access article distributed under the terms and conditions of the Creative Commons Attribution (CC BY) license (https://creativecommons.org/licenses/by/4.0/).