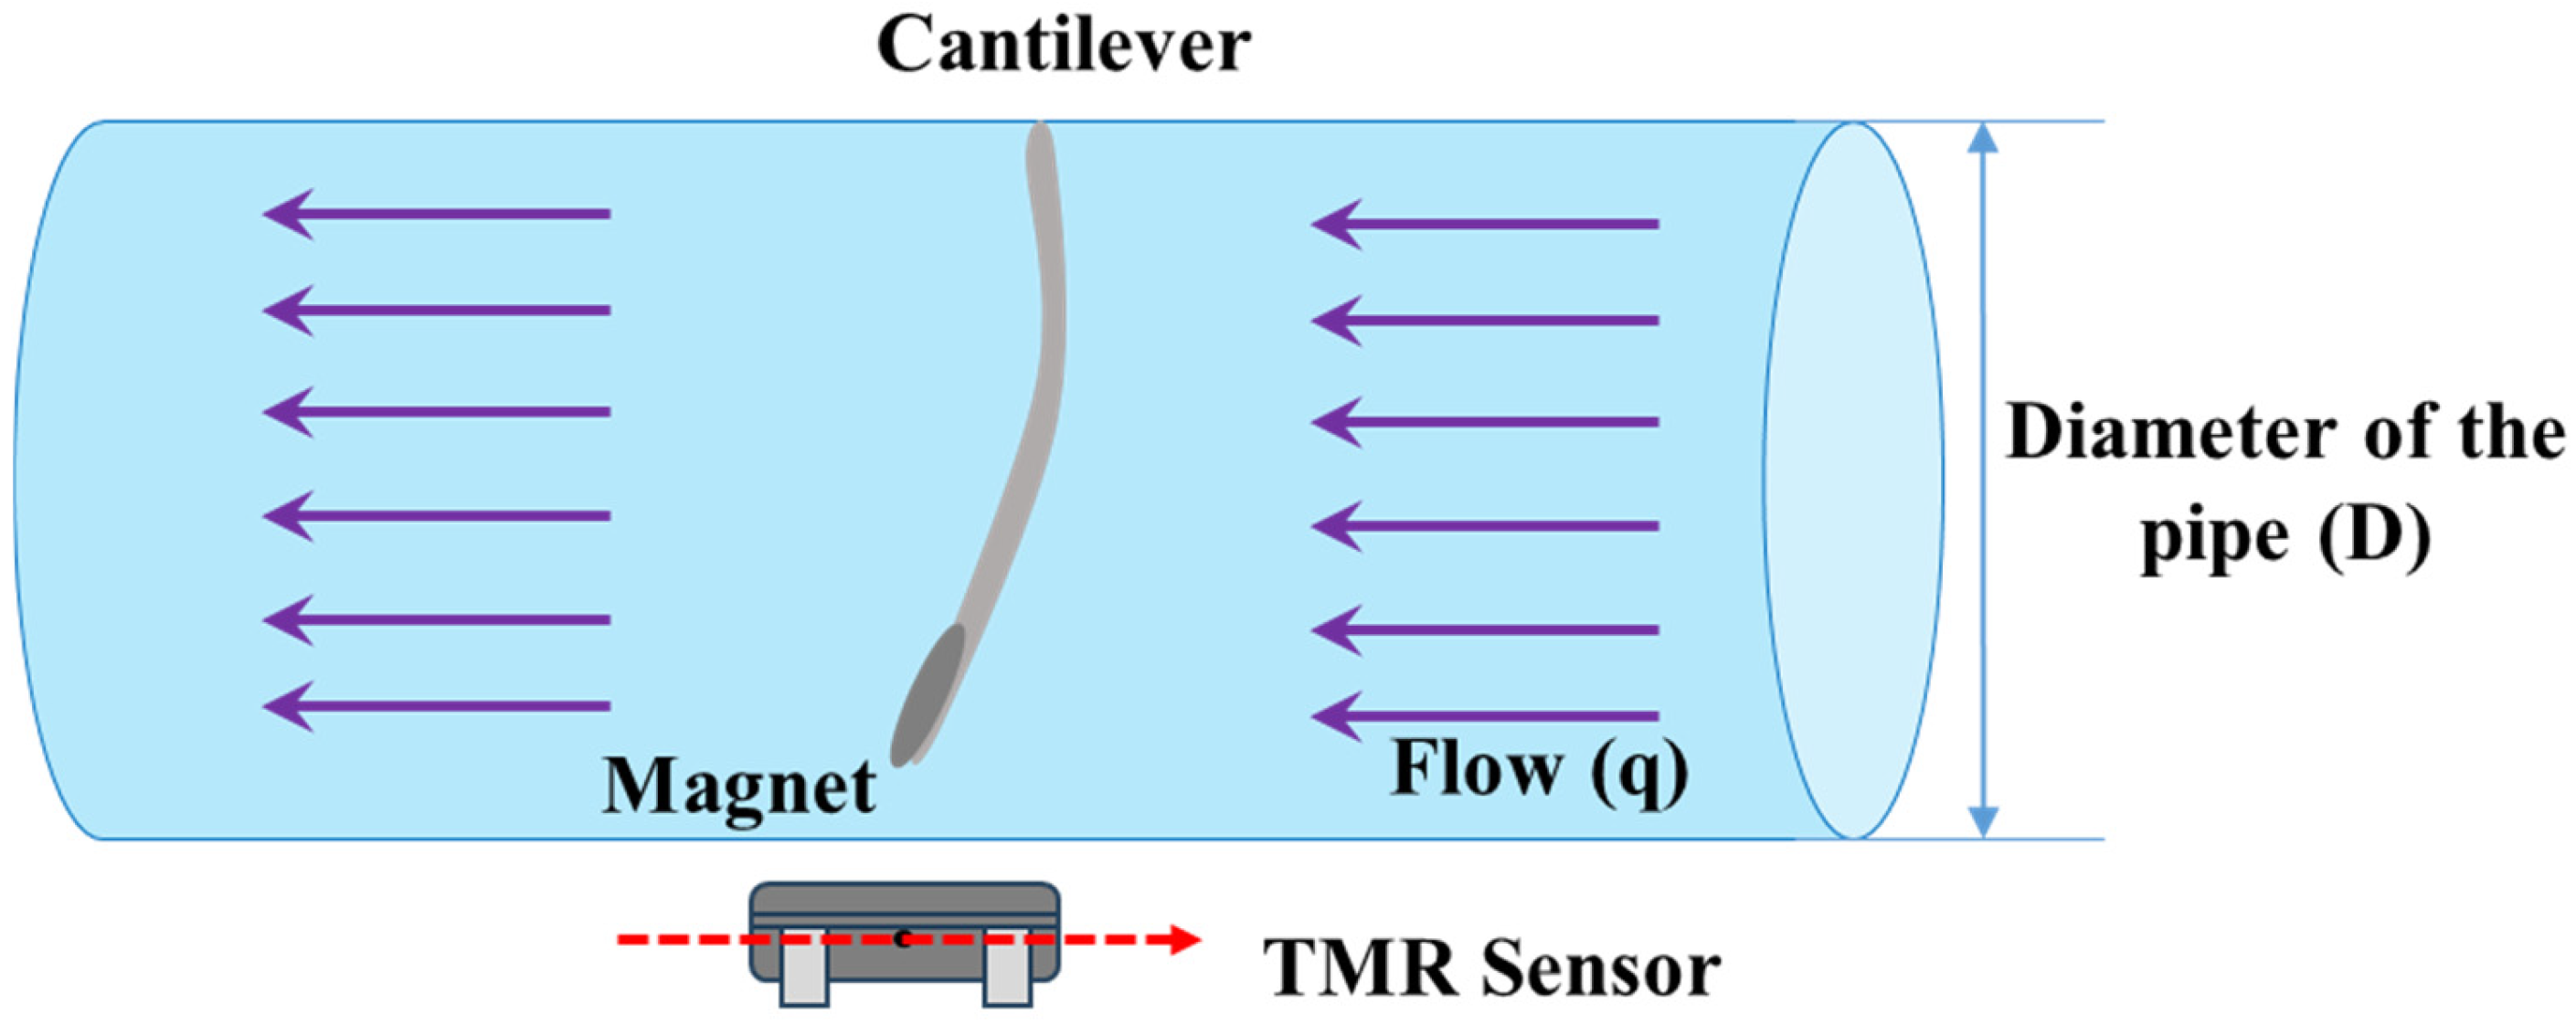
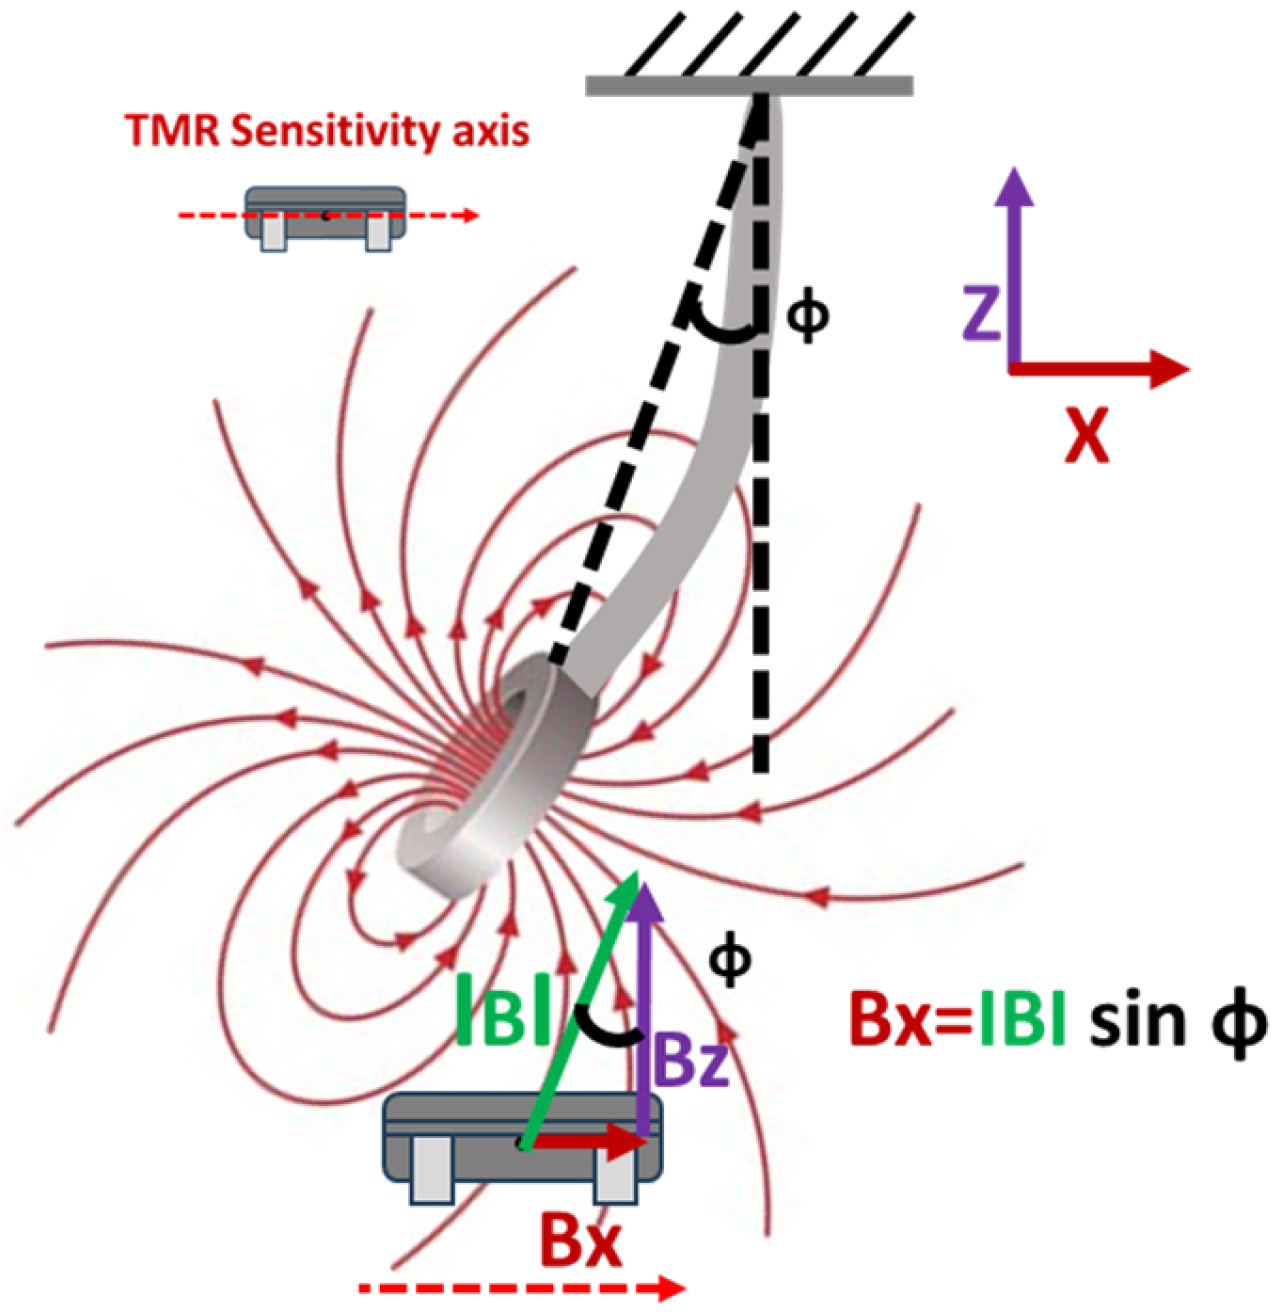
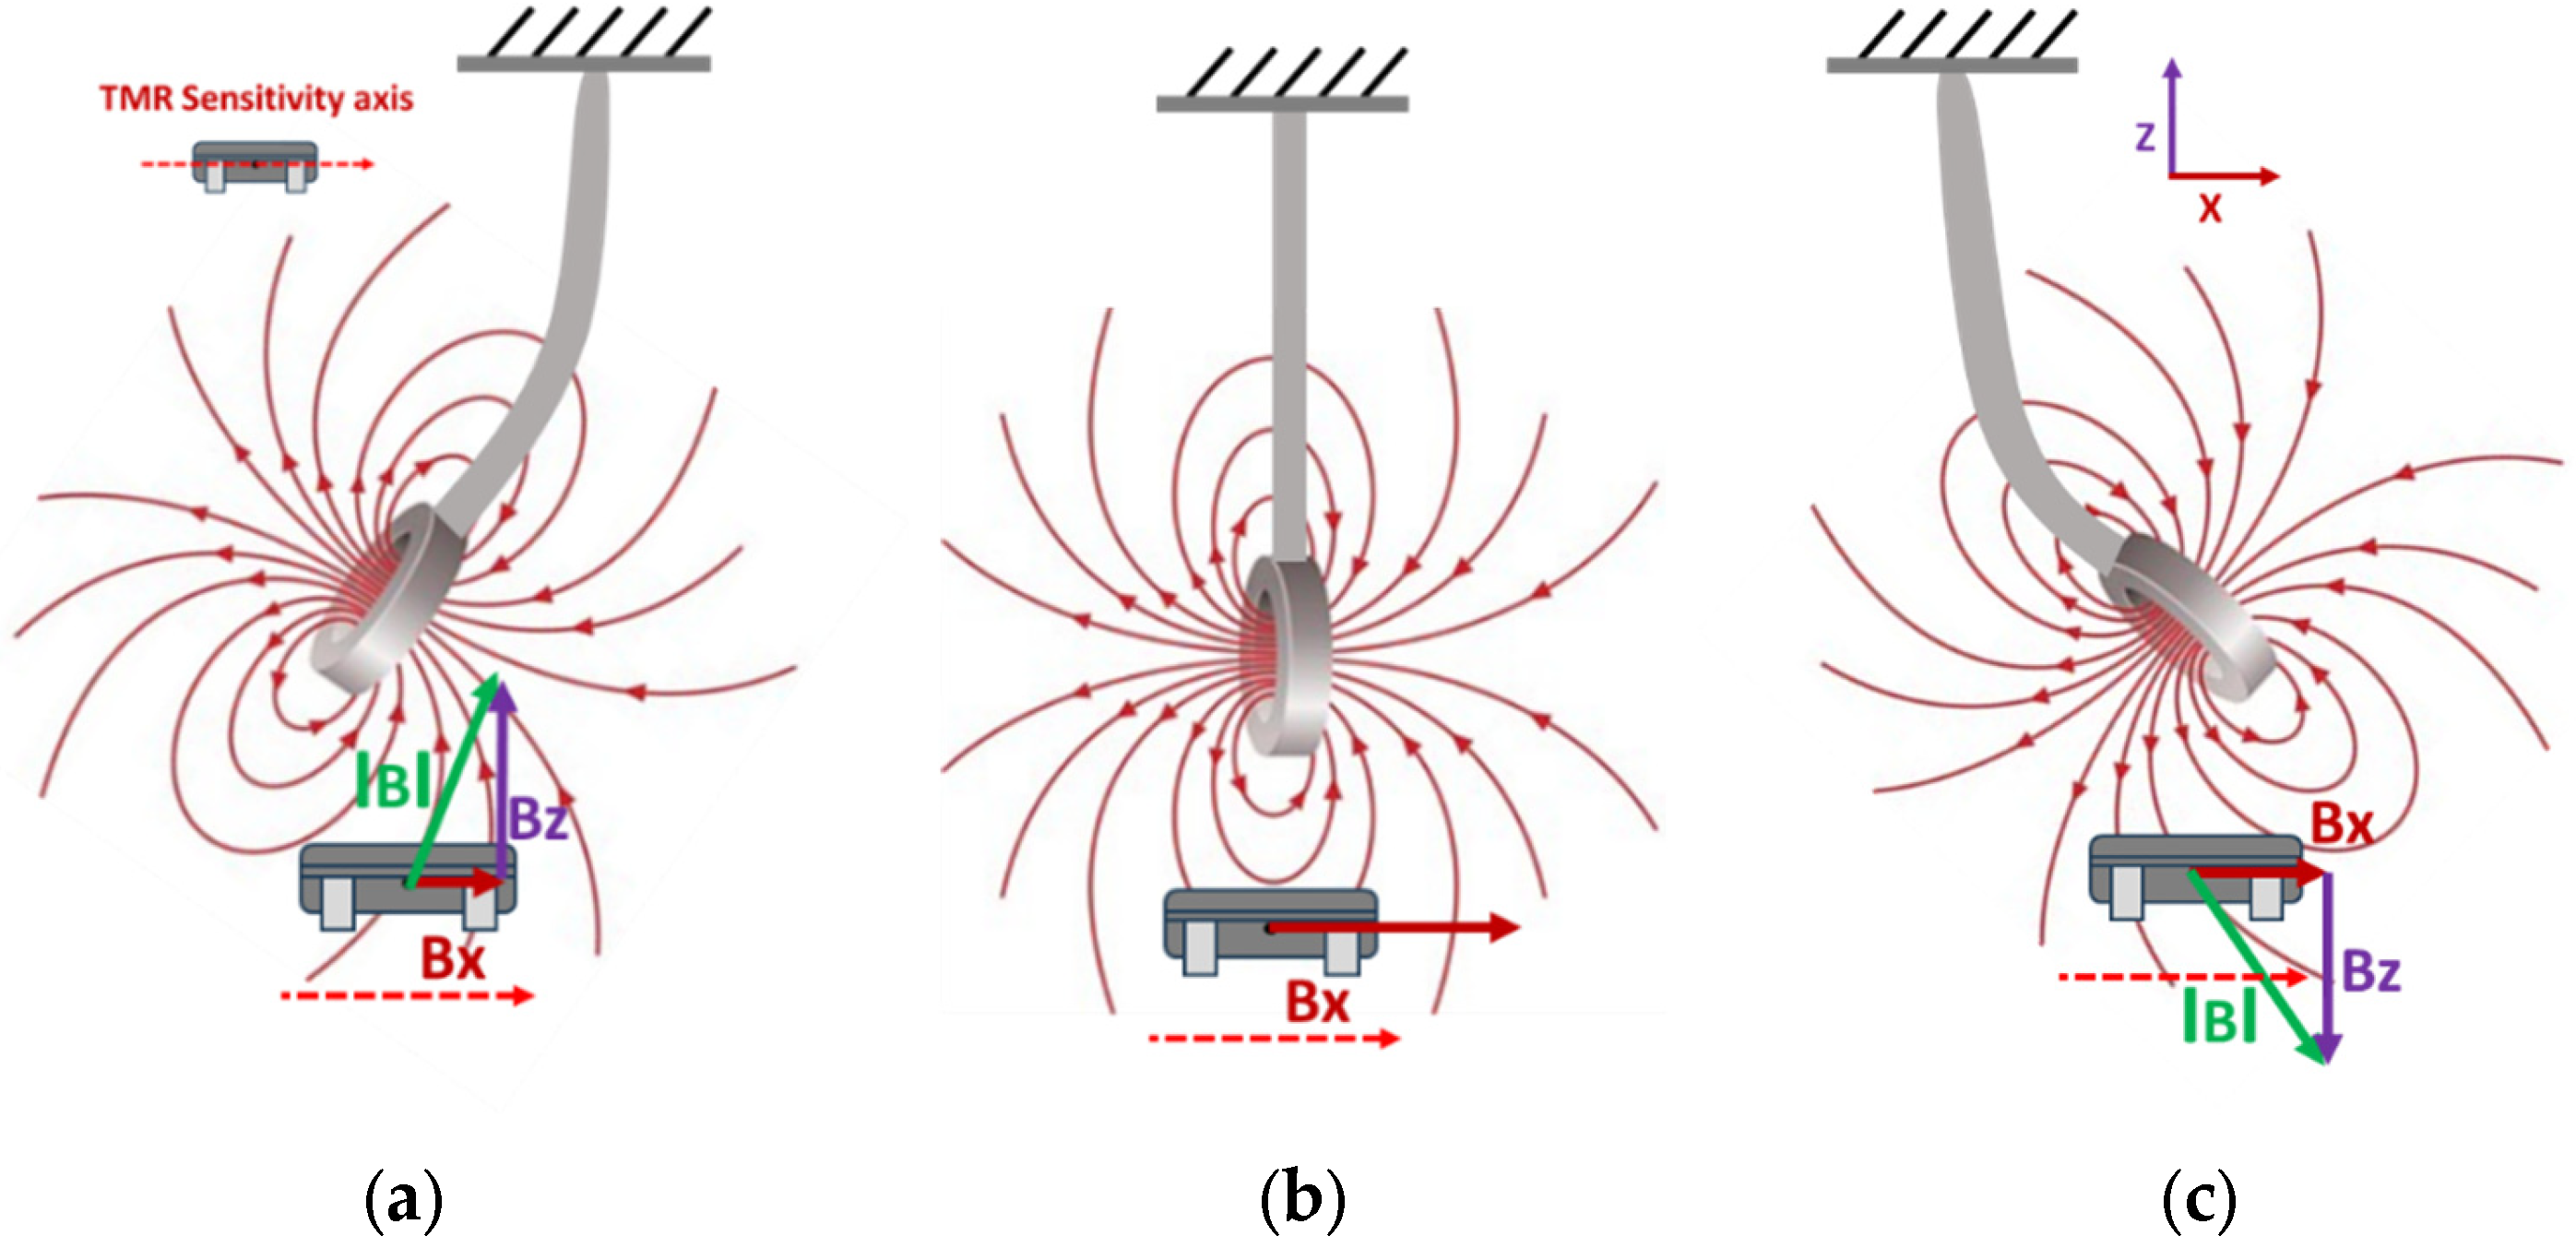
A prototype of a TMR cantilever-based flow sensor mechanism was fabricated and evaluated using a laboratory-scale flow line setup.
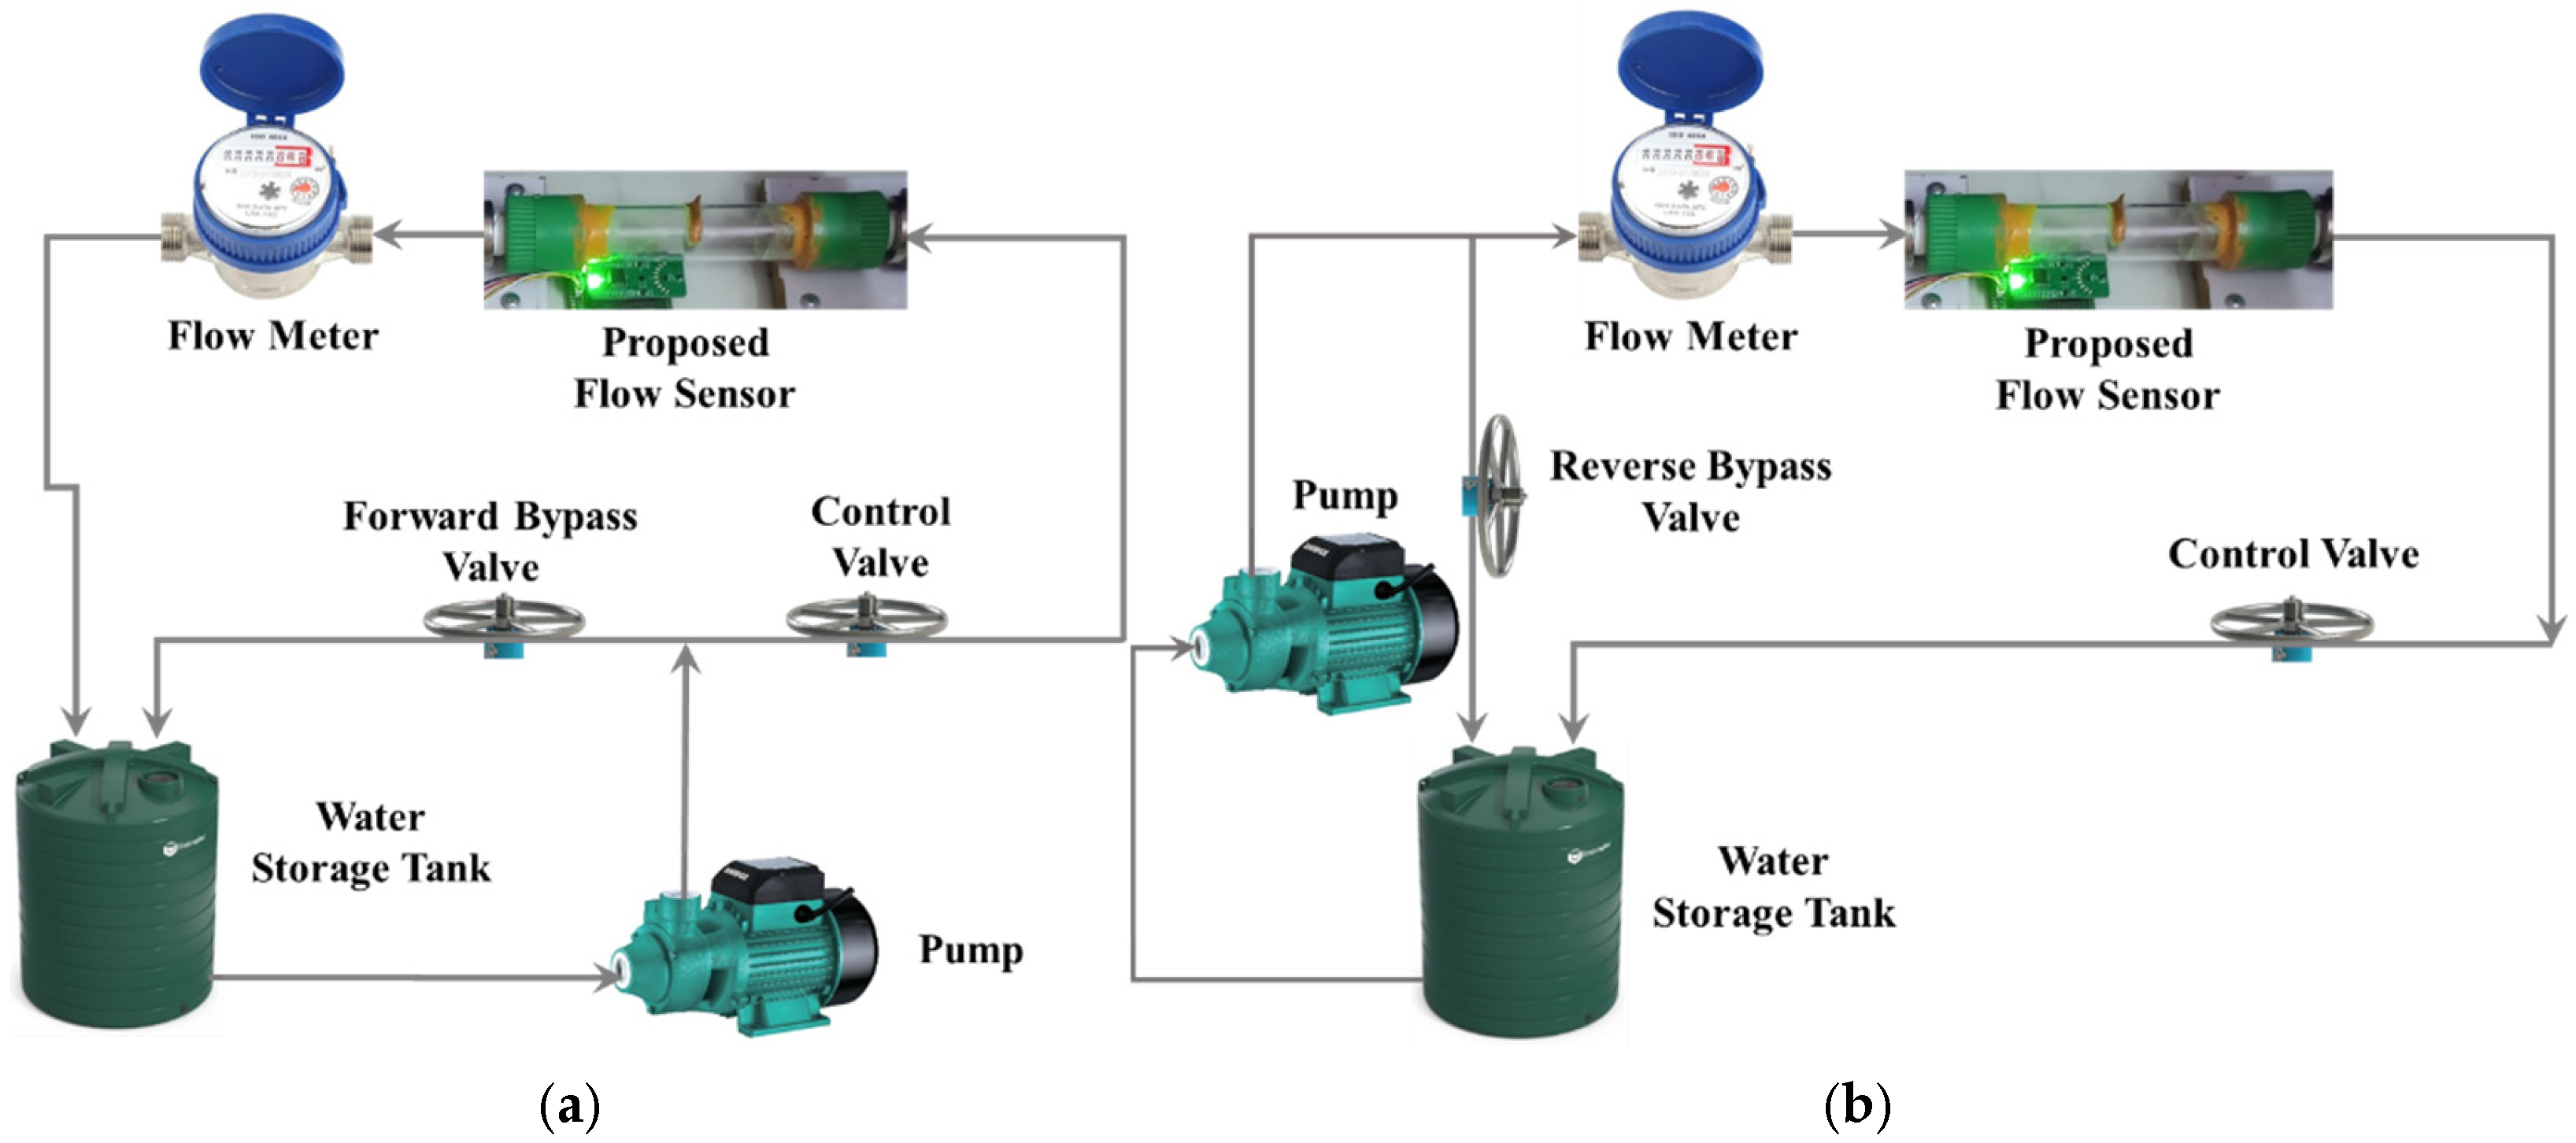
Figure 6a,b illustrate the connection representations of the experimental apparatus intended for flow sensing in both forward and reverse directions.
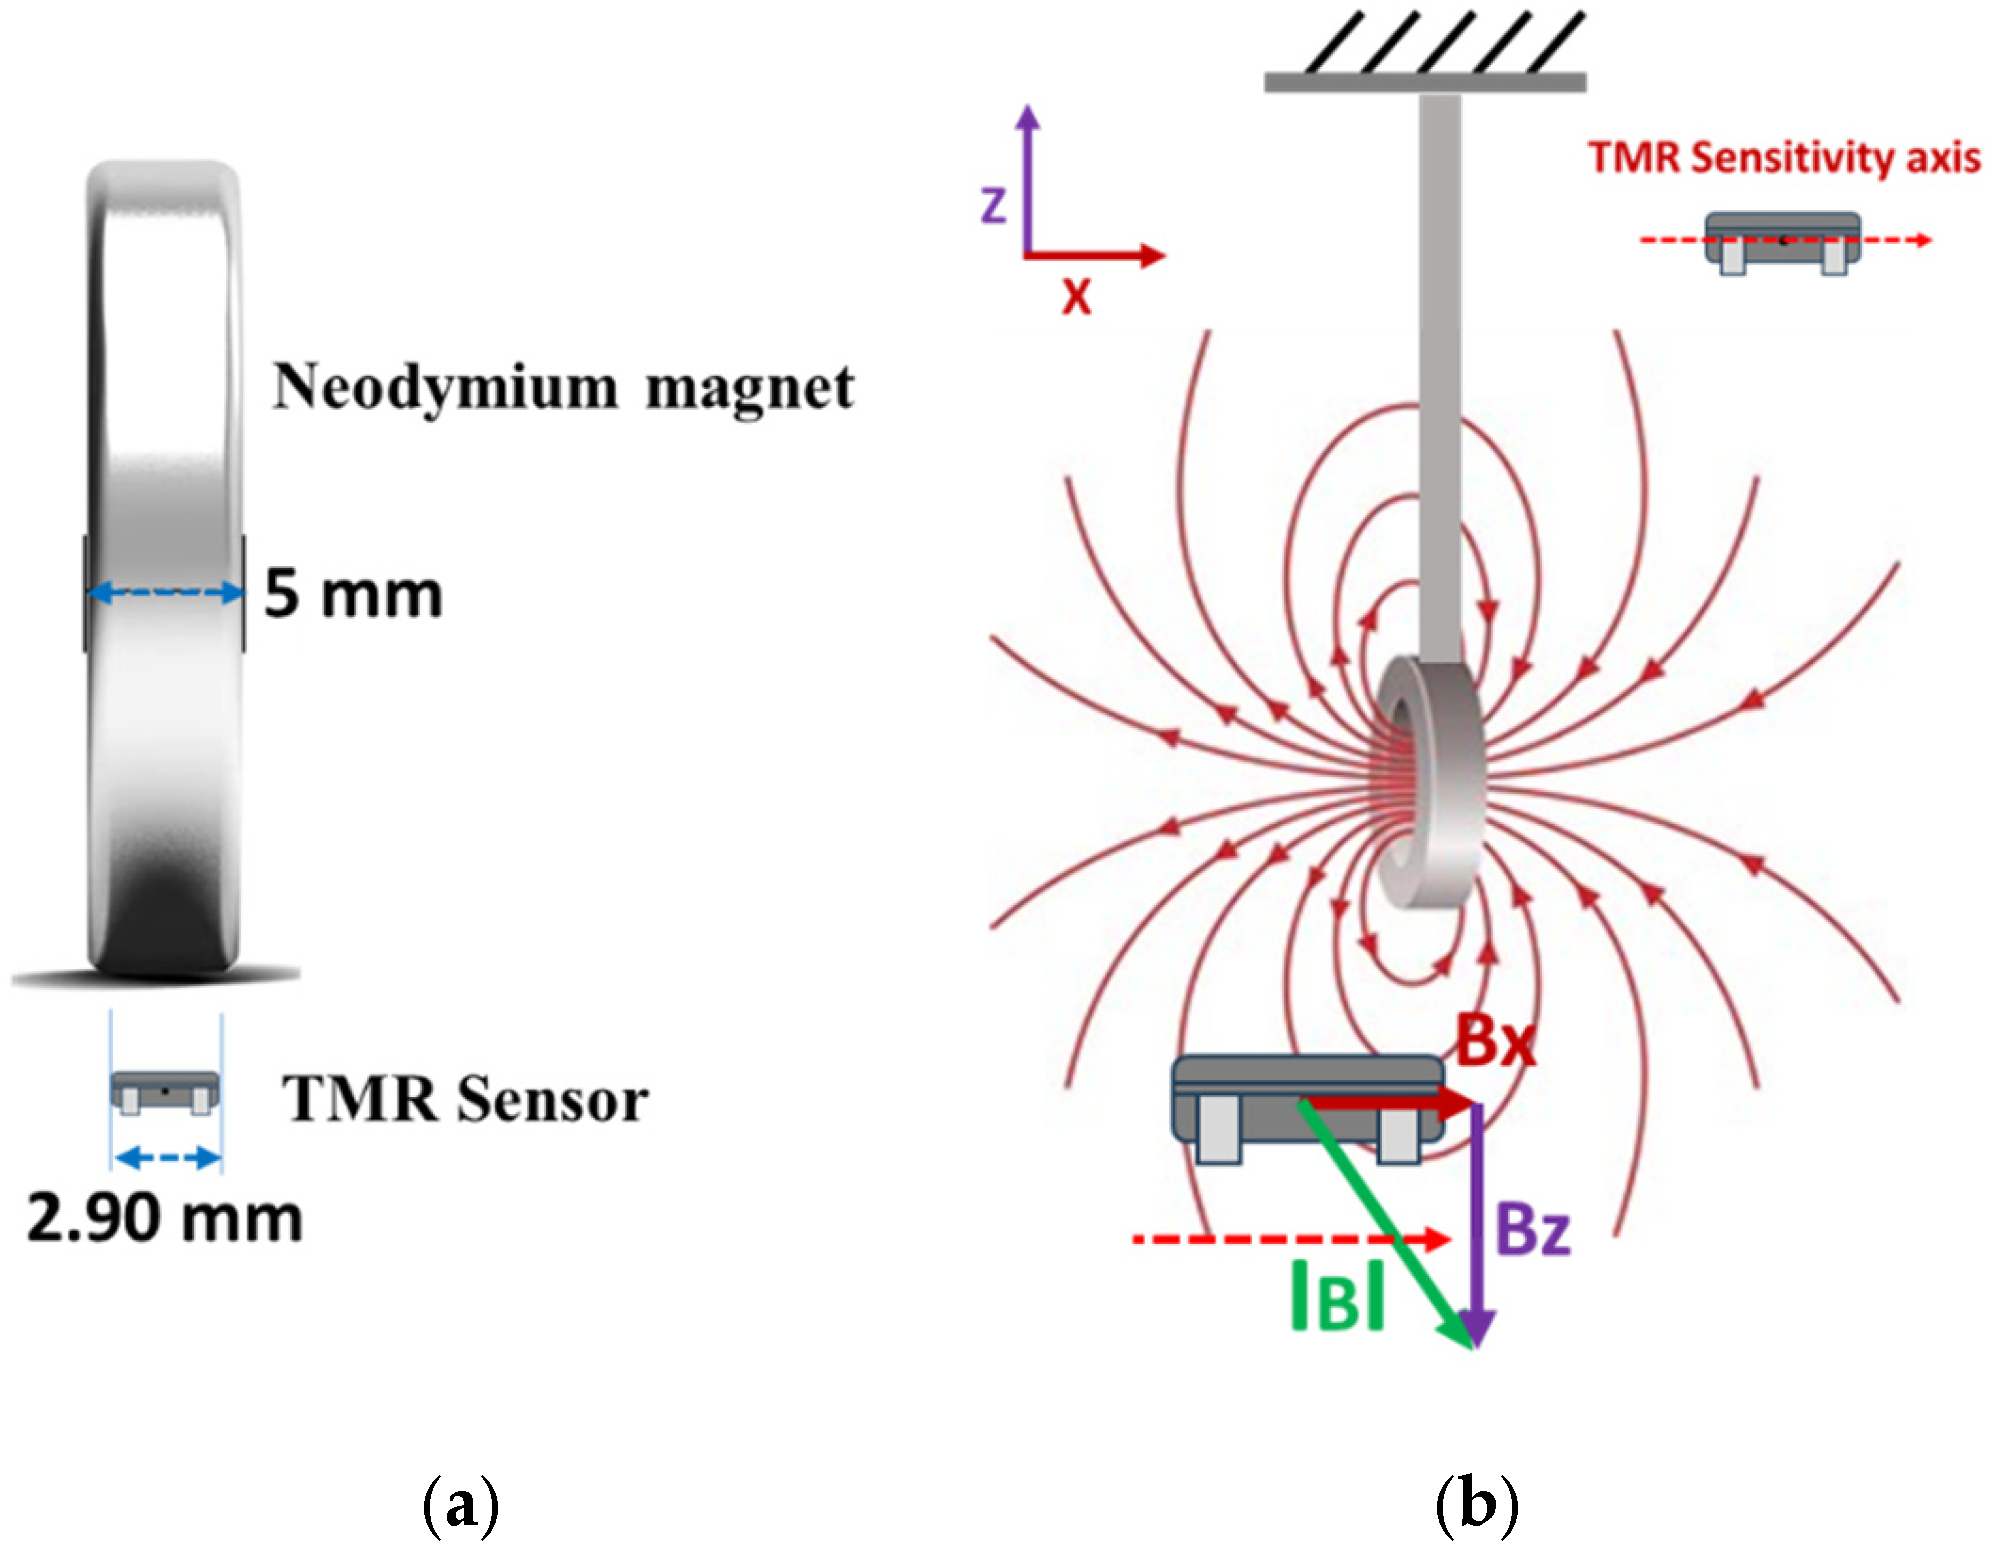
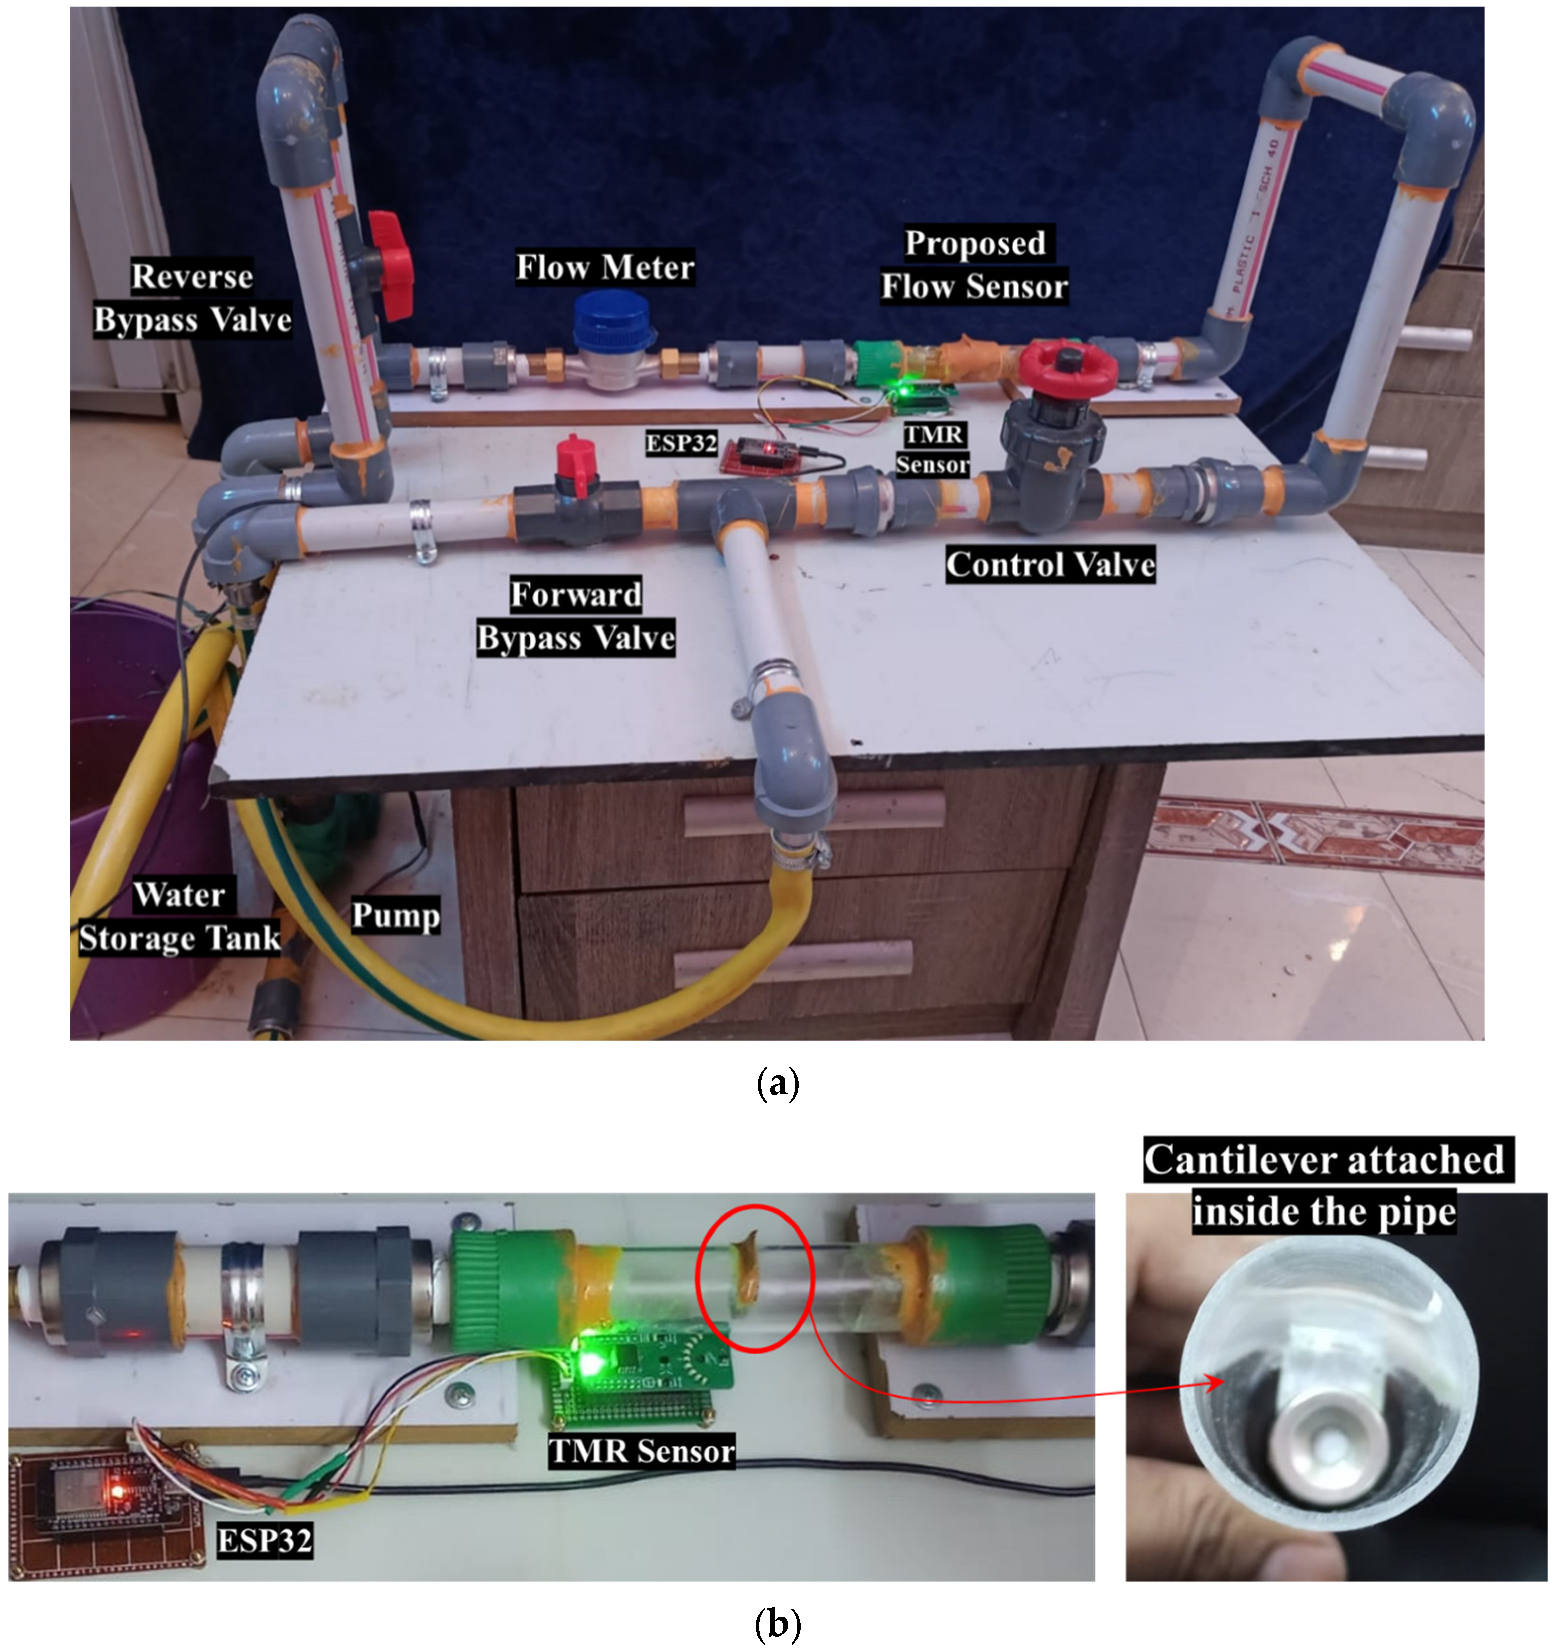
Figure 7a,b depict the experimental setup and the associated measurement unit. The experimental apparatus incorporates the bypass valves, the control valve, the prototype flow sensor, and a calibrated flowmeter, facilitating comparative analysis of the performance metrics obtained from each device. A transparent acrylic section has been integrated into the PVC pipeline to enable visual monitoring of cantilever deflection during the initial testing phase. It is important to highlight that this transparency is not essential for the operational performance of the sensor, as the TMR elements are externally mounted and compatible with a variety of non-ferrous pipe materials commonly utilized in agricultural and domestic systems, such as PVC, HDPE, and copper. Two TMR sensors are used to record the deflection and direction of the strip in the fluid flow. Forward and reverse bypass valves have been used to bypass the fluid during forward and reverse flow rate measurements. A precise control valve has been used to control the fluid flow rate. The measurement unit is composed of a stainless-steel cantilever with dimensions of 25 mm in length, 18 mm in width, and a thickness of 0.15 mm. This cantilever is securely positioned within an acrylic glass pipe section with an internal diameter of 26 mm. The sensing element has been selected as stainless steel due to its exceptional corrosion resistance properties. This material provides substantial advantages, as it is applicable in both non-corrosive and aggressive fluid environments. Furthermore, the durability of stainless steel ensures consistent and reliable performance across a range of applications. At the same time, its inert characteristics preclude any possibility of water contamination, rendering it an optimal choice for deployment in aquatic settings. A magnet is securely mounted at the free end of the cantilever, as illustrated in
Figure 8a. The specific type of magnet employed in this setup is an N35 round disc neodymium (NdFeB) magnet with a countersunk hole. Countersunk-hole pot magnets are constructed from premium rare earth materials, offering a temperature resistance of up to 80 °C (176 °F) (refer to
Figure 8b). These magnets are enhanced by a sophisticated three-layer Ni + Cu + Ni plating process, which significantly improves their resistance to rust and corrosion and reduces brittleness [
22]. This results in neodymium magnets that exhibit greater strength and durability. The specifications are as follows: the magnets have a diameter of 20 mm, a thickness of 5 mm, and a central hole of 5 mm in diameter, as illustrated in
Figure 8c. The north and south magnetic poles are oriented on the flat surfaces.
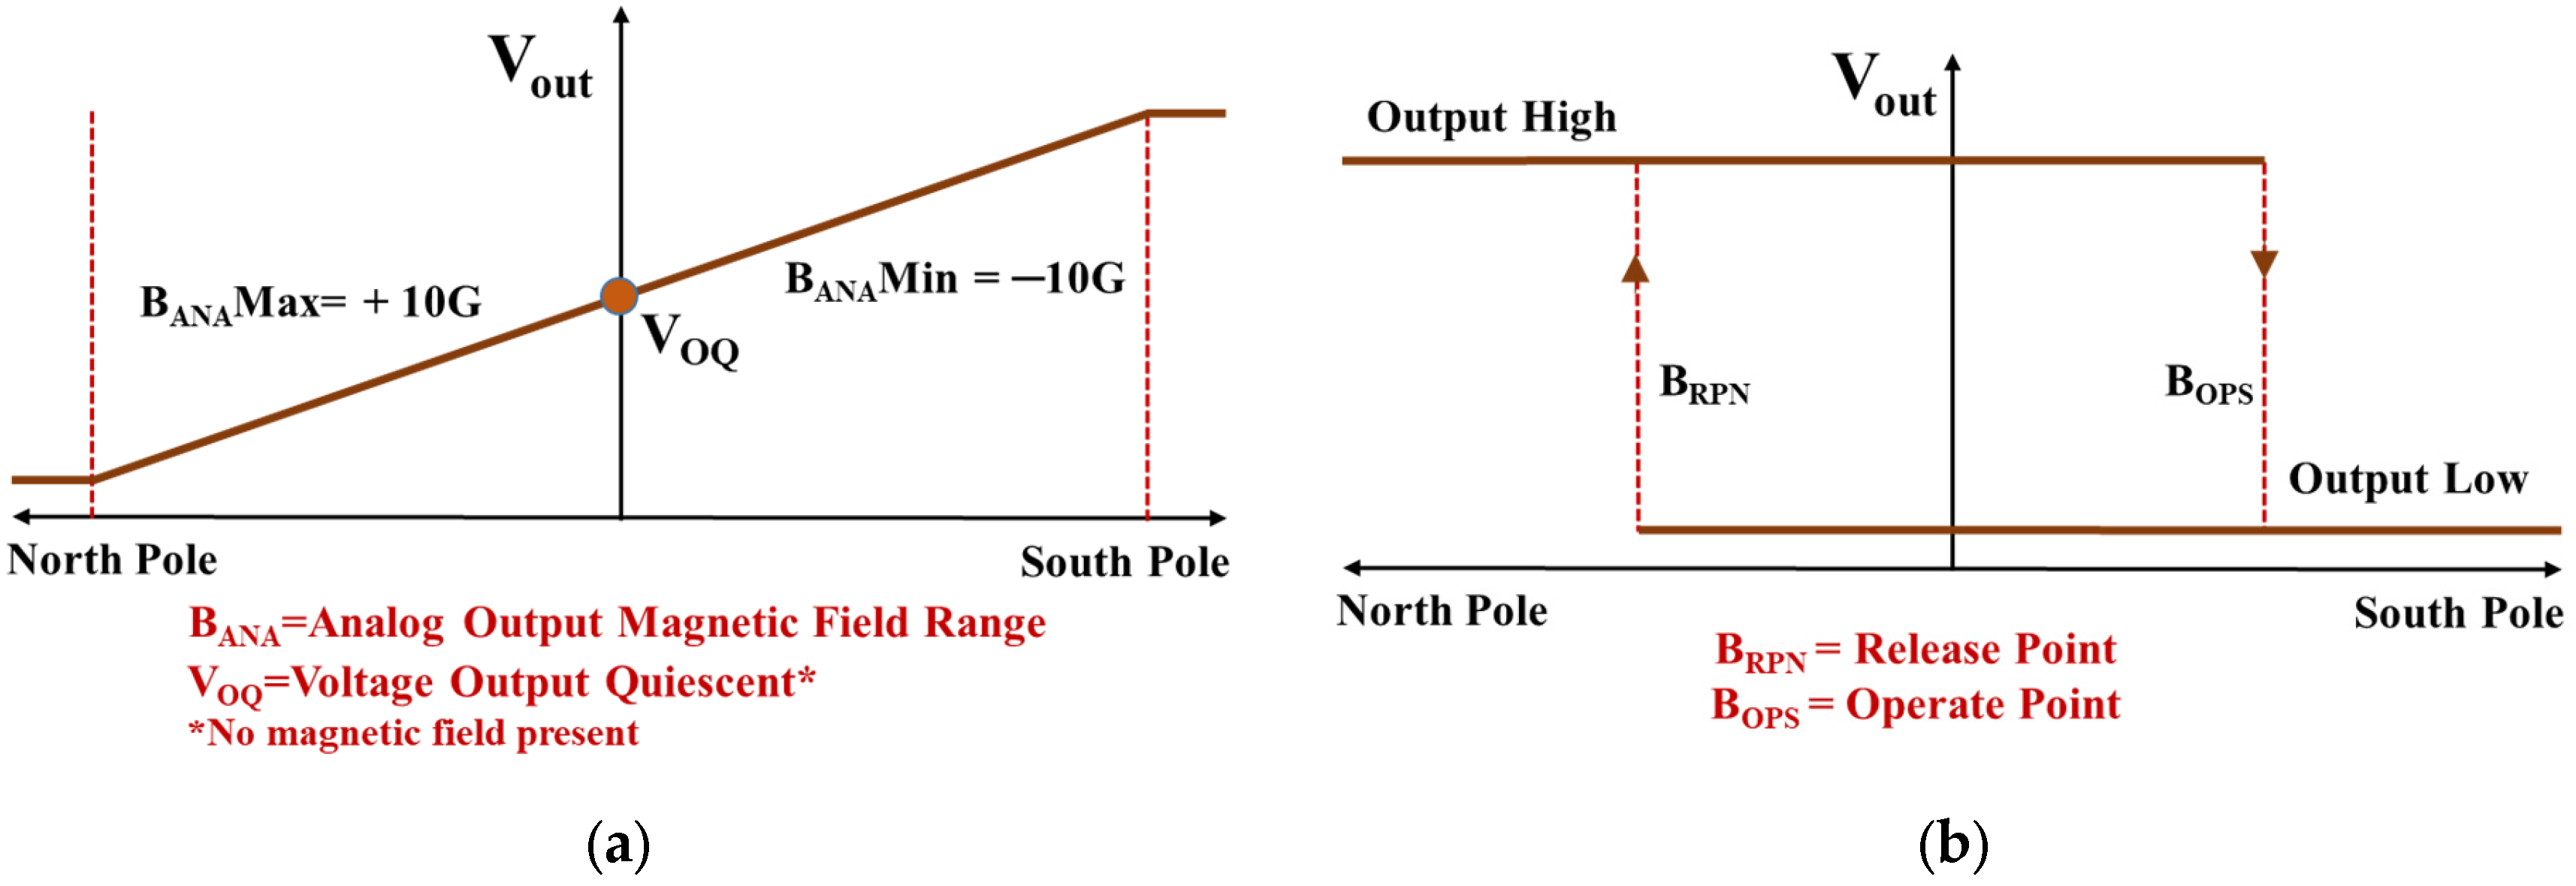
The outputs from all sensors are accessible through mikroBUS I/O or analog pins. An ESP32 board was used to collect the analog voltage from the RR111-1DC2-331 and the digital output from the RR121-3C63-311 sensors, thereby facilitating accurate measurement, calibration, data logging, and analysis of the cantilever’s deflection.
A first-order RC low-pass filter (R = 47 kΩ, C = 100 pF, fc ≈ 34 kHz) was used primarily for RF noise suppression on the analog line prior to the ESP32’s internal ADC, which was sampled at 500 Hz. Software averaging was applied to mitigate low-frequency ADC noise. This configuration effectively stabilized the DC measurement for steady-state calibration. Capturing high-speed transients would require a different filter and ADC architecture, as discussed in the limitations.
The output from the calibrated flow meter, which was considered the true flow rate, was recorded simultaneously with the help of the ESP32 board.
5.1. Sensing of Flow
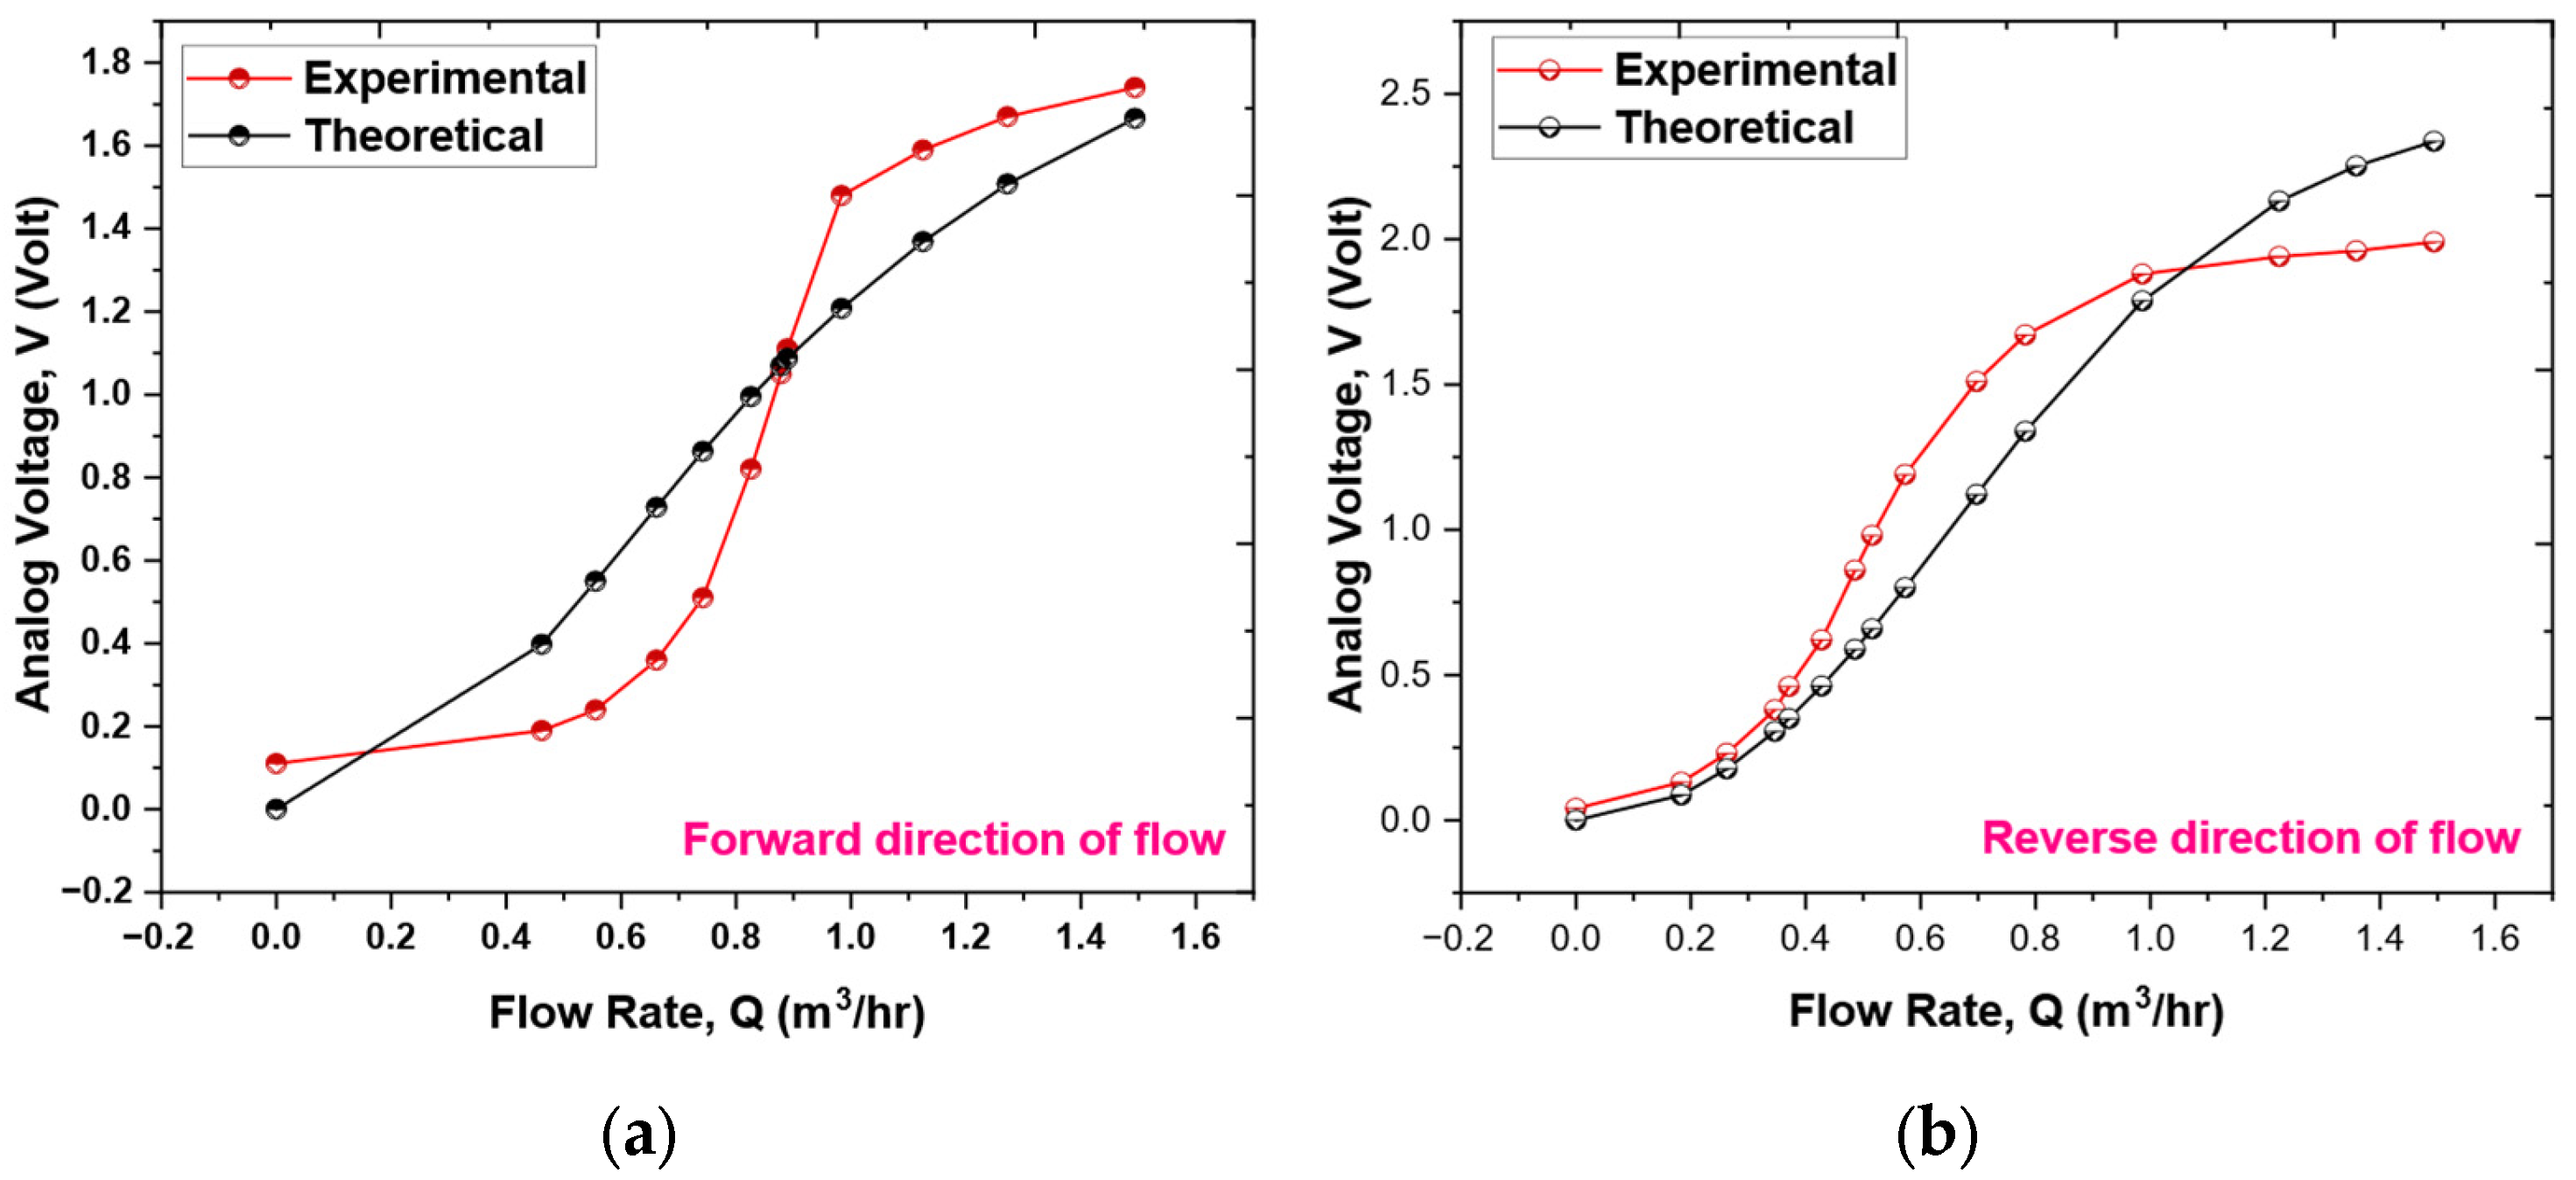
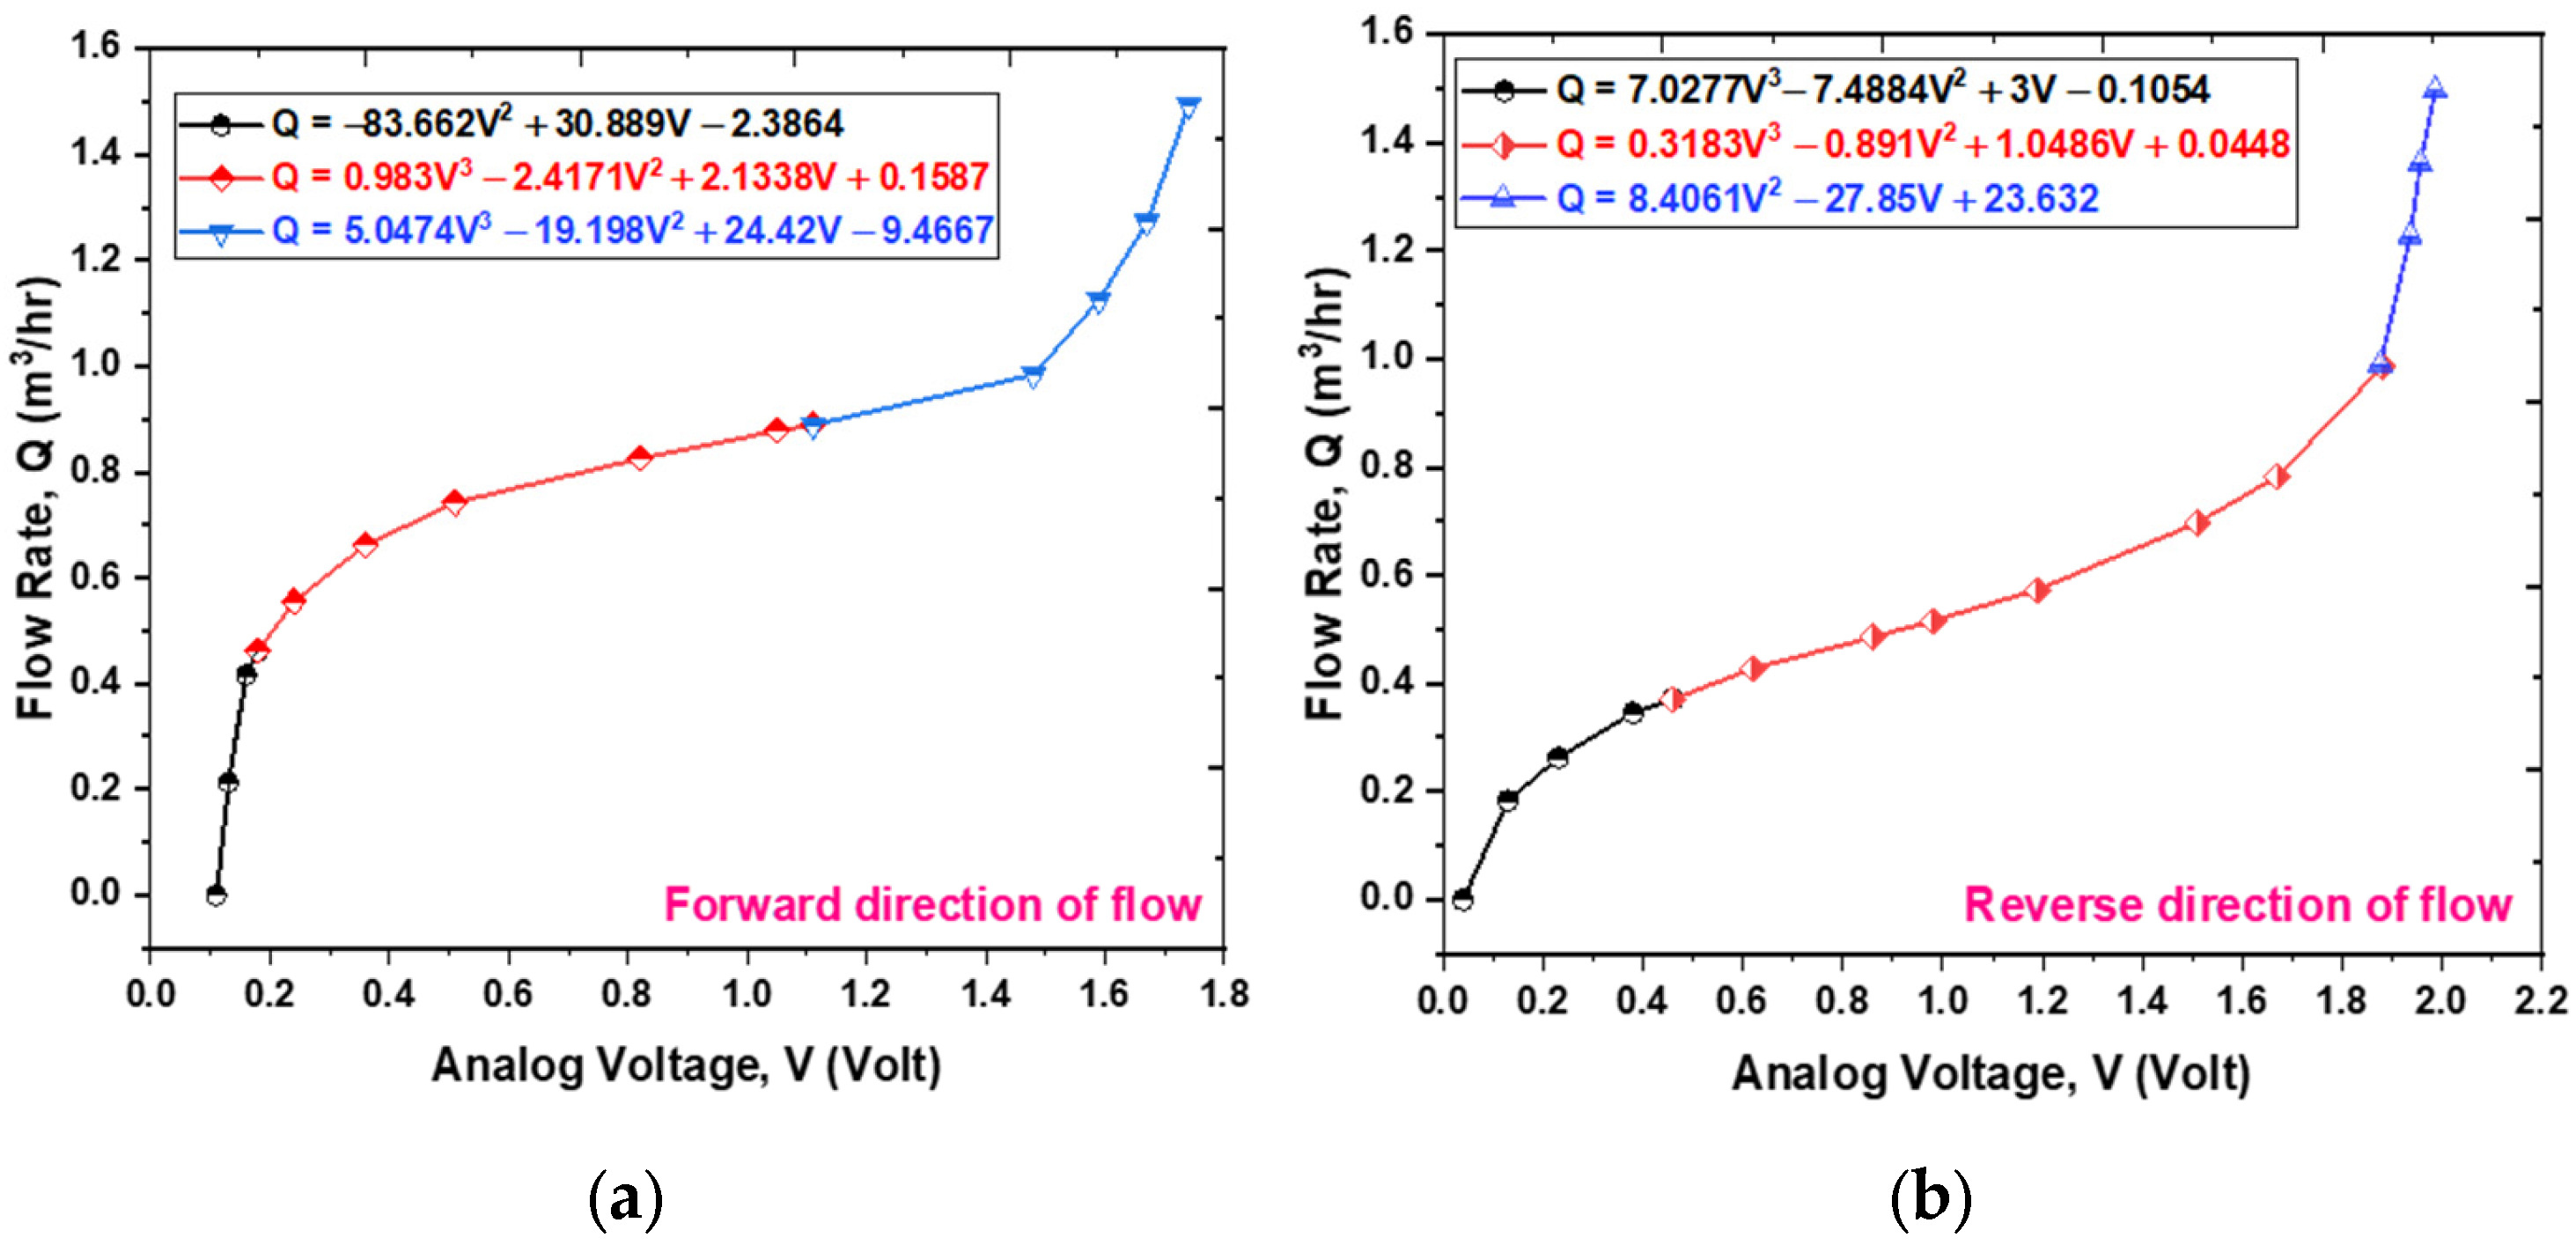
Figure 10a,b illustrate the outcomes of testing the prototype sensor. This research involved assessing the sensor’s performance in both forward and reverse flow directions within the pipeline. The analog TMR sensor produces an analog voltage that corresponds to the cantilever’s deflection in each flow direction. As shown in
Figure 10, the voltage rises when the cantilever starts to deflect, particularly at initial flow rates, due to variations in the magnetic field. The voltage variation across the entire scale is non-linear. The non-linear relationship between voltage and flow, as indicated in
Figure 10, is a fundamental characteristic of the sensing mechanism, as anticipated by the mathematical model detailed in
Section 3. As expressed in Equation (9), the correlation between voltage (V) and flow rate (Q) is inherently non-linear.
Within the response curve, two regions of reduced sensitivity are identifiable. First, at low flow rates (around 0–0.5 m3/h), sensitivity is limited due to a combination of the cantilever’s rigidity and the shift in flow regime. Below a flow rate of roughly 0.3 m3/h (Re < 4000), the flow changes to a transitional state before becoming laminar. In a laminar flow, the drag force is directly related to velocity (f ∝ v) rather than being proportional to the square of the velocity (f ∝ v2), and the velocity distribution is parabolic instead of uniform. This results in a force on the cantilever that is lower than expected for a specified flow rate, making it more challenging to achieve significant deflection. Second, at higher flow rates (approximately 1–1.5 m3/h), sensitivity diminishes as the cantilever nears its maximum deflection. It is crucial to differentiate between two phenomena: (i) The ‘soft’ saturation described in Equation (9), where the fluid dynamic force component that contributes to further bending reduces as the cantilever aligns with the flow. (ii) A ‘hard’ structural saturation point, which is not specifically modeled, at which the cantilever’s deflection gets close to the material’s yield strength, beyond which plastic deformation may happen. The operational range of 0–1.5 m3/h is intended to stay well within the elastic deformation limits of the cantilever.
Despite this inherent non-linearity, the sensor remains highly effective across the entire specified range. The subsequent subsection outlines the development of calibration models that successfully linearize this relationship, ensuring precise flow rate measurements.
The theoretical behavior detailed in Equation (9) can be effectively understood by examining its asymptotic properties. In scenarios where Q is significantly less than 1 m
3/h, the term
Q4 becomes inconsequential, resulting in a simplified relationship where voltage V is proportional to the square of the flow rate
Q. This indicates a quadratic increase in voltage corresponding to the flow rate. Conversely, in cases where
Q exceeds 1 m
3/h, the relationship adjusts to reveal that voltage V is proportional to |B|, thereby demonstrating saturation where the output voltage stabilizes and becomes unresponsive to additional increments in flow rate. This anticipated behavior, characterized by an initial quadratic rise followed by saturation, closely aligns with the general profile of the measured sensor output, as illustrated in
Figure 10.
5.2. Calibration Model and Results
Utilizing the experimental data, which consists of 12 data points for forward flow and 15 for reverse flow [
24], three calibration models were developed to correlate the fluid flow rate (derived from the reference flowmeter) to the analog voltage of the TMR sensor, as depicted in
Figure 11a,b. The selection of the calibration dataset size was informed by the need to strike a balance between statistical rigor and the constraints of practical experimentation. The highly deterministic and repeatable characteristics of the cantilever’s response to flow rate yield a high signal-to-noise ratio. Such attributes facilitate a robust characterization of the system’s behavior with a minimized dataset, thereby mitigating the risk of overfitting while effectively capturing the non-linear dynamics of the response.
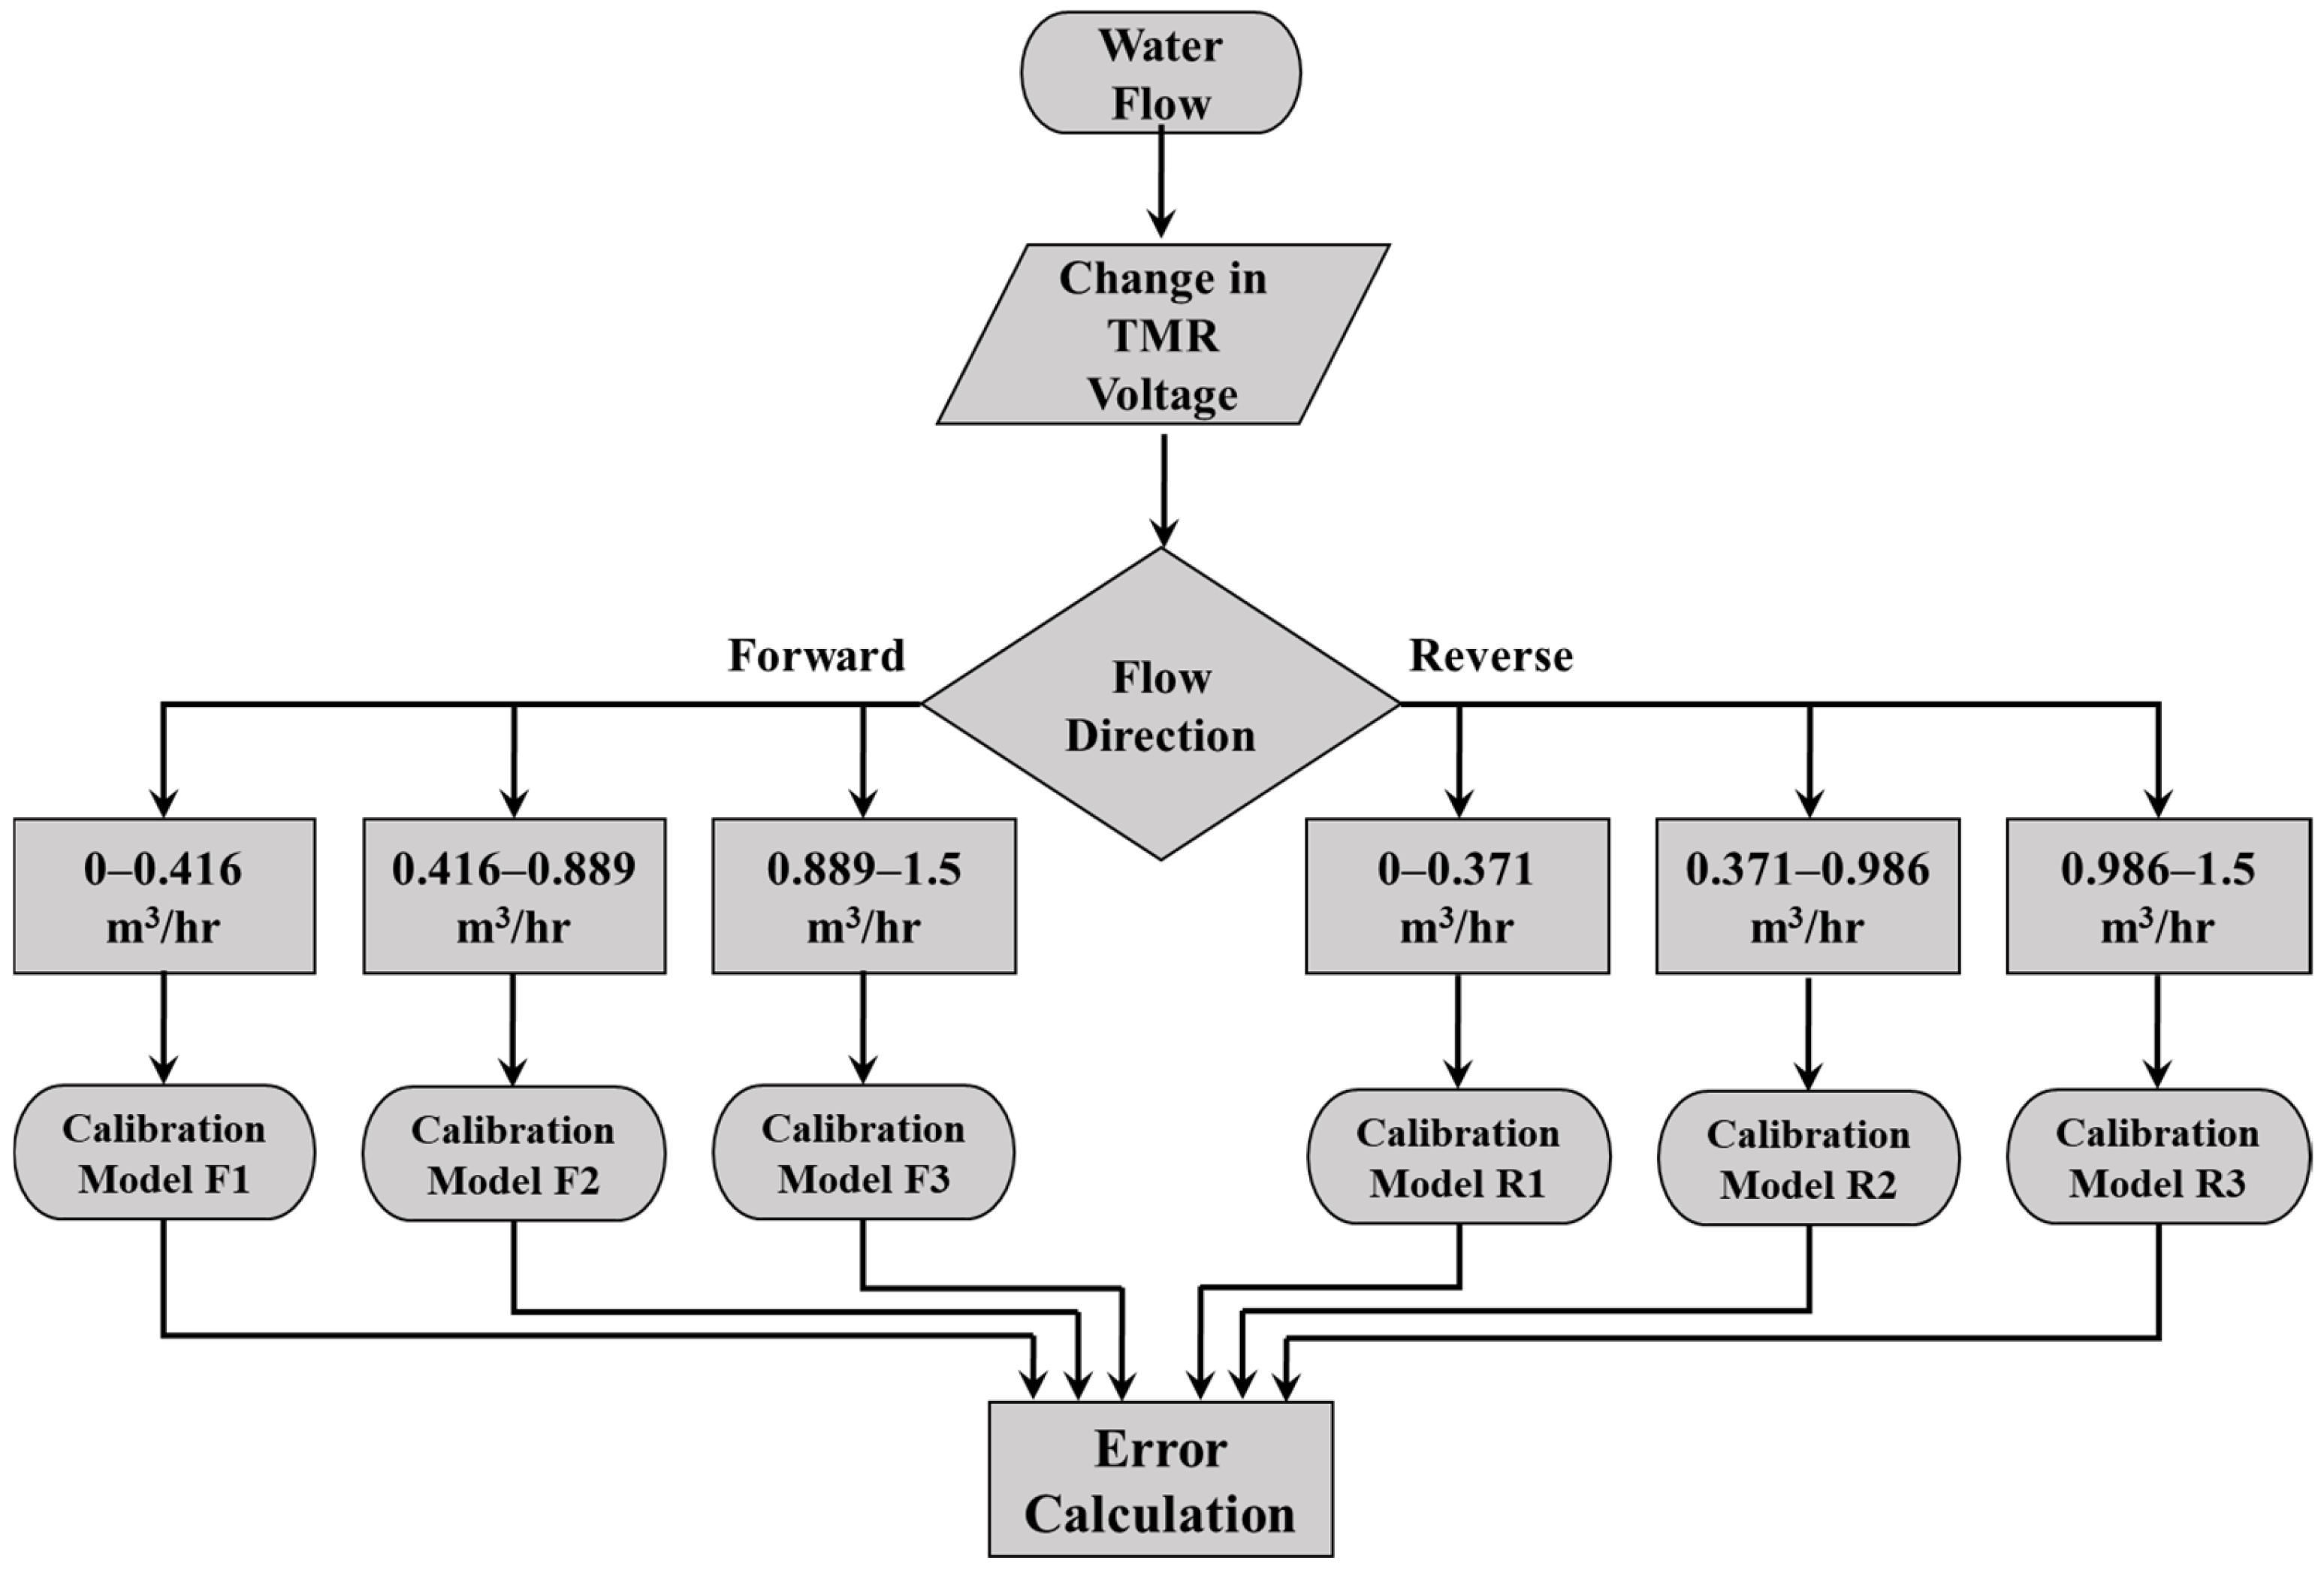
Figure 12 presents a flowchart that delineates the selection process for these calibration models. The mathematical relationships are established through the least-squares method, which identifies the best-fit curve by minimizing the sum of squared errors for each data point. For further details regarding the calibration models applicable to both forward and reverse flow directions, please consult
Table 2,
Table 3,
Table 4,
Table 5,
Table 6 and
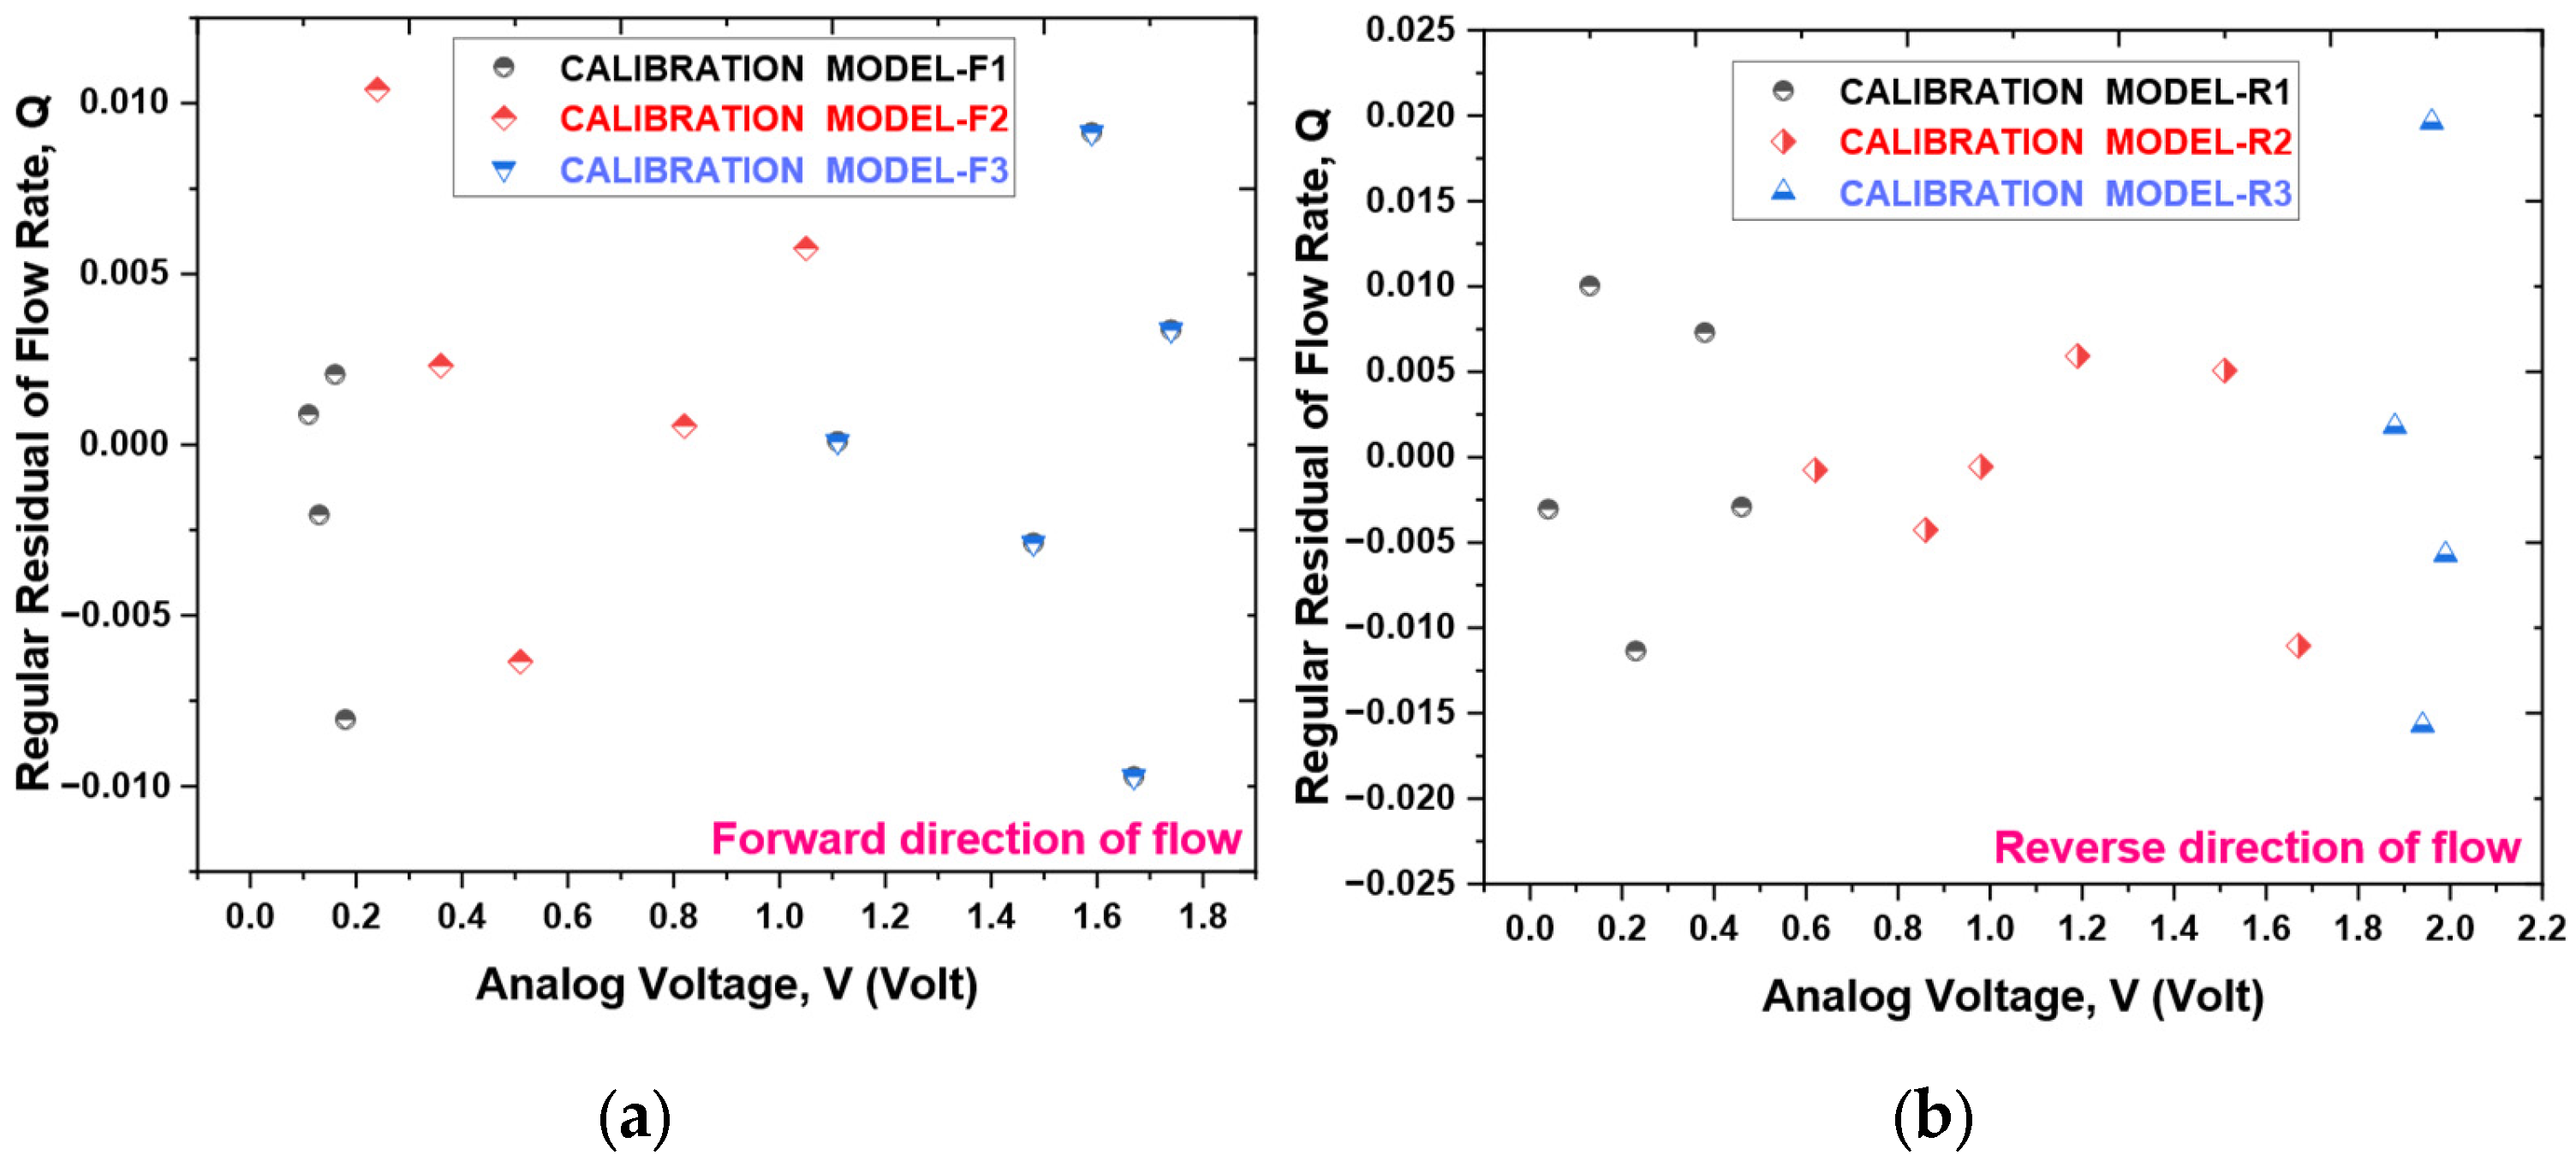
Table 7. To validate the proposed model, a residuals plots are shown in
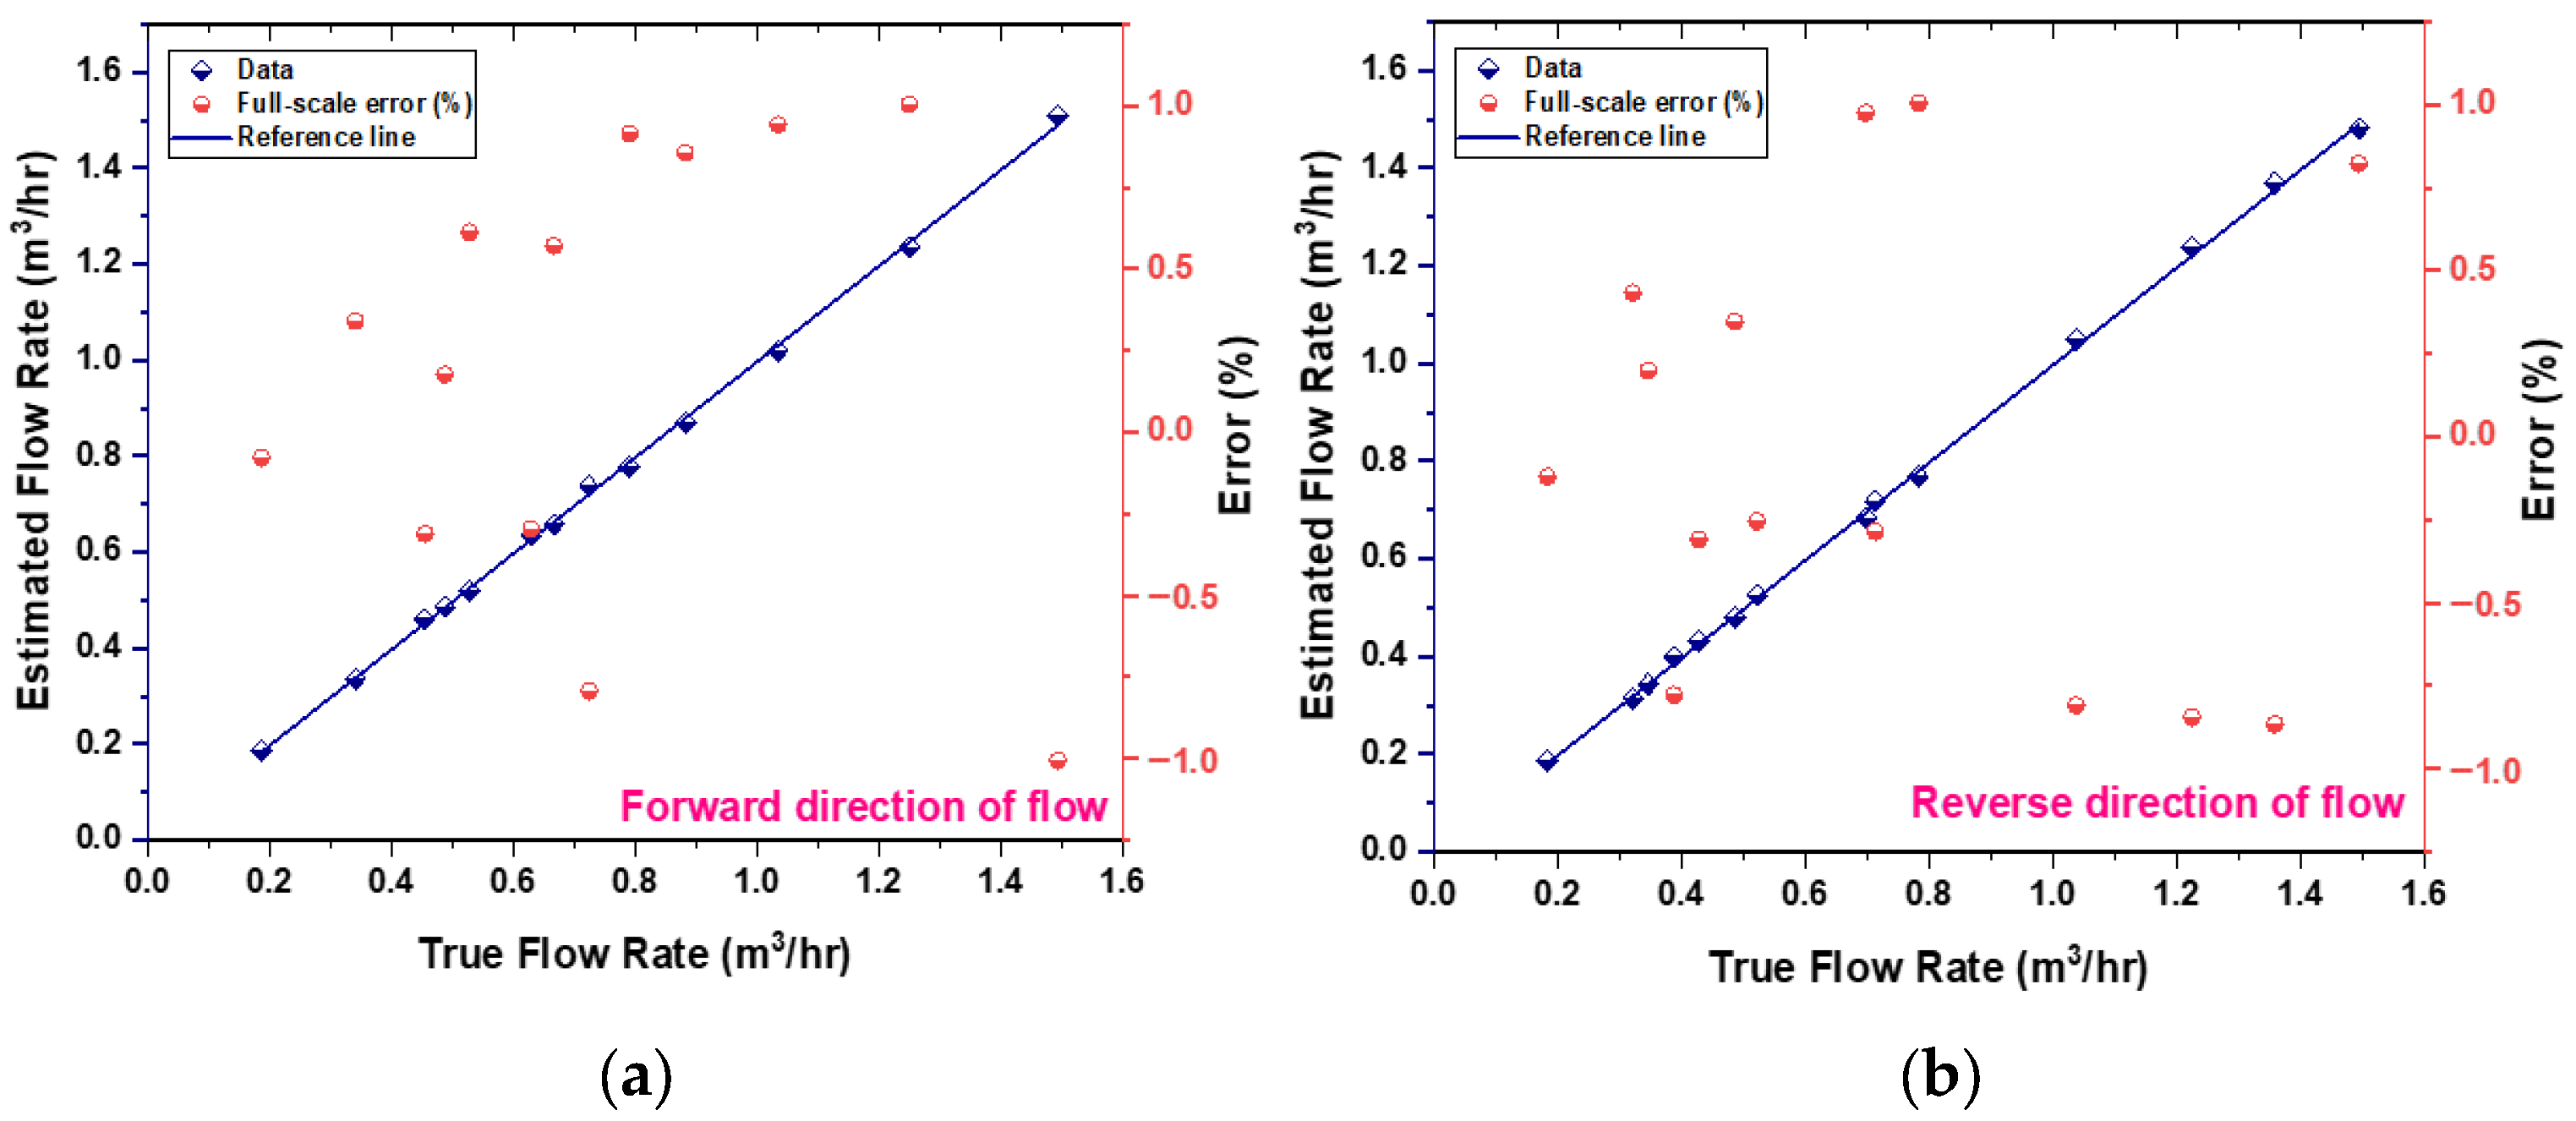
Figure 13. The sensor prototype computes flow rates via these calibrated equations embedded within the ESP32 microcontroller board. A comparison of the estimated flow rate with the actual flow measured by the reference flowmeter is illustrated in
Figure 14, which additionally displays the percentage error for each data point in the final output. The prototype sensor attains an accuracy level of less than 1% of full scale for both forward and reverse flow readings.
The chosen dataset size is further validated by the exceptional precision of the models generated, as evidenced by the notably low standard errors of the coefficient estimates (refer to
Table 2,
Table 3,
Table 4,
Table 5,
Table 6 and
Table 7) and the resultant accuracy exceeding 1.0% FS across the entire operational range, as illustrated in
Figure 14. The data points were judiciously distributed to ensure comprehensive representation of the entire flow range, with particular emphasis on the lower-sensitivity regions near both the minimum and maximum deflection.
To ensure that the selected data size is adequate, a statistical power analysis was conducted, and the results are summarized in
Table 8. The power analysis indicates that the available dataset is sufficient for developing a precise calibration model, as the correlation between voltage and flow rate is exceptionally strong (R
2 > 0.999). Additionally, a significant signal can be reliably detected even with a limited amount of data. Additionally, the low-flow calibration’s strength is further supported by a noise analysis, which identified a minimum detectable flow of 0.00144 m
3/h (3σ, τ = 1200 s). This indicates a detection ability that is almost two orders of magnitude under the usual operational threshold of 0.1 m
3/h.
Key parameters such as response time, recovery time, repeatability, and hysteresis are crucial for ensuring the sensor performs reliably and resiliently in real-world applications.
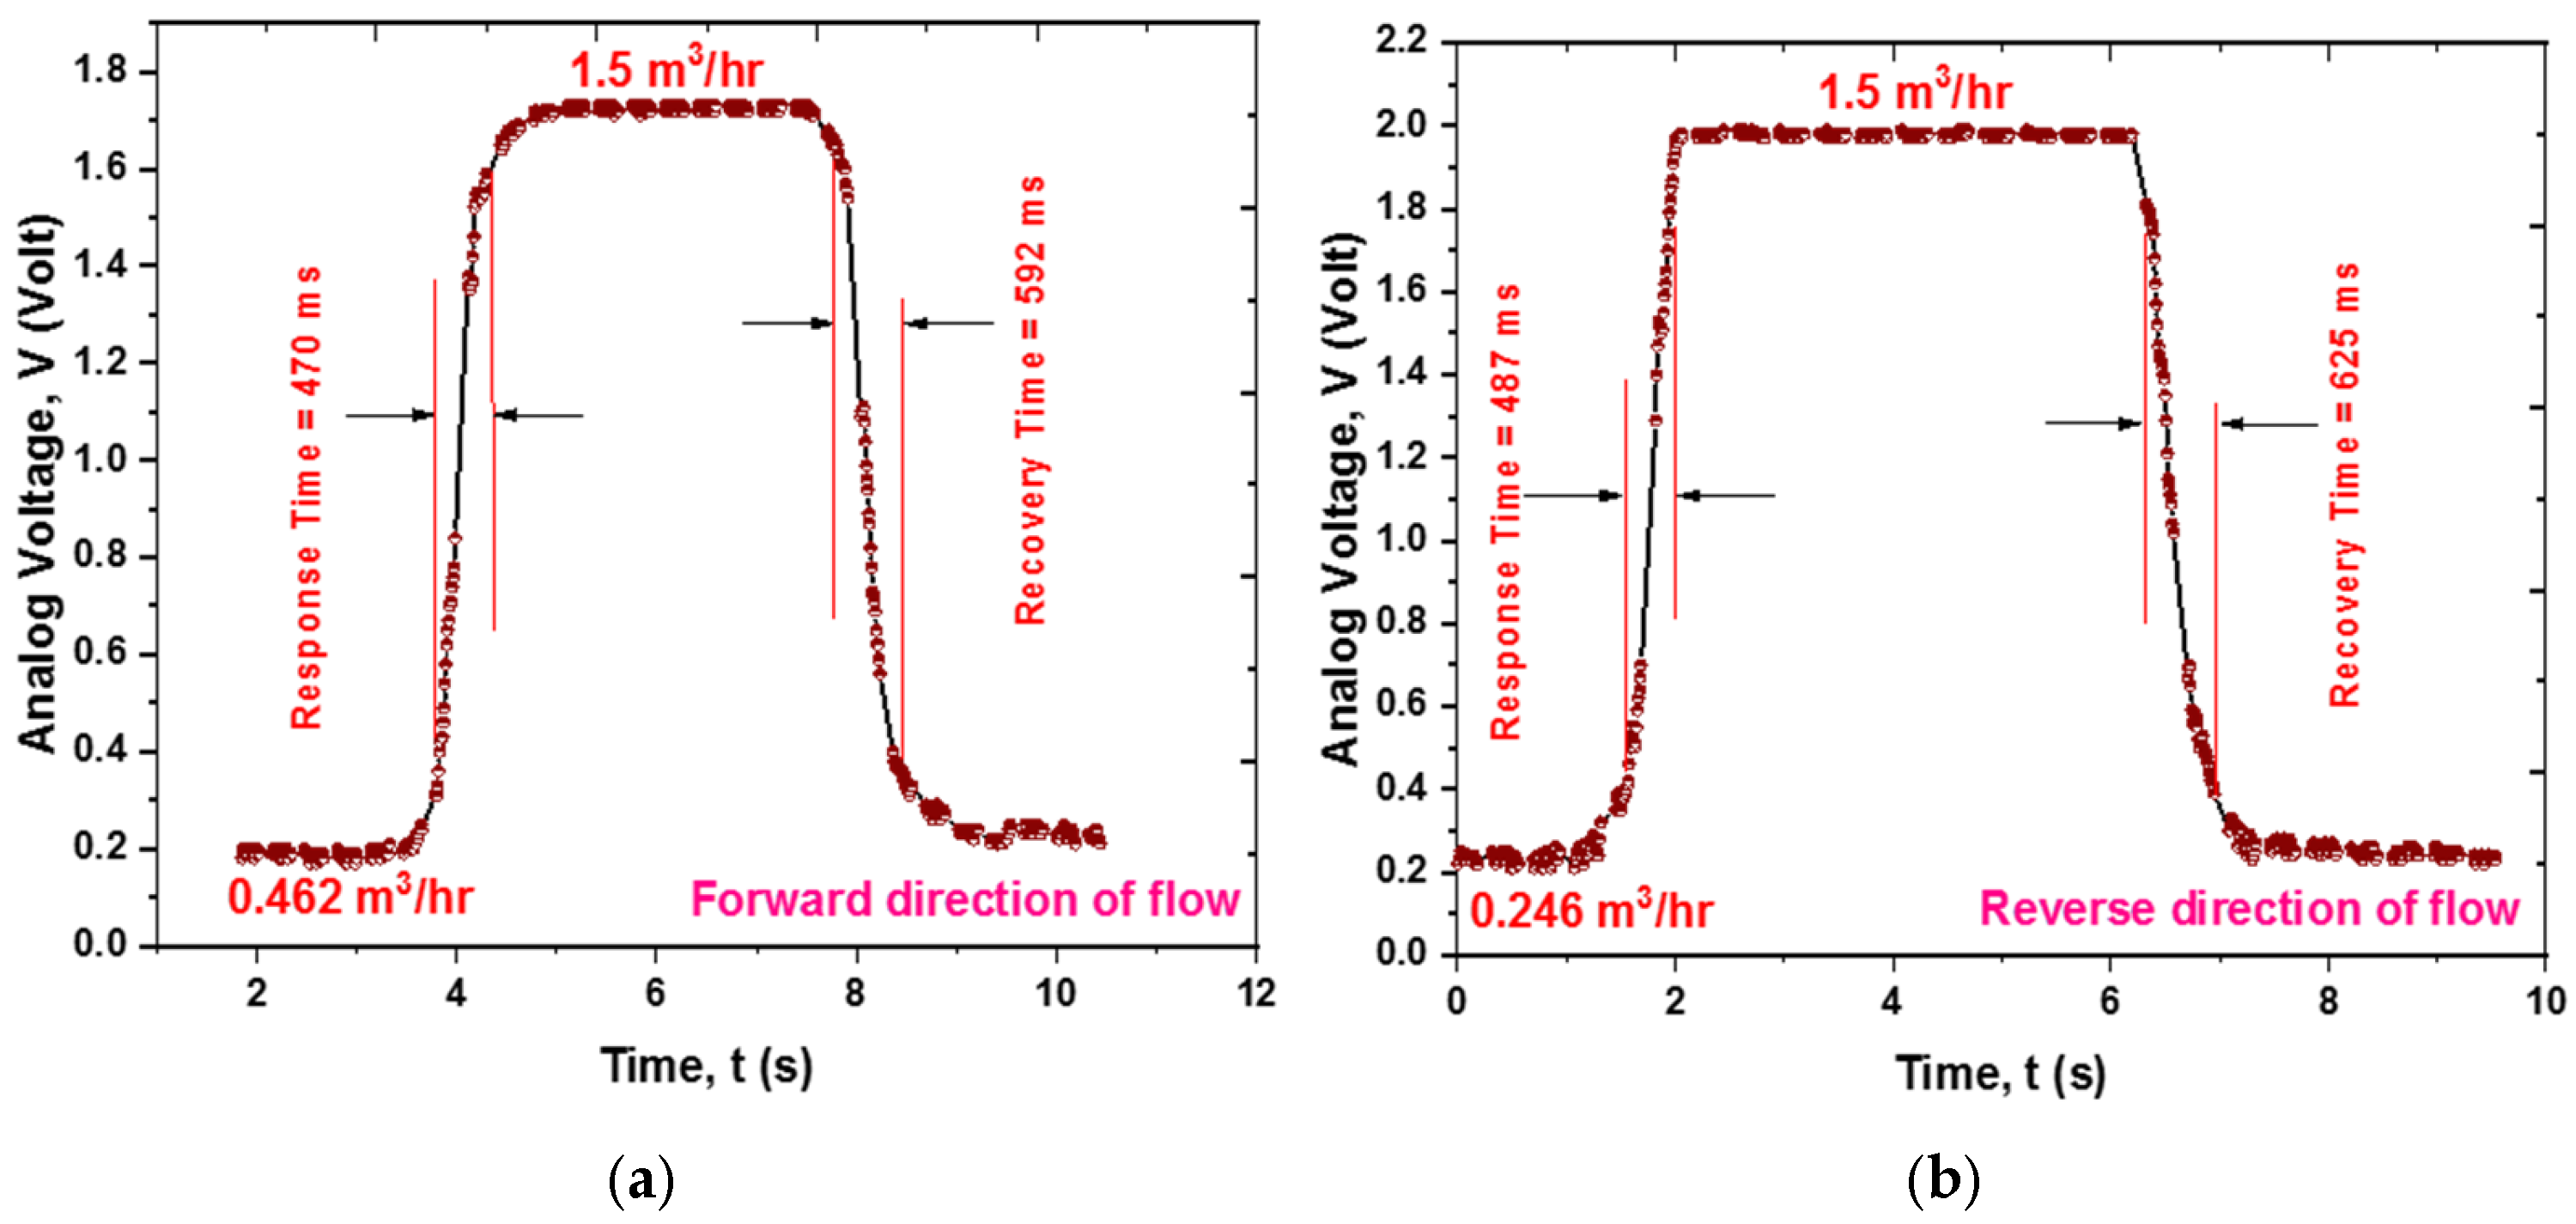
Figure 15a,b depict the transient response curves for a forward flow change of 1.038 m
3/h and 1.254 m
3/h in the reverse direction. The sensor exhibits response times of approximately 470 ms and recovery times of about 592 ms, while for reverse flow, the response and recovery times are roughly 487 ms and 625 ms, respectively.
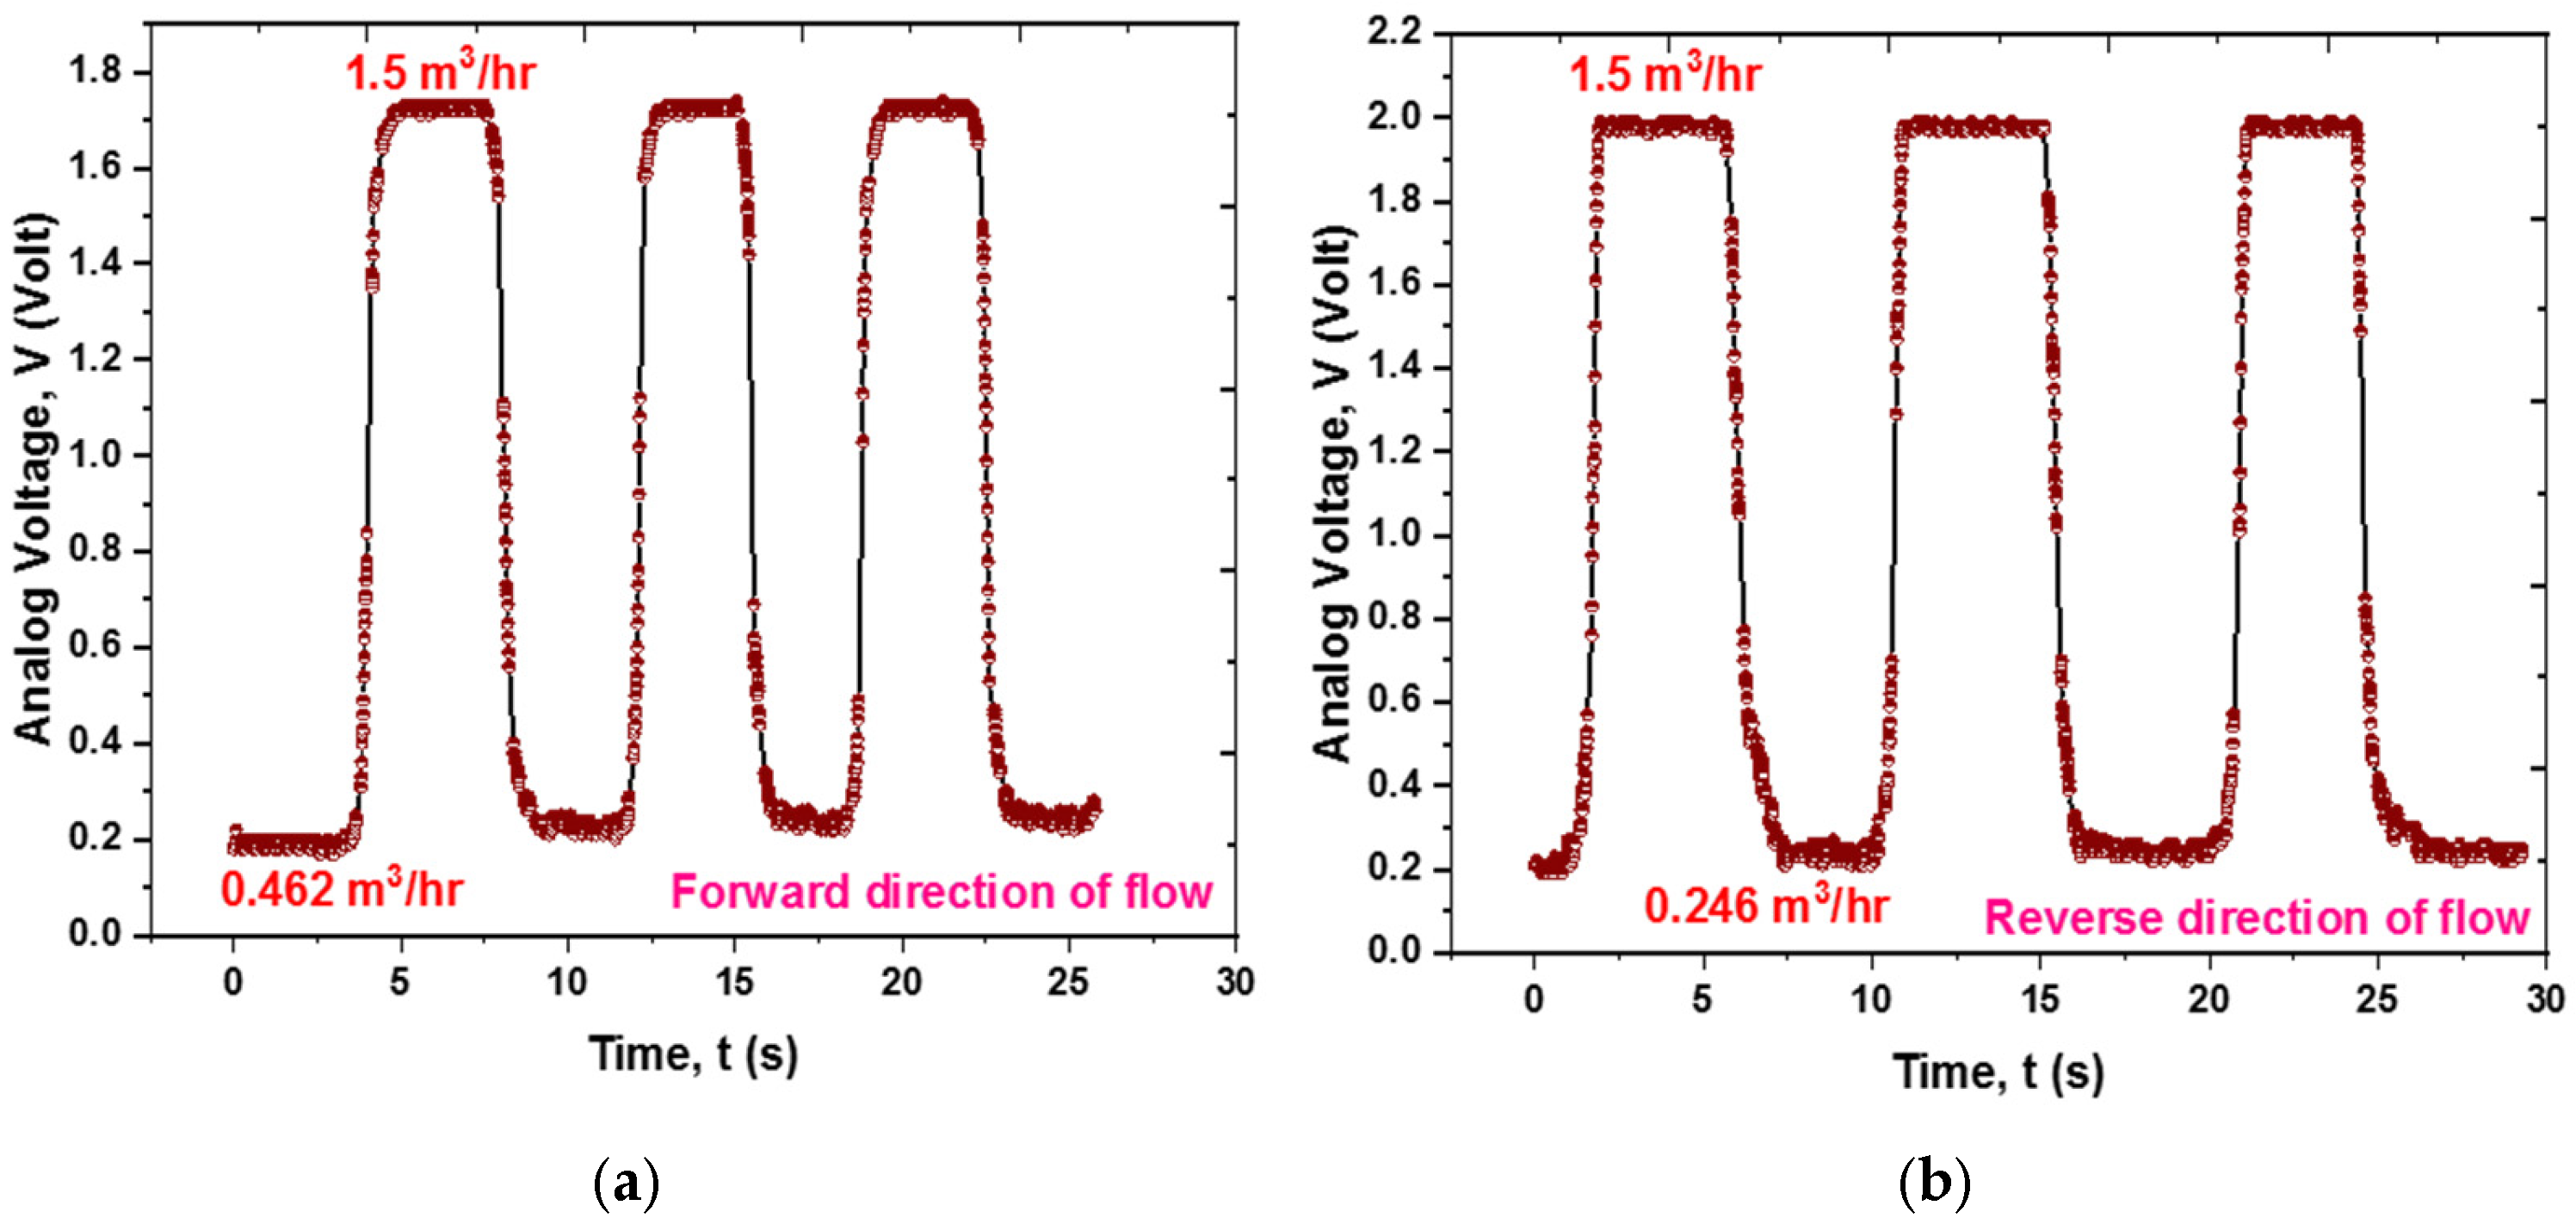
Figure 16a,b show the sensor’s repeatability at consistent flow rate levels across multiple cycles of water flow in both forward and reverse directions. The sensor exhibits high repeatability, characterized by a sharp rise in voltage output and an abrupt increase in flow, followed by a leveling off at a saturation value. Upon refreshing, the voltage output reverts to its original value.
The hysteresis error is represented as
, with
signifying the highest discrepancy between output voltage values at the same flow rate during both the increasing and decreasing phases of the flow rate change,
refers to the full-scale output voltage. The test results for both output voltage and flow rate phases are illustrated in
Figure 17a,b, encompassing both forward and reverse flow directions. The largest difference between the increasing and decreasing phase data is observed at a flow rate of 0.64 m
3/h, at which point
for the forward direction and 0.422 m
3/h, at which point
for the reverse direction, leading to calculated hysteresis errors of 1.84% and 2.06%, respectively.
The significant parameters of the proposed sensing mechanism are summarized in
Table 9.
Table 10 compares the proposed sensor with a commercial flow meter [
14,
15,
25,
26,
27]. The proposed sensor offers several significant advantages over the target flow meter.
Firstly, sensitivity stands out as a crucial differentiator; the proposed sensor demonstrates superior sensitivity compared to the target flow meter, which utilizes a flat disc or sphere attached to an extension rod as its sensing element. This configuration is based on two main assumptions: (i) the extension rod’s cross-sectional area is substantially smaller than that of the drag element, and (ii) the drag element itself is much less than the pipe’s internal diameter. Consequently, existing target flow meters exhibit minimal deflection, resulting in reduced sensitivity. In contrast, the proposed method features a thin stainless steel flat plate as the sensing element, enabling more significant deflection due to its capacity to bend freely to a considerable angle.
Secondly, the proposed sensor can measure bi-directional fluid flow, which offers an advantage over the target flow meter typically designed for unidirectional flow measurements. The proposed sensor accurately assesses flow rates from 0 to 1.5 m
3/h in a consistent turbulent flow regime. Additionally, using a corrosion-resistant flat plate expands the prototype’s versatility in clean and aggressive fluid environments. On the other hand, the target flow meter primarily caters to high-viscosity fluids, slurry, gas, and steam in filled pipes at flow rates reaching up to 4 m
3/h while functioning under low Reynolds number conditions [
28,
29]. To contextualize the performance of the proposed sensor for its target agricultural and domestic applications, its key characteristics are compared with those of commercial flow meters in
Table 10. The “Requirements” row defines the primary criteria for these markets, emphasizing low cost, sufficient accuracy, and operational robustness [
4,
5].
An examination of the specifications presented in
Table 10 indicates that the proposed sensor meets several critical criteria for both domestic and agricultural applications. Notably, its projected cost is significantly lower than the target benchmark, its accuracy is maintained within the requisite sub-5% range, and its design is devoid of rotating components, contributing to its durability. Furthermore, the sensor is equipped with bi-directional flow detection, a feature that is not commonly found in low-cost meters.
However, it is essential to note that the operational flow range of the current prototype (0–1.5 m3/h) falls short of the upper limit of the desired range (0–5 m3/h). Additionally, the semi-intrusive cantilever design may pose a potential risk of clogging due to debris, particularly when compared to completely non-invasive alternatives. Addressing these identified limitations—specifically the flow range and debris resistance—will be essential in guiding future enhancements. Strategies to consider include expanding the sensor design to accommodate higher flow rates and integrating a protective inlet filter to mitigate these concerns.
When compared to the proposed sensor with MEMS-based cantilever sensors [
11], MEMS cantilevers are highly sophisticated devices that typically outperform in response time and miniaturization due to their semiconductor-grade fabrication processes. The key distinction lies in the cost–performance trade-off. While MEMS cantilevers offer exceptional performance, they involve significant fabrication costs and can be delicate in certain applications. Our sensor, on the other hand, emphasizes cost-effectiveness, robustness, and ease of fabrication, making it suitable for applications where extreme miniaturization and rapid response times are less critical.
Table 11 shows a trade-off (cost vs. performance) between the proposed sensor and MEMS-based cantilever sensors.
