
Validation of an Automated Scoring Algorithm That Assesses Eye Exploration in a 3-Dimensional Virtual Reality Environment Using Eye-Tracking Sensors
 , , , ,
Abstract
1. Introduction
1.1. Eye-Tracking Setups—The Added Value of Their Use in Virtual Reality
1.2. Eye-Tracking Metrics
1.3. Related Work
1.4. Rationale and Motivation
2. Materials and Methods
2.1. Participants
2.2. Apathy Study—Procedure
2.3. Apparatus
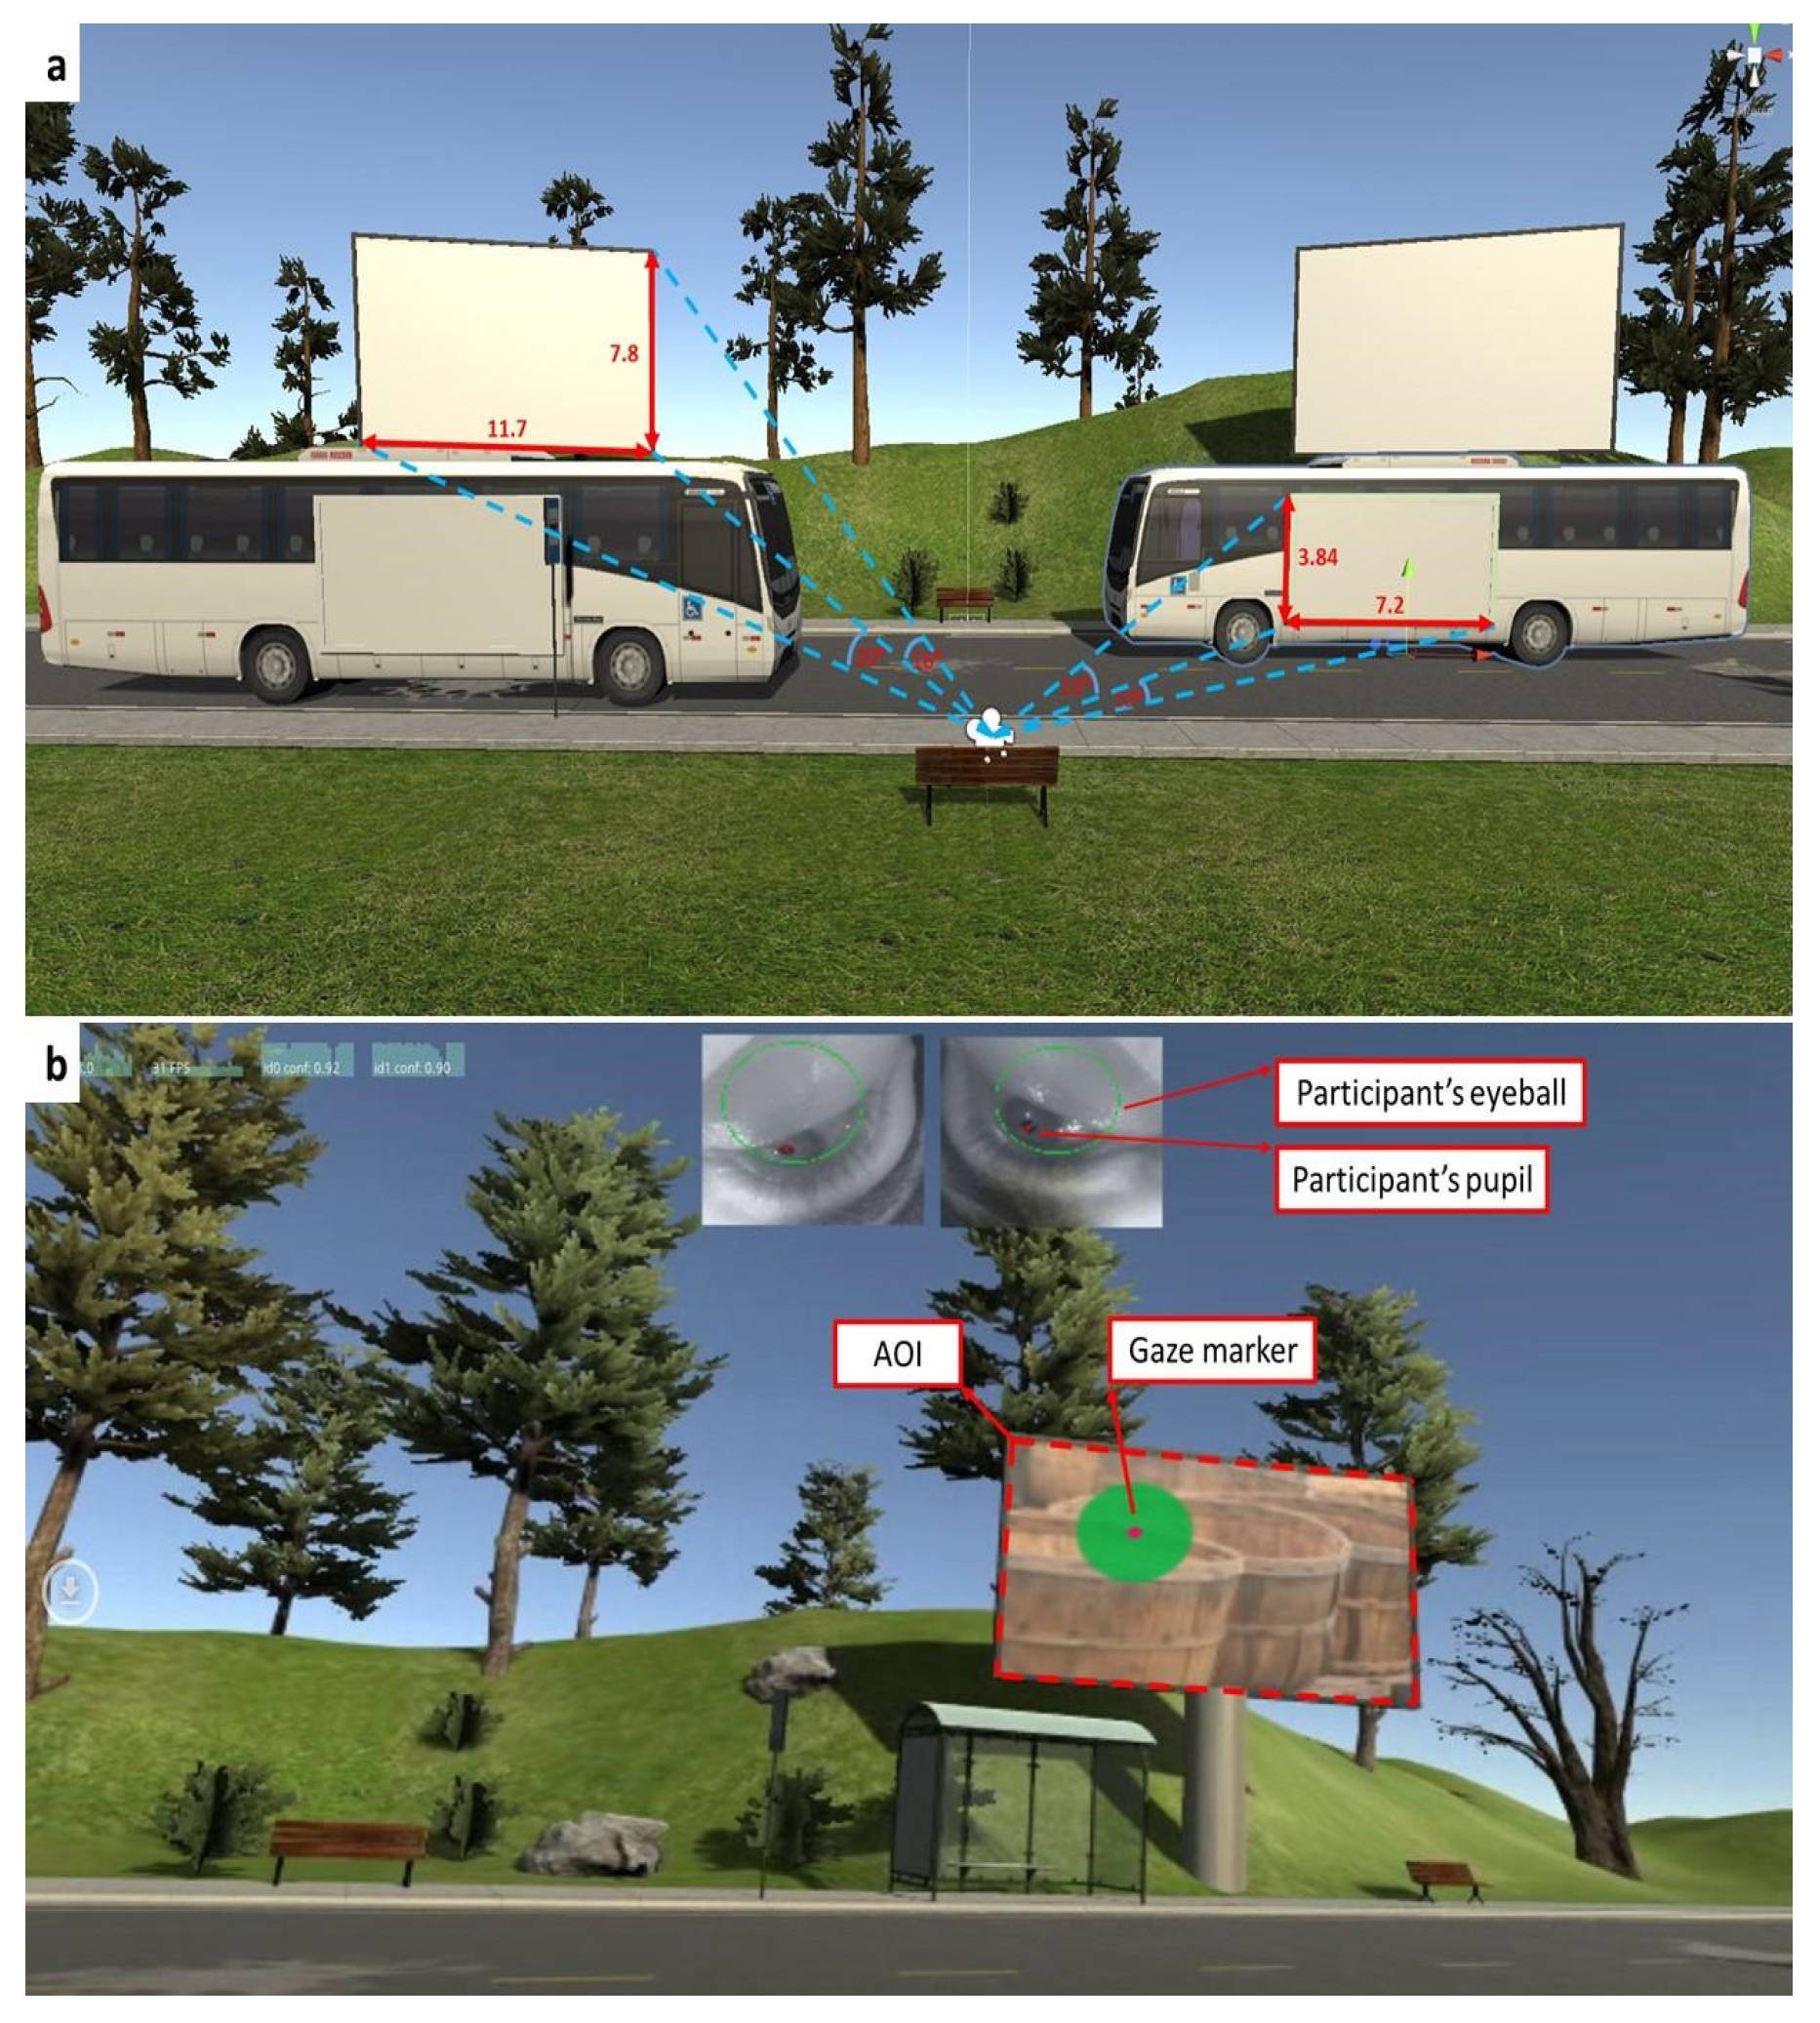
2.4. Visual Stimuli
2.5. Data Collection
2.6. Manual Scoring of Eye-Tracking Behavior
- (1)
- TOFF—the first instance in which the gaze of the participant entered the AOI (millisecond resolution). For example, if a static stimulus is delivered in the VR environment at 90.000 s and the rater detects the participant’s gaze entering the AOI half a second later, TOFF = 90.500 s.
- (2)
- TFD—the sum of all fixation durations on the AOI. For example, if the rater detected the participant’s gaze within the boundaries of the AOI three times (2, 1.5, and 3 s), TFD = 6.500 s.
2.7. Algorithm and Statistical Analysis
2.7.1. The Algorithm
2.7.2. Statistical Analysis
3. Results
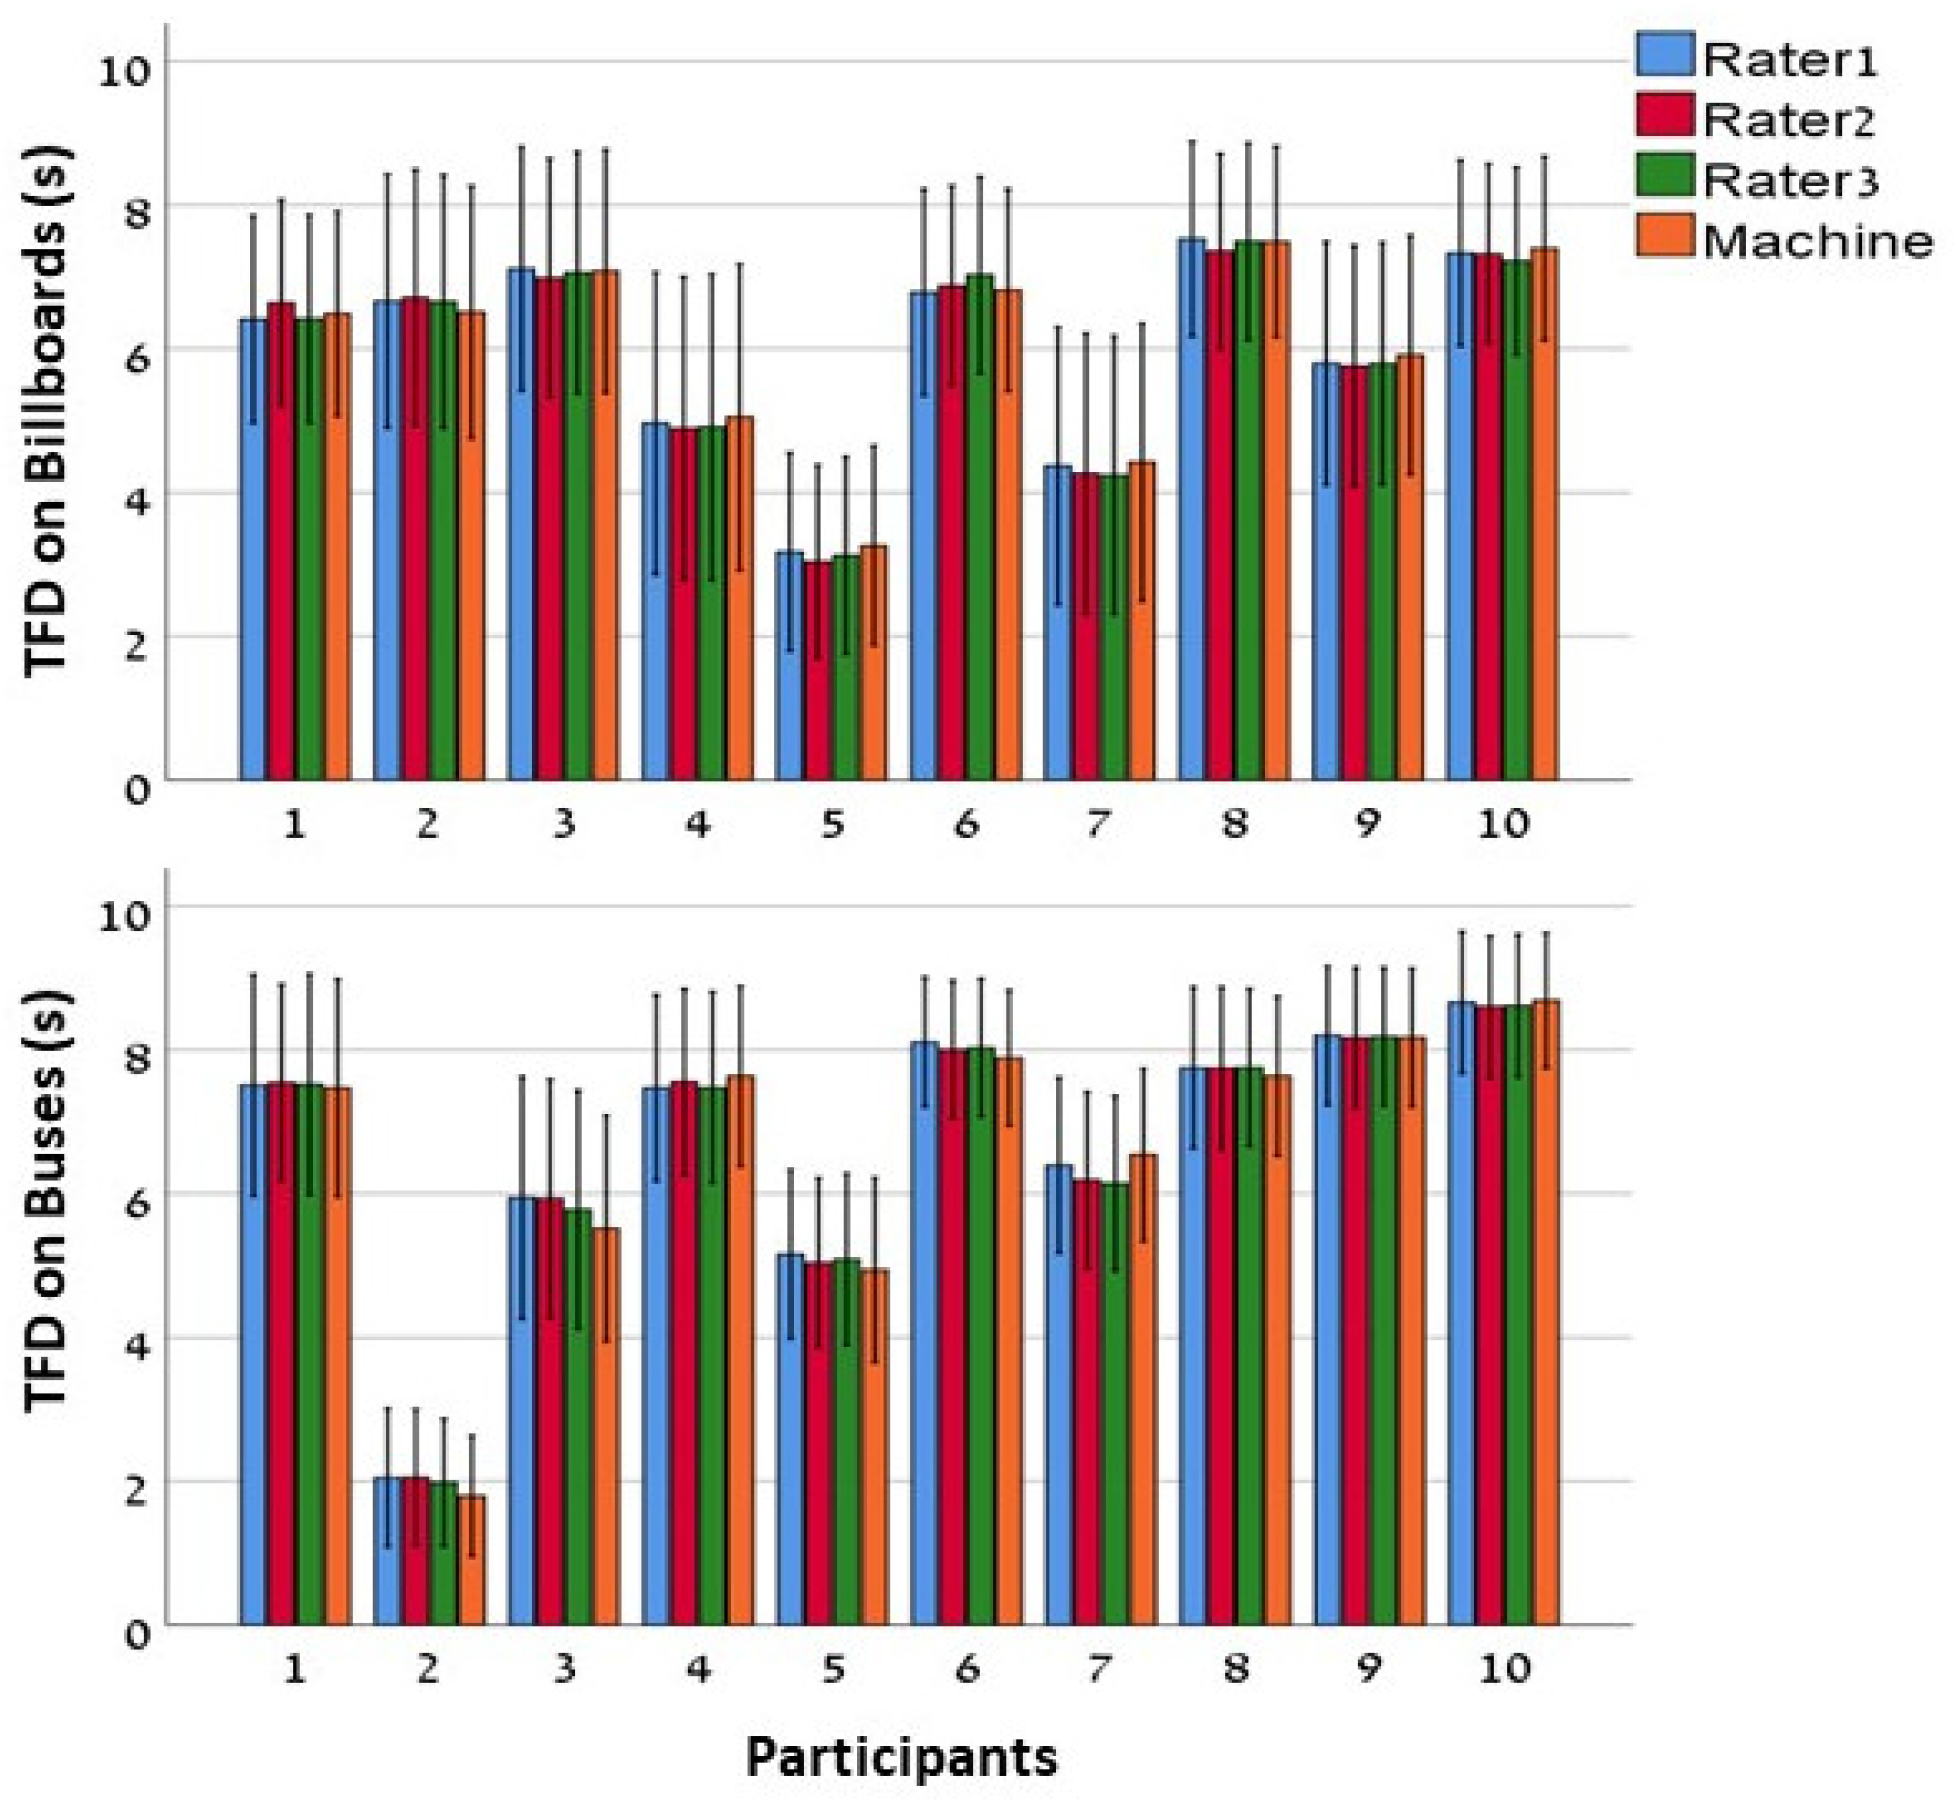
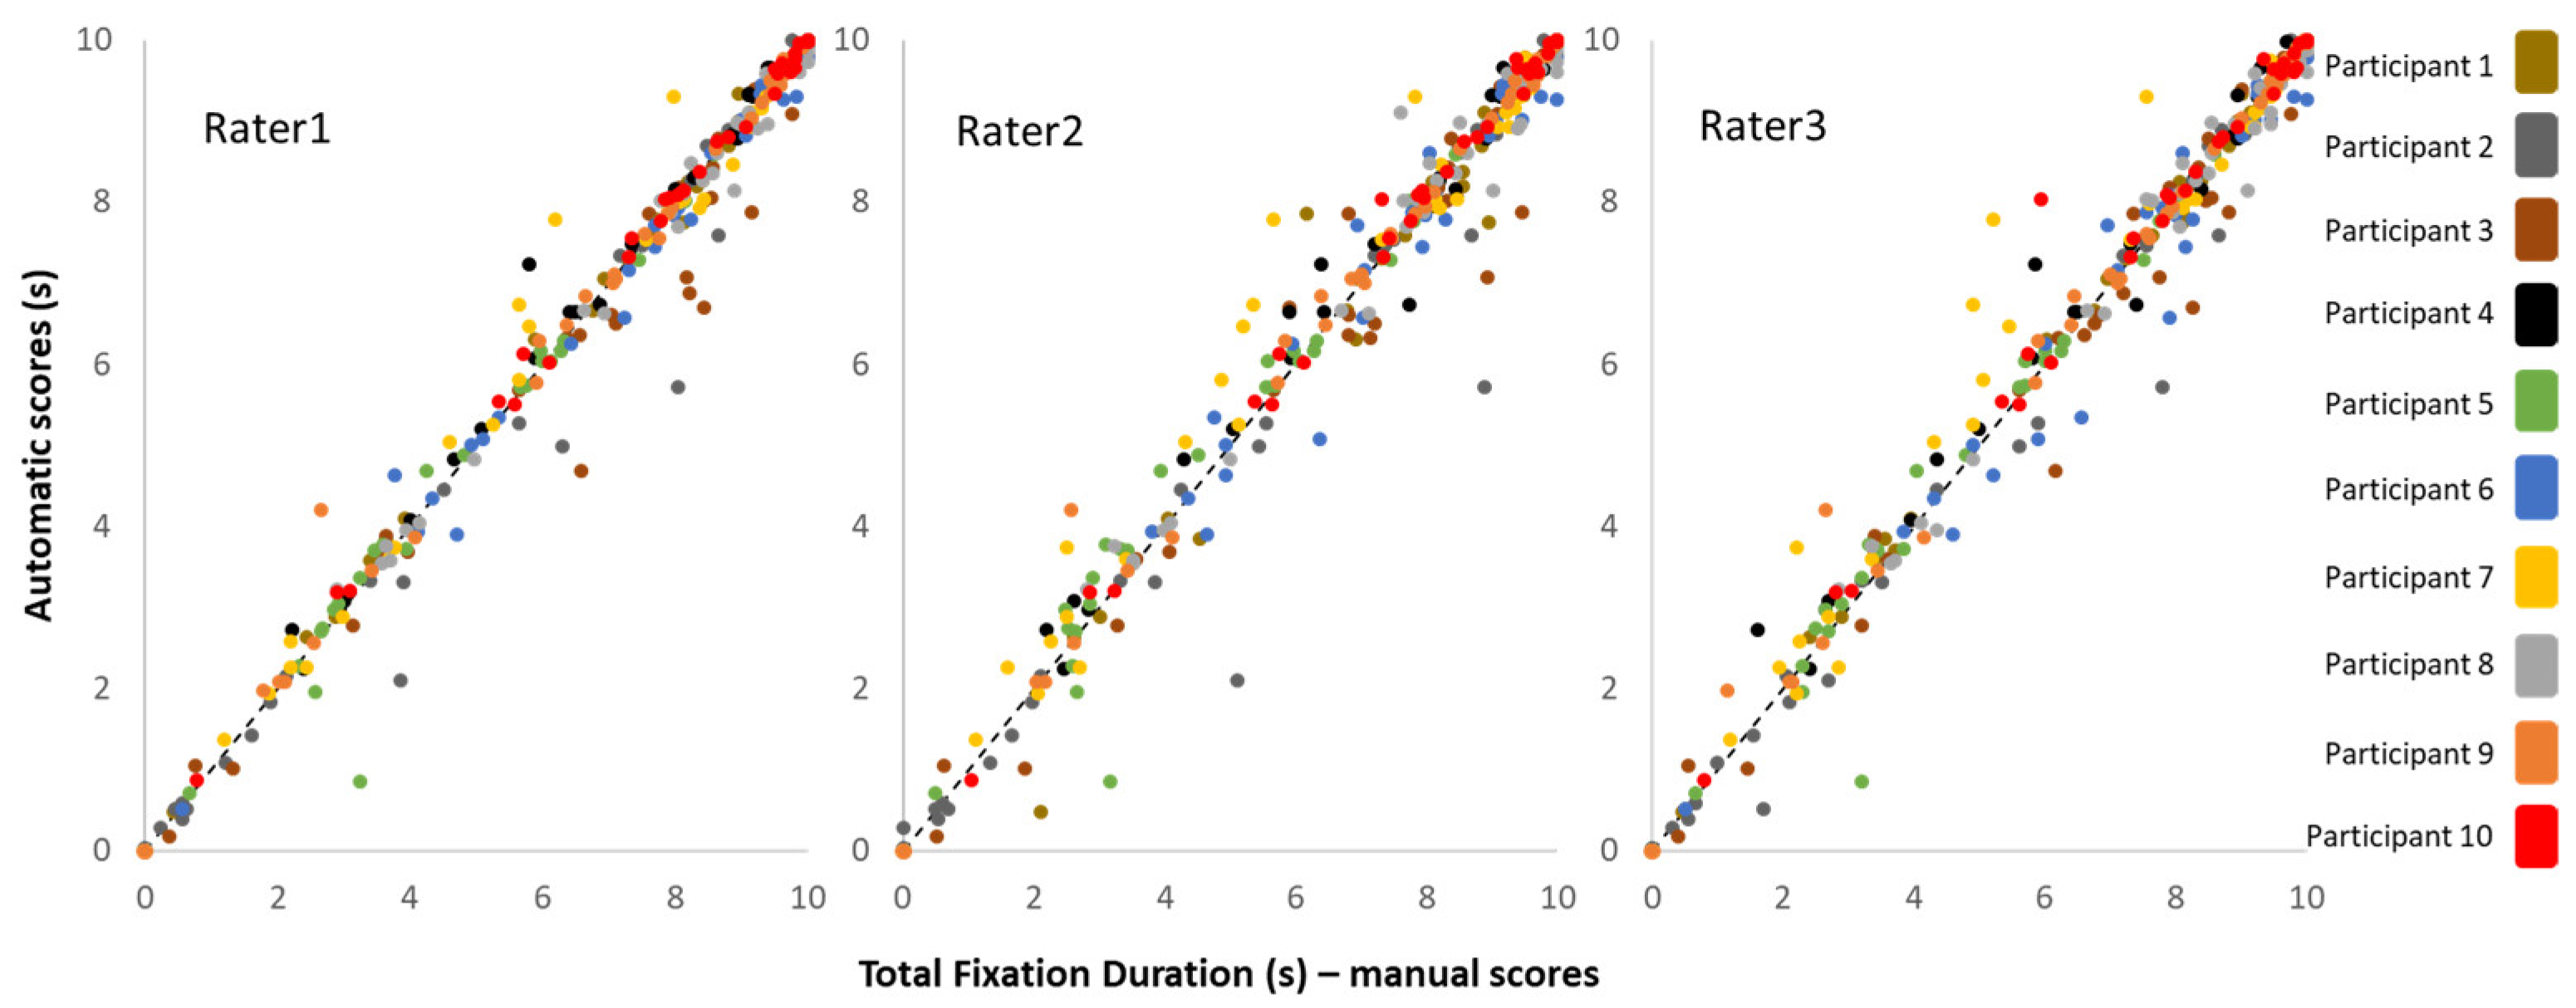
3.1. Total Fixation Duration (TFD)
3.2. Interclass Correlation Coefficients (ICC)
4. Discussion
4.1. Comparison to the Literature
4.2. Challenges of Real-World Eye Tracking
4.3. Limitations
4.4. Future Directions
Supplementary Materials
Author Contributions
Funding
Institutional Review Board Statement
Informed Consent Statement
Data Availability Statement
Acknowledgments
Conflicts of Interest
Abbreviations
| AD | Alzheimer’s Dementia |
| AOI | Area Of Interest |
| HMD | Head Mount Display |
| ICC | Interclass Correlation Coefficient |
| TFD | Total Fixation Duration |
| TOFF | Time Of First Fixation |
| VR | Virtual Reality |
References
- Płużyczka, M. The First Hundred Years: A History of Eye Tracking as a Research Method. Appl. Linguist. Pap. 2018, 101–116. [Google Scholar] [CrossRef]
- Wade, N.J. Pioneers of Eye Movement Research. Percept 2010, 1, 33–68. [Google Scholar] [CrossRef]
- Liu, H.; Liu, H.; Li, F.; Han, B.; Wang, C. Effect of Cognitive Control on Attentional Processing of Emotional Information Among Older Adults: Evidence From an Eye-Tracking Study. Front. Aging Neurosci. 2021, 13, 644379. [Google Scholar] [CrossRef] [PubMed]
- Bott, N.; Madero, E.N.; Glenn, J.; Lange, A.; Anderson, J.; Newton, D.; Brennan, A.; Buffalo, E.A.; Rentz, D.; Zola, S. Device-Embedded Cameras for Eye Tracking—Based Cognitive Assessment: Validation With Paper-Pencil and Computerized Cognitive Composites. J. Med. Internet Res. 2018, 20, e11143. [Google Scholar] [CrossRef] [PubMed]
- Okamoto, M.; Kojima, R.; Ueda, A.; Suzuki, M.; Okuno, Y. Characterizing eye-gaze positions of people with severe motor dysfunction: Novel scoring metrics using eye-tracking and video analysis. PLoS ONE 2022, 17, e0265623. [Google Scholar] [CrossRef] [PubMed]
- Chiquet, S.; Martarelli, C.S.; Mast, F.W. Eye movements to absent objects during mental imagery and visual memory in immersive virtual reality. Virtual Real. 2021, 25, 655–667. [Google Scholar] [CrossRef]
- Franchak, J.M.; Kretch, K.S.; Soska, K.C.; Adolph, K.E. Head-Mounted Eye Tracking: A New Method to Describe Infant Looking: Head-Mounted Eye Tracking. Child. Dev. 2011, 82, 1738–1750. [Google Scholar] [CrossRef] [PubMed]
- Bueno, A.P.A.; Sato, J.R.; Hornberger, M. Eye tracking—The overlooked method to measure cognition in neurodegeneration? Neuropsychologia 2019, 133, 107191. [Google Scholar] [CrossRef]
- Rayner, K. The 35th Sir Frederick Bartlett Lecture: Eye movements and attention in reading, scene perception, and visual search. Q. J. Exp. Psychol. 2009, 62, 1457–1506. [Google Scholar] [CrossRef]
- Borys, M.; Plechawska-Wójcik, M. Eye-tracking metrics in perception and visual attention research. Eur. J. Med.Technol. 2017, 3, 11–23. [Google Scholar]
- Hessels, R.S.; Benjamins, J.S.; Cornelissen, T.H.W.; Hooge, I.T.C. A Validation of Automatically-Generated Areas-of-Interest in Videos of a Face for Eye—Tracking Research. Front. Psychol. 2018, 9, 1367. [Google Scholar] [CrossRef] [PubMed]
- Rim, N.W.; Choe, K.W.; Scrivner, C.; Berman, M.G. Introducing Point-of-Interest as an alternative to Area-of-Interest for fixation duration analysis. PLoS ONE 2021, 16, e0250170. [Google Scholar] [CrossRef] [PubMed]
- Jongerius, C.; Callemein, T.; Goedemé, T.; Van Beeck, K.; Romijn, J.A.; Smets, E.M.A.; Hillen, M.A. Eye-tracking glasses in face-to-face interactions: Manual versus automated assessment of areas-of-interest. Behav. Res. Methods 2021, 53, 2037–2048. [Google Scholar] [CrossRef]
- Orquin, J.L.; Ashby, N.J.S.; Clarke, A.D.F. Areas of Interest as a Signal Detection Problem in Behavioral Eye-Tracking Research: Areas of Interest as a Signal Detection Problem. J. Behav. Decis. Mak. 2016, 29, 103–115. [Google Scholar] [CrossRef]
- Salvucci, D.D. An integrated model of eye movements and visual encoding. Cogn. Syst. Res. 2001, 1, 201–220. [Google Scholar] [CrossRef]
- Salvucci, D.D.; Goldberg, J.H. Identifying fixations and saccades in eye-tracking protocols. In Proceedings of the Symposium on Eye Tracking Research & Applications—ETRA ’00, Palm Beach Gardens, FL, USA, 6–8 November 2000; ACM Press: New York, NY, USA, 2000; pp. 71–78. [Google Scholar]
- Trefzger, M.; Blascheck, T.; Raschke, M.; Hausmann, S.; Schlegel, T. A visual comparison of gaze behavior from pedestrians and cyclists. In Proceedings of the 2018 ACM Symposium on Eye Tracking Research & Applications, Warsaw, Poland, 14–17 June 2018; ACM Press: New York, NY, USA, 2018; pp. 1–5. [Google Scholar]
- Xiao, N.G.; Lee, K. iTemplate: A template-based eye movement data analysis approach. Behav. Res. Methods 2018, 50, 2388–2398. [Google Scholar] [CrossRef]
- Clay, V.; König, P.; König, S.U. Eye tracking in virtual reality. J. Eye Mov. Res. 2019, 12, 1–18. [Google Scholar] [CrossRef]
- Cognolato, M.; Atzori, M.; Müller, H. Head-mounted eye gaze tracking devices: An overview of modern devices and recent advances. J. Rehabil. Assist. Technol. Eng. 2018, 5, 205566831877399. [Google Scholar] [CrossRef]
- Pettersson, J.; Albo, A.; Eriksson, J.; Larsson, P.; Falkman, K.W.; Falkman, P. Cognitive Ability Evaluation using Virtual Reality and Eye Tracking. In Proceedings of the 2018 IEEE International Conference on Computational Intelligence and Virtual Environments for Measurement Systems and Applications (CIVEMSA) IEEE, Ottawa, ON, Canada, 12–14 June 2018; pp. 1–6. [Google Scholar]
- Murias, M.; Major, S.; Davlantis, K.; Franz, L.; Harris, A.; Rardin, B.; Sabatos-DeVito, M.; Dawson, G. Validation of eye-tracking measures of social attention as a potential biomarker for autism clinical trials: Utilizing eye-tracking as a social communication biomarker for ASD. Autism Res. 2018, 11, 166–174. [Google Scholar] [CrossRef]
- Ahonniska-Assa, J.; Polack, O.; Saraf, E.; Wine, J.; Silberg, T.; Nissenkorn, A.; Ben-Zeev, B. Assessing cognitive functioning in females with Rett syndrome by eye-tracking methodology. Eur. J. Paediatr. Neurol. 2018, 22, 39–45. [Google Scholar] [CrossRef]
- Eckstein, M.K.; Guerra-Carrillo, B.; Miller Singley, A.T.; Bunge, S.A. Beyond eye gaze: What else can eyetracking reveal about cognition and cognitive development? Dev. Cogn. Neurosci. 2017, 25, 69–91. [Google Scholar] [CrossRef] [PubMed]
- Komogortsev, O.V.; Jayarathna, S.; Koh, D.H.; Gowda, S.M. Qualitative and quantitative scoring and evaluation of the eye movement classification algorithms. In Proceedings of the 2010 Symposium on Eye-Tracking Research & Applications—ETRA ’10, Austin, TX, USA, 22–24 March 2010; ACM Press: New York, NY, USA, 2010; p. 65. [Google Scholar]
- Porras-Garcia, B.; Ferrer-Garcia, M.; Ghita, A.; Moreno, M.; López-Jiménez, L.; Vallvé-Romeu, A.; Serrano-Troncoso, E.; Gutiérrez-Maldonado, J. The influence of gender and body dissatisfaction on body-related attentional bias: An eye-tracking and virtual reality study. Int. J. Eat. Disord. 2019, 52, 1181–1190. [Google Scholar] [CrossRef] [PubMed]
- Voßkühler, A.; Nordmeier, V.; Kuchinke, L.; Jacobs, A.M. OGAMA (Open Gaze and Mouse Analyzer): Open-source software designed to analyze eye and mouse movements in slideshow study designs. Behav. Res. Methods 2008, 40, 1150–1162. [Google Scholar] [CrossRef] [PubMed]
- Ravona-Springer, R.; Koren, O.; Galor, N.; Lapid, M.; Bahat, Y.; Fluss, R.; Wilf, M.; Zorani, S.; Rosenblum, U.; Beeri, M.S.; et al. A novel method for objective quantification of apathy based on gaze and physiological reactivity to stimuli presented in a virtual reality environment. Alzheimer’s Dement. Diagn. Assess. Dis. Monit. 2025, 17, e70020. [Google Scholar] [CrossRef]
- Stuart, S.; Hickey, A.; Vitorio, R.; Welman, K.; Foo, S.; Keen, D.; Godfrey, A. Eye-tracker algorithms to detect saccades during static and dynamic tasks: A structured review. Physiol. Meas. 2019, 40, 02TR01. [Google Scholar] [CrossRef]
- Koo, T.K.; Li, M.Y. A Guideline of Selecting and Reporting Intraclass Correlation Coefficients for Reliability Research. J. Chiropr. Med. 2016, 15, 155–163. [Google Scholar] [CrossRef]
- Rotondi, M.A.; Donner, A. A confidence interval approach to sample size estimation for interobserver agreement studies with multiple raters and outcomes. J. Clin. Epidemiol. 2012, 65, 778–784. [Google Scholar] [CrossRef]
- Jensen, R.R.; Stets, J.D.; Suurmets, S.; Clement, J.; Aanæs, H. Wearable Gaze Trackers: Mapping Visual Attention in 3D. In Image Analysis; Sharma, P., Bianchi, F.M., Eds.; Springer International Publishing: Cham, Switzerland, 2017; pp. 66–76. [Google Scholar]
- Pfeiffer, T. Measuring and visualizing attention in space with 3D attention volumes. In Proceedings of the Symposium on Eye Tracking Research and Applications, Santa Barbara, CA, USA, 28–30 March 2012; ACM Press: New York, NY, USA, 2012; pp. 29–36. [Google Scholar]


| Subject | Gender | Age | MOCA | LARS | FAB | GDS |
|---|---|---|---|---|---|---|
| Participant 1 | F | 85 | 14 | −12 | 12 | 6 |
| Participant 2 | M | 74 | 17 | −7 | 9 | 6 |
| Participant 3 | F | 84 | 13 | −10 | 11 | 0 |
| Participant 4 | M | 62 | 19 | −9 | 14 | 3 |
| Participant 5 | M | 75 | 17 | −11 | 14 | 1 |
| Participant 6 | F | 68 | 26 | −15 | 18 | 1 |
| Participant 7 | F | 68 | 29 | −7 | 17 | 1 |
| Participant 8 | F | 74 | 23 | −12 | 15 | 1 |
| Participant 9 | M | 75 | 25 | −15 | 13 | 0 |
| Participant 10 | F | 77 | 26 | −7 | 18 | 9 |
| Subject | ICC–TFD * | 95% Confidence Interval | ICC–TOFF * | 95% Confidence Interval | ||
|---|---|---|---|---|---|---|
| Lower Bound | Upper Bound | Lower Bound | Upper Bound | |||
| Participant 1 | 0.987 | 0.977 | 0.993 | 0.999 | 0.999 | 0.999 |
| Participant 2 | 0.985 | 0.973 | 0.992 | 0.999 | 0.999 | 0.999 |
| Participant 3 | 0.984 | 0.972 | 0.991 | 0.999 | 0.999 | 0.999 |
| Participant 4 | 0.992 | 0.985 | 0.996 | 0.999 | 0.999 | 0.999 |
| Participant 5 | 0.985 | 0.973 | 0.992 | 0.999 | 0.999 | 0.999 |
| Participant 6 | 0.983 | 0.972 | 0.991 | 0.999 | 0.999 | 0.999 |
| Participant 7 | 0.982 | 0.966 | 0.991 | 0.999 | 0.999 | 0.999 |
| Participant 8 | 0.991 | 0.986 | 0.995 | 0.999 | 0.999 | 0.999 |
| Participant 9 | 0.996 | 0.994 | 0.998 | 0.999 | 0.999 | 0.999 |
| Participant 10 | 0.993 | 0.989 | 0.996 | 0.999 | 0.999 | 0.999 |
Disclaimer/Publisher’s Note: The statements, opinions and data contained in all publications are solely those of the individual author(s) and contributor(s) and not of MDPI and/or the editor(s). MDPI and/or the editor(s) disclaim responsibility for any injury to people or property resulting from any ideas, methods, instructions or products referred to in the content. |
© 2025 by the authors. Licensee MDPI, Basel, Switzerland. This article is an open access article distributed under the terms and conditions of the Creative Commons Attribution (CC BY) license (https://creativecommons.org/licenses/by/4.0/).
Share and Cite
Koren, O.; Ioschpe, A.D.V.; Wilf, M.; Dahly, B.; Ravona-Springer, R.; Plotnik, M. Validation of an Automated Scoring Algorithm That Assesses Eye Exploration in a 3-Dimensional Virtual Reality Environment Using Eye-Tracking Sensors. Sensors 2025, 25, 3331. https://doi.org/10.3390/s25113331
Koren O, Ioschpe ADV, Wilf M, Dahly B, Ravona-Springer R, Plotnik M. Validation of an Automated Scoring Algorithm That Assesses Eye Exploration in a 3-Dimensional Virtual Reality Environment Using Eye-Tracking Sensors. Sensors. 2025; 25(11):3331. https://doi.org/10.3390/s25113331
Chicago/Turabian StyleKoren, Or, Anais Di Via Ioschpe, Meytal Wilf, Bailasan Dahly, Ramit Ravona-Springer, and Meir Plotnik. 2025. "Validation of an Automated Scoring Algorithm That Assesses Eye Exploration in a 3-Dimensional Virtual Reality Environment Using Eye-Tracking Sensors" Sensors 25, no. 11: 3331. https://doi.org/10.3390/s25113331
APA StyleKoren, O., Ioschpe, A. D. V., Wilf, M., Dahly, B., Ravona-Springer, R., & Plotnik, M. (2025). Validation of an Automated Scoring Algorithm That Assesses Eye Exploration in a 3-Dimensional Virtual Reality Environment Using Eye-Tracking Sensors. Sensors, 25(11), 3331. https://doi.org/10.3390/s25113331