

Color QR Codes for Smartphone-Based Analysis of Free Chlorine in Drinking Water

 , , , and
Abstract
1. Introduction
2. Material and Methods
2.1. Free Chlorine Sample Preparation and Reagent Methods
- BTB strip: We used the Free Chlorine Water Check test from Sensafe® (Industrial Test Systems, Inc., Rock Hill, SC, USA), an assay approved by United States Environmental Protection Agency. This method is designed for testing 50 mL water samples. The procedure involves immersing a single test strip into the 50 mL water sample for 20 s while maintaining continuous back-and-forth motion. The immersion time is adjusted based on the sample temperature, as indicated in the manufacturer’s datasheet. After removal, the strip is gently shaken to eliminate excess liquid, followed by a 20-s wait period before evaluating the color change. The strip employs bromothymol blue (BTB) as a pH-sensitive dye, which exhibits a blue coloration in the presence of free chlorine.
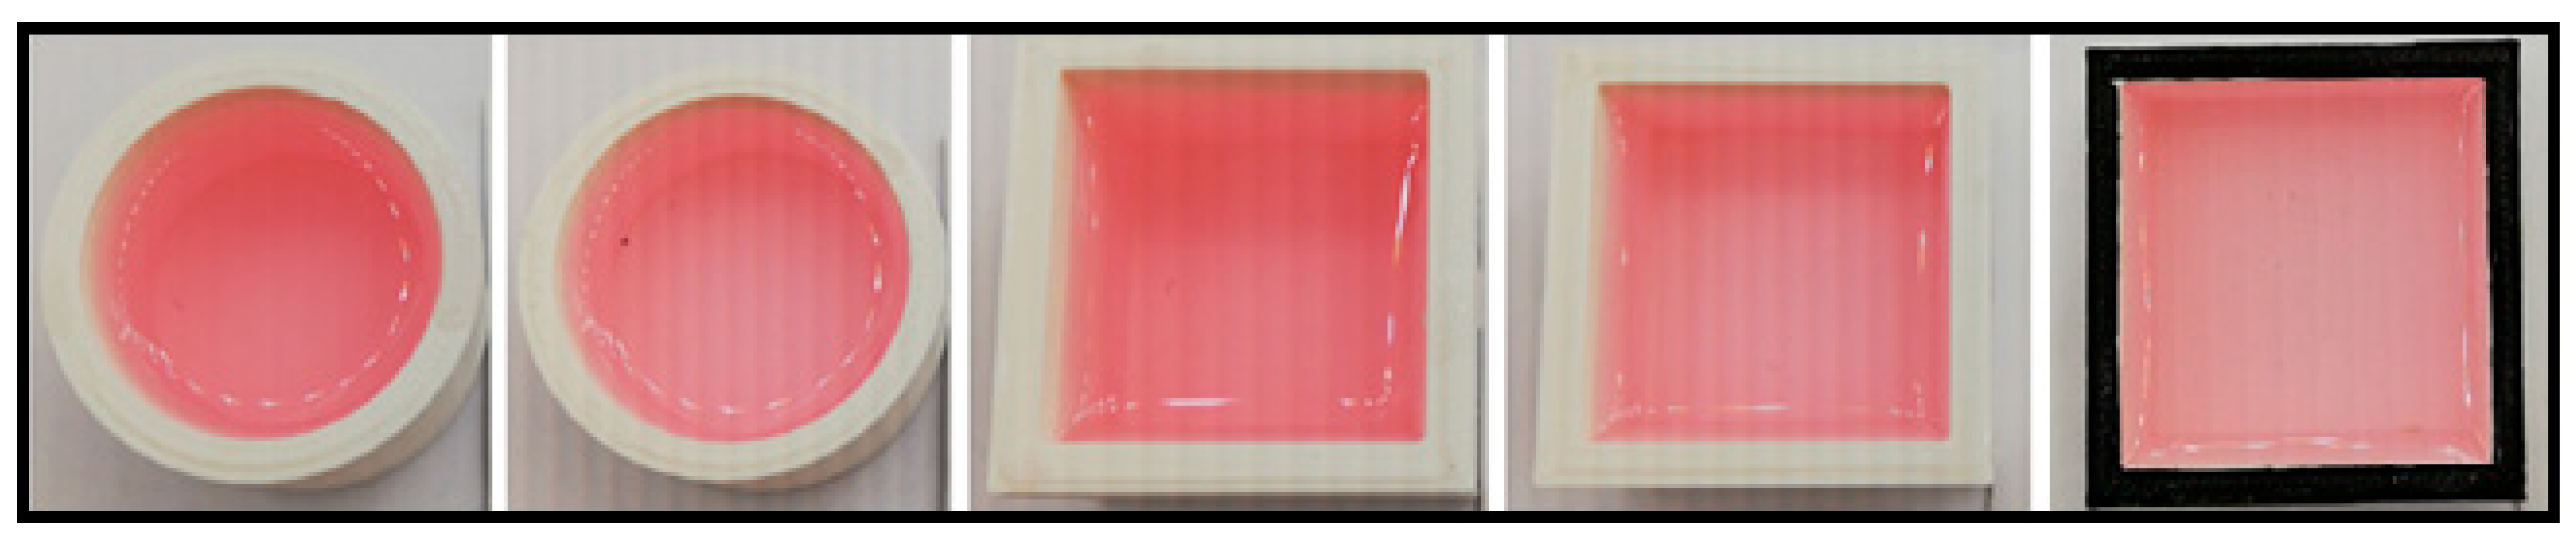
- DPD powder: We employed a mixture of reagents commercially known as Permachem Reagents, which contain diethyl-p-phenylenediamine (DPD) dye (Hach®, Loveland, CO, USA). The reagent is supplied in single-dose powder packets designed to be mixed with 10 mL of the water sample. The liquid sample was held in custom-designed cuvettes specifically fabricated for this study. In the presence of free chlorine, the DPD reagent reacts to produce a pink coloration, enabling colorimetric quantification.
2.2. Design and Fabrication of Color QR Codes
- Data: A URL to the Diesmar website (https://diesmar.com) along with a unique digital identifier that changes with each new QR code generated, i.e., “n87RXv6i3” (http://diesmar.com/#n87RXv6i3, accessed on 18 May 2025).
- Modules: version 3 of the QR Code standard was used, resulting in a 29 × 29 module matrix, which could properly store the data and the colorimetric references.
- Size: The physical size of the QR Codes was approximately 1 in2 (2.54 cm × 2.54 cm).
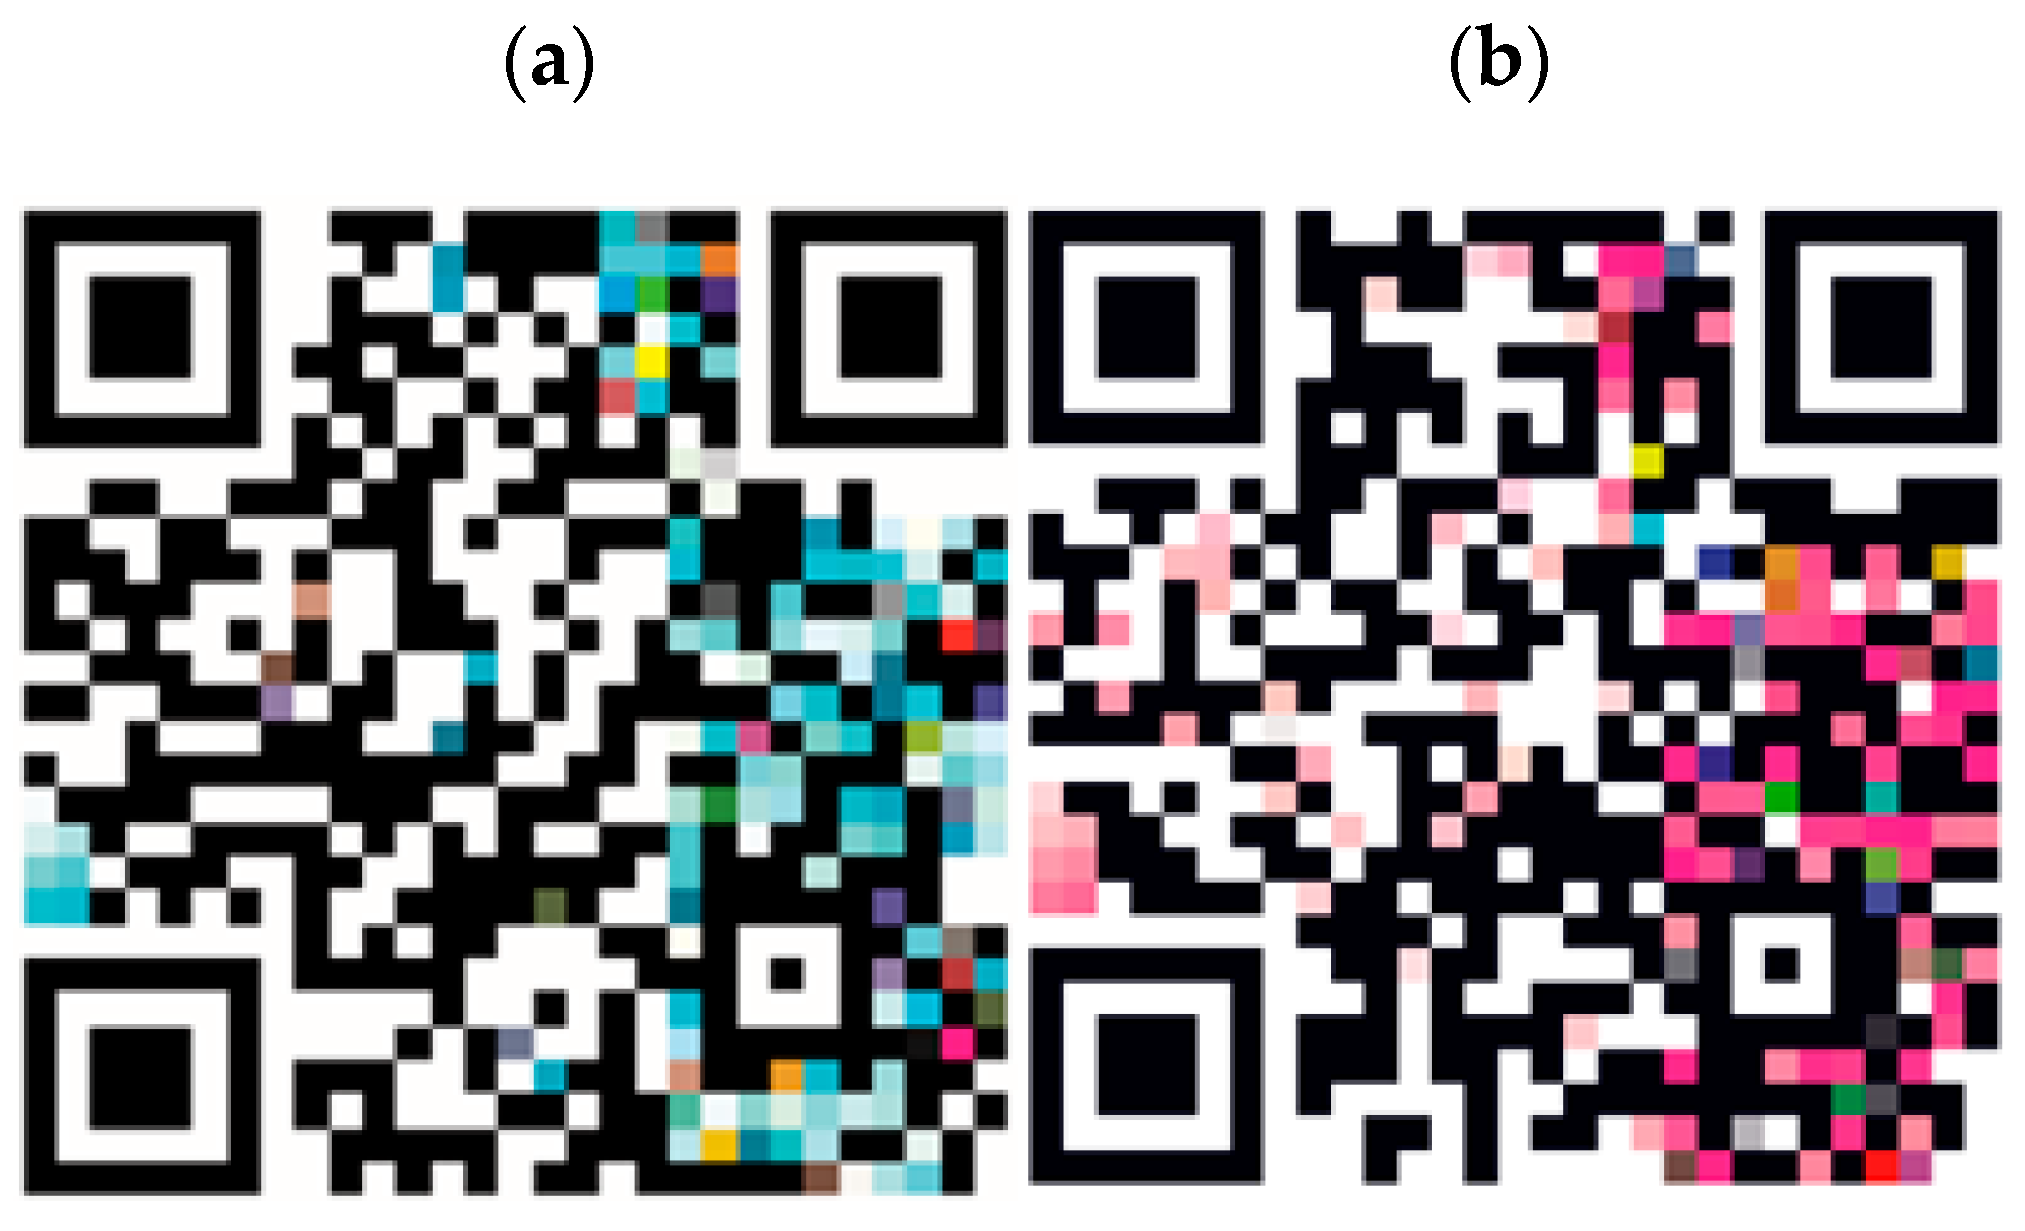
- BTB Strip QR Code: The color palette was created in the CMYK color space and was based on the suggested palette by Sensafe® brand for the product calibration at different chlorine concentrations (see Figure 2a).
- DPD Powder QR Code: The color palette was created in the RGB color space and is based on the range of colors exhibited by the DPD reagent when reacting with different chlorine concentrations in our laboratory. To create such a palette, a set of concentration within the range (0.1–10 ppm) were tested and captured with 6500 K lighting and captured with Huawei P20 smartphone model (see Figure 2b).
2.3. Experimental Setup and Data Acquisition
2.4. Pattern Recognition and Color Correction
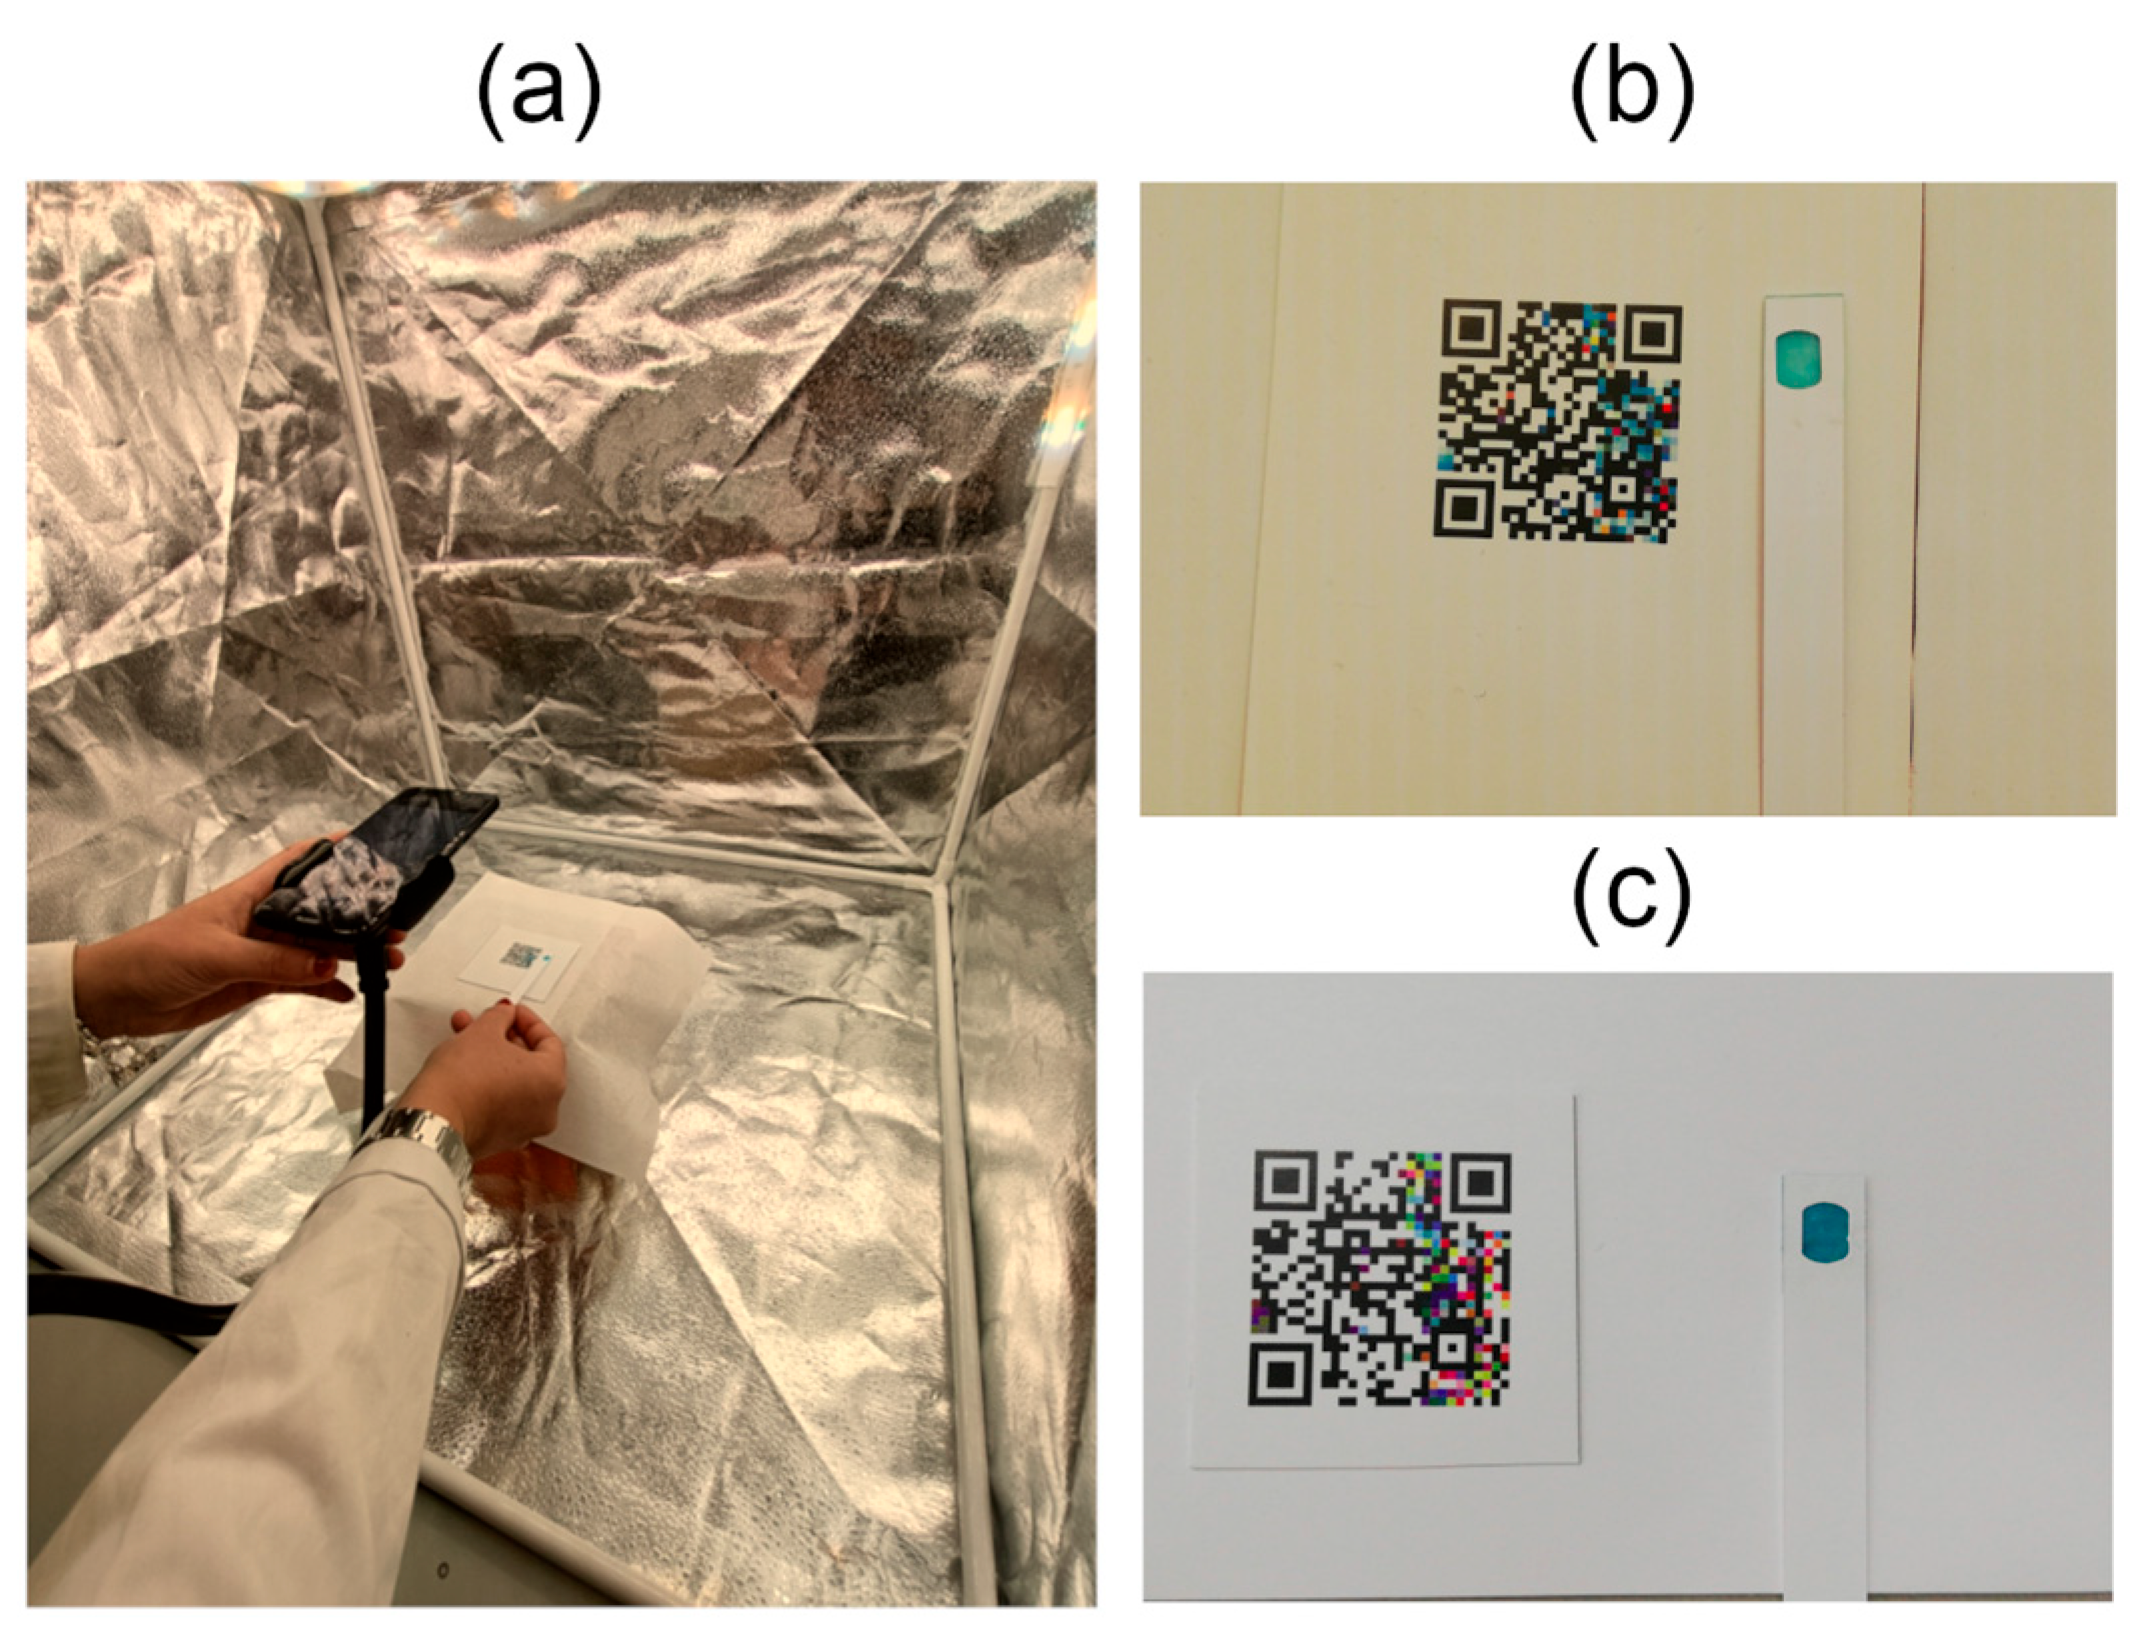
- Image acquisition: An image of the QR Code placed adjacent to the reacted test strip or cuvette was captured using the smartphone camera.
- QR Code detection: The QR Code was located by computer vision algorithms to retrieve barcodes from different surfaces [8], then decoded, and the encoded URL and digital identifier were retrieved.
- Color correction: As the ID of the QR Code is known, our algorithm identified the predefined locations of the color patches within the QR Code. Then, it proceeded to register the colors against saved values of those colors (the same colors under the Fixed Setup with 6500 K light and the Huawei P20 smartphone). These pairs of colors, captured and reference, were used to construct an advanced color correction map, based on non-liner color maps using thin-plate splines [12,13].
- ROI extraction: For each of the specific hardware a ROI was extracted,
- BTB strip: a feature matcher, the Haar cascade scheme from OpenCV, was used to retrieve features like the strip ink window.
- DPD powder: a custom feature extractor was used based on a contour detection, plus some simple aspect ratio relations of the square depicted by the cuvette.
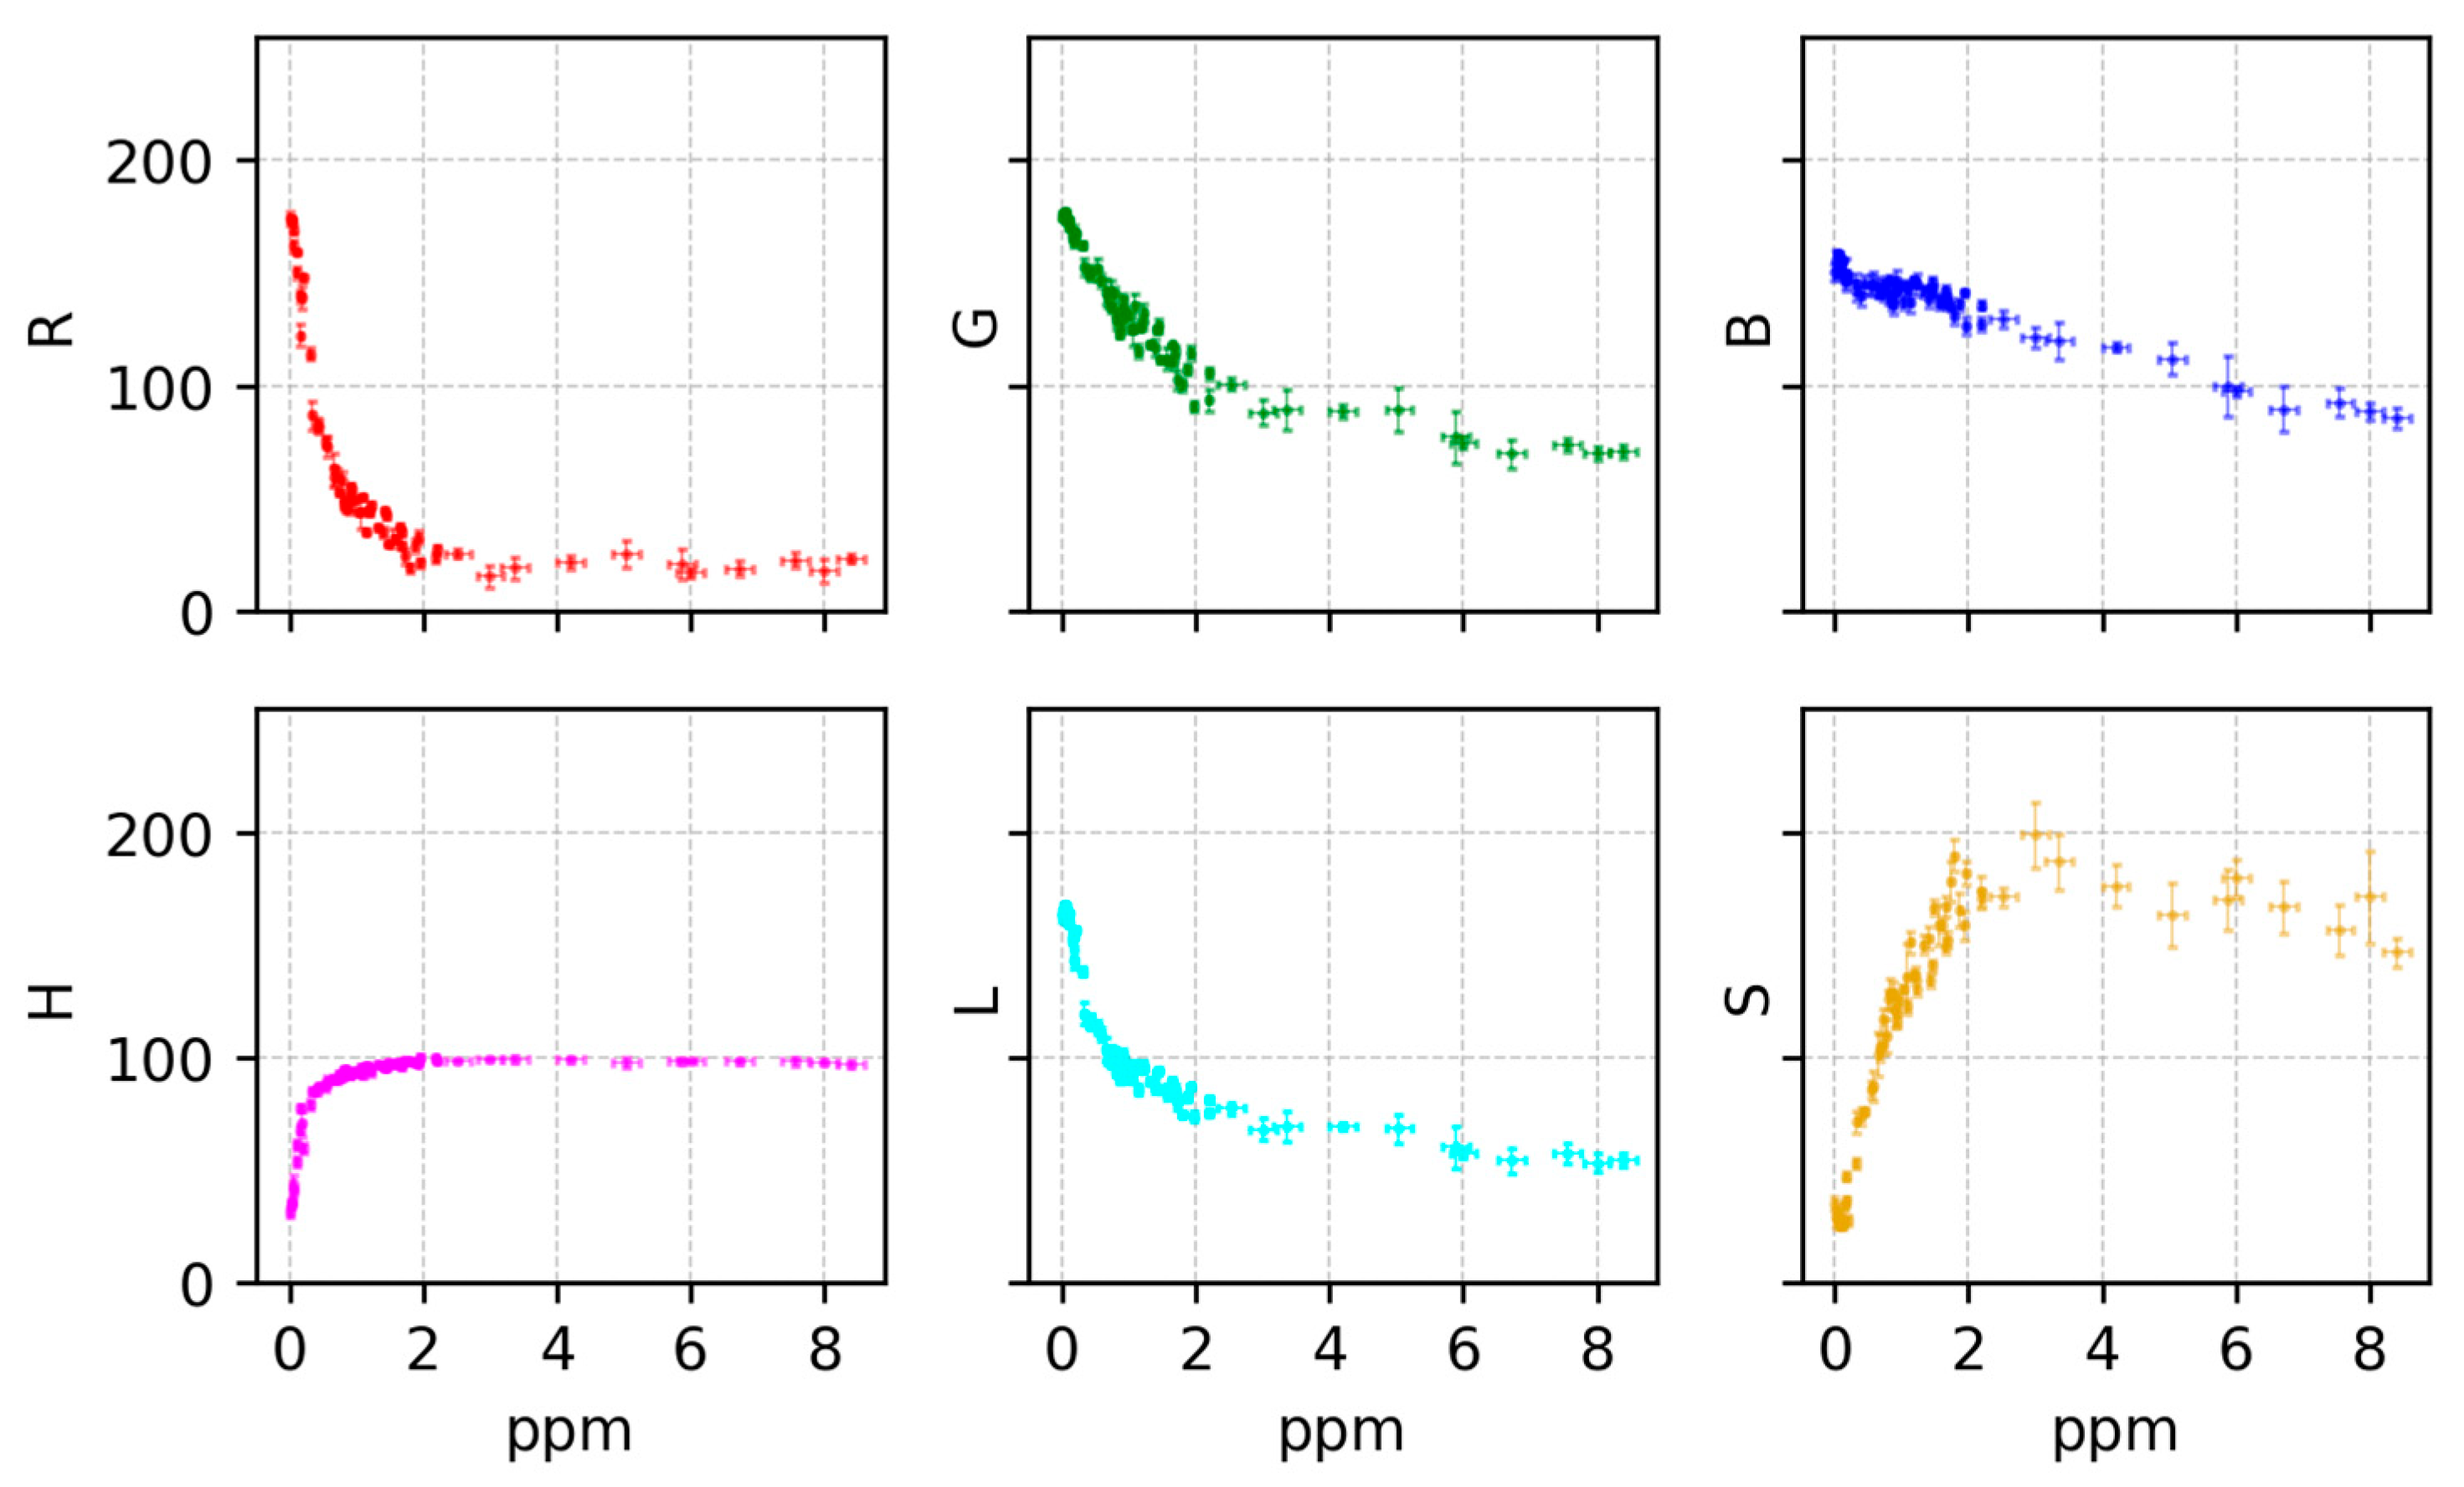
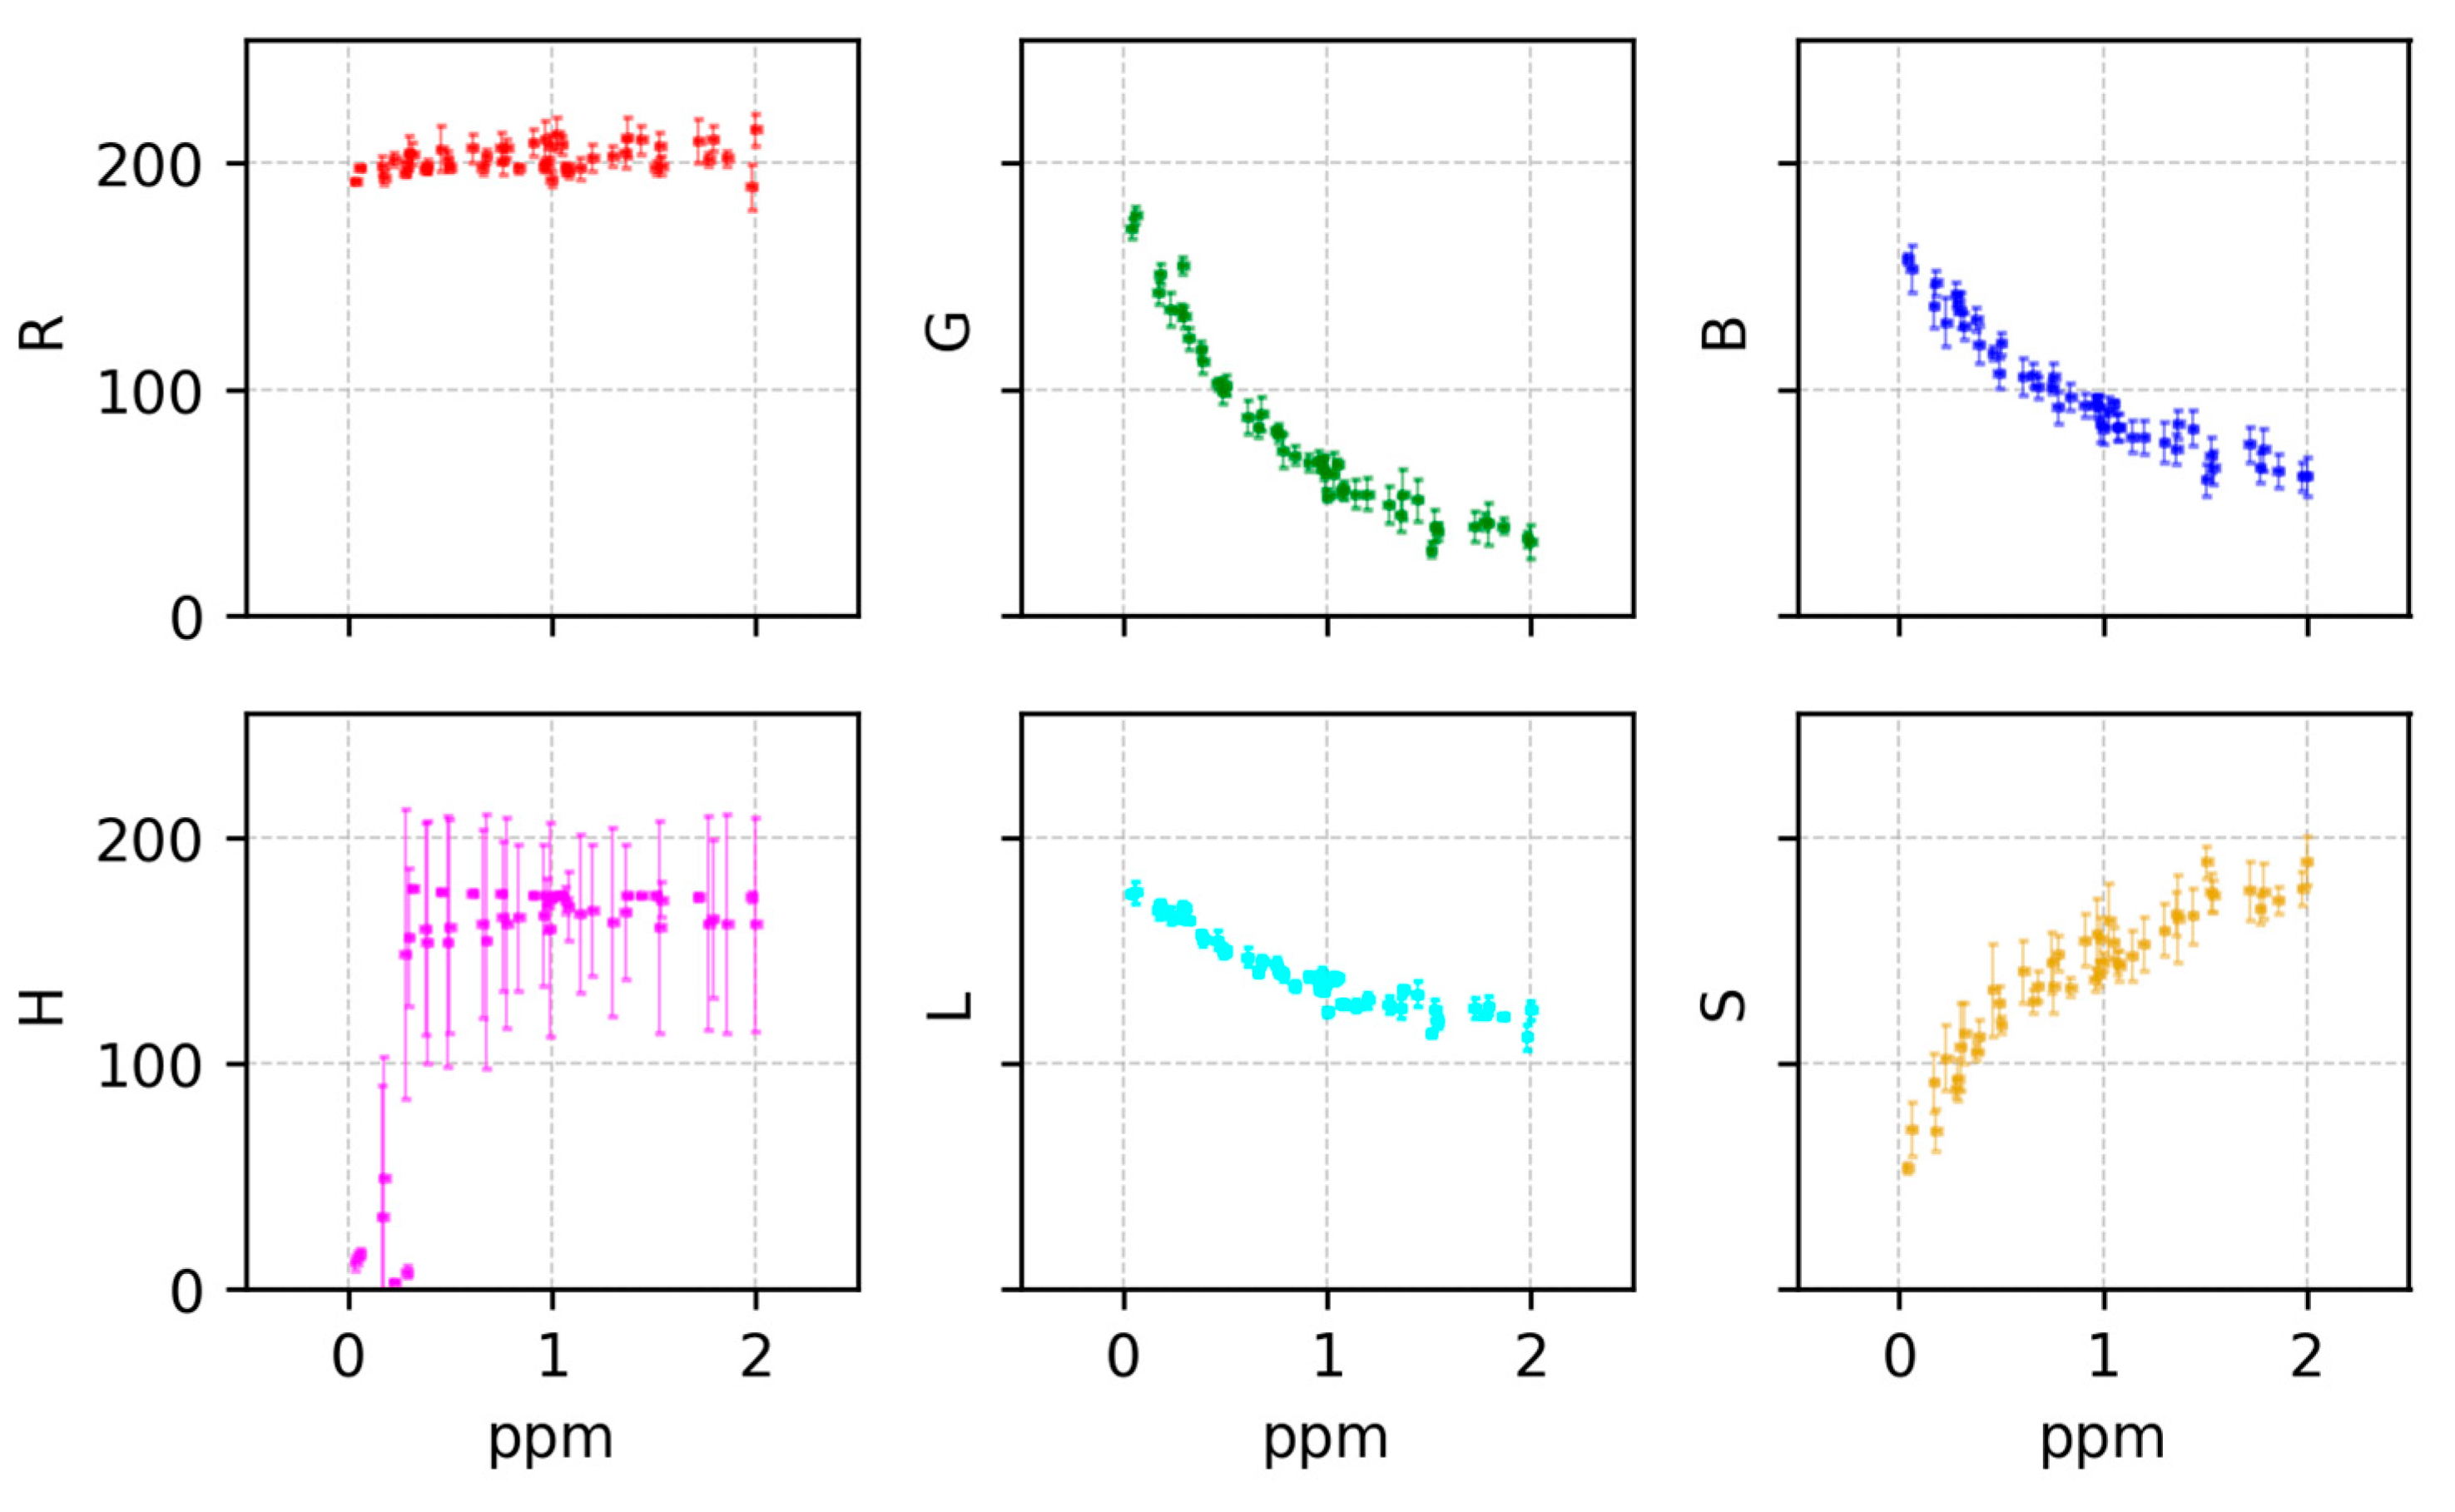
- Color measurement of the ROI: The average color value was measured from the captured image. Then, for each image the recovered color correction map was applied [13,17]. RGB measured values were converted to HLS (hue, light, saturation) to feed the different colorimetric models with both the RGB and HSL triplets.
2.5. Colorimetric Model
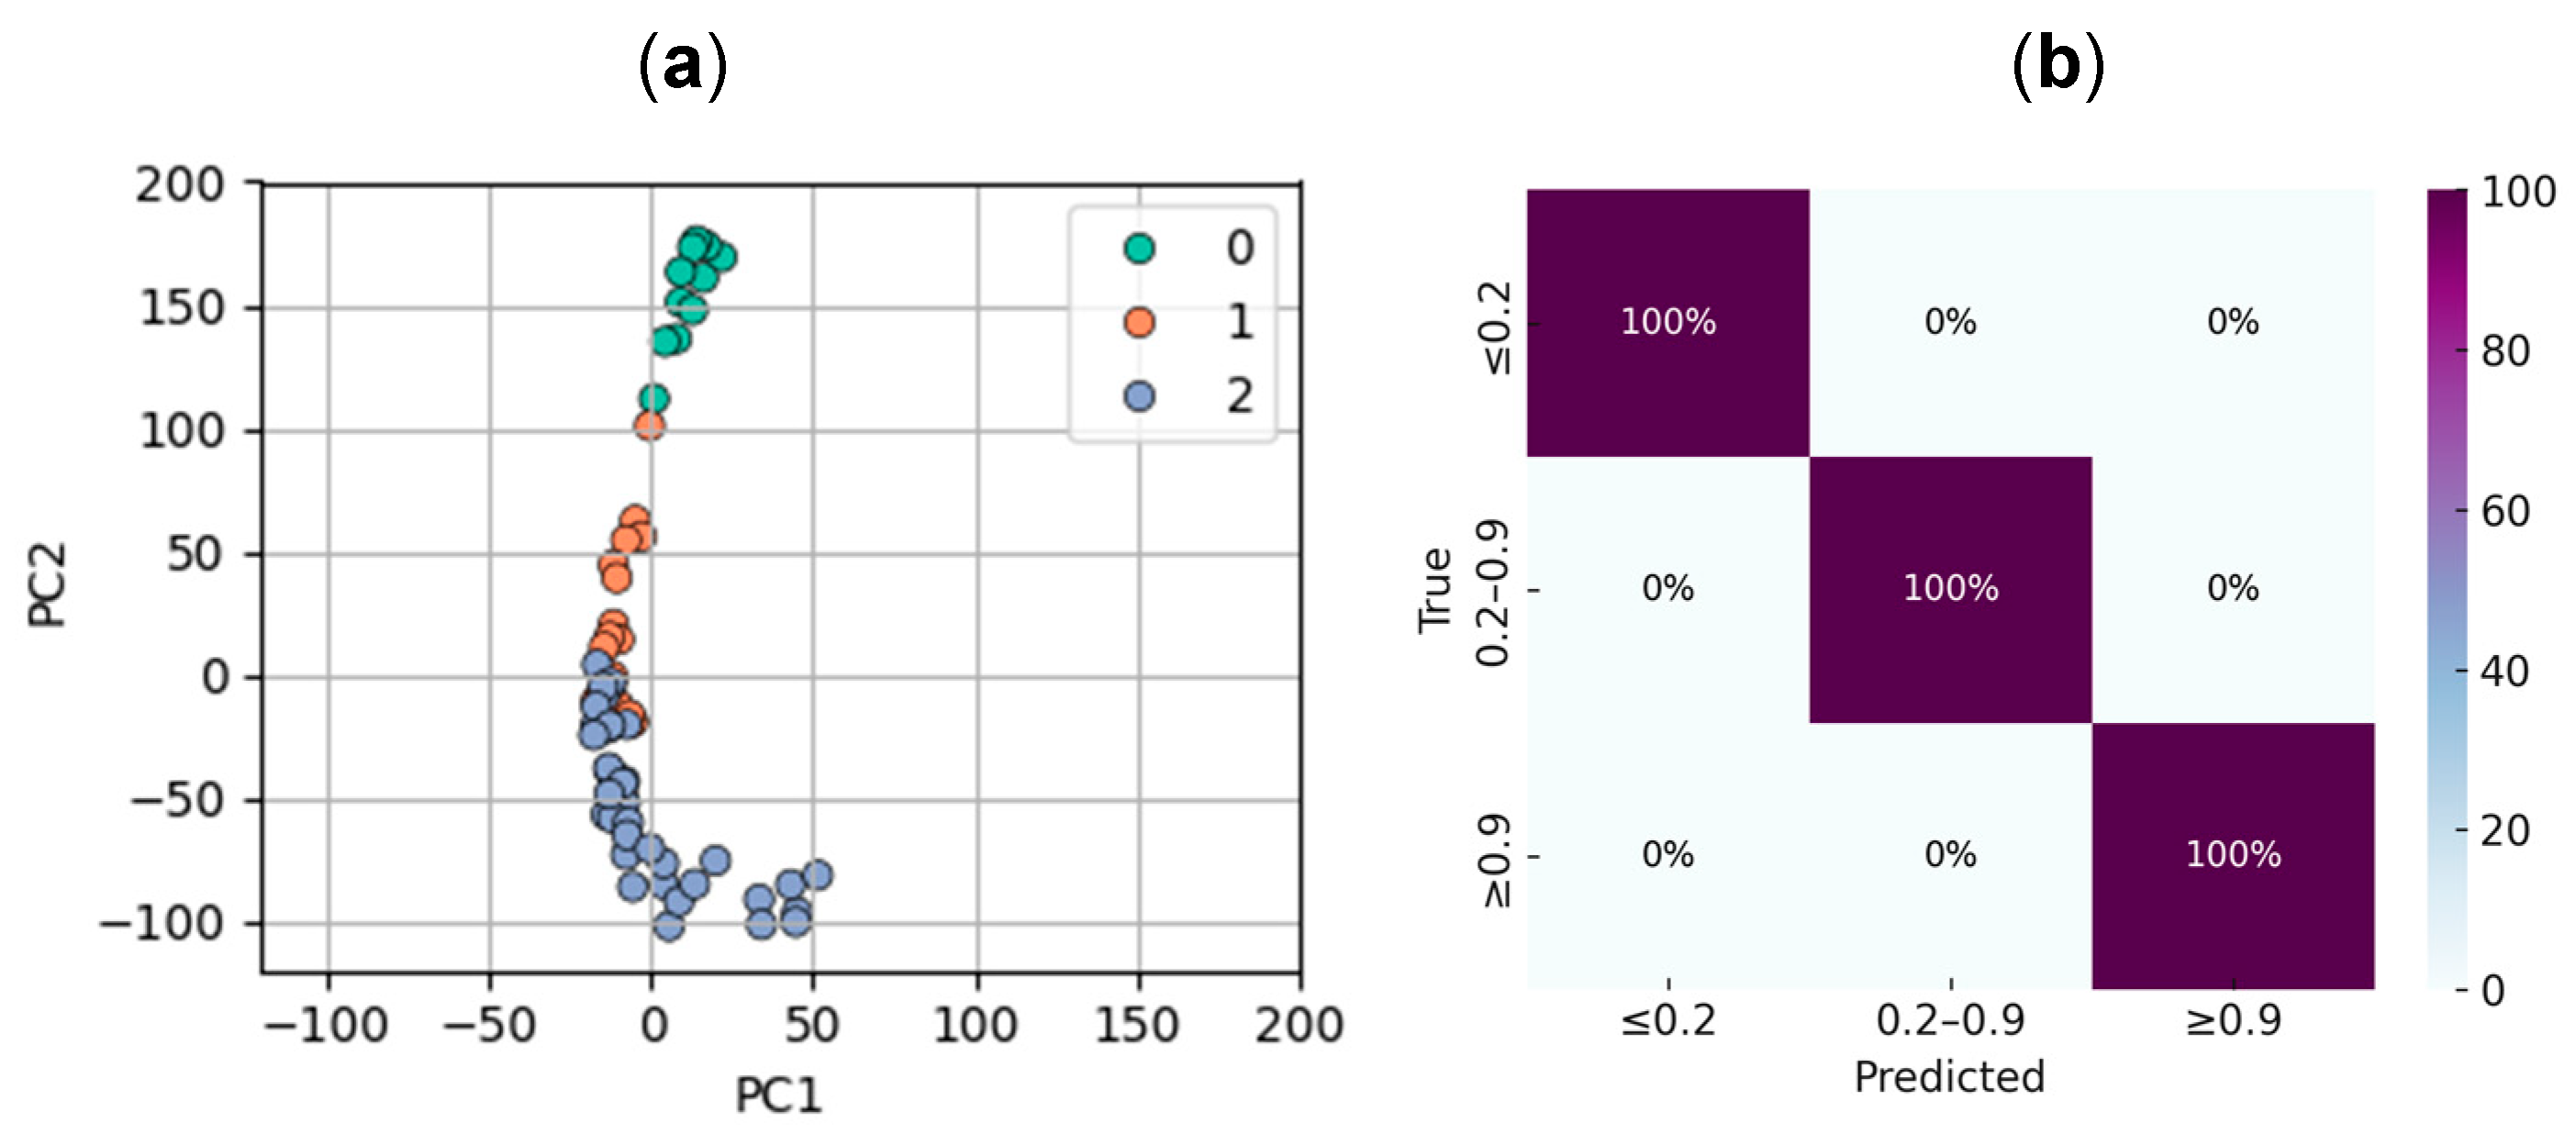
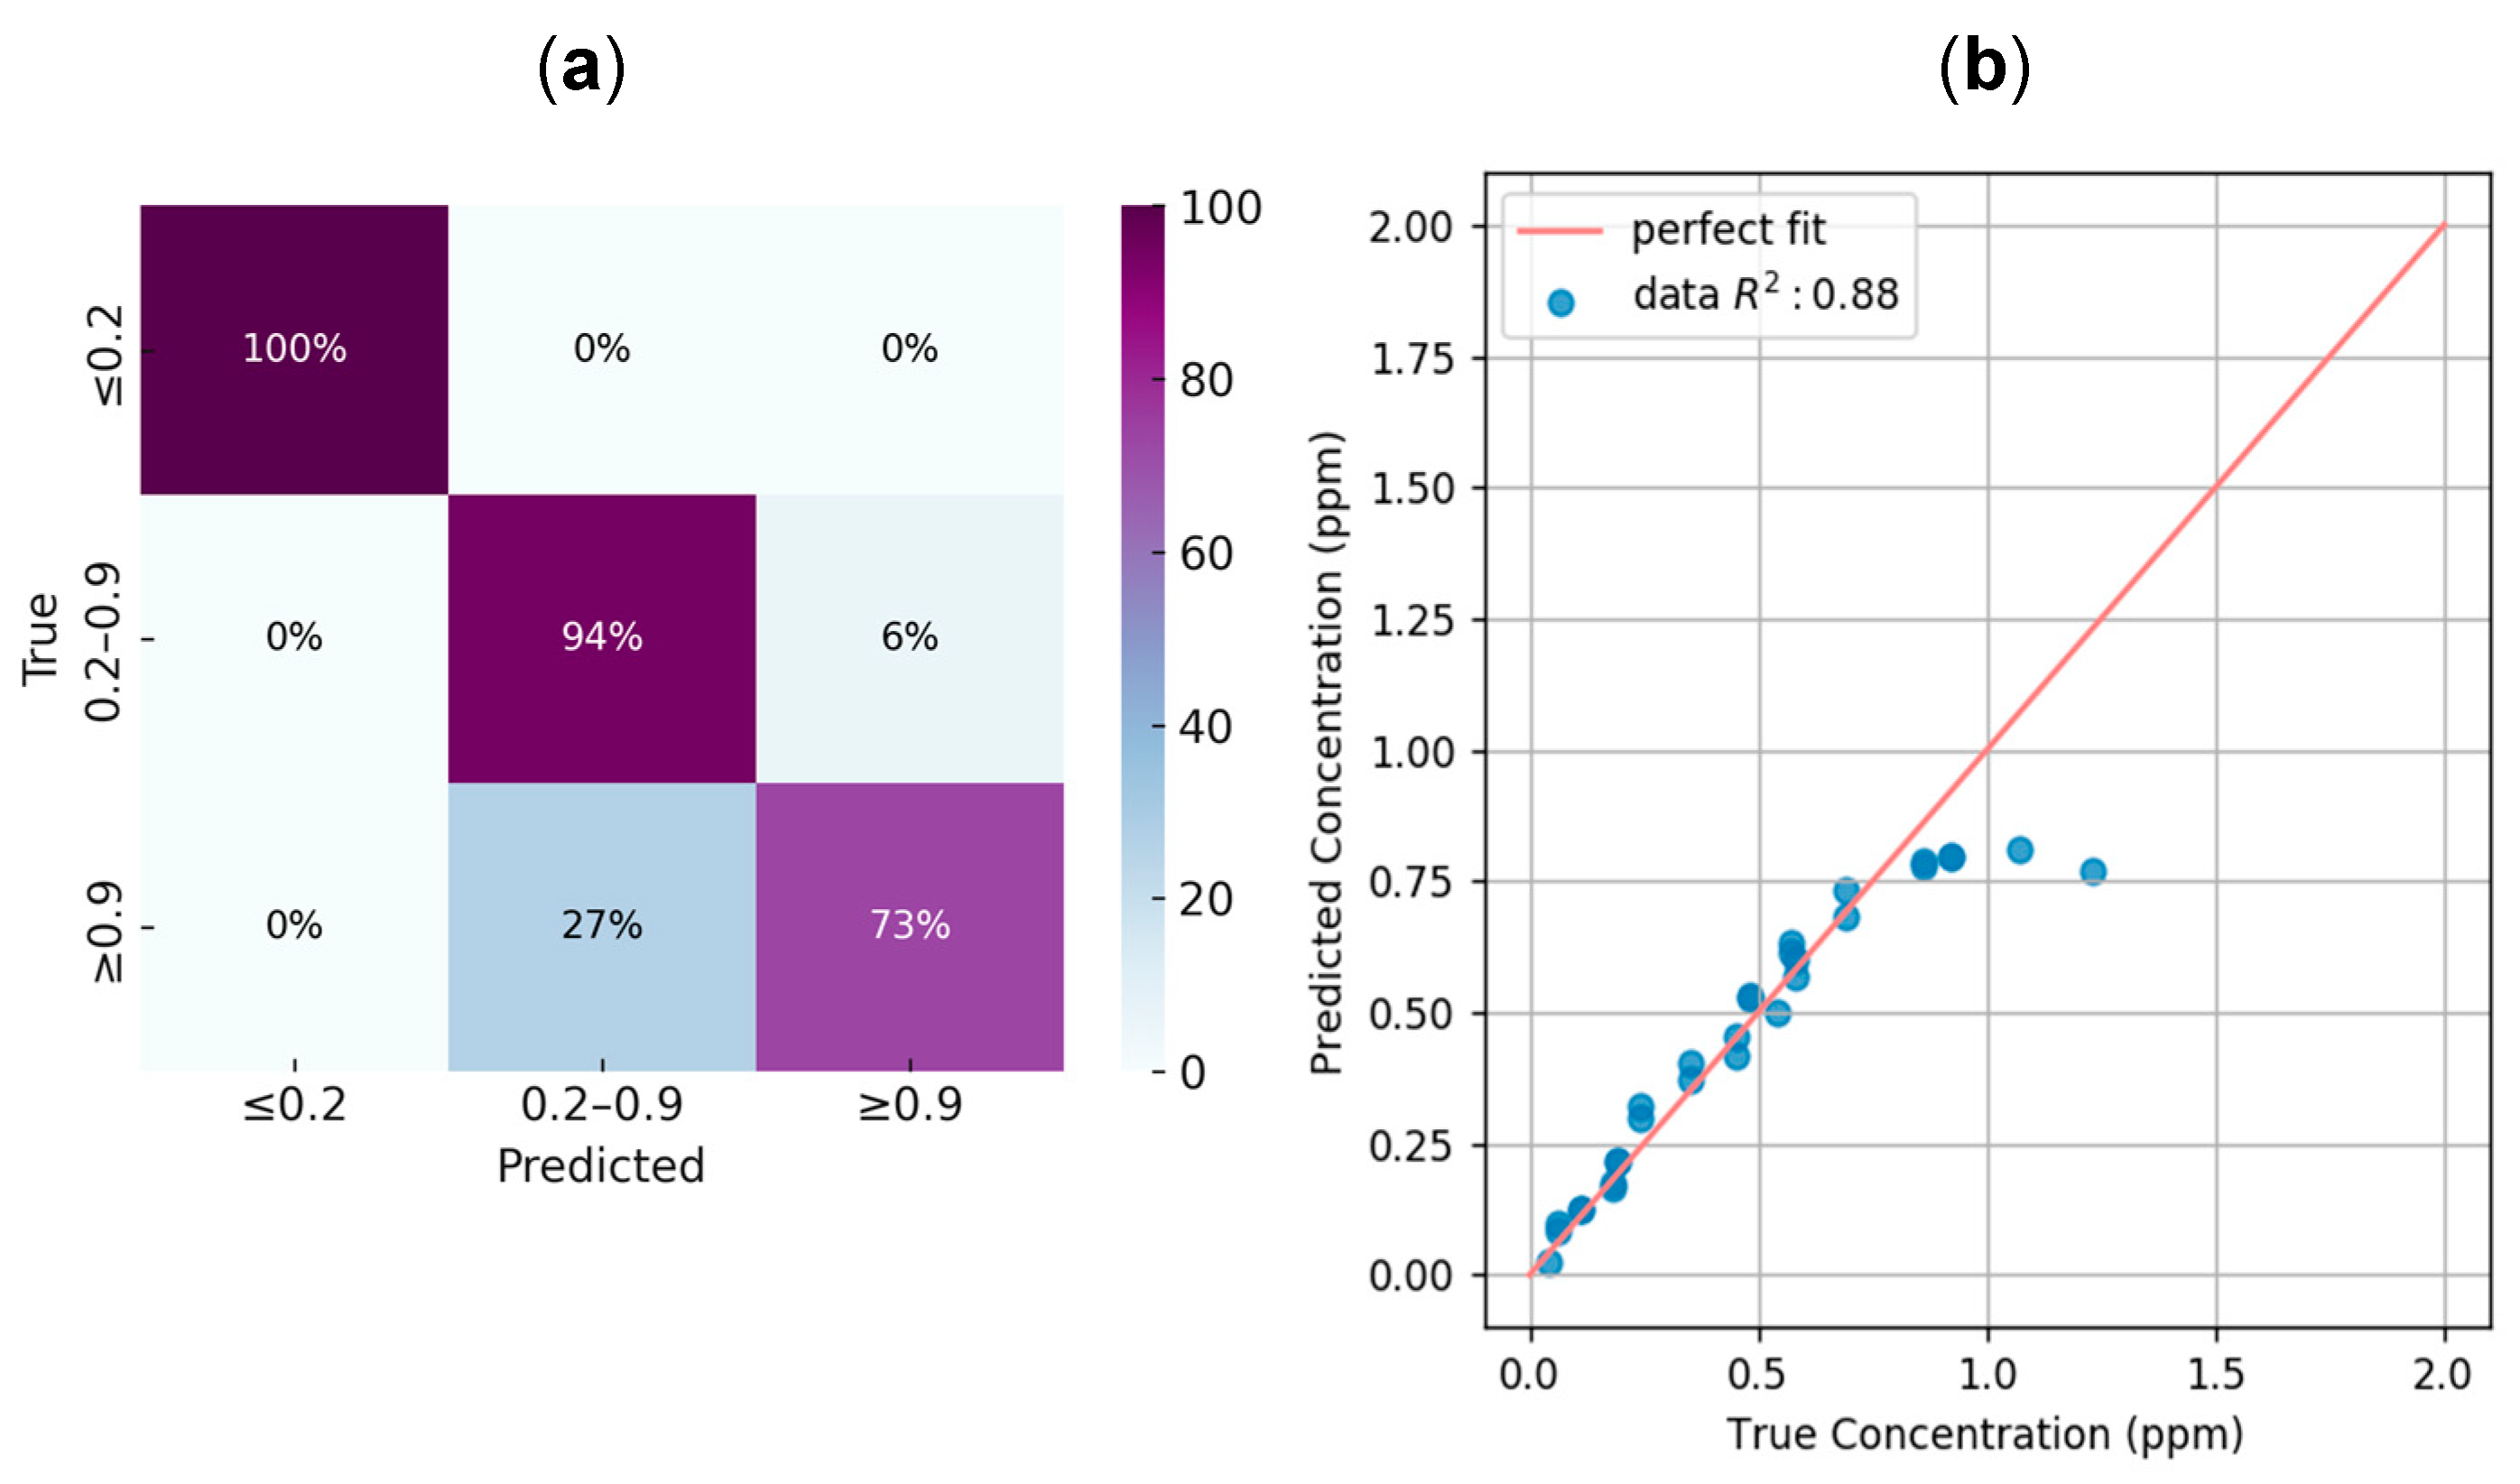
- Low concentration: ≤0.2 ppm
- Acceptable range: 0.2–0.9 ppm
- Excess chlorine: ≥0.9 ppm
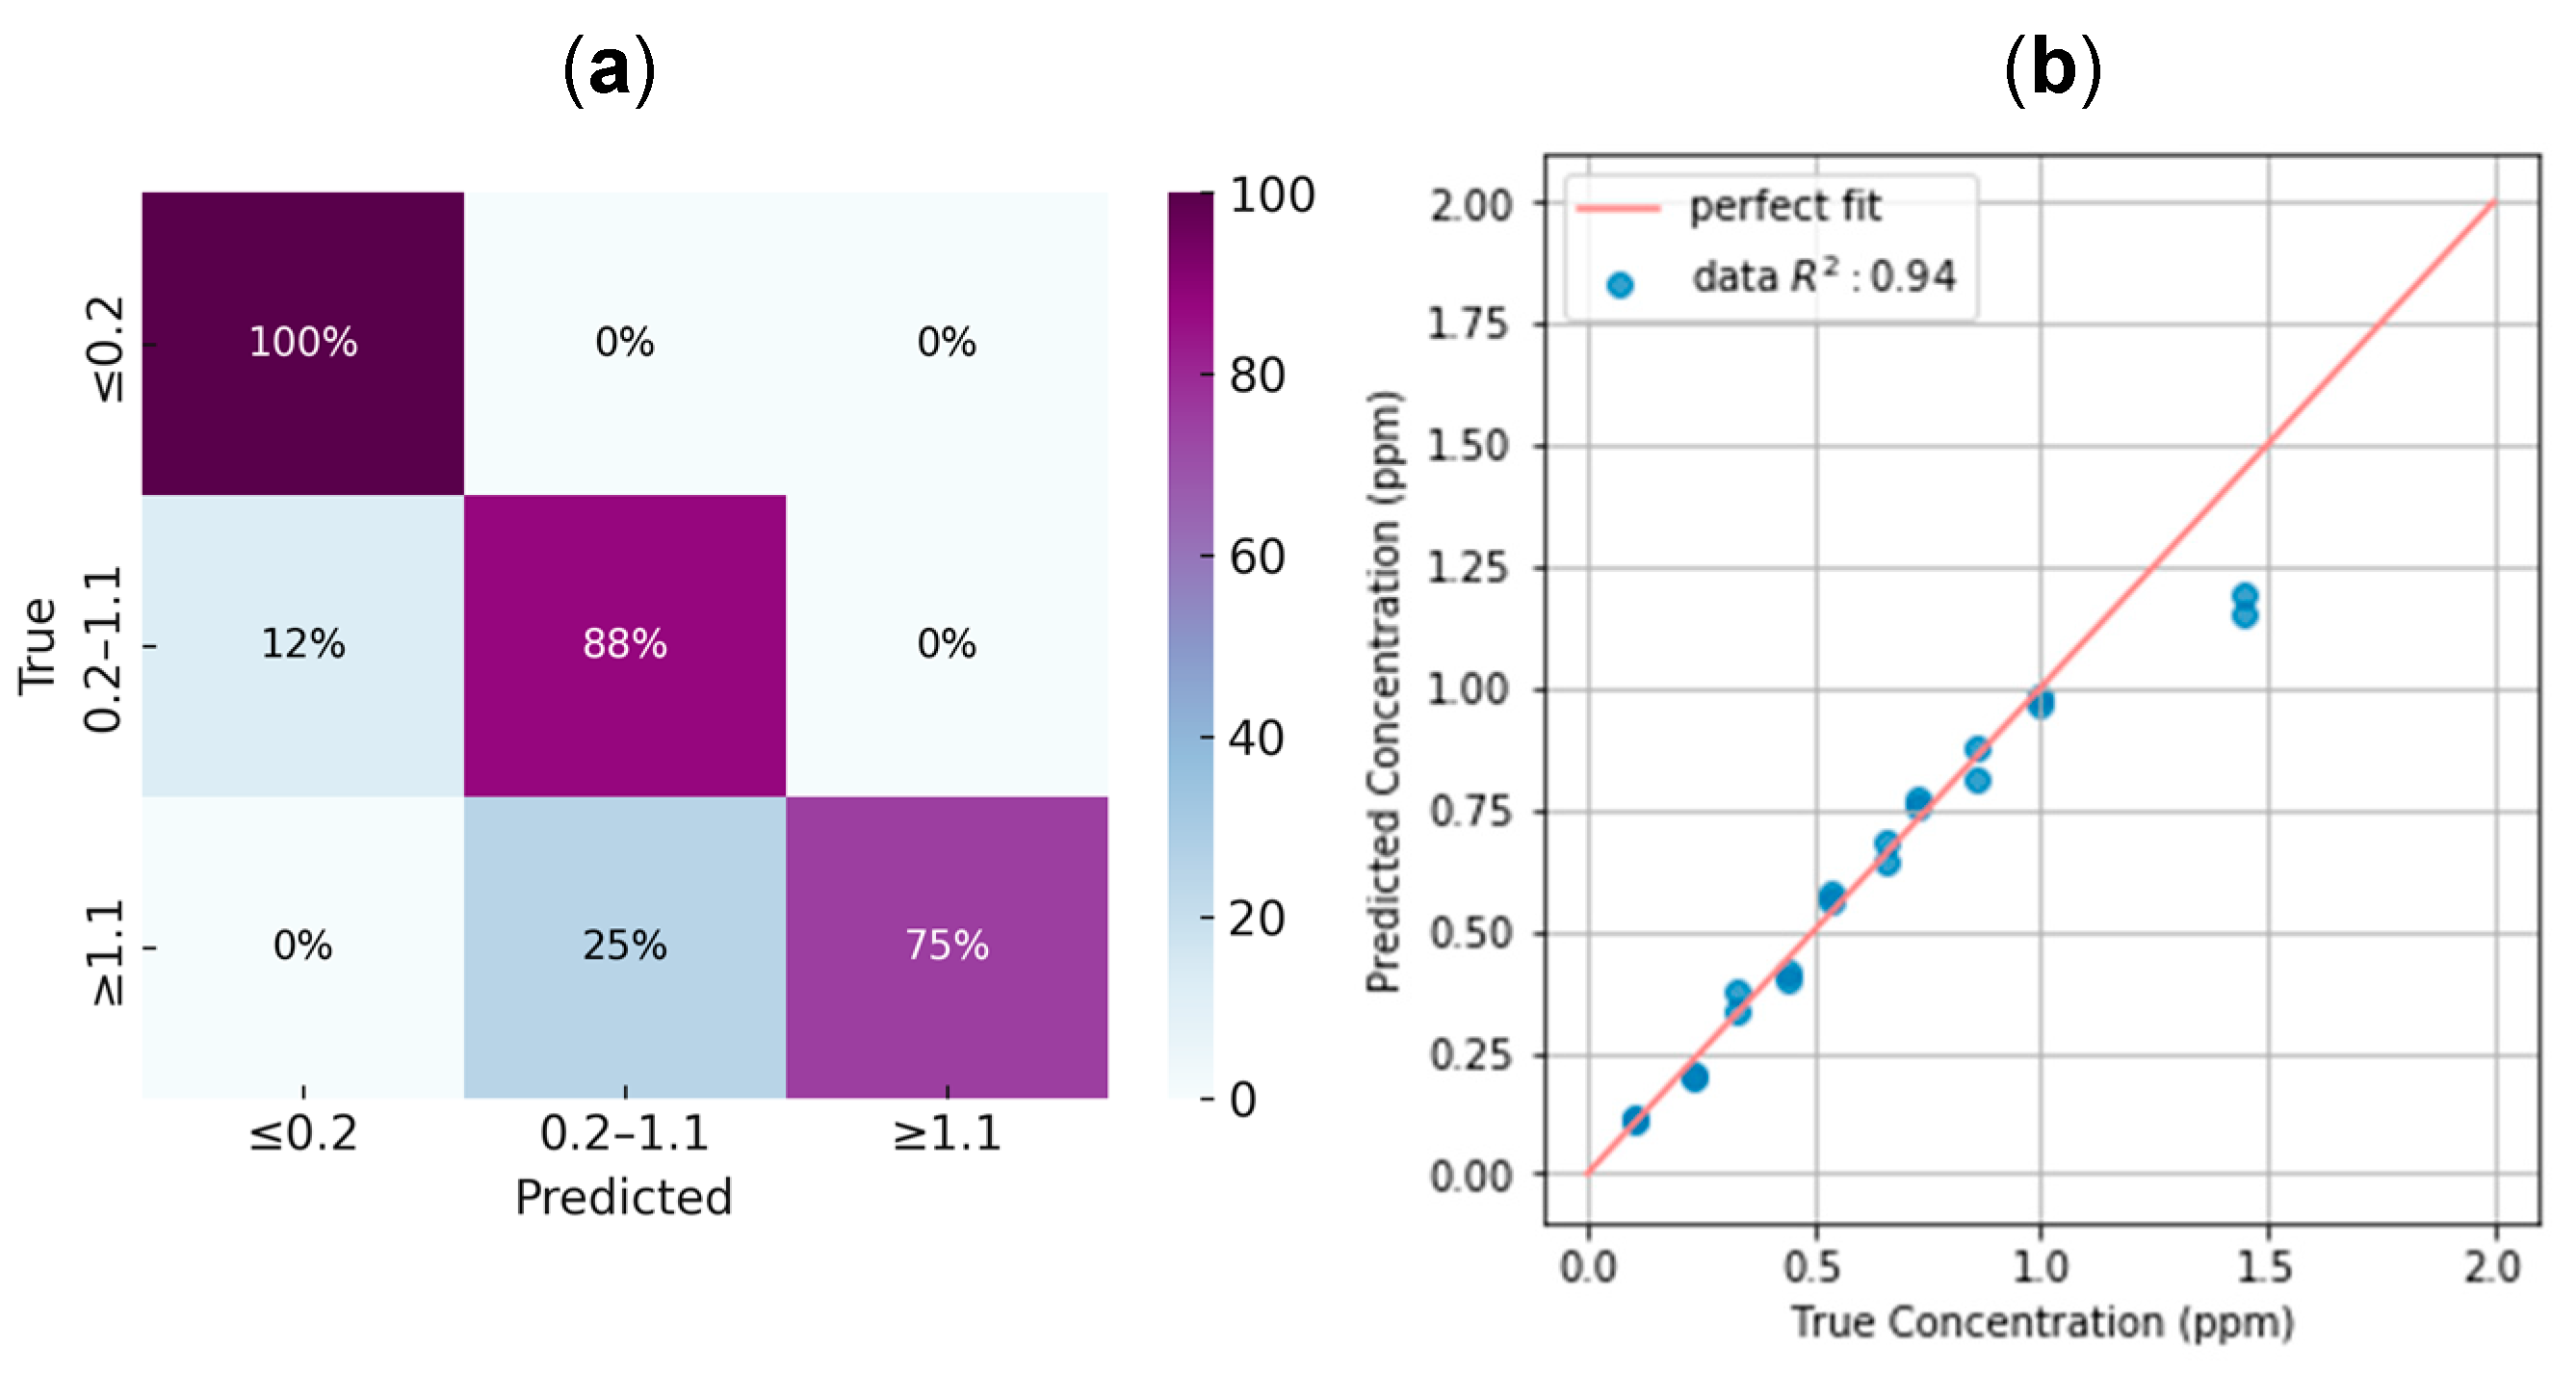
- Low concentration: ≤0.2 ppm
- Acceptable range: 0.2–1.1 ppm
- Excess chlorine: ≥1.1 ppm
3. Results and Discussion
3.1. BTP Strip Method
3.2. DPD Powder Method
3.3. Smartphone Application
4. Conclusions
Author Contributions
Funding
Institutional Review Board Statement
Informed Consent Statement
Data Availability Statement
Conflicts of Interest
References
- European Parliament and Council of the European Union Regulation (EC) No 852/2004 of the European Parliament and of the Council of 29 April 2004 on the Hygiene of Foodstuffs 2004; European Union: Brussels, Belgium, 2004.
- Codex Alimentarius Commission Hazard Analysis and Critical Control Point (HACCP) System and Guidelines for Its Application; Food and Agriculture Organization of the United Nations (FAO): Rome, Italy, 2020.
- Sivakumar, R.; Lee, N.Y. Recent Progress in Smartphone-Based Techniques for Food Safety and the Detection of Heavy Metal Ions in Environmental Water. Chemosphere 2021, 275, 130096. [Google Scholar] [CrossRef] [PubMed]
- Shang, J.; Yu, L.; Sun, Y.; Chen, X.; Kang, Q.; Shen, D. On Site Determination of Free Chlorine in Water Samples by a Smartphone-Based Colorimetric Device with Improved Sensitivity and Reliability. New J. Chem. 2019, 43, 14409–14416. [Google Scholar] [CrossRef]
- Alberti, G.; Magnaghi, L.R.; Iurato, M.; Zanoni, C.; Biesuz, R. Colorimetric Paper-Based Analytical Devices (PADs) Backed by Chemometrics for Pd(II) Detection. Sensors 2023, 23, 7425. [Google Scholar] [CrossRef] [PubMed]
- Driau, C.; Fàbrega, C.; Benito-Altamirano, I.; Pfeiffer, P.; Casals, O.; Li, H.; Prades, J.D. How to Implement a Selective Colorimetric Gas Sensor with off the Shelf Components? Sens. Actuators B Chem. 2019, 293, 41–44. [Google Scholar] [CrossRef]
- Benito-Altamirano, I.; Martínez-Carpena, D.; Casals, O.; Fábrega, C.; Waag, A.; Prades, J.D. Back-Compatible Color QR Codes for Colorimetric Applications. Pattern Recognit. 2023, 133, 108981. [Google Scholar] [CrossRef]
- Benito-Altamirano, I.; Martínez-Carpena, D.; Lizarzaburu-Aguilar, H.; Fàbrega, C.; Prades, J.D. Reading QR Codes on Challenging Surfaces Using Thin-Plate Splines. Pattern Recognit. Lett. 2024, 184, 37–43. [Google Scholar] [CrossRef]
- Skurowski, P.; Nurzyńska, K.; Pawlyta, M.; Cyran, K.A. Performance of QR Code Detectors near Nyquist Limits. Sensors 2022, 22, 7230. [Google Scholar] [CrossRef] [PubMed]
- Yang, S.-Y.; Jan, H.-C.; Chen, C.-Y.; Wang, M.-S. CNN-Based QR Code Reading of Package for Unmanned Aerial Vehicle. Sensors 2023, 23, 4707. [Google Scholar] [CrossRef] [PubMed]
- Janudin, N.; Kasim, N.A.M.; Knight, V.F.; Halim, N.A.; Noor, S.A.M.; Ong, K.K.; Yunus, W.M.Z.W.; Norrrahim, M.N.F.; Misenan, M.S.M.; Razak, M.A.I.A.; et al. Sensing Techniques on Determination of Chlorine Gas and Free Chlorine in Water. J. Sens. 2022, 2022, 1898417. [Google Scholar] [CrossRef]
- Menesatti, P.; Angelini, C.; Pallottino, F.; Antonucci, F.; Aguzzi, J.; Costa, C. RGB Color Calibration for Quantitative Image Analysis: The “3D Thin-Plate Spline” Warping Approach. Sensors 2012, 12, 7063–7079. [Google Scholar] [CrossRef] [PubMed]
- Benito-Altamirano, I.; Martínez-Carpena, D.; Lizarzaburu-Aguilar, H.; Ventura, C.; Fàbrega, C.; Prades, J.D. Image Color Consistency in Datasets: The Smooth-TPS3D Method. arXiv 2024, arXiv:2409.05159. [Google Scholar]
- Pedregosa, F.; Varoquaux, G.; Gramfort, A.; Michel, V.; Thirion, B.; Grisel, O.; Blondel, M.; Müller, A.; Nothman, J.; Louppe, G.; et al. Scikit-Learn: Machine Learning in Python. arXiv 2012. [Google Scholar] [CrossRef]
- Bradski, G. The OpenCV Library. Dr. Dobb’s J. Softw. Tools 2000, 25, 120–123. [Google Scholar]
- Harris, C.R.; Millman, K.J.; van der Walt, S.J.; Gommers, R.; Virtanen, P.; Cournapeau, D.; Wieser, E.; Taylor, J.; Berg, S.; Smith, N.J.; et al. Array Programming with NumPy. Nature 2020, 585, 357–362. [Google Scholar] [CrossRef] [PubMed]
- Benito-Altamirano, I.; Engel, L.; Crugeira, F.; Marchena, M.; Wöllenstein, J.; Prades, J.D.; Fàbrega, C. Reading Dye-Based Colorimetric Inks: Achieving Color Consistency Using Color QR Codes. Chemosensors 2024, 12, 260. [Google Scholar] [CrossRef]
- Viola, P.; Jones, M. Rapid Object Detection Using a Boosted Cascade of Simple Features. In Proceedings of the 2001 IEEE Computer Society Conference on Computer Vision and Pattern Recognition, Kauai, HI, USA, 8–14 December 2001; pp. I–511–I–518. [Google Scholar]
- Hunt, R.W.G. The Reproduction of Colour, 6th ed.; John Wiley & Sons: Chichester, UK, 2004; ISBN 978-0-470-02425-6. [Google Scholar]
- Almeida, A.J.; Ribeiro, A.P.; Martins, R.D.; Ferreira, M.R.; Proença, J.F. How to Encourage the Consumption of Tap Water: A Case Study on Águas Do Porto. In Case Studies on Social Marketing: A Global Perspective; Galan-Ladero, M.M., Alves, H.M., Eds.; Springer International Publishing: Cham, Switzerland, 2019; pp. 123–132. ISBN 978-3-030-04843-3. [Google Scholar]
- Domènech-Gil, G.; Duc, N.T.; Wikner, J.J.; Eriksson, J.; Påledal, S.N.; Puglisi, D.; Bastviken, D. Electronic Nose for Improved Environmental Methane Monitoring. Environ. Sci. Technol. 2024, 58, 352–361. [Google Scholar] [CrossRef] [PubMed]
- Bianco, S.; Cusano, C.; Napoletano, P.; Schettini, R. Improving CNN-Based Texture Classification by Color Balancing. J. Imaging 2017, 3, 33. [Google Scholar] [CrossRef]
- Gil Rodríguez, R.; Vazquez-Corral, J.; Bertalmío, M.; Finlayson, G.D. Color Matching in the Wild. Pattern Recognit. 2024, 154, 110575. [Google Scholar] [CrossRef]


| Variable | Value | Sample Size |
|---|---|---|
| Commercial test | BTB strip, DPD powder | 2 |
| Chlorine Concentration (Hach, w/o dilution) | 0 to 2.2 ppm | 65 |
| Chlorine Concentration (Hach, with dilution) | 2.2 to 8.4 ppm | 7 |
| Illumination (Hue Lights) | 2500, 3000, 3500, 4000, 4500, 5000, 5500, 6000, 6500 K | 9 |
| Mobile Device | Huawei P20 | 1 |
| Variable | Value | Sample Size |
|---|---|---|
| Commercial test | BTB strip, DPD powder | 2 |
| Chlorine Concentration (Hach, w/o dilution) | 0 to 2.2 ppm | 65 |
| Chlorine Concentration (Hach, with dilution) | 2.2 to 8.4 ppm | 7 |
| Illumination (Room) | ~4500 K | 1 |
| Flash * | Yes, No | 2 |
| Mobile Device | Huawei P20, Xiaomi A2, Motorola G6, iPhone SE ** | 4 |
| Smartphone | Flash | Classification (Accuracy %) | Regression (R2) |
|---|---|---|---|
| Huawei P20 | No | 88.1 | 0.88 |
| Huawei P20 | Yes | 92.5 | 0.82 |
| iPhone SE | No | 91.3 | 0.87 |
| iPhone SE | Yes | 95.8 | 0.79 |
| Motorola G6 | No | 87.0 | 0.78 |
| Motorola G6 | Yes | 96.6 | 0.80 |
| Xiaomi A2 | No | 100.0 | 0.96 |
| Xiaomi A2 | Yes | 94.7 | 0.79 |
| Smartphone | Classification (Accuracy %) | Regression (R2) |
|---|---|---|
| Huawei P20 | 88.1 | 0.94 |
| Motorola G6 | 100.0 | 0.82 |
| Xiaomi A2 | 90.0 | 0.91 |
Disclaimer/Publisher’s Note: The statements, opinions and data contained in all publications are solely those of the individual author(s) and contributor(s) and not of MDPI and/or the editor(s). MDPI and/or the editor(s) disclaim responsibility for any injury to people or property resulting from any ideas, methods, instructions or products referred to in the content. |
© 2025 by the authors. Licensee MDPI, Basel, Switzerland. This article is an open access article distributed under the terms and conditions of the Creative Commons Attribution (CC BY) license (https://creativecommons.org/licenses/by/4.0/).
Share and Cite
González-Gómez, M.; Benito-Altamirano, I.; Lizarzaburu-Aguilar, H.; Martínez-Carpena, D.; Prades, J.D.; Fàbrega, C. Color QR Codes for Smartphone-Based Analysis of Free Chlorine in Drinking Water. Sensors 2025, 25, 3251. https://doi.org/10.3390/s25113251
González-Gómez M, Benito-Altamirano I, Lizarzaburu-Aguilar H, Martínez-Carpena D, Prades JD, Fàbrega C. Color QR Codes for Smartphone-Based Analysis of Free Chlorine in Drinking Water. Sensors. 2025; 25(11):3251. https://doi.org/10.3390/s25113251
Chicago/Turabian StyleGonzález-Gómez, María, Ismael Benito-Altamirano, Hanna Lizarzaburu-Aguilar, David Martínez-Carpena, Joan Daniel Prades, and Cristian Fàbrega. 2025. "Color QR Codes for Smartphone-Based Analysis of Free Chlorine in Drinking Water" Sensors 25, no. 11: 3251. https://doi.org/10.3390/s25113251
APA StyleGonzález-Gómez, M., Benito-Altamirano, I., Lizarzaburu-Aguilar, H., Martínez-Carpena, D., Prades, J. D., & Fàbrega, C. (2025). Color QR Codes for Smartphone-Based Analysis of Free Chlorine in Drinking Water. Sensors, 25(11), 3251. https://doi.org/10.3390/s25113251