
Black Phosphorus–Tungsten Oxide Sandwich-like Nanostructures for Highly Selective NO2 Detection


Abstract
1. Introduction
2. Materials and Methods
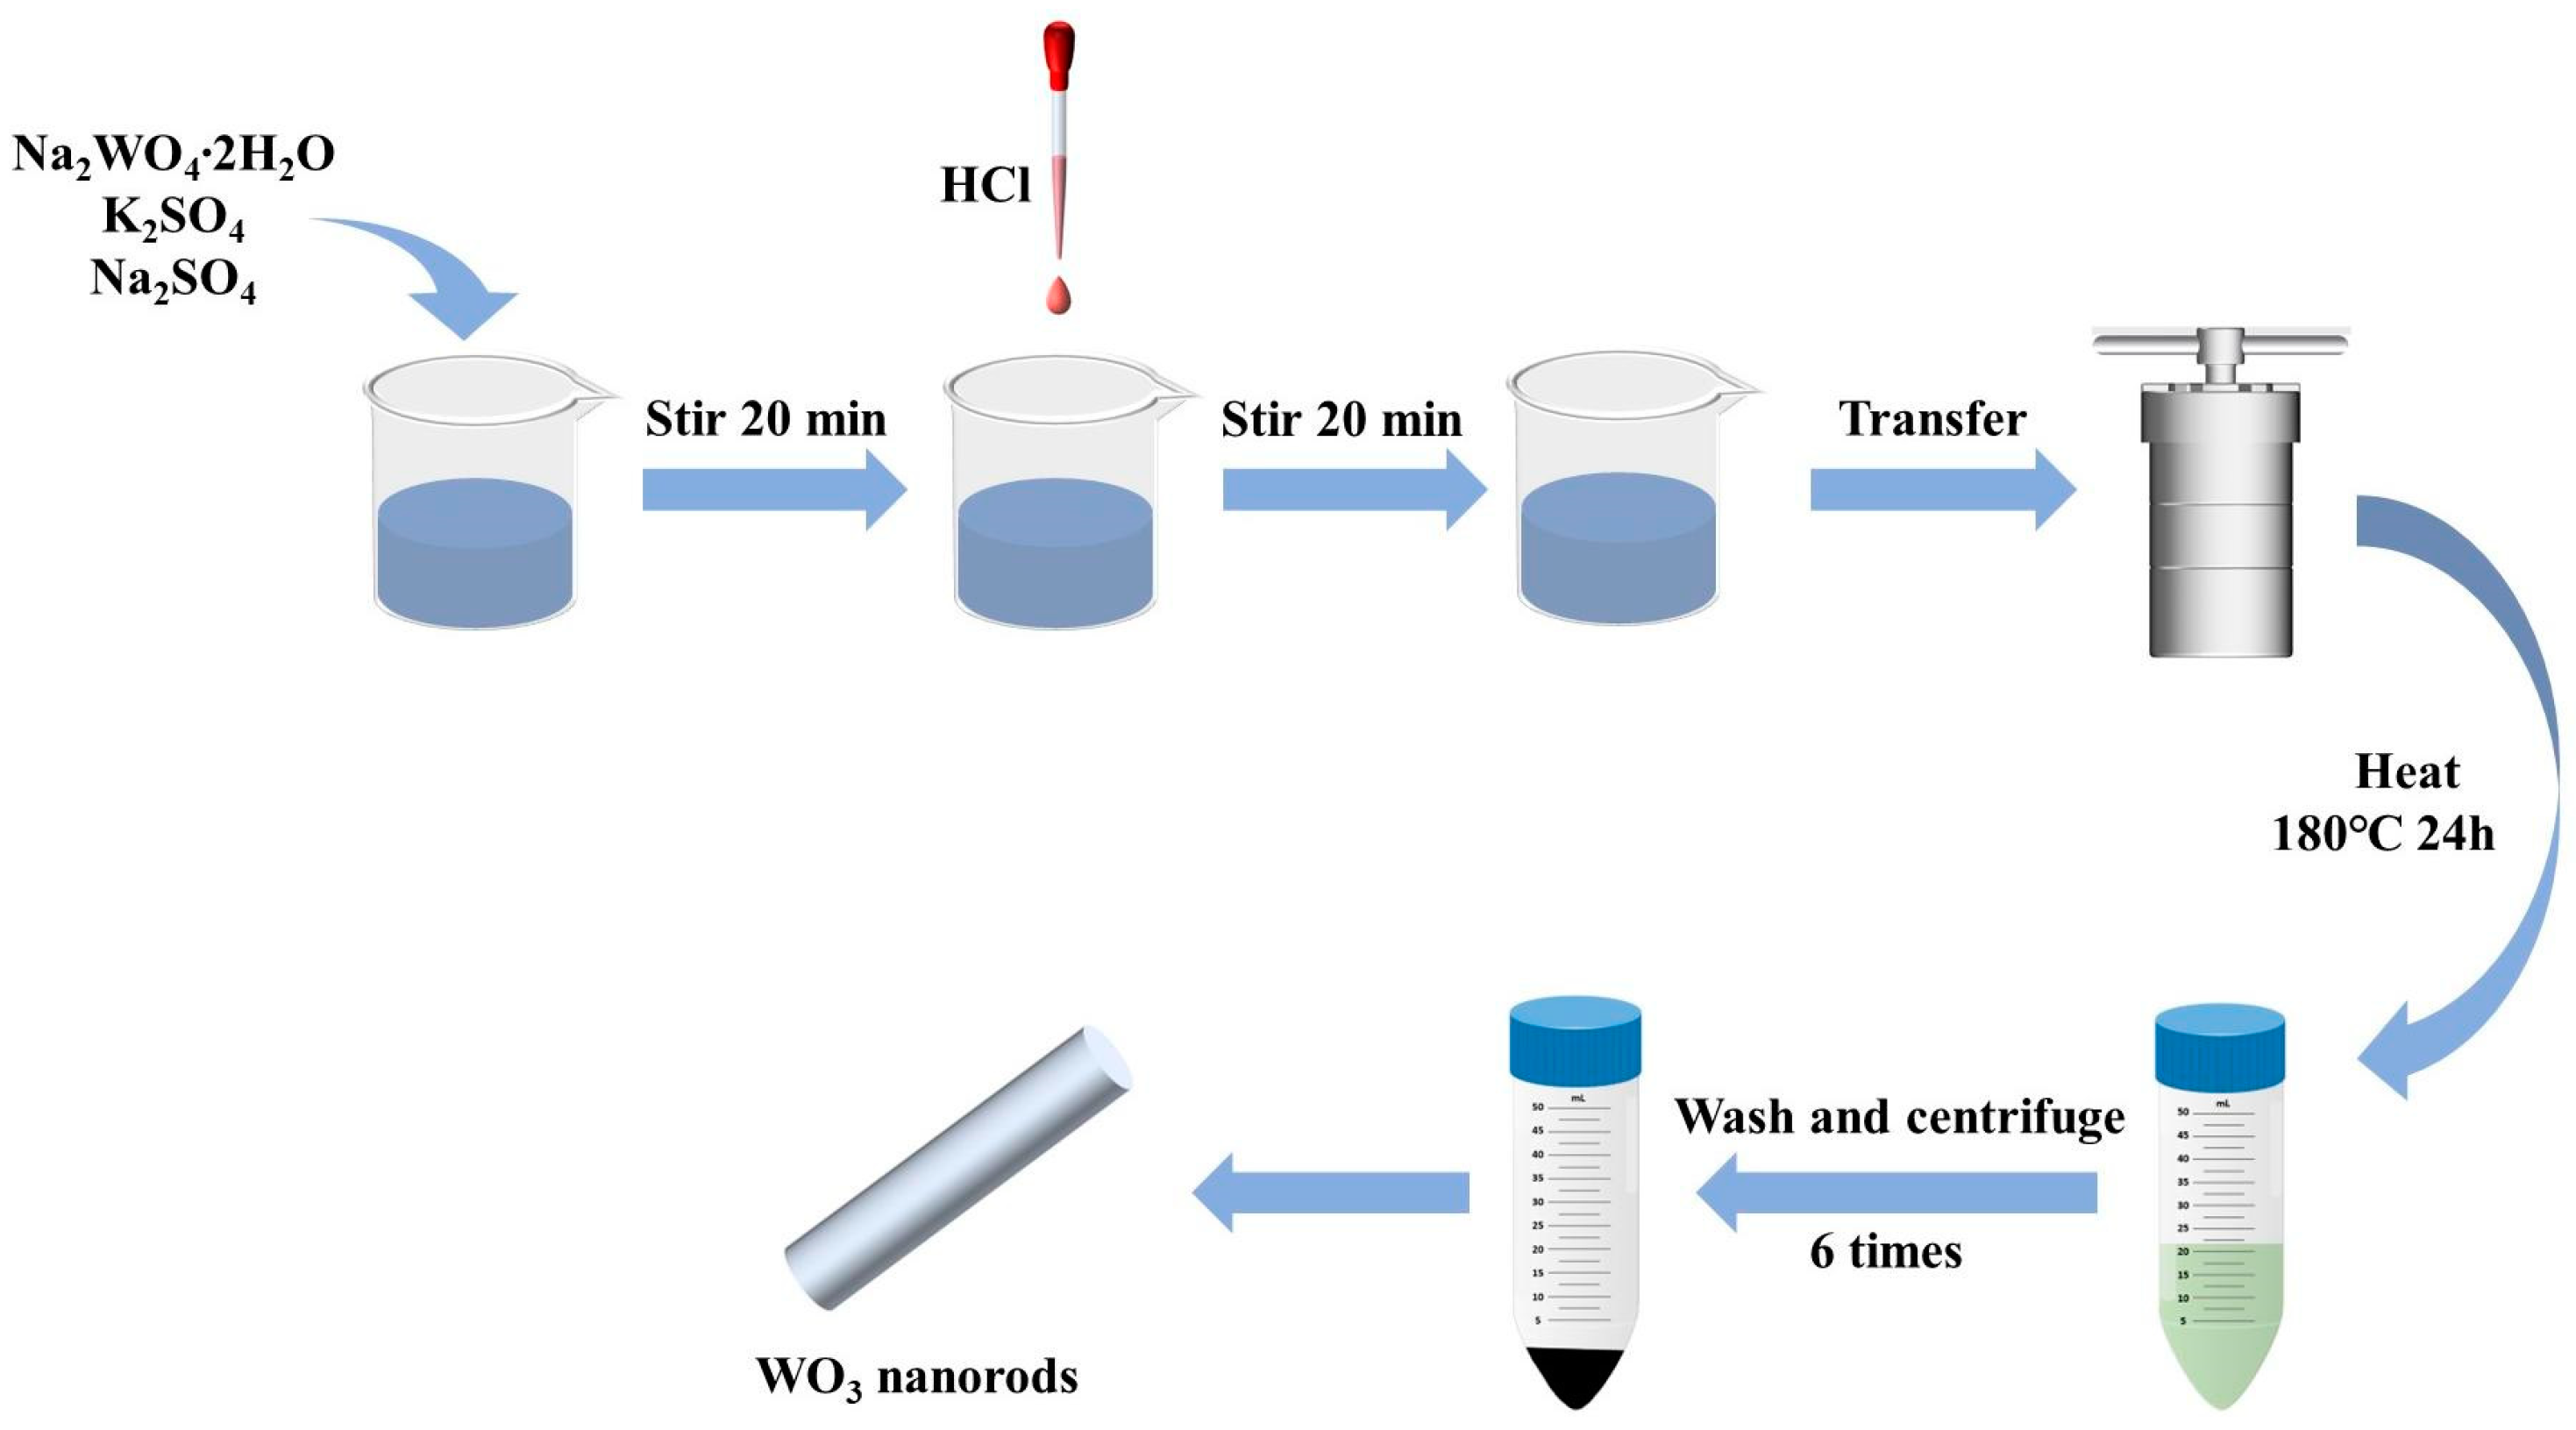
2.1. Preparation of Sensing Materials
2.2. Characterization of Sensing Materials
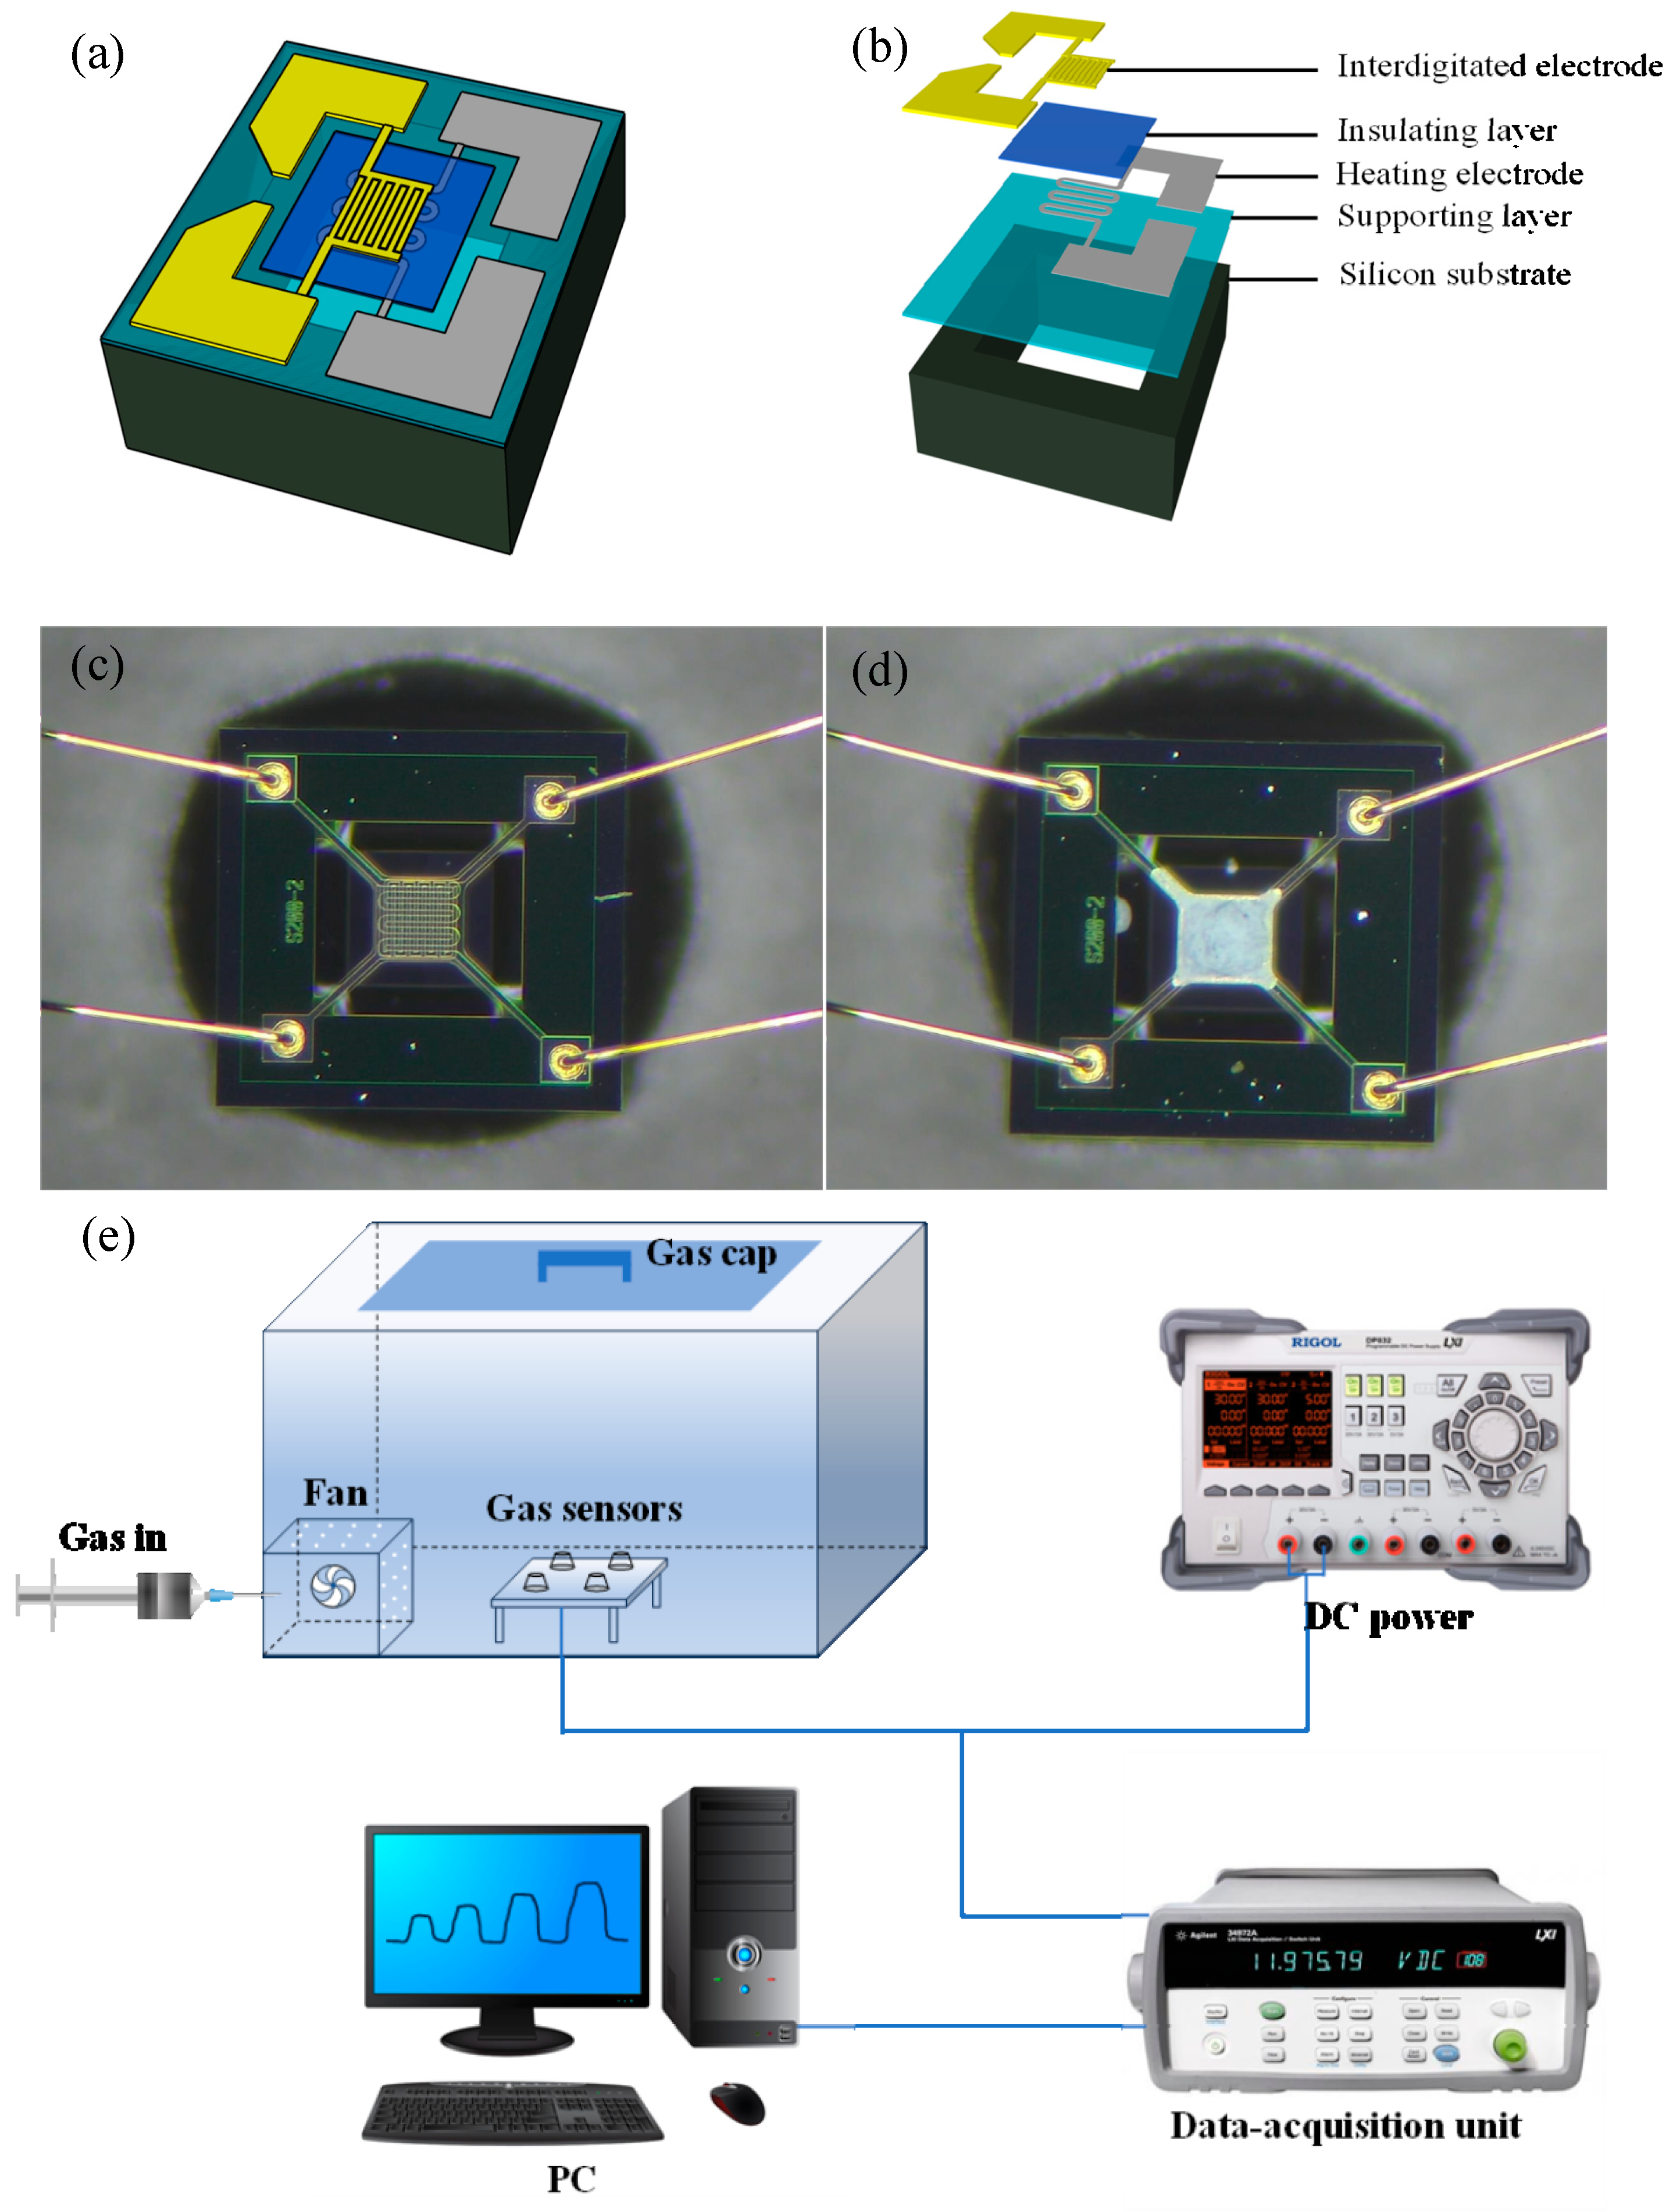
2.3. Test Platform for Gas Sensing
3. Results and Discussion
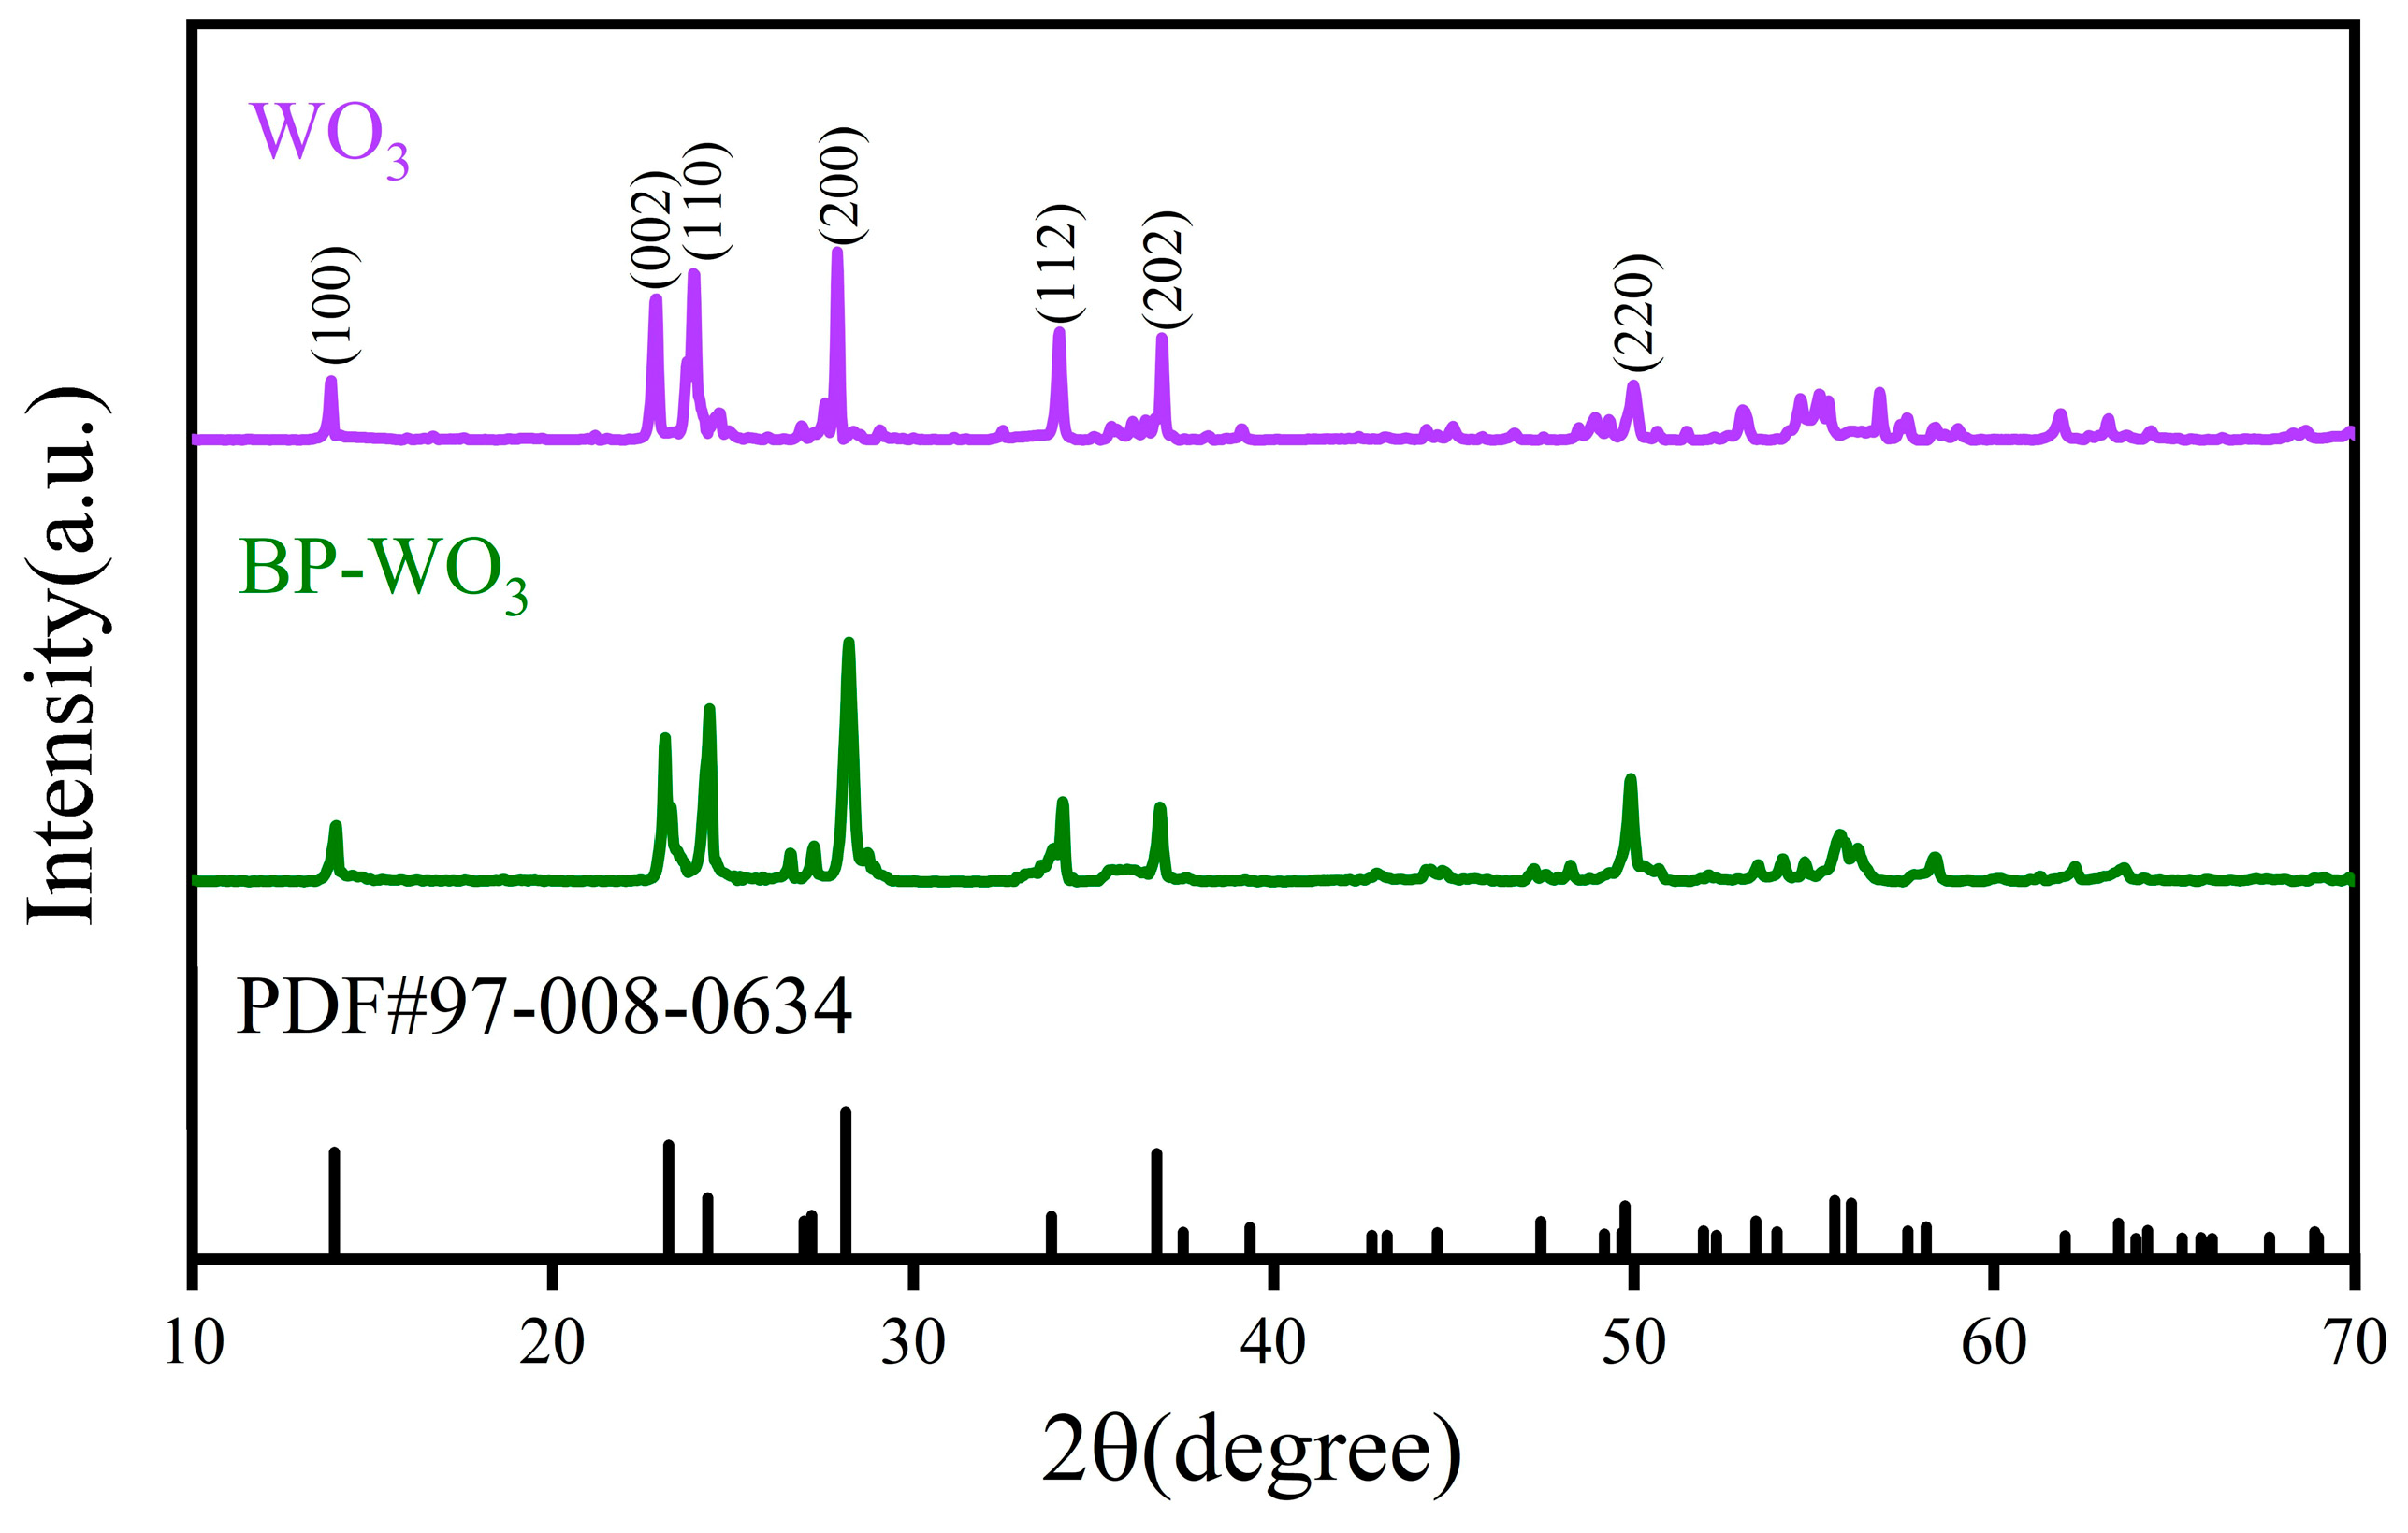
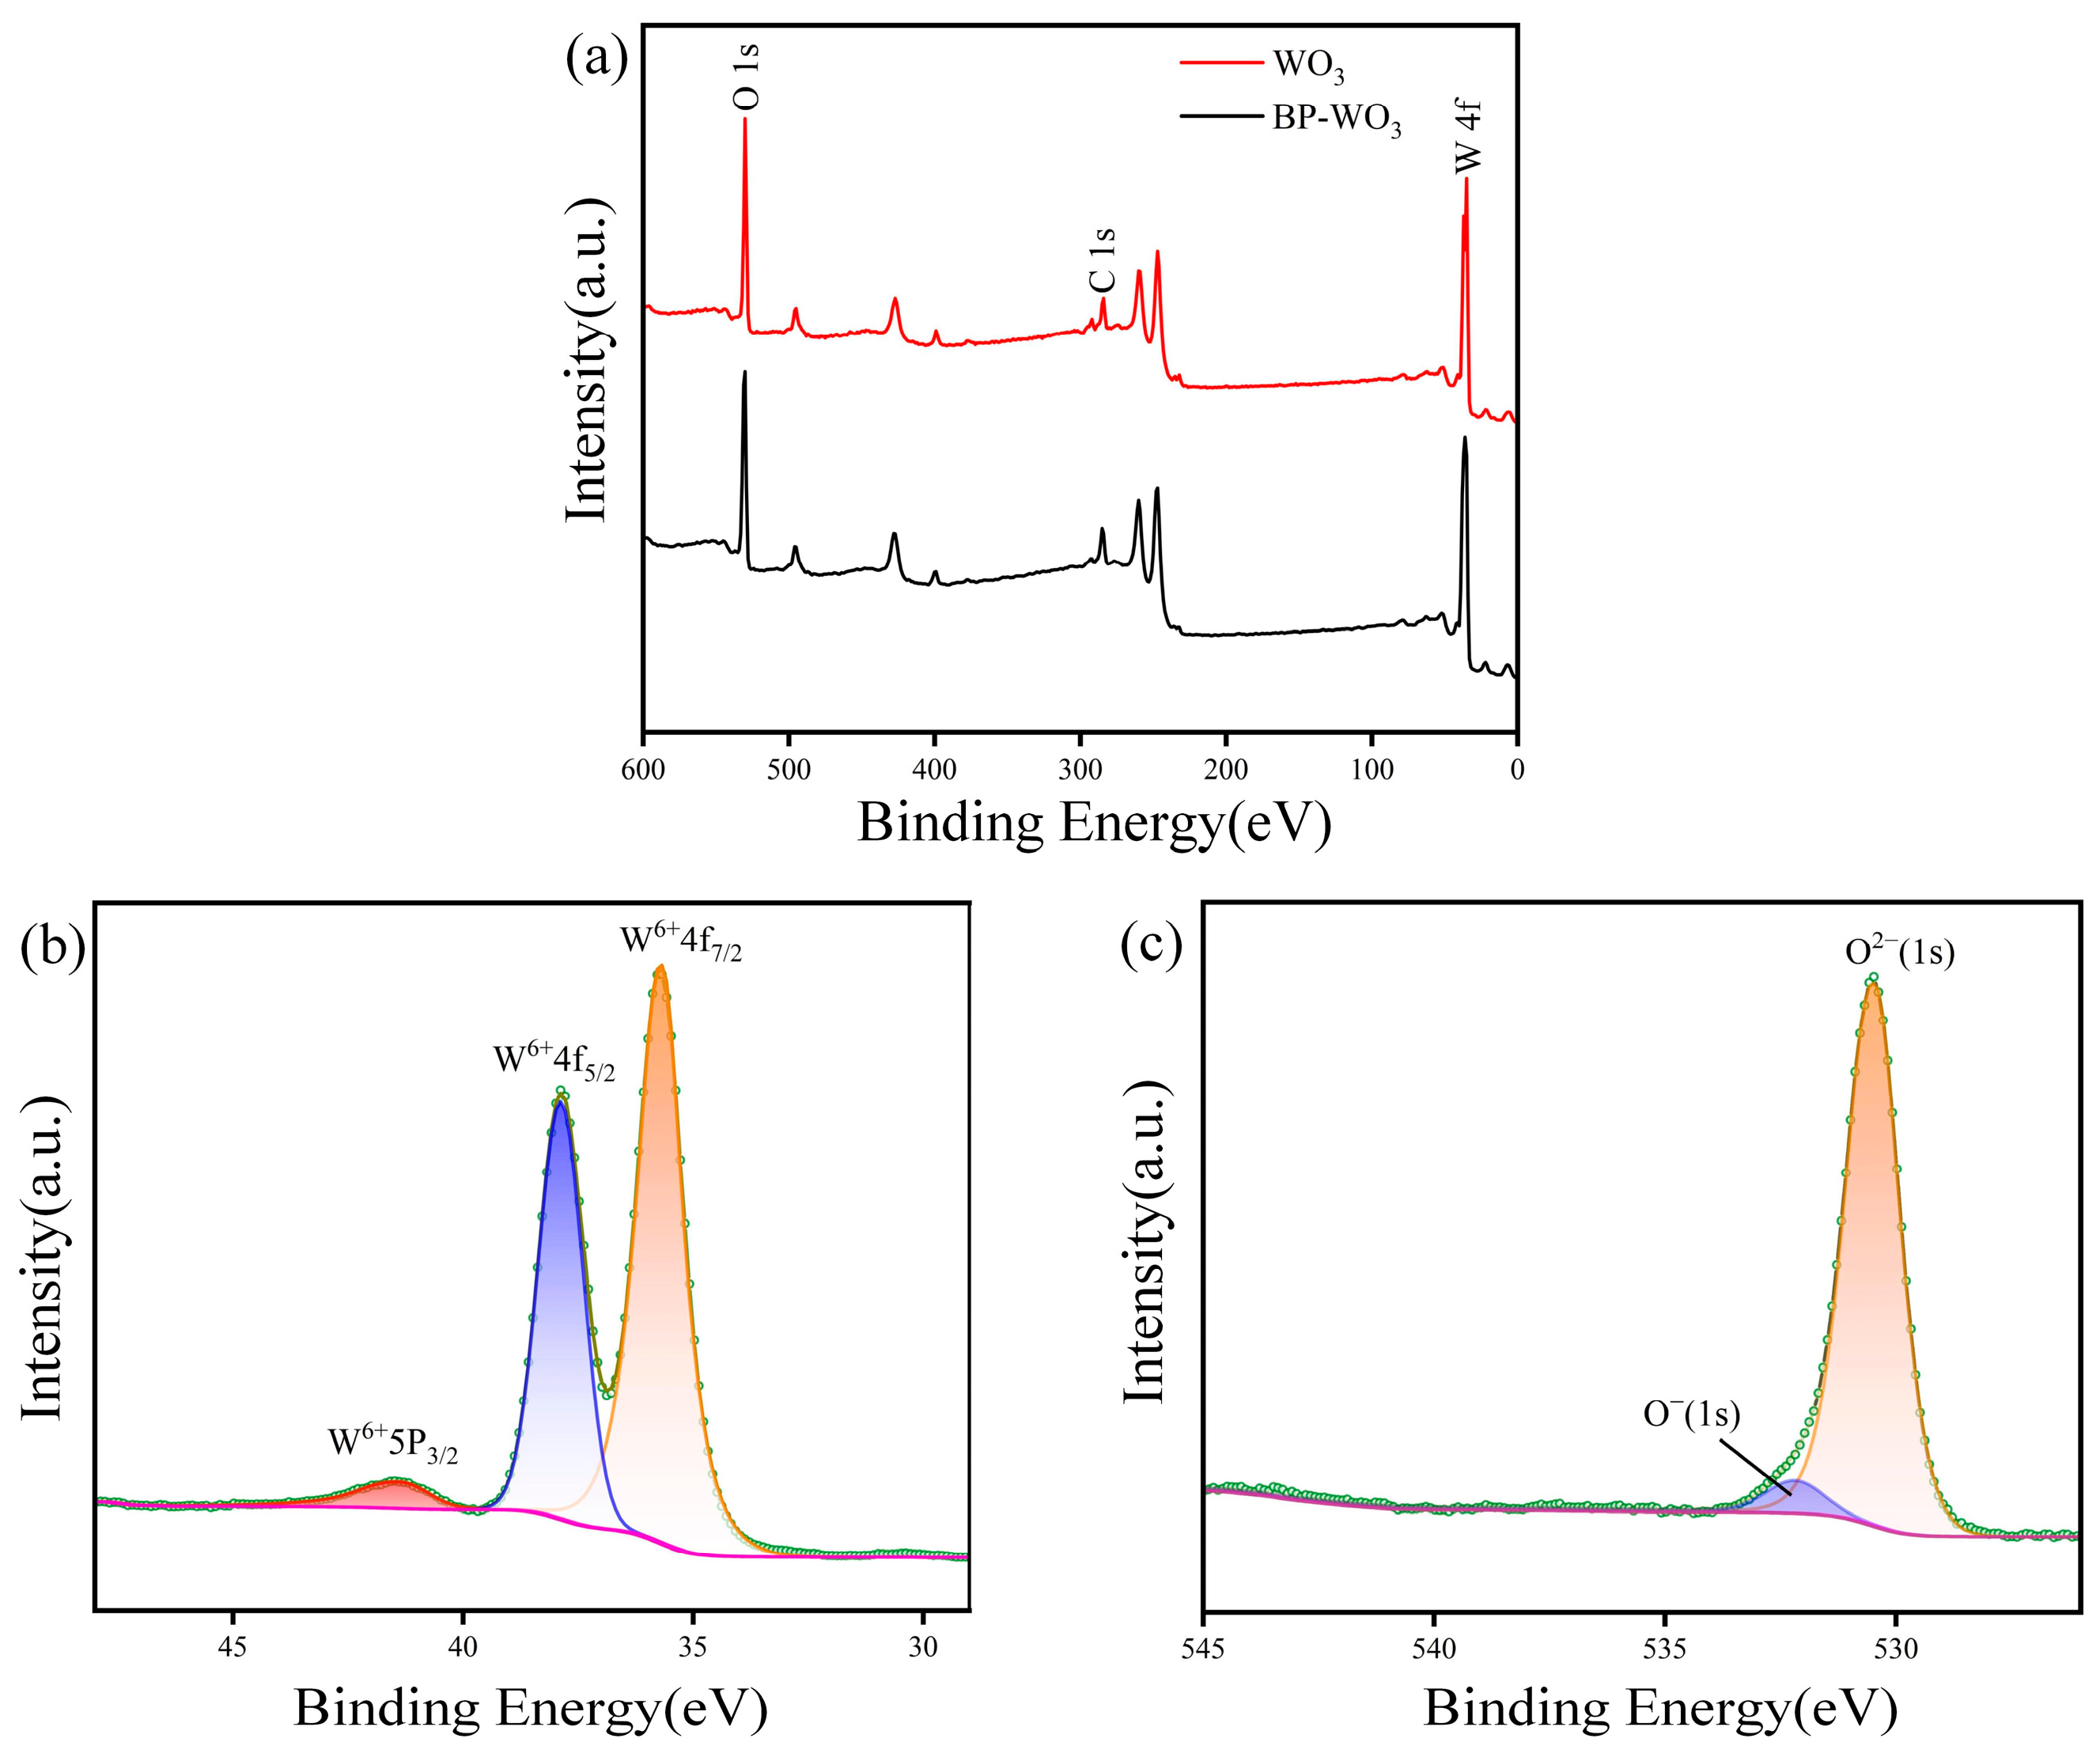
3.1. Material Characterization
3.2. Gas-Sensing Properties
3.3. Gas-Sensing Mechanism
4. Conclusions
Author Contributions
Funding
Institutional Review Board Statement
Informed Consent Statement
Data Availability Statement
Conflicts of Interest
References
- Xie, T.; Sullivan, N.; Steffens, K.; Wen, B.M.; Liu, G.N.; Debnath, R.; Davydov, A.; Gomez, R.; Motayed, A. UV-assisted room-temperature chemiresistive NO2 sensor based on TiO2 thin film. J. Alloys Compd. 2015, 653, 255–259. [Google Scholar] [CrossRef] [PubMed]
- Lin, Y.J.; Lin, H.C.; Yang, Y.F.; Chen, C.Y.; Ling, M.P.; Chen, S.C.; Chen, W.Y.; You, S.H.; Lu, T.H.; Liao, C.M. Association Between Ambient Air Pollution and Elevated Risk of Tuberculosis Development. Infect. Drug Resist. 2019, 12, 3835–3847. [Google Scholar] [CrossRef]
- Maji, S.; Ghosh, S.; Ahmed, S. Association of air quality with respiratory and cardiovascular morbidity rate in Delhi, India. Int. J. Environ. Health Res. 2018, 28, 471–490. [Google Scholar] [CrossRef] [PubMed]
- Guo, C.X.; Sun, X.Y.; Diao, W.Q.; Shen, N.; He, B. Correlation of Clinical Symptoms and Sputum Inflammatory Markers with Air Pollutants in Stable COPD Patients in Beijing Area. Int. J. Chronic Obstr. Pulm. Dis. 2020, 15, 1507–1517. [Google Scholar] [CrossRef]
- Jamnani, S.R.; Moghaddam, H.M.; Leonardi, S.G.; Neri, G.; Ferlazzo, A. VOCs sensing properties of samarium oxide nanorods. Ceram. Int. 2024, 50, 403–411. [Google Scholar] [CrossRef]
- Liang, Z.; Wang, M.; Liu, S.; Hassan, M.; Zhang, X.; Lei, S.; Qiao, G.; Liu, G. One-pot hydrothermal synthesis of self-assembled MoS2/WS2 nanoflowers for chemiresistive room-temperature NO2 sensors. Sens. Actuators B Chem. 2024, 403, 135215. [Google Scholar] [CrossRef]
- Mane, A.T.; Kulkarni, S.B.; Navale, S.T.; Ghanwat, A.A.; Shinde, N.M.; Kim, J.; Patil, V.B. NO2 sensing properties of nanostructured tungsten oxide thin films. Ceram. Int. 2014, 40, 16495–16502. [Google Scholar] [CrossRef]
- Du, W.J.; Wu, N.N.; Wang, Z.; Liu, J.R.; Xu, D.M.; Liu, W. High response and selectivity of platinum modified tin oxide porous spheres for nitrogen dioxide gas sensing at low temperature. Sens. Actuators B Chem. 2018, 257, 427–435. [Google Scholar] [CrossRef]
- Ueda, T.; Boehme, I.; Hyodo, T.; Shimizu, Y.; Weimar, U.; Barsan, N. Effects of Gas Adsorption Properties of an Au-Loaded Porous In2O3 Sensor on NO2-Sensing Properties. ACS Sens. 2021, 6, 4019–4028. [Google Scholar] [CrossRef]
- Dang, V.T.; Nguyen, T.T.O.; Truong, T.H.; Le, A.T.; Nguyen, T.D. Facile synthesis of different ZnO nanostructures for detecting sub-ppm NO2 gas. Mater. Today Commun. 2020, 22, 100826. [Google Scholar] [CrossRef]
- Bai, H.N.; Guo, H.; Wang, J.; Dong, Y.; Liu, B.; Xie, Z.L.; Guo, F.Q.; Chen, D.J.; Zhang, R.; Zheng, Y.D. A room-temperature NO2 gas sensor based on CuO nanoflakes modified with rGO nanosheets. Sens. Actuators B Chem. 2021, 337, 129783. [Google Scholar] [CrossRef]
- Yuan, Z.; Zhao, Q.; Duan, Z.; Xie, C.; Duan, X.; Li, S.; Ye, Z.; Jiang, Y.; Tai, H. Ag2Te nanowires for humidity-resistant trace-level NO2 detection at room temperature. Sens. Actuators B Chem. 2022, 363, 131790. [Google Scholar] [CrossRef]
- Salama, T.M.; Morsy, M.; Abou Shahba, R.M.; Mohamed, S.H.; Mohamed, M.M. Synthesis of Graphene Oxide Interspersed in Hexagonal WO3 Nanorods for High-Efficiency Visible-Light Driven Photocatalysis and NH3 Gas Sensing. Front. Chem. 2019, 7, 722. [Google Scholar] [CrossRef]
- Punginsang, M.; Zappa, D.; Comini, E.; Wisitsoraat, A.; Sberveglieri, G.; Ponzoni, A.; Liewhiran, C. Selective H2S gas sensors based on ohmic hetero-interface of Au-functionalized WO3 nanowires. Appl. Surf. Sci. 2022, 571, 151262. [Google Scholar] [CrossRef]
- Wang, C.; Zhang, Y.Q.; Sun, X.Y.; Sun, Y.F.; Liu, F.M.; Yan, X.; Wang, C.G.; Sun, P.; Lu, G.Y. Preparation of Pd/PdO loaded WO3 microspheres for H2S detection. Sens. Actuators B Chem. 2020, 321, 128629. [Google Scholar] [CrossRef]
- Huang, D.; Yuan, W.J.; Fan, S.R.; Tian, C.; Hua, Z.Q.; Tian, X.M.; Wu, Y.; Li, E.P. Hydrogen sensing mechanism of Ru-loaded WO3 nanosheets. Sens. Actuators B Chem. 2020, 304, 127339. [Google Scholar] [CrossRef]
- Zhou, R.; Lin, X.P.; Xue, D.Y.; Zong, F.Y.; Zhang, J.M.; Duan, X.C.; Li, Q.H.; Wang, T.H. Enhanced H2 gas sensing properties by Pd-loaded urchin-like W18O49 hierarchical nanostructures. Sens. Actuators B Chem. 2018, 260, 900–907. [Google Scholar] [CrossRef]
- Kim, M.H.; Jang, J.S.; Koo, W.T.; Choi, S.J.; Kim, S.J.; Kim, D.H.; Kim, I.D. Bimodally Porous WO3 Microbelts Functionalized with Pt Catalysts for Selective H2S Sensors. ACS Appl. Mater. Interfaces 2018, 10, 20643–20651. [Google Scholar] [CrossRef]
- Yang, X.H.; Fu, H.T.; Tian, Y.; Xie, Q.; Xiong, S.X.; Han, D.Z.; Zhang, H.; An, X.Z. Au decorated In2O3 hollow nanospheres: A novel sensing material toward amine. Sens. Actuators B Chem. 2019, 296, 126696. [Google Scholar] [CrossRef]
- Kim, T.H.; Hasani, A.; Quyet, L.V.; Kim, Y.; Park, S.Y.; Lee, M.G.; Sohn, W.; Nguyen, T.P.; Choi, K.S.; Kim, S.Y.; et al. NO2 sensing properties of porous Au-incorporated tungsten oxide thin films prepared by solution process. Sens. Actuators B Chem. 2019, 286, 512–520. [Google Scholar] [CrossRef]
- Chen, X.X.; Shen, Y.B.; Zhou, P.F.; Zhao, S.K.; Zhong, X.X.; Li, T.T.; Han, C.; Wei, D.Z.; Meng, D. NO2 sensing properties of one-pot-synthesized ZnO nanowires with Pd functionalization. Sens. Actuators B Chem. 2019, 280, 151–161. [Google Scholar] [CrossRef]
- Geim, A.K.; Novoselov, K.S. The rise of graphene. Nat. Mater. 2007, 6, 183–191. [Google Scholar] [CrossRef] [PubMed]
- Choi, S.-J.; Jang, B.-H.; Lee, S.-J.; Min, B.K.; Rothschild, A.; Kim, I.-D. Selective detection of acetone and hydrogen sulfide for the diagnosis of diabetes and halitosis using SnO2 nanofibers functionalized with reduced graphene oxide nanosheets. ACS Appl. Mater. Interfaces 2014, 6, 2588–2597. [Google Scholar] [CrossRef] [PubMed]
- Guo, Z.N.; Zhang, H.; Lu, S.B.; Wang, Z.T.; Tang, S.Y.; Shao, J.D.; Sun, Z.B.; Xie, H.H.; Wang, H.Y.; Yu, X.F.; et al. From Black Phosphorus to Phosphorene: Basic Solvent Exfoliation, Evolution of Raman Scattering, and Applications to Ultrafast Photonics. Adv. Funct. Mater. 2015, 25, 6996–7002. [Google Scholar] [CrossRef]
- Abbas, A.N.; Liu, B.; Chen, L.; Ma, Y.; Cong, S.; Aroonyadet, N.; Kopf, M.; Nilges, T.; Zhou, C. Black phosphorus gas sensors. ACS Nano 2015, 9, 5618–5624. [Google Scholar] [CrossRef]
- Han, D.; Han, X.; Liu, L.; Li, D.; Liu, Y.; Liu, Z.; Liu, D.; Chen, Y.; Zhuo, K.; Sang, S. Sub-ppb-level detection of nitrogen dioxide based on high-quality black phosphorus. ACS Appl. Mater. Interfaces 2022, 14, 13942–13951. [Google Scholar] [CrossRef]
- Zhou, Y.; Hu, Z.H.; Zhao, H.C.; Wang, Y.J.; Li, J.; Zou, C. Two-dimensional black phosphorus/tin oxide heterojunctions for high-performance chemiresistive H2S sensing. Anal. Chim. Acta 2023, 1245, 340825. [Google Scholar] [CrossRef]
- Katrib, A.; Hemming, F.; Wehrer, P.; Hilaire, L.; Maire, G. The multi-surface structure and catalytic properties of partially reduced WO3, WO2 and WC+ O2 or W+ O2 as characterized by XPS. J. Electron Spectrosc. Relat. Phenom. 1995, 76, 195–200. [Google Scholar] [CrossRef]
- Colton, R.J.; Rabalais, J.W. Electronic structure to tungsten and some of its borides, carbides, nitrides, and oxides by X-ray electron spectroscopy. Inorg. Chem. 1976, 15, 236–238. [Google Scholar] [CrossRef]
- Pashutski, A.; Folman, M. Low temperature XPS studies of NO and N2O adsorption on Al (100). Surf. Sci. 1989, 216, 395–408. [Google Scholar] [CrossRef]
- Su, P.-G.; Pan, T.-T. Fabrication of a room-temperature NO2 gas sensor based on WO3 films and WO3/MWCNT nanocomposite films by combining polyol process with metal organic decomposition method. Mater. Chem. Phys. 2011, 125, 351–357. [Google Scholar] [CrossRef]
- Yaqoob, U.; Uddin, A.I.; Chung, G.-S. A high-performance flexible NO2 sensor based on WO3 NPs decorated on MWCNTs and RGO hybrids on PI/PET substrates. Sens. Actuators B Chem. 2016, 224, 738–746. [Google Scholar] [CrossRef]
- Barbosa, M.S.; Barbosa, D.N.; da Silva, R.A.; Orlandi, M.O. NO2-sensing proprieties of WS2/WO3 heterostructures obtained by hydrothermal treatment of tungsten oxide seed materials. Chem. Phys. Lett. 2023, 812, 140269. [Google Scholar] [CrossRef]
- Tesfamichael, T.; Piloto, C.; Arita, M.; Bell, J. Fabrication of Fe-doped WO3 films for NO2 sensing at lower operating temperature. Sens. Actuators B Chem. 2015, 221, 393–400. [Google Scholar] [CrossRef]
- Mane, A.; Navale, S.; Patil, V. Room temperature NO2 gas sensing properties of DBSA doped PPy–WO3 hybrid nanocomposite sensor. Org. Electron. 2015, 19, 15–25. [Google Scholar] [CrossRef]
- Behera, B.; Chandra, S. Synthesis of WO3 nanorods by thermal oxidation technique for NO2 gas sensing application. Mater. Sci. Semicond. Process. 2018, 86, 79–84. [Google Scholar] [CrossRef]
- Sun, Y.; Yu, Z.; Wang, W.; Li, P.; Li, G.; Zhang, W.; Chen, L.; Zhuivkov, S.; Hu, J. Selective gas detection using Mn3O4/WO3 composites as a sensing layer. Beilstein J. Nanotechnol. 2019, 10, 1423–1433. [Google Scholar] [CrossRef] [PubMed]
- Ko, K.Y.; Song, J.G.; Kim, Y.; Choi, T.; Shin, S.; Lee, C.W.; Lee, K.; Koo, J.; Lee, H.; Kim, J.; et al. Improvement of Gas-Sensing Performance of Large-Area Tungsten Disulfide Nanosheets by Surface Functionalization. ACS Nano 2016, 10, 9287–9296. [Google Scholar] [CrossRef]
- Zhao, L.; Zhang, Z.; Luo, X.; Liu, Z.; Zhang, Y. Sol-gel processed tungsten trioxide nanocrystals layer for efficient hole-injection in quantum dot light-emitting diodes. Thin Solid Film. 2021, 730, 138722. [Google Scholar] [CrossRef]
- Wang, Y.; Zhou, Y.; Li, J.; Zhang, R.; Zhao, H.; Wang, Y. Ag decoration-enabled sensitization enhancement of black phosphorus nanosheets for trace NO2 detection at room temperature. J. Hazard. Mater. 2022, 435, 129086. [Google Scholar] [CrossRef]
- Cui, S.; Pu, H.; Wells, S.A.; Wen, Z.; Mao, S.; Chang, J.; Hersam, M.C.; Chen, J. Ultrahigh sensitivity and layer-dependent sensing performance of phosphorene-based gas sensors. Nat. Commun. 2015, 6, 8632. [Google Scholar] [CrossRef] [PubMed]


| Material | Concentration | Response | Response–Recovery Time | Reference |
|---|---|---|---|---|
| MWCNT-WO3 | 100 ppm | 0.96 | 10 s/20 min | [31] |
| MWCNT and rGO-WO3 | 5 ppm | 17% | 7/15 min | [32] |
| WS2-WO3 | 10 ppm | 65 | ~800/~400 s | [33] |
| Fe-WO3 | 12 ppm | 105% | 250/650 s | [34] |
| PPy-WO3 | 5 ppm | 12% | ~370/~50 s | [35] |
| WO3 | 10 ppm | 2.02 | 96/81 s | [36] |
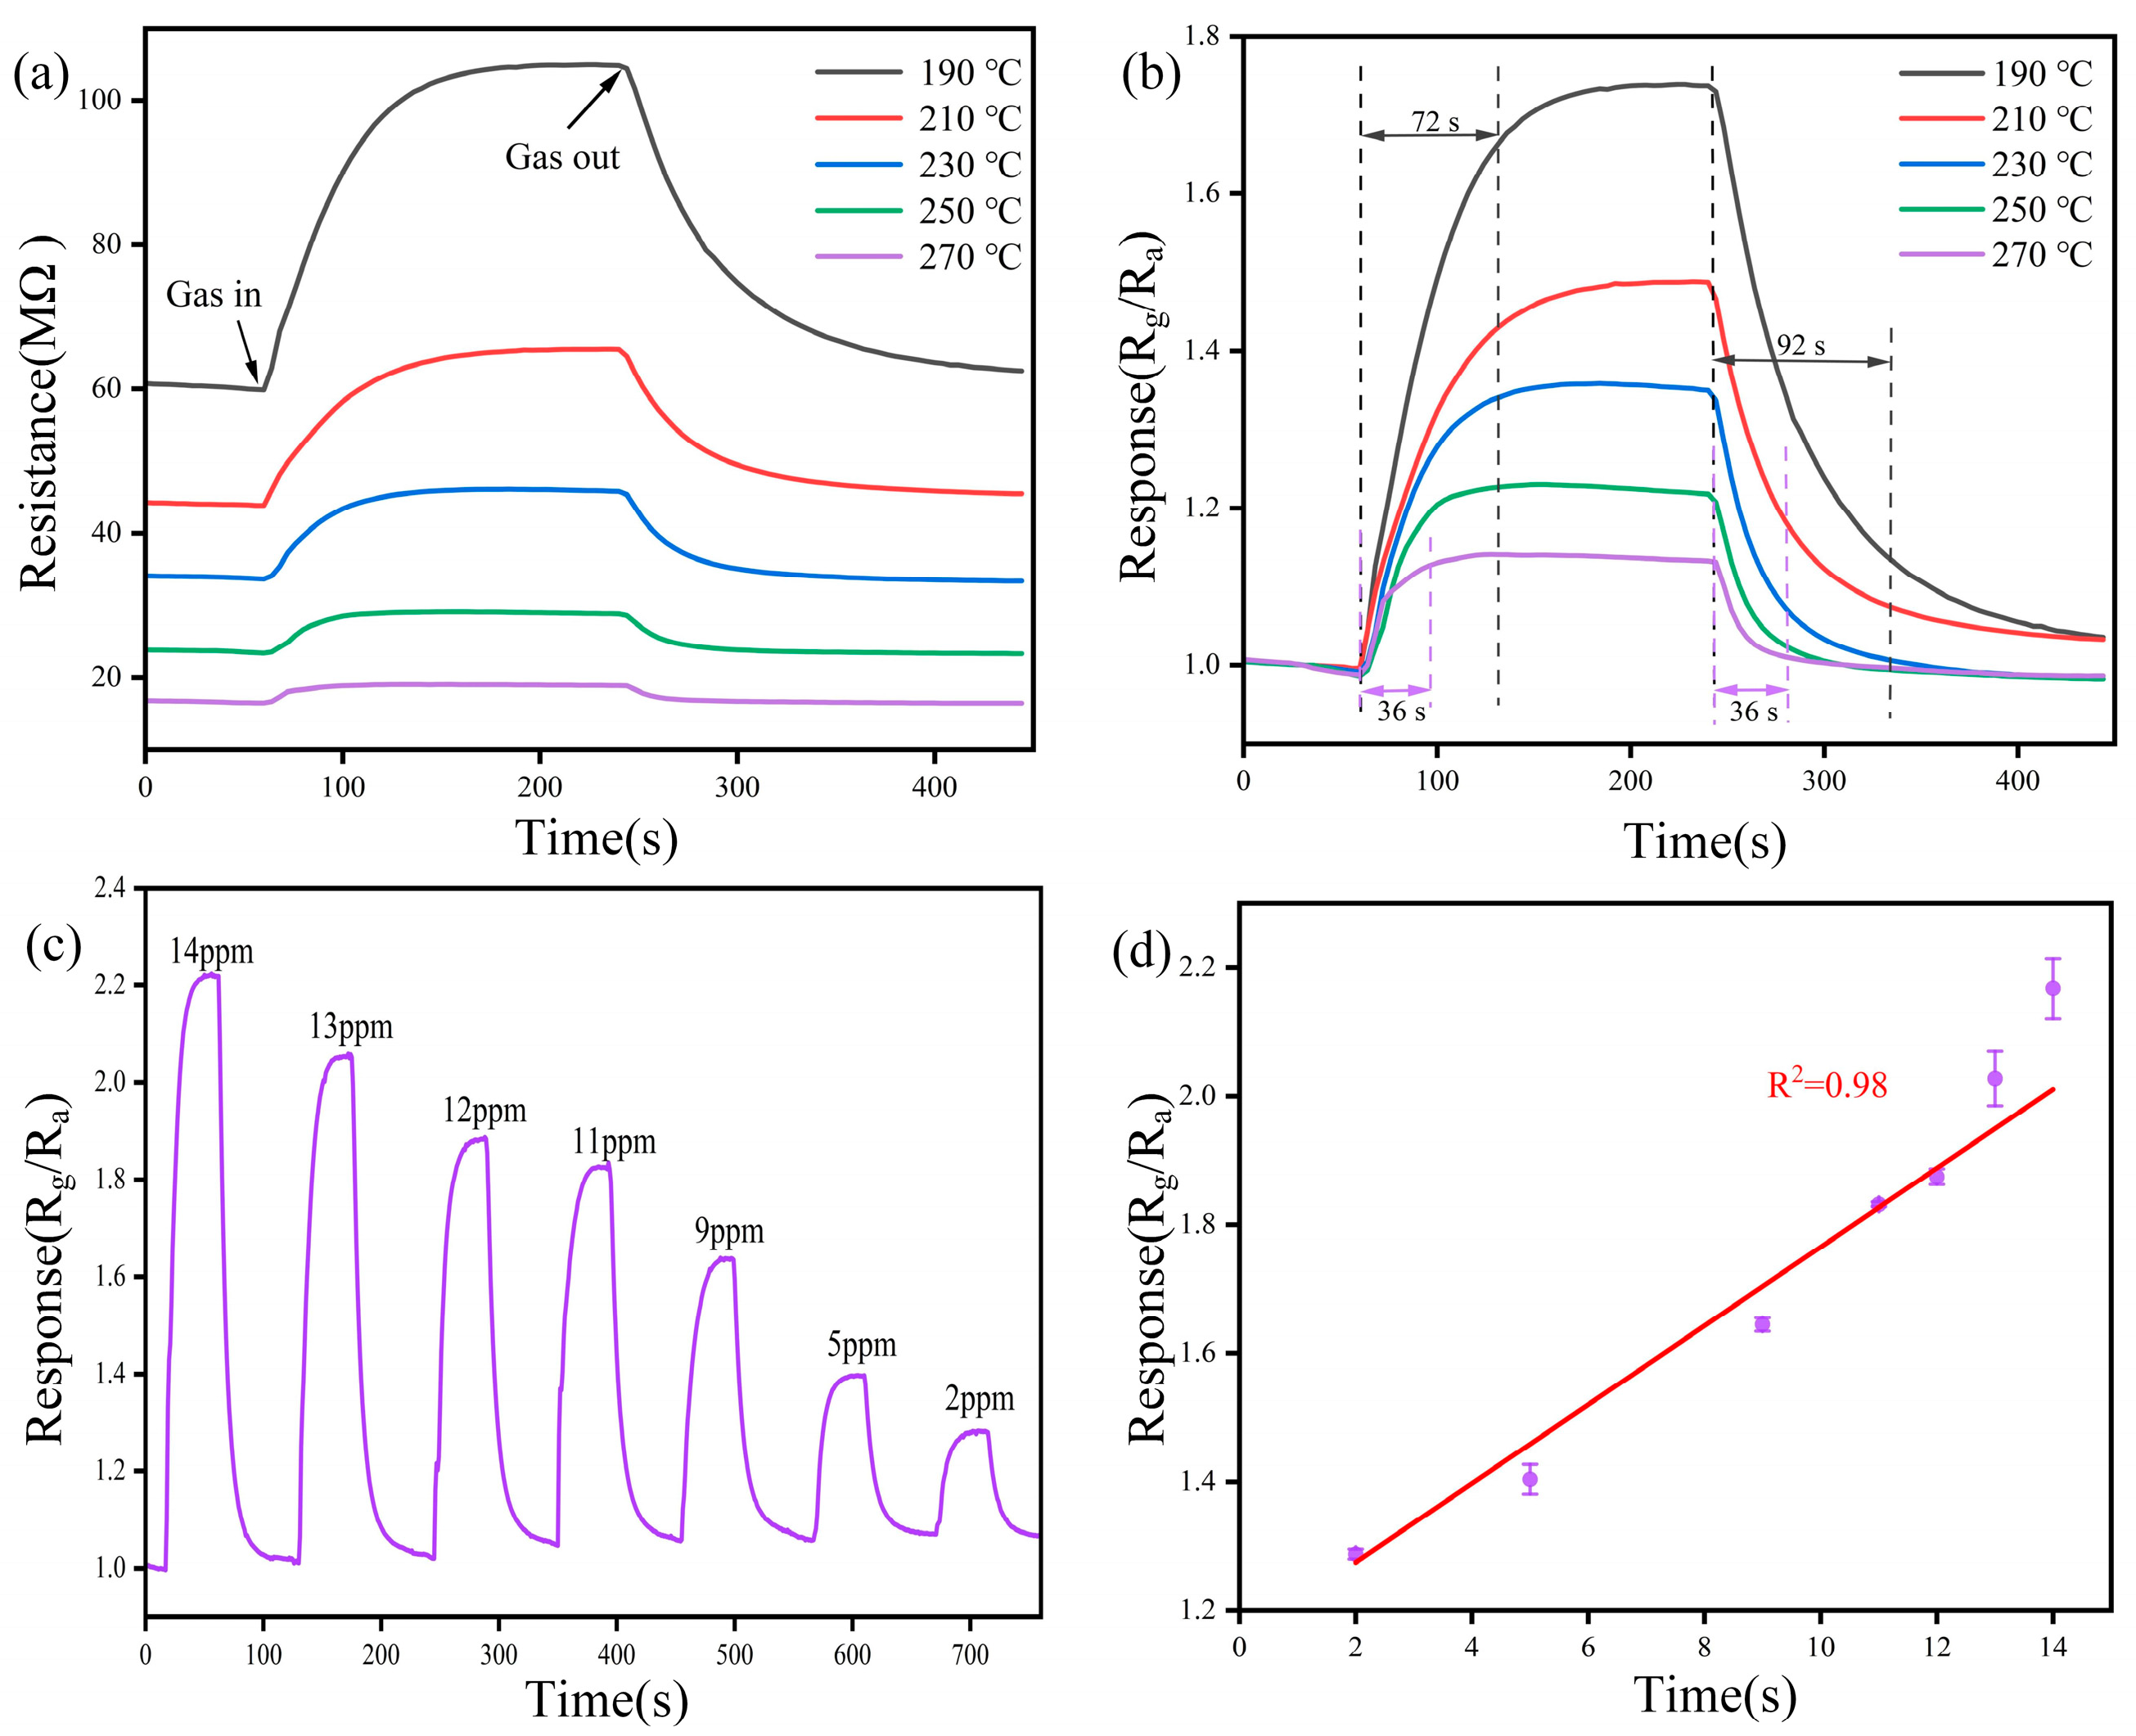
| BP-WO3 | 14 ppm | 2.21 (122%) | 72/92 s | This work |
Disclaimer/Publisher’s Note: The statements, opinions and data contained in all publications are solely those of the individual author(s) and contributor(s) and not of MDPI and/or the editor(s). MDPI and/or the editor(s) disclaim responsibility for any injury to people or property resulting from any ideas, methods, instructions or products referred to in the content. |
© 2024 by the authors. Licensee MDPI, Basel, Switzerland. This article is an open access article distributed under the terms and conditions of the Creative Commons Attribution (CC BY) license (https://creativecommons.org/licenses/by/4.0/).
Share and Cite
Zheng, C.; Shi, Y.; Tang, B.; Zhang, J. Black Phosphorus–Tungsten Oxide Sandwich-like Nanostructures for Highly Selective NO2 Detection. Sensors 2024, 24, 1376. https://doi.org/10.3390/s24051376
Zheng C, Shi Y, Tang B, Zhang J. Black Phosphorus–Tungsten Oxide Sandwich-like Nanostructures for Highly Selective NO2 Detection. Sensors. 2024; 24(5):1376. https://doi.org/10.3390/s24051376
Chicago/Turabian StyleZheng, Canda, Yunbo Shi, Bolun Tang, and Jianhua Zhang. 2024. "Black Phosphorus–Tungsten Oxide Sandwich-like Nanostructures for Highly Selective NO2 Detection" Sensors 24, no. 5: 1376. https://doi.org/10.3390/s24051376
APA StyleZheng, C., Shi, Y., Tang, B., & Zhang, J. (2024). Black Phosphorus–Tungsten Oxide Sandwich-like Nanostructures for Highly Selective NO2 Detection. Sensors, 24(5), 1376. https://doi.org/10.3390/s24051376