

Validation of a Zio XT Patch Accelerometer for the Objective Assessment of Physical Activity in the Atherosclerosis Risk in Communities (ARIC) Study

 , , ,
, , ,  , and
, and
Abstract
1. Introduction
2. Methods
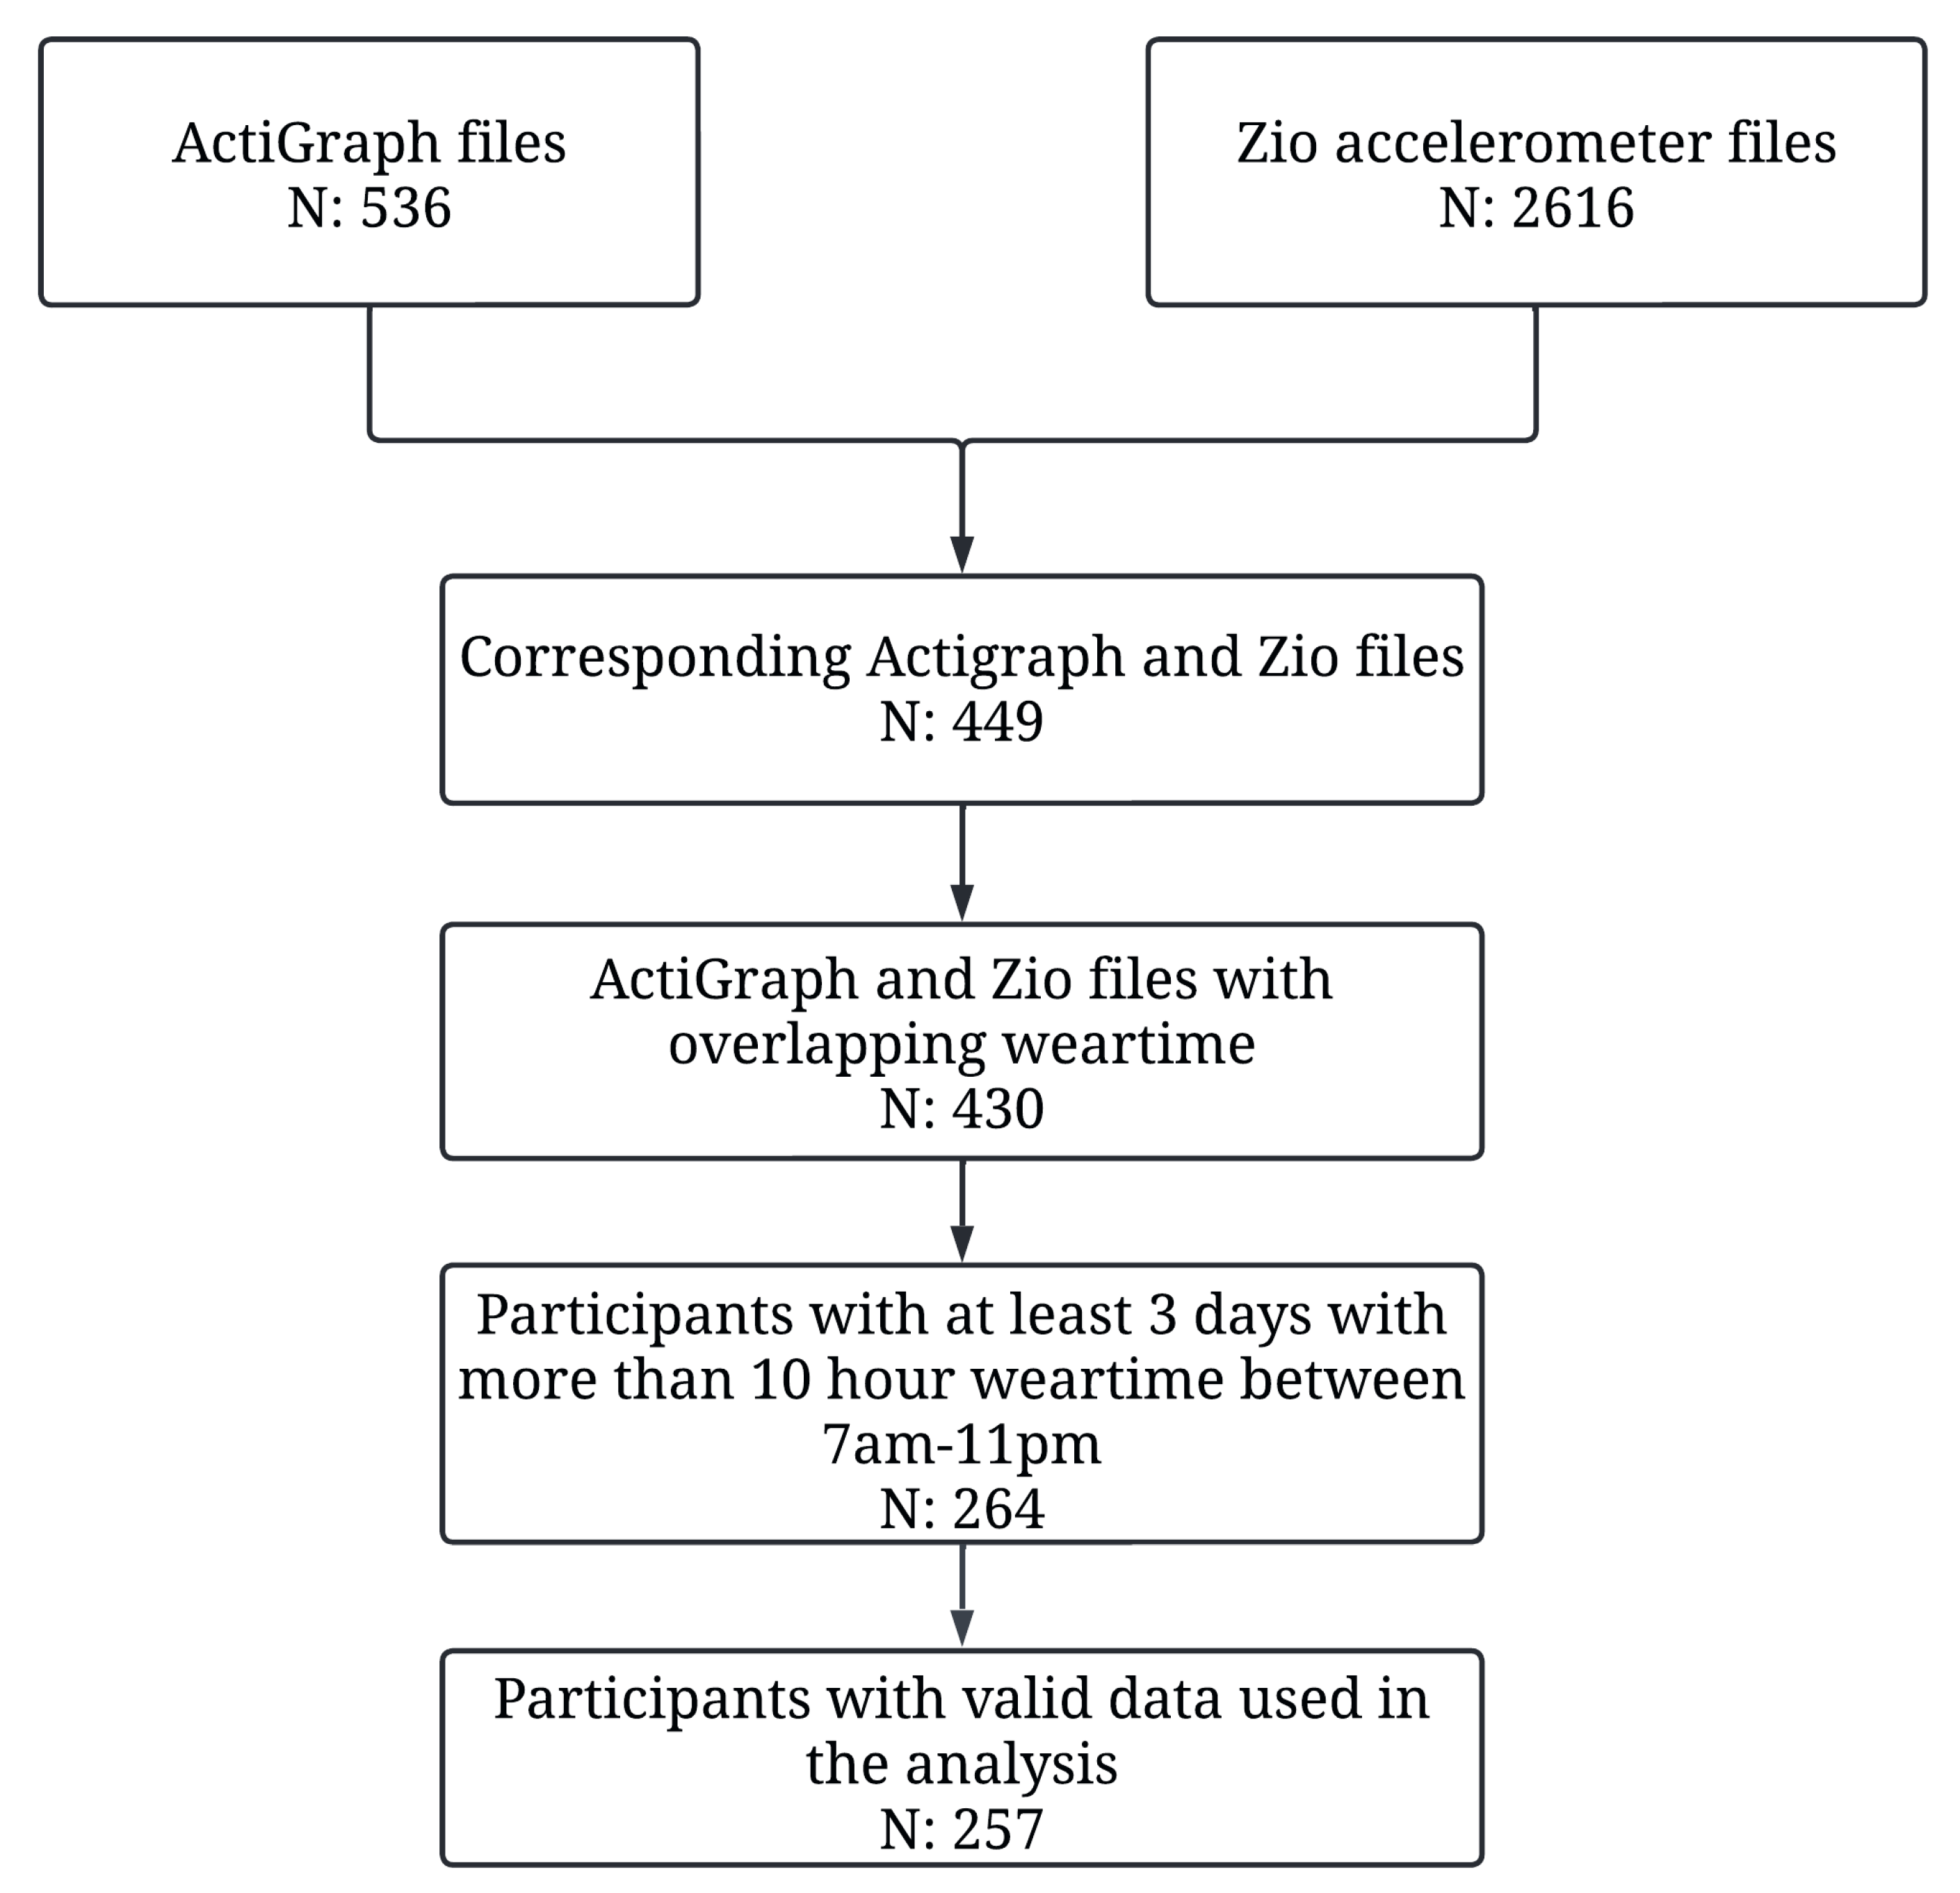
- Participants:
- Data Collection:
- Validation:
3. Results
- Participants:
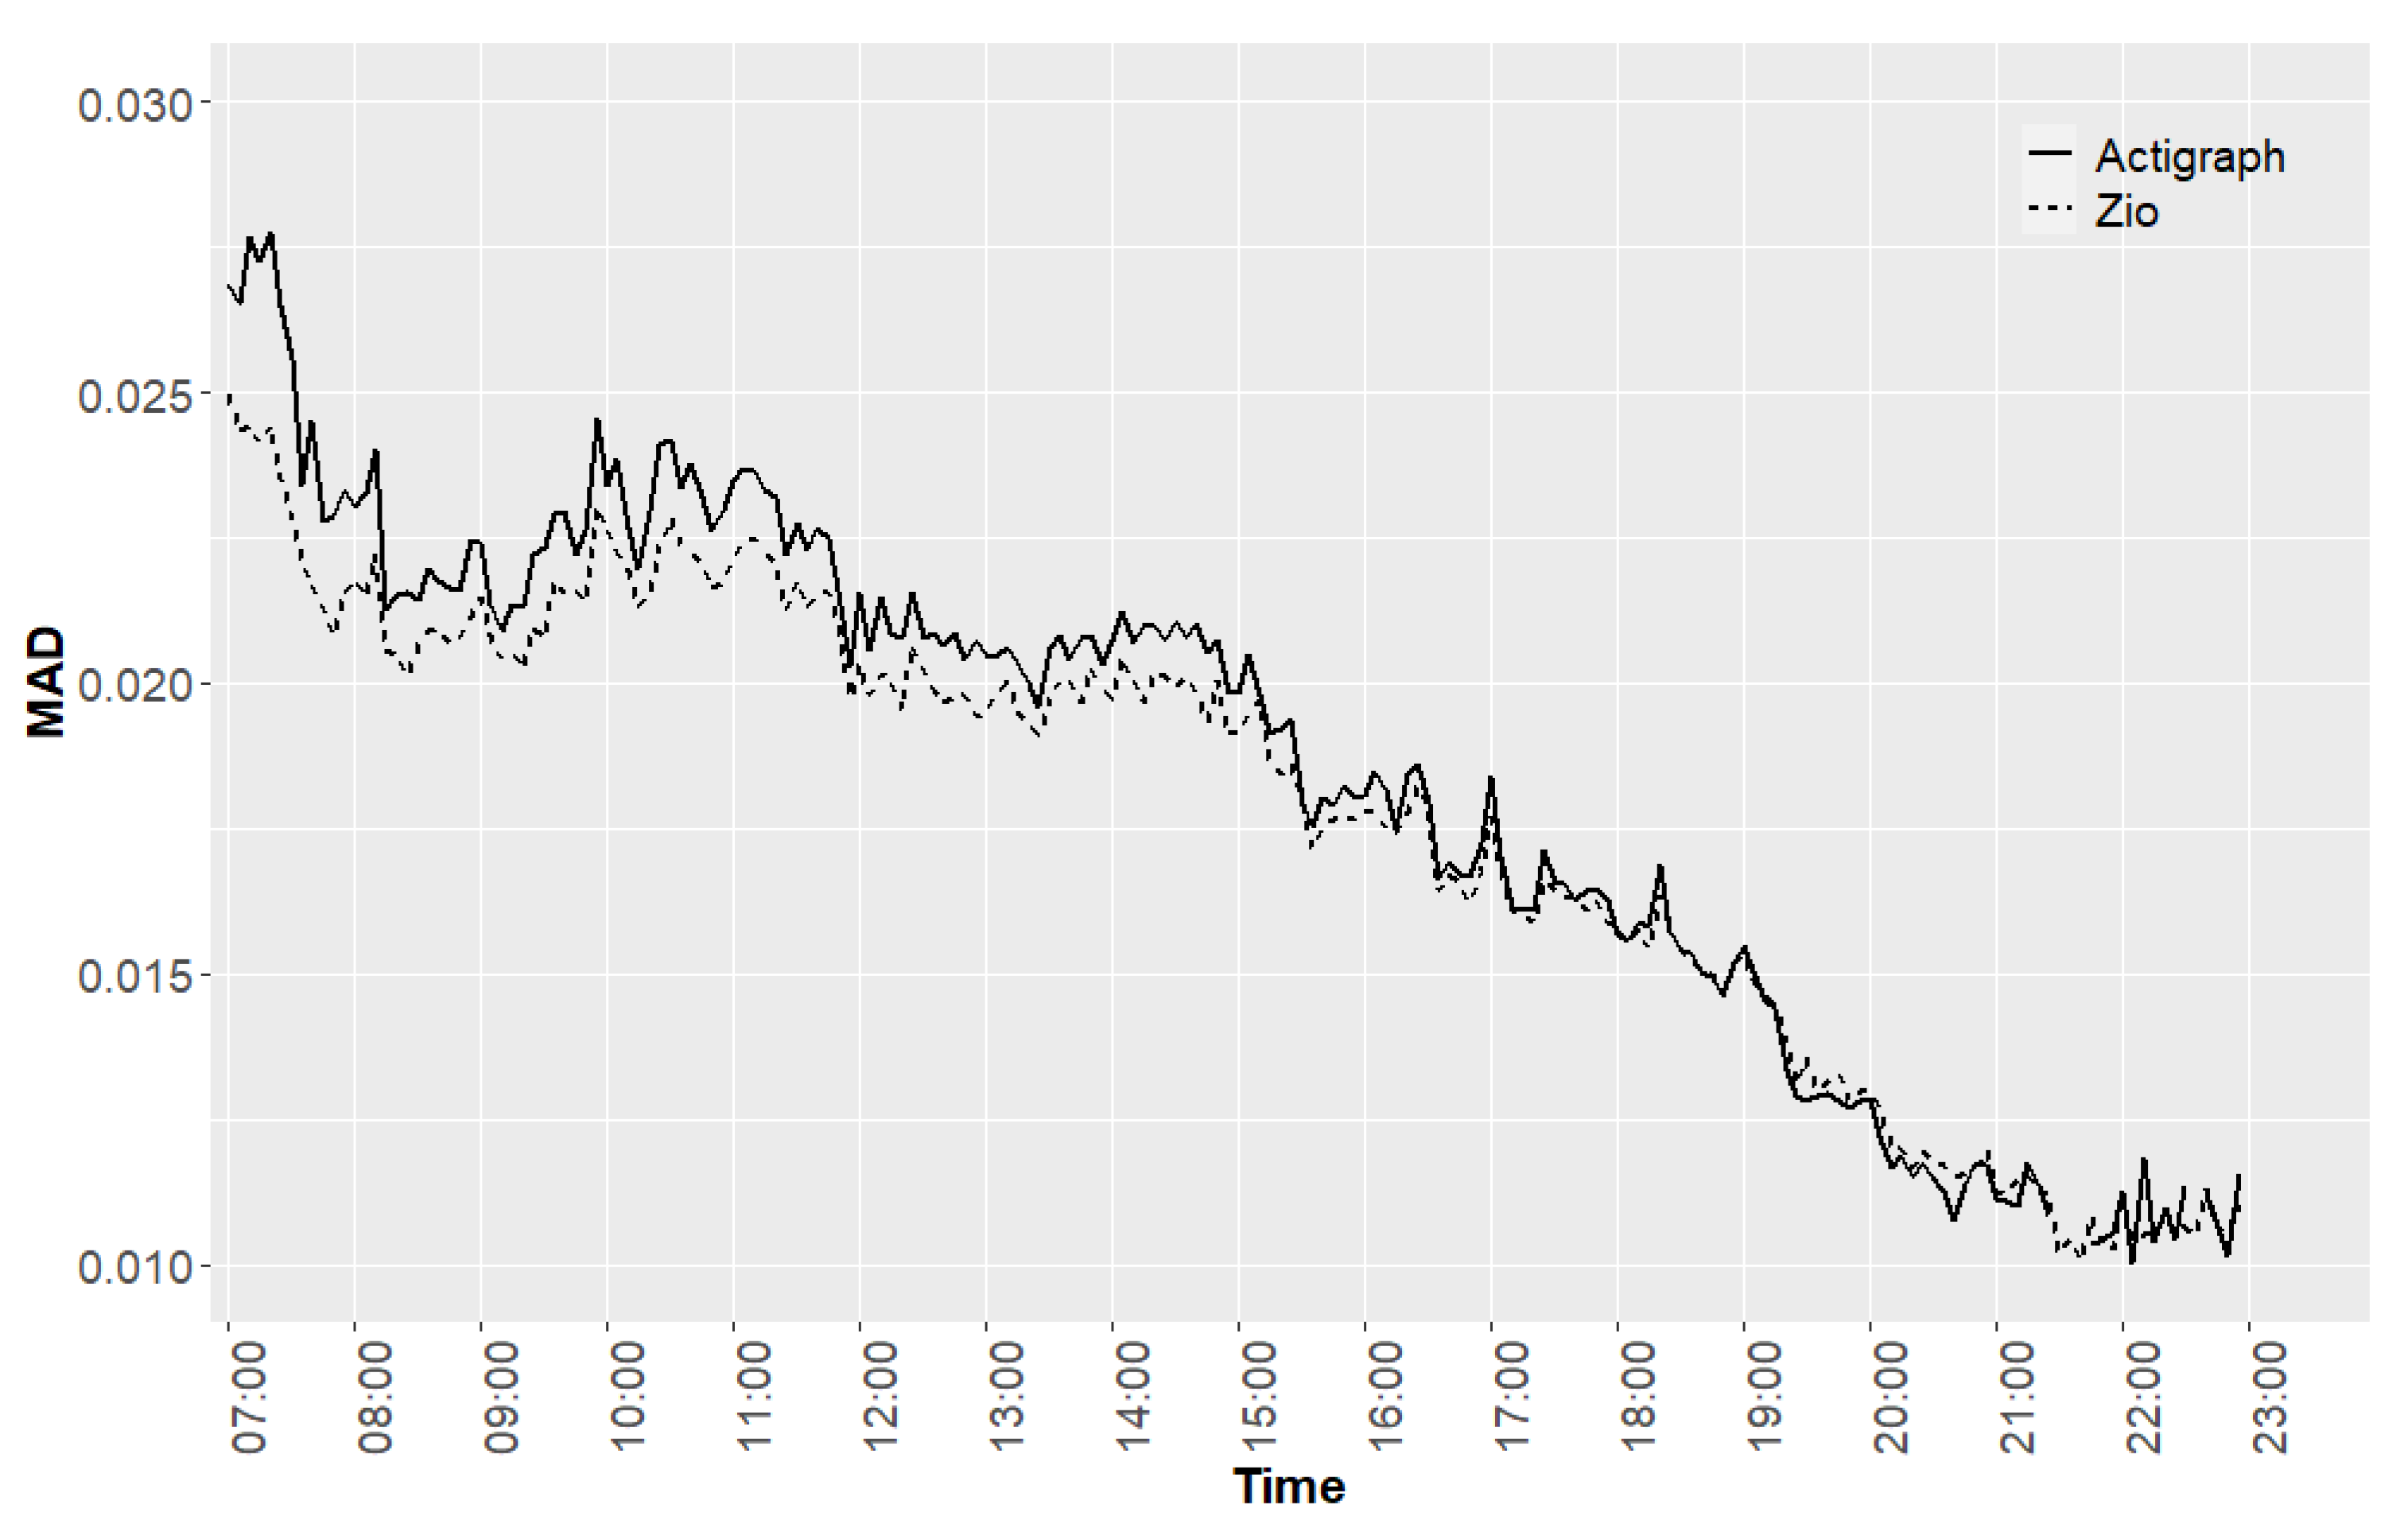
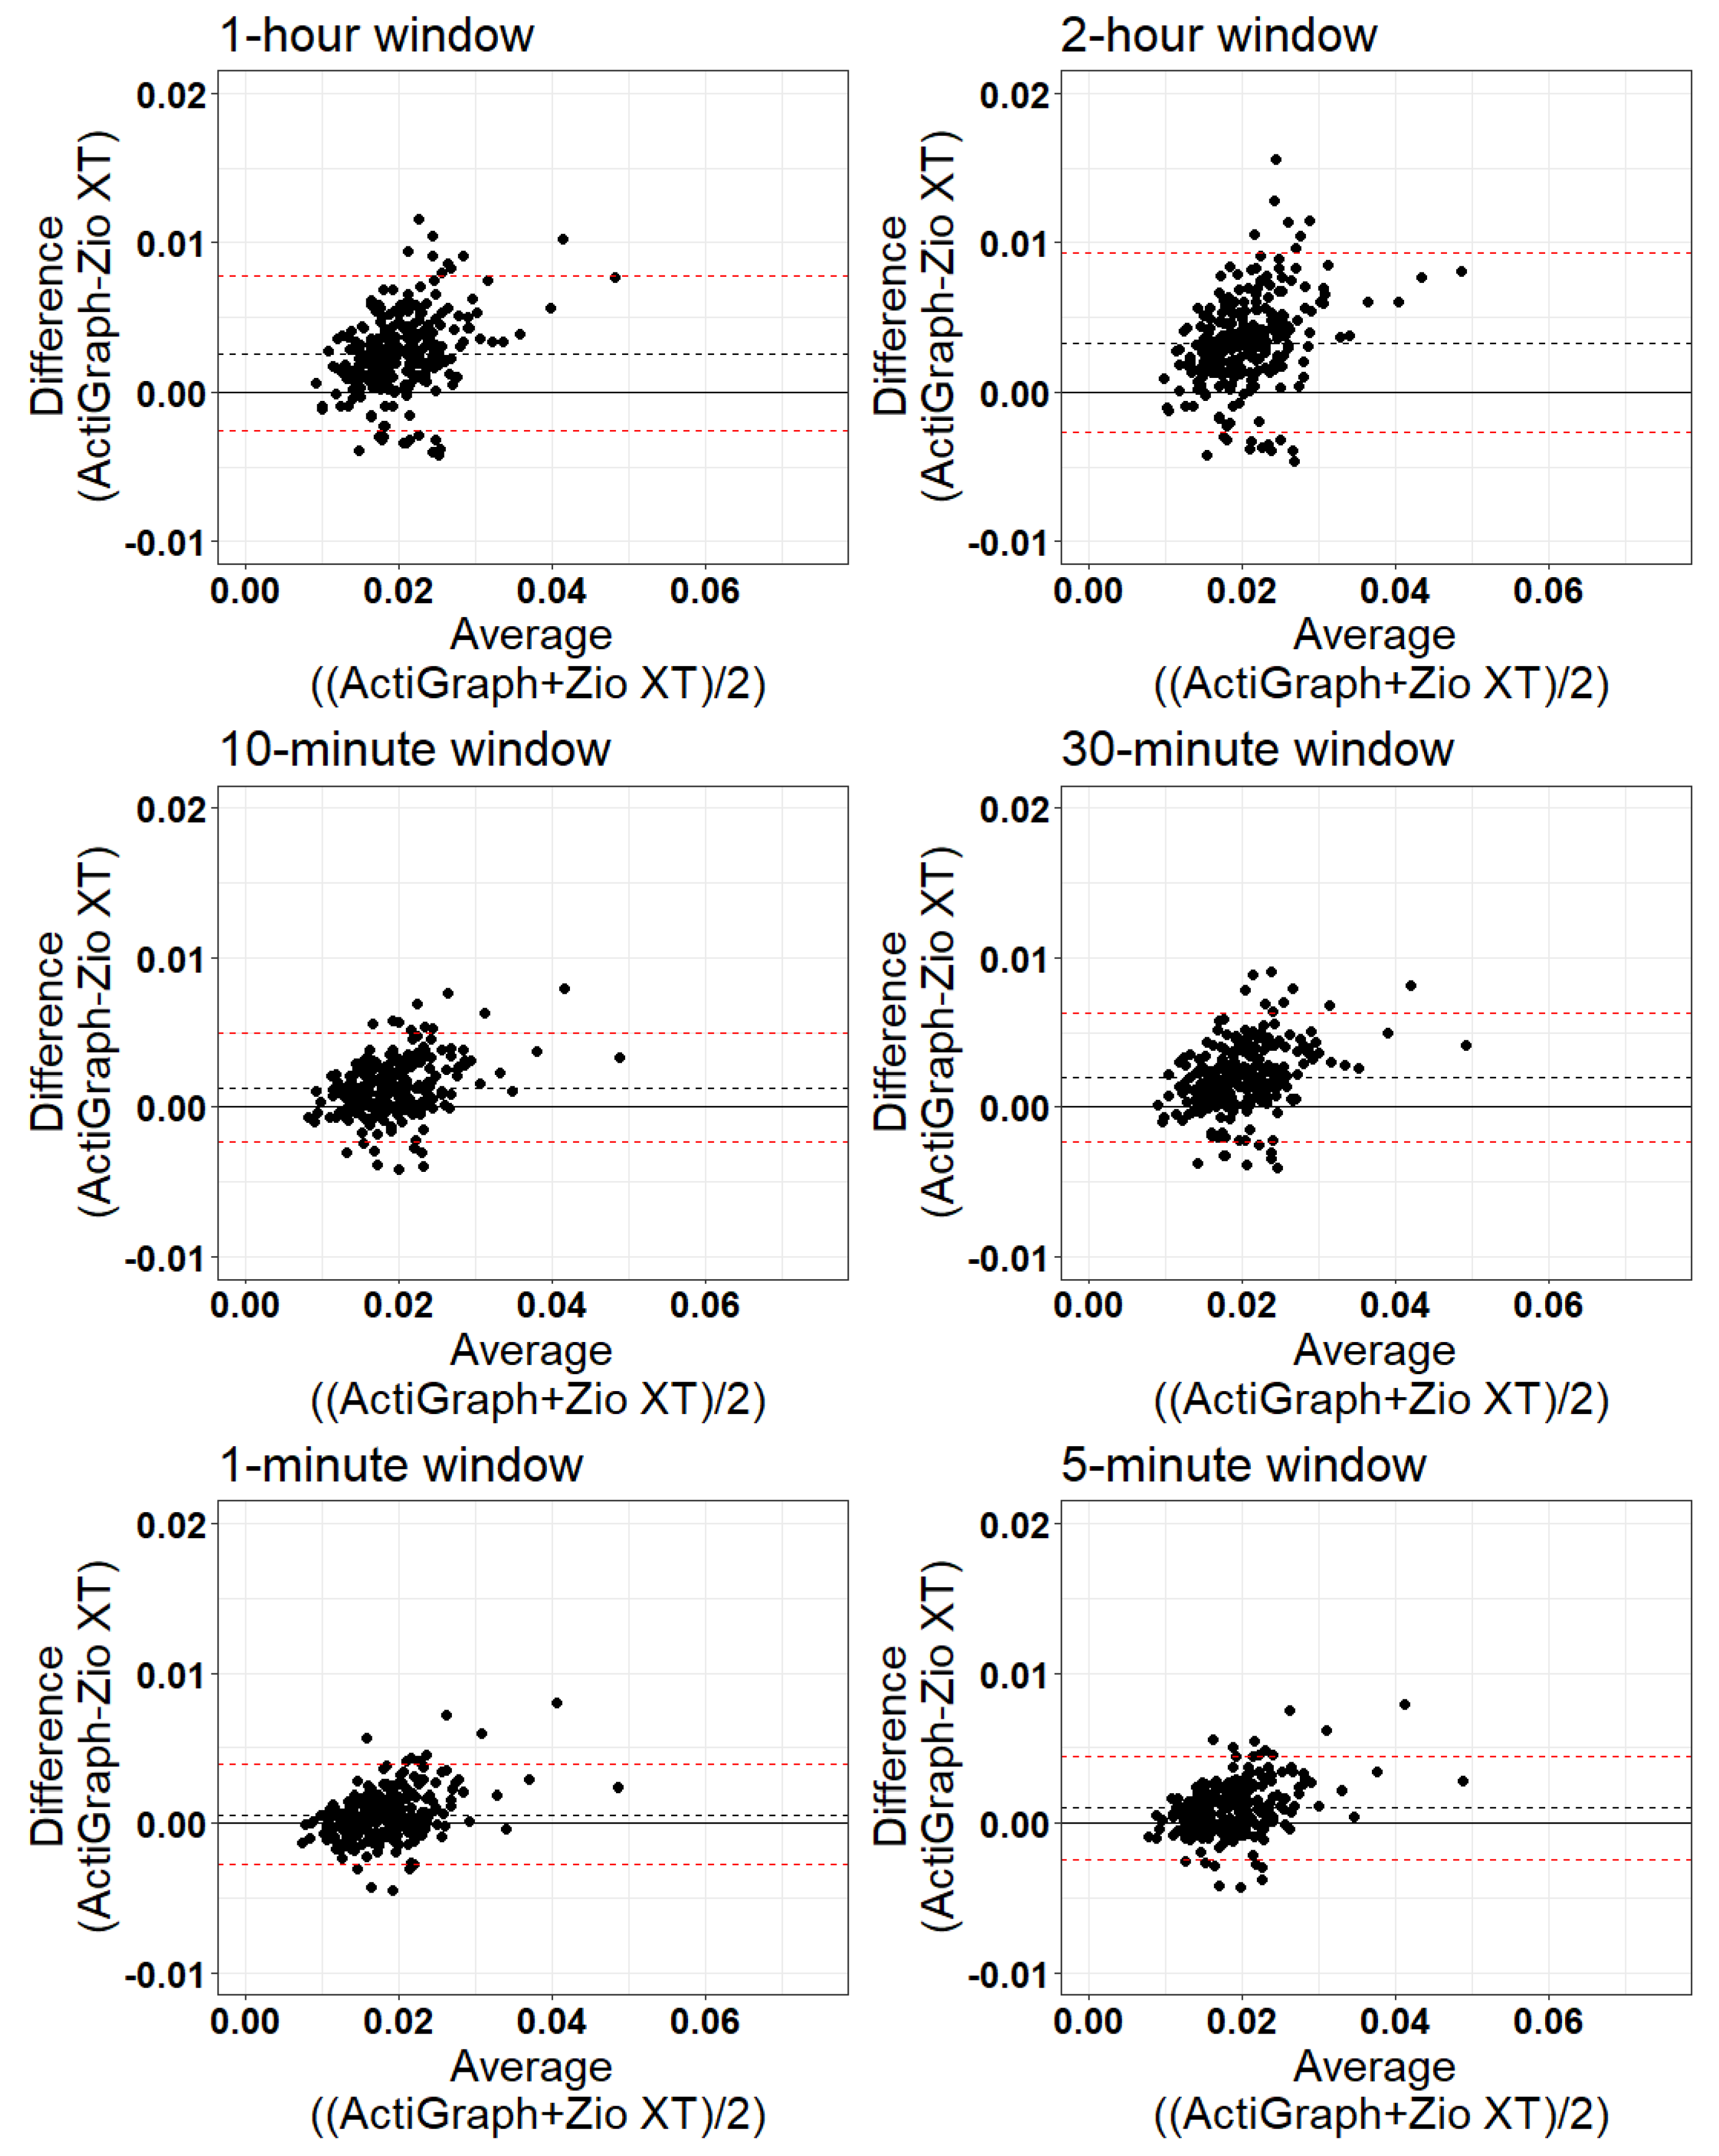
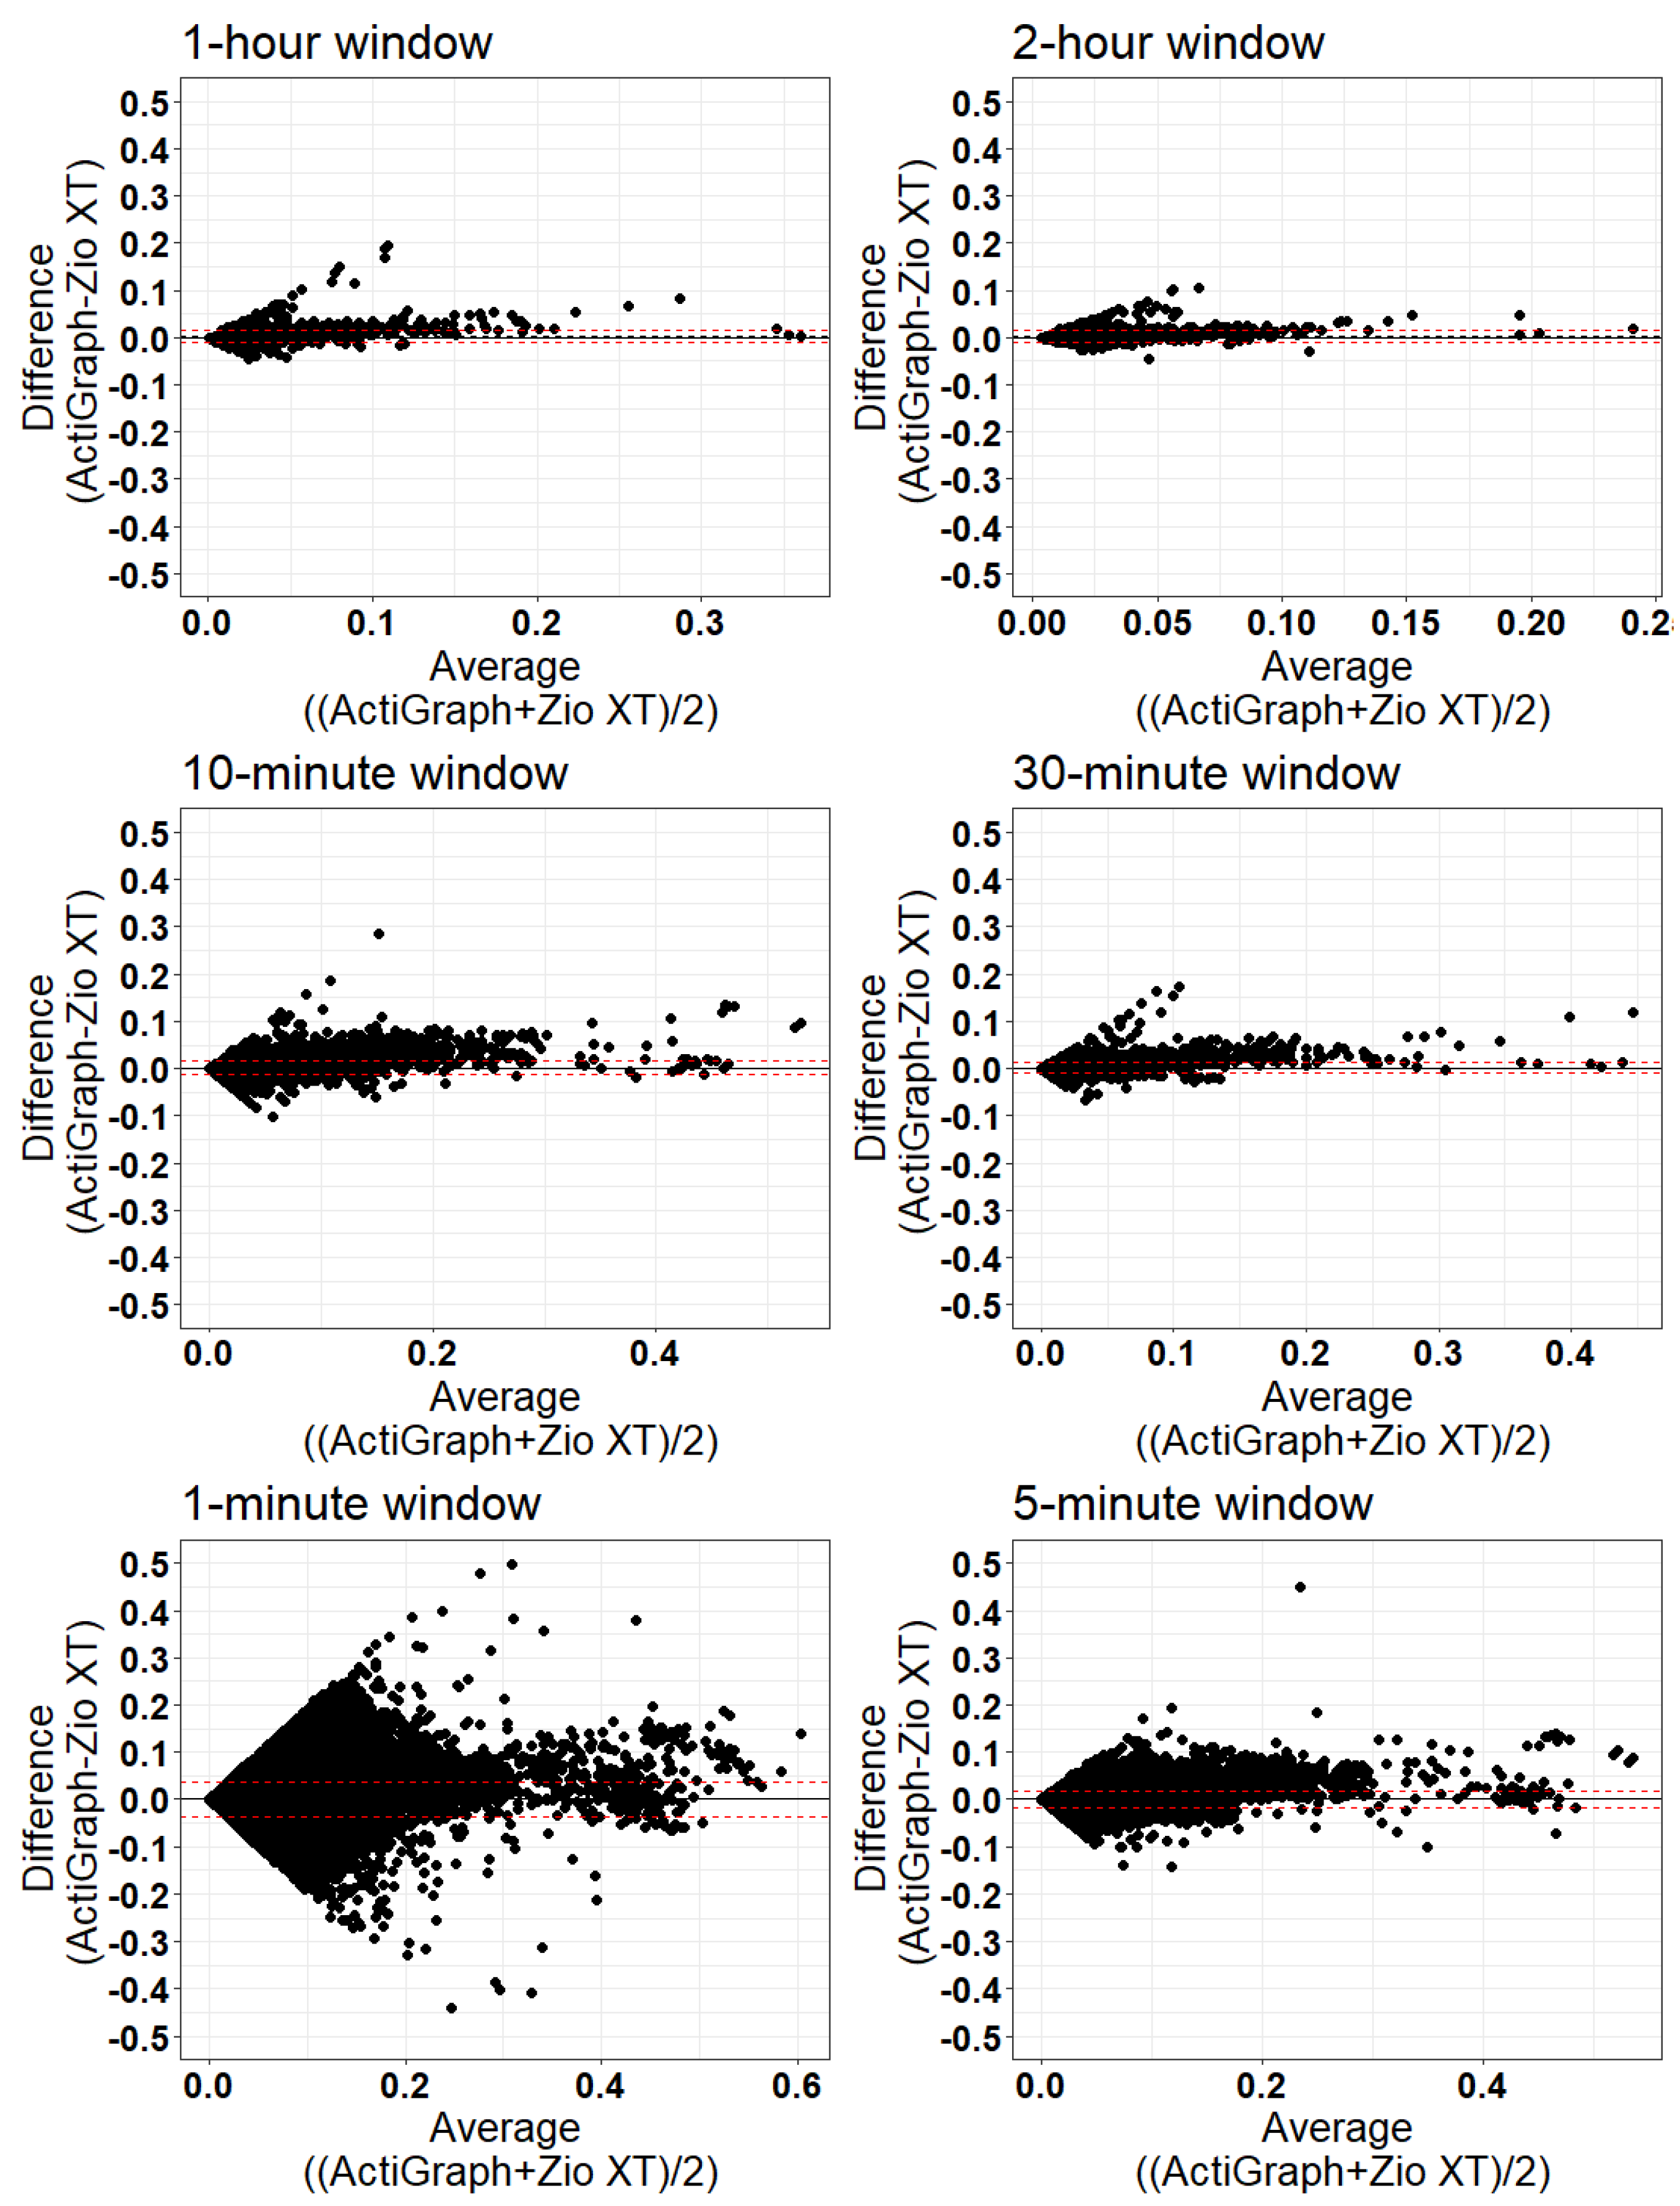
- Validation:
4. Discussion
5. Conclusions
Author Contributions
Funding
Institutional Review Board Statement
Data Availability Statement
Acknowledgments
Conflicts of Interest
References
- Warburton, D.E.; Nicol, C.W.; Bredin, S.S. Health benefits of physical activity: The evidence. Cmaj 2006, 174, 801–809. [Google Scholar] [CrossRef]
- Troiano, R.P.; McClain, J.J.; Brychta, R.J.; Chen, K.Y. Evolution of accelerometer methods for physical activity research. Br. J. Sports Med. 2014, 48, 1019–1023. [Google Scholar] [CrossRef]
- Migueles, J.H.; Cadenas-Sanchez, C.; Ekelund, U.; Nyström, C.D.; Mora-Gonzalez, J.; Lof, M.; Labayen, I.; Ruiz, J.R.; Ortega, F.B. Accelerometer Data Collection and Processing Criteria to Assess Physical Activity and Other Outcomes: A Systematic Review and Practical Considerations. Sports Med. 2017, 47, 1821–1845. [Google Scholar] [CrossRef]
- Prince, S.A.; Adamo, K.B.; Hamel, M.E.; Hardt, J.; Gorber, S.C.; Tremblay, M. A comparison of direct versus self-report measures for assessing physical activity in adults: A systematic review. Int. J. Behav. Nutr. Phys. Act. 2008, 5, 56. [Google Scholar] [CrossRef]
- Silsbury, Z.; Goldsmith, R.; Rushton, A. Systematic review of the measurement properties of self-report physical activity questionnaires in healthy adult populations. BMJ Open 2015, 5, e008430. [Google Scholar] [CrossRef]
- Kumar, K.; Sharma, A.; Tripathi, S.L. Sensors and their application. In Electronic Devices, Circuits, and Systems for Biomedical Applications; Tripathi, S.L., Balas, V.E., Mohapatra, S.K., Prakash, K.B., Nayak, J., Eds.; Elsevier: Amsterdam, The Netherlands, 2021; pp. 177–195. [Google Scholar] [CrossRef]
- Yang, C.-C.; Hsu, Y.-L. A Review of Accelerometry-Based Wearable Motion Detectors for Physical Activity Monitoring. Sensors 2010, 10, 7772–7788. [Google Scholar] [CrossRef] [PubMed]
- Bradley, S.M.; Michos, E.D.; Miedema, M.D. Physical Activity, Fitness, and Cardiovascular Health: Insights From Publications in JAMA Network Open. JAMA Netw. Open 2019, 2, e198343. [Google Scholar] [CrossRef]
- Soares-Miranda, L.; Sattelmair, J.; Chaves, P.; Duncan, G.E.; Siscovick, D.S.; Stein, P.K.; Mozaffarian, D. Physical activity and heart rate variability in older adults: The Cardiovascular Health Study. Circulation 2014, 129, 2100–2110. [Google Scholar] [CrossRef] [PubMed]
- Osterhues, H.-H.; Hanzel, S.R.; Kochs, M.; Hombach, V. Influence of physical activity on 24-h measurements of heart rate variability in patients with coronary artery disease. Am. J. Cardiol. 1997, 80, 1434–1437. [Google Scholar] [CrossRef] [PubMed]
- Young, F.L.; Leicht, A.S. Short-term stability of resting heart rate variability: Influence of position and gender. Appl. Physiol. Nutr. Metab. 2011, 36, 210–218. [Google Scholar] [CrossRef]
- Huikuri, H.V.; Niemelä, M.; Ojala, S.; Rantala, A.; Ikäheimo, M.; Airaksinen, K. Circadian rhythms of frequency domain measures of heart rate variability in healthy subjects and patients with coronary artery disease. Effects of arousal and upright posture. Circulation 1994, 90, 121–126. [Google Scholar] [CrossRef] [PubMed]
- Schrack, J.A.; Leroux, A.; Fleg, J.L.; Zipunnikov, V.; Simonsick, E.M.; Studenski, S.A.; Crainiceanu, C.; Ferrucci, L. Using heart rate and accelerometry to define quantity and intensity of physical activity in older adults. J. Gerontol. Ser. A 2018, 73, 668–675. [Google Scholar] [CrossRef] [PubMed]
- Leinonen, A.-M.; Ahola, R.; Kulmala, J.; Hakonen, H.; Vähä-Ypyä, H.; Herzig, K.-H.; Auvinen, J.; Keinänen-Kiukaanniemi, S.; Sievänen, H.; Tammelin, T.H.; et al. Measuring Physical Activity in Free-Living Conditions—Comparison of Three Accelerometry-Based Methods. Front. Physiol. 2017, 7, 681. [Google Scholar] [CrossRef] [PubMed]
- Karas, M.; Muschelli, J.; Leroux, A.; Urbanek, J.K.; Wanigatunga, A.A.; Bai, J.; Crainiceanu, C.M.; Schrack, J.A. Comparison of accelerometry-based measures of physical activity: Retrospective observational data analysis study. JMIR Mhealth Uhealth 2022, 10, e38077. [Google Scholar] [CrossRef]
- Etzkorn, L.H.; Liu, F.; Urbanek, J.K.; Heravi, A.S.; Magnani, J.W.; Plankey, M.W.; Margolich, J.B.; Witt, M.D.; Palella, F.J.; Haberlen, S.A. Patterns of objectively measured physical activity differ between men living with and without HIV. AIDS 2022, 36, 1553–1562. [Google Scholar] [CrossRef]
- Investigators, A. The Atherosclerosis risk in COMMUNIT (ARIC) study: Design and objectives. Am. J. Epidemiol. 1989, 129, 687–702. [Google Scholar] [CrossRef]
- Atherosclerosis Risk in Communities Study Description. Available online: https://sites.cscc.unc.edu/aric/ (accessed on 1 January 2023).
- Rooney, M.R.; Soliman, E.Z.; Lutsey, P.L.; Norby, F.L.; Loehr, L.R.; Mosley, T.H.; Zhang, M.; Gottesman, R.F.; Coresh, J.; Folsom, A.R. Prevalence and characteristics of subclinical atrial fibrillation in a community-dwelling elderly population: The ARIC study. Circ. Arrhythmia Electrophysiol. 2019, 12, e007390. [Google Scholar] [CrossRef]
- Dooley, E.E.; Pompeii, L.A.; Palta, P.; Martinez-Amezcua, P.; Hornikel, B.; Evenson, K.R.; Schrack, J.A.; Gabriel, K.P. Daily and hly patterns of physical activity and sedentary behavior of older adults: Atherosclerosis risk in communities (ARIC) study. Prev. Med. Rep. 2022, 28, 101859. [Google Scholar] [CrossRef]
- Fung, E.; Järvelin, M.-R.; Doshi, R.N.; Shinbane, J.S.; Carlson, S.K.; Grazette, L.P.; Chang, P.M.; Sangha, R.S.; Huikuri, H.V.; Peters, N.S. Electrocardiographic patch devices and contemporary wireless cardiac monitoring. Front. Physiol. 2015, 6. [Google Scholar] [CrossRef]
- Etzkorn, L. postuR. Available online: https://github.com/etzkorn/postuR (accessed on 1 January 2023).
- Vähä-Ypyä, H.; Vasankari, T.; Husu, P.; Suni, J.; Sievänen, H. A universal, accurate intensity-based classification of different physical activities using raw data of accelerometer. Clin. Physiol. Funct. Imaging 2015, 35, 64–70. [Google Scholar] [CrossRef]
- Karas, M.; Schrack, J.; Urbanek, J. Arctools: Processing and Physical Activity Summaries of Minute Level Activity Data. R Package Version. Available online: https://cran.r-project.org/web/packages/arctools/arctools.pdf (accessed on 1 January 2021).
- Choi, L.; Liu, Z.; Matthews, C.E.; Buchowski, M.S. Validation of accelerometer wear and nonwear time classification algorithm. Med. Sci. Sports Exerc. 2011, 43, 357. [Google Scholar] [CrossRef] [PubMed]
- Hamner, B.; Frasco, M.; LeDell, E. Evaluation Metrics for Machine Learning. Available online: https://github.com/mfrasco/Metrics (accessed on 1 January 2023).
- Navarro, D. Learning Statistics with R: A Tutorial for Psychology Students and Other Beginners: Version 0.5; University of Adelaide: Adelaide, Australia, 2013; ISBN 978-1-326-18972-3. Available online: http://health.adelaide.edu.au/psychology/ccs/teaching/lsr/ (accessed on 1 January 2023).
- Miller, J. Accelerometer technologies, specifications, and limitations. In Proceedings of the Internationational Conference on Ambulatory Monitoring and Physical Activity Measurement, IOP Publishing Ltd. Bristol, Tokyo, Japan, 17 June 2013. [Google Scholar]
- Sabia, S.; van Hees, V.T.; Shipley, M.J.; Trenell, M.I.; Hagger-Johnson, G.; Elbaz, A.; Kivimaki, M.; Singh-Manoux, A. Association between questionnaire-and accelerometer-assessed physical activity: The role of sociodemographic factors. Am. J. Epidemiol. 2014, 179, 781–790. [Google Scholar] [CrossRef] [PubMed]
- van Hees, V.T.; Renström, F.; Wright, A.; Gradmark, A.; Catt, M.; Chen, K.Y.; Löf, M.; Bluck, L.; Pomeroy, J.; Wareham, N.J. Estimation of daily energy expenditure in pregnant and non-pregnant women using a wrist-worn tri-axial accelerometer. PLoS ONE 2011, 6, e22922. [Google Scholar] [CrossRef] [PubMed]
- White, T.; Westgate, K.; Wareham, N.J.; Brage, S. Estimation of physical activity energy expenditure during free-living from wrist accelerometry in UK adults. PLoS ONE 2016, 11, e0167472. [Google Scholar] [CrossRef] [PubMed]
- Montoye, A.; Pivarnik, J.; Mudd, L.; Biswas, S.; Pfeiffer, K. Validation and Comparison of Accelerometers Worn on the Hip, Thigh, and Wrists for Measuring Physical Activity and Sedentary Behavior. AIMS Public Health 2016, 3, 298–312. [Google Scholar] [CrossRef]
- Mukaino, M.; Ogasawara, T.; Matsuura, H.; Aoshima, Y.; Suzuki, T.; Furuzawa, S.; Yamaguchi, M.; Nakashima, H.; Saitoh, E.; Tsukada, S. Validity of trunk acceleration measurement with a chest-worn monitor for assessment of physical activity intensity. BMC Sports Sci. Med. Rehabil. 2022, 14, 104. [Google Scholar] [CrossRef] [PubMed]
- Etzkorn, L.H.; Heravi, A.S.; Knuth, N.D.; Wu, K.C.; Post, W.S.; Urbanek, J.K.; Crainiceanu, C.M. Classification of free-living body posture with ECG patch accelerometers: Application to the multicenter AIDS cohort study. Stat. Biosci. 2023, 1–20. [Google Scholar] [CrossRef]
- Toshima, T.; Watanabe, T.; Goto, J.; Kobayashi, Y.; Otaki, Y.; Wanezaki, M.; Nishiyama, S.; Kutsuzawa, D.; Kato, S.; Tamura, H.; et al. Impact of activities of daily living on percutaneous coronary intervention and acute and long-term mortality in patients with acute myocardial infarction: Yamagata AMI registry. J. Cardiol. 2022, 80, 313–318. [Google Scholar] [CrossRef]
- Amidei, C.B.; Trevisan, C.; Dotto, M.; Ferroni, E.; Noale, M.; Maggi, S.; Corti, M.C.; Baggio, G.; Fedeli, U.; Sergi, G. Association of physical activity trajectories with major cardiovascular diseases in elderly people. Heart 2022, 108, 360. [Google Scholar] [CrossRef]
- Jacob, P.K.; Nicholas, G.B.; Lin, L.; Bradley, G.H.; Timothy, M.S.; Paul, W.J.; Lesley, H.C.; Adrian, F.H.; Melissa, A.G.; Brett, D.A. Association of Implantable Device Measured Physical Activity With Hospitalization for Heart Failure. JACC Heart Fail. 2020, 8, 280–288. [Google Scholar] [CrossRef]
- Varma, V.R.; Dey, D.; Leroux, A.; Di, J.; Urbanek, J.; Xiao, L.; Zipunnikov, V. Total volume of physical activity: TAC, TLAC or TAC (λ). Prev. Med. 2018, 106, 233–235. [Google Scholar] [CrossRef] [PubMed]
- Palmberg, L.; Rantalainen, T.; Rantakokko, M.; Karavirta, L.; Siltanen, S.; Skantz, H.; Saajanaho, M.; Portegijs, E.; Rantanen, T. The Associations of Activity Fragmentation With Physical and Mental Fatigability Among Community-Dwelling 75-, 80-, and 85-Year-Old People. J. Gerontol. Ser. A 2020, 75, e103–e110. [Google Scholar] [CrossRef] [PubMed]
- Antoniou, V.; Davos, C.H.; Kapreli, E.; Batalik, L.; Panagiotakos, D.B.; Pepera, G. Effectiveness of Home-Based Cardiac Rehabilitation, Using Wearable Sensors, as a Multicomponent, Cutting-Edge Intervention: A Systematic Review and Meta-Analysis. J. Clin. Med. 2022, 11, 3772. [Google Scholar] [CrossRef] [PubMed]
- Tirado-Andrés, F.; Araujo, A. Performance of clock sources and their influence on time synchronization in wireless sensor networks. Int. J. Distrib. Sens. Netw. 2019, 15, 1550147719879372. [Google Scholar] [CrossRef]


| Variable | Distribution |
|---|---|
| Age, Mean (SD) | 78.48 (4.65) |
| Gender: Female, N (%) | 152 (59.14%) |
| Race: White, N (%) | 214 (83.27%) |
| Window Length | Range of Correlation Coefficients * | Mean (SD) | Median (IQR) | N Subjects (%) with Correlation < 0.8 |
|---|---|---|---|---|
| 1 min | [0.30, 0.98] | 0.66 (0.15) | 0.66 (0.55, 0.78) | 205 (79.77) |
| 5 min | [0.54, 0.99] | 0.90 (0.08) | 0.91 (0.87, 0.95) | 21 (8.17) |
| 10 min | [0.70, 0.99] | 0.93 (0.05) | 0.94 (0.91, 0.96) | 10 (3.89) |
| 30 min | [0.66, 0.99] | 0.93 (0.06) | 0.94 (0.91, 0.97) | 14 (5.45) |
| 1 h | [0.54, 1] | 0.89 (0.09) | 0.92 (0.85, 0.95) | 33 (12.84) |
| 2 h | [0.20, 1] | 0.82 (0.15) | 0.87 (0.76, 0.93) | 88 (34.24) |
| Window Length | Range | Mean (SD) | Median (IQR) |
|---|---|---|---|
| 1 min | [24.26, 1844.07] | 349.37 (233.22) | 295.42 (198.74, 440.73) |
| 5 min | [11.68, 573.60] | 86.25 (76.08) | 62.99 (42.20, 100.68) |
| 10 min | [8.20, 430.22] | 56.80 (54.02) | 37.82 (27.98, 66.92) |
| 30 min | [4.71, 402.89] | 45.46 (50.42) | 29.91 (19.54, 49.06) |
| 1 h | [4.96, 782.90] | 52.56 (87.37) | 29.12 (17.98, 48.70) |
| 2 h | [3.96, 547.28] | 54.58 (72.41) | 31.66 (18.95, 58.59) |
| Window Length | Mean ActiGraph | Mean Zio | Bias (Mean Difference) | Limits of Agreement | % Outside Limits of Agreement |
|---|---|---|---|---|---|
| 1 min | 0.018 | 0.018 | 0.000575 | (−0.0027, 0.0039) | 5.06 |
| 5 min | 0.019 | 0.018 | 0.000994 | (−0.0024, 0.0044) | 7.00 |
| 10 min | 0.020 | 0.018 | 0.001312 | (−0.0023, 0.0050) | 7.00 |
| 30 min | 0.021 | 0.019 | 0.002010 | (−0.0023, 0.0063) | 6.61 |
| 1 h | 0.022 | 0.019 | 0.002583 | (−0.0026, 0.0077) | 8.17 |
| 2 h | 0.022 | 0.019 | 0.003308 | (−0.0027, 0.0093) | 7.00 |
| Window Length | N | Mean ActiGraph | Mean Zio | Bias (Mean Difference) | Limits of Agreement | % Outside Limits of Agreement |
|---|---|---|---|---|---|---|
| 1 min | 991,340 | 0.019 | 0.018 | 0.000600 | (−0.0360, 0.0372) | 5.74 |
| 5 min | 198,161 | 0.019 | 0.018 | 0.001013 | (−0.0169, 0.0189) | 5.03 |
| 10 min | 99,012 | 0.020 | 0.019 | 0.001328 | (−0.0130, 0.01570) | 4.33 |
| 30 min | 32,917 | 0.021 | 0.019 | 0.002029 | (−0.0105, 0.0146) | 3.81 |
| 1 h | 16,398 | 0.022 | 0.019 | 0.002600 | (−0.0107, 0.0159) | 3.24 |
| 2 h | 8133 | 0.022 | 0.019 | 0.003321 | (−0.0095, 0.0162) | 4.06 |
Disclaimer/Publisher’s Note: The statements, opinions and data contained in all publications are solely those of the individual author(s) and contributor(s) and not of MDPI and/or the editor(s). MDPI and/or the editor(s) disclaim responsibility for any injury to people or property resulting from any ideas, methods, instructions or products referred to in the content. |
© 2024 by the authors. Licensee MDPI, Basel, Switzerland. This article is an open access article distributed under the terms and conditions of the Creative Commons Attribution (CC BY) license (https://creativecommons.org/licenses/by/4.0/).
Share and Cite
Davoudi, A.; Urbanek, J.K.; Etzkorn, L.; Parikh, R.; Soliman, E.Z.; Wanigatunga, A.A.; Gabriel, K.P.; Coresh, J.; Schrack, J.A.; Chen, L.Y. Validation of a Zio XT Patch Accelerometer for the Objective Assessment of Physical Activity in the Atherosclerosis Risk in Communities (ARIC) Study. Sensors 2024, 24, 761. https://doi.org/10.3390/s24030761
Davoudi A, Urbanek JK, Etzkorn L, Parikh R, Soliman EZ, Wanigatunga AA, Gabriel KP, Coresh J, Schrack JA, Chen LY. Validation of a Zio XT Patch Accelerometer for the Objective Assessment of Physical Activity in the Atherosclerosis Risk in Communities (ARIC) Study. Sensors. 2024; 24(3):761. https://doi.org/10.3390/s24030761
Chicago/Turabian StyleDavoudi, Anis, Jacek K. Urbanek, Lacey Etzkorn, Romil Parikh, Elsayed Z. Soliman, Amal A. Wanigatunga, Kelley Pettee Gabriel, Josef Coresh, Jennifer A. Schrack, and Lin Yee Chen. 2024. "Validation of a Zio XT Patch Accelerometer for the Objective Assessment of Physical Activity in the Atherosclerosis Risk in Communities (ARIC) Study" Sensors 24, no. 3: 761. https://doi.org/10.3390/s24030761
APA StyleDavoudi, A., Urbanek, J. K., Etzkorn, L., Parikh, R., Soliman, E. Z., Wanigatunga, A. A., Gabriel, K. P., Coresh, J., Schrack, J. A., & Chen, L. Y. (2024). Validation of a Zio XT Patch Accelerometer for the Objective Assessment of Physical Activity in the Atherosclerosis Risk in Communities (ARIC) Study. Sensors, 24(3), 761. https://doi.org/10.3390/s24030761