Influence of Pitch on Surface Dose Distribution and Image Noise of Computed Tomography Scans
Abstract
1. Introduction
2. Materials and Methods
2.1. Overview of Measurement and Analysis
2.2. Measurement
- A fixture was used to secure the CWP to the table.
- The central CWP axis was aligned with the central CT scanner gantry axis using a 256-slice CT positioning laser. The film was attached at the center positions (0, 160, 0) to (0, 160, 250) on the surface of the CWP, and metal spheres were attached at positions (0, 160, 10) and (0, 160, 240) on the film to mark the start and end scan positions, respectively.
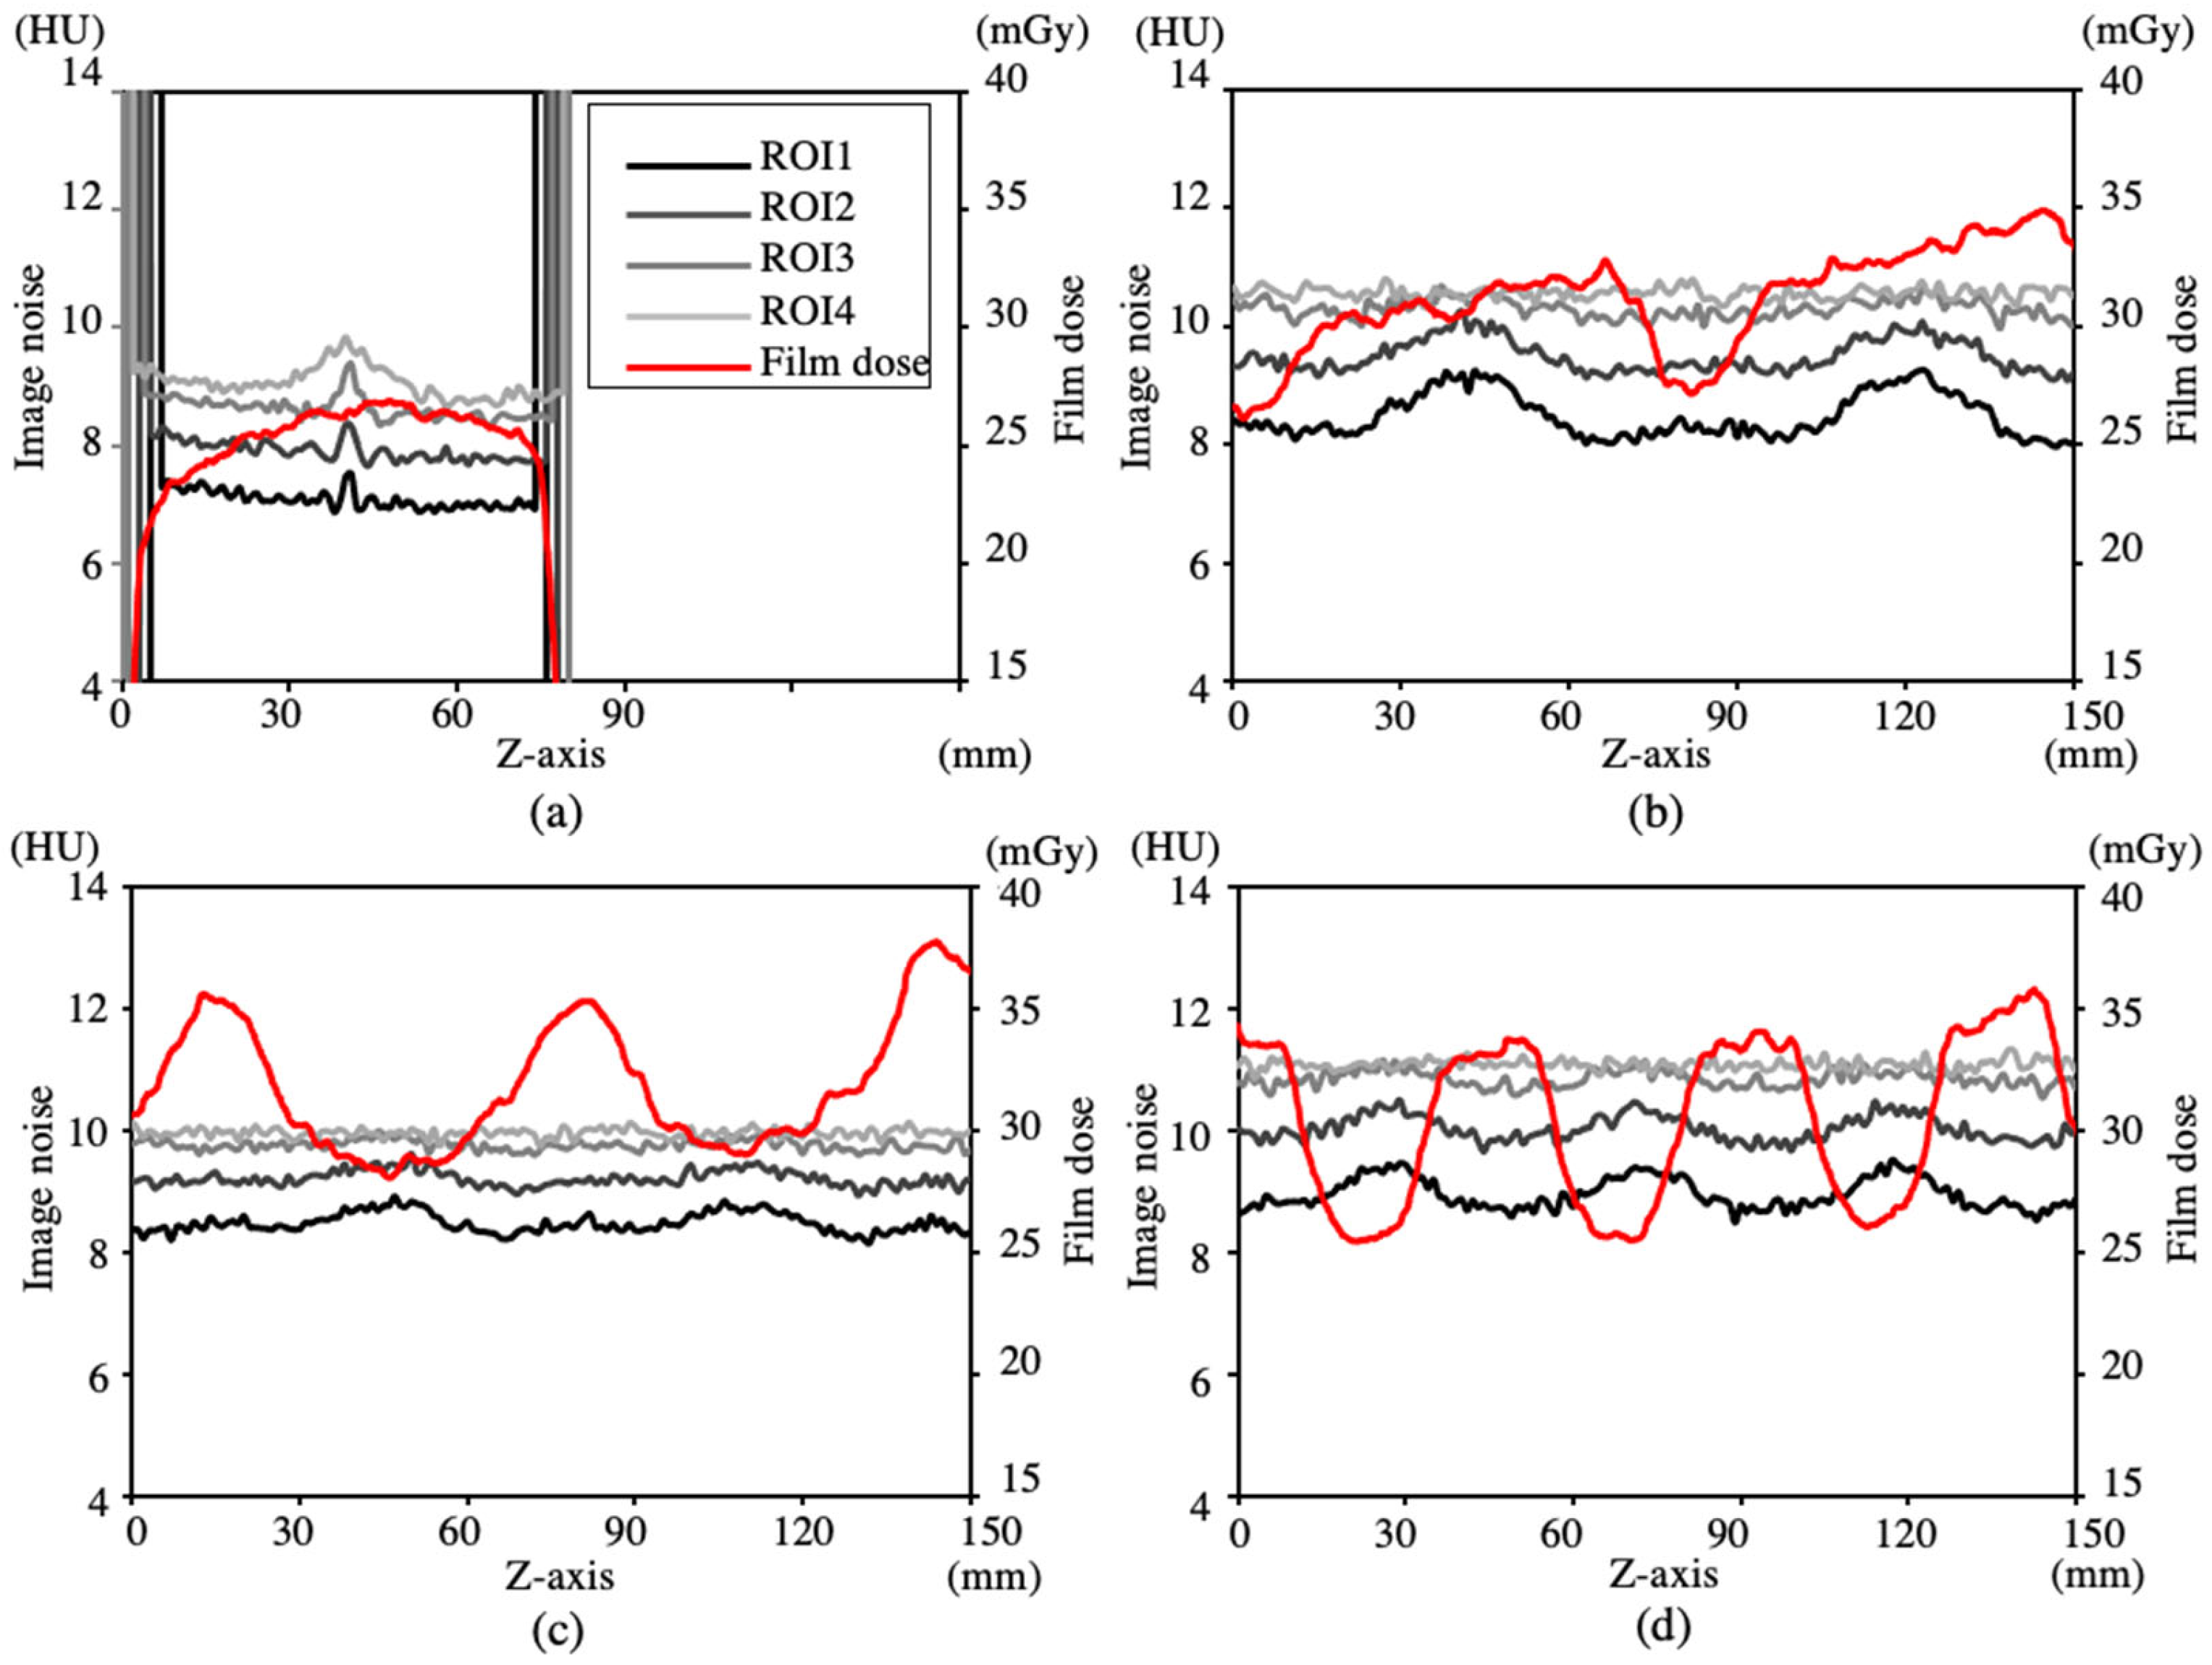
- The projection data for an axial scan and three helical scans with pitch values of 0.996, 0.696, and 0.399 were reconstructed using FBP and IMR.
2.3. Analysis
3. Result
3.1. Image Analysis
3.2. Frequency Analysis
4. Discussion
Author Contributions
Funding
Institutional Review Board Statement
Informed Consent Statement
Data Availability Statement
Conflicts of Interest
Appendix A
| Pitch | Surface Dose | Image Noise (HU) | ||||
|---|---|---|---|---|---|---|
| (mGy) | FBP Method | |||||
| ROI1 | ROI2 | ROI3 | ROI4 | |||
| Axial scan | Profile average | 24.66 | 8.60 | 9.94 | 10.76 | 10.95 |
| Profile S.D. | 0.84 | 0.29 | 0.37 | 0.46 | 0.54 | |
| Helical scan with pitch 0.992 | Profile average | 23.13 | 9.43 | 11.06 | 12.08 | 12.19 |
| Profile S.D. | 1.01 | 0.55 | 0.38 | 0.22 | 0.18 | |
| Helical scan with pitch 0.696 | Profile average | 22.95 | 9.23 | 10.85 | 11.82 | 12.09 |
| Profile S.D. | 4.18 | 0.27 | 0.20 | 0.13 | 0.13 | |
| Helical scan with pitch 0.399 | Profile average | 22.37 | 9.12 | 10.76 | 11.75 | 11.70 |
| Profile S.D. | 1.33 | 0.19 | 0.16 | 0.14 | 0.11 | |

References
- Organization for Economic Co-Operation and Development Health Statistics. 2021. Available online: https://www.oecd.org/health/health-data.htm (accessed on 8 October 2021).
- Berrington de González, A.; Darby, S. Risk of cancer from diagnostic X-rays: Estimates for the UK and 14 other countries. Lancet 2004, 363, 345–351. [Google Scholar] [CrossRef] [PubMed]
- Hsieh, J. Computed Tomography: Principles, Design, Artifacts, and Recent Advances; SPIE—The International Society for Optical Engineering: Bellingham, WA, USA, 2015. [Google Scholar] [CrossRef]
- Kalender, W.A. Computed Tomography; Fundamentals, System Technology, Image Quality, Applications, 3rd ed.; Publicis MCD Verlag: München, Germany, 2011. [Google Scholar]
- Hsieh, J. Nonstationary noise characteristics of the helical scan and its impact on image quality and artifacts. Med. Phys. 1997, 24, 1375–1384. [Google Scholar] [CrossRef] [PubMed]
- Christner, J.A.; Stierstorfer, K.; Primak, A.N.; Eusemann, C.D.; Flohr, T.G.; McCollough, C.H. Evaluation of z-axis resolution and image noise for nonconstant velocity spiral CT data reconstructed using a weighted 3D filtered backprojection (WFBP) reconstruction algorithm. Med. Phys. 2010, 37, 897–906. [Google Scholar] [CrossRef] [PubMed]
- Hara, T.; Ichikawa, K.; Sanada, S.; Ida, Y. Image quality dependence on in-plane positions and directions for MDCT images. Eur. J. Radiol. 2010, 75, 114–121. [Google Scholar] [CrossRef] [PubMed]
- Frederic, A.M.; Gregory, B.; Mohamed, B.; Paul, A.; Franory, B.; Mohamed, B.; Paul, A. 3D noise power spectrum applied on clinical MDCT scanners: Effects of reconstruction algorithms and reconstruction filters. Proc. SPIE 2011, 7961, 119–130. [Google Scholar] [CrossRef]
- Li, K.; Tang, J.; Chen, G.H. Statistical model based iterative reconstruction (MBIR) in clinical CT systems: Experimental assessment of noise performance. Med. Phys. 2014, 41, 041906. [Google Scholar] [CrossRef]
- Greffier, J.; Larbi, A.; Frandon, J.; Moliner, G.; Beregi, J.P.; Pereira, F. Comparison of noise-magnitude and noise-texture across two generations of iterative reconstruction algorithms from three manufacturers. Diagn. Interv. Imaging 2019, 100, 401–410. [Google Scholar] [CrossRef]
- Lambert, J.W.; Phillips, E.D.; Villanueva-Meyer, J.E.; Nardo, L.; Facchetti, L.; Gould, R.G. Axial or helical? Considerations for wide collimation CT scanners capable of volumetric imaging in both modes. Med. Phys. 2017, 44, 5718–5725. [Google Scholar] [CrossRef]
- Boland, G.W.; Lee, M.J.; Gazelle, G.S.; Halpern, E.F.; McNicholas, M.M.; Mueller, P.R. Characterization of adrenal masses using unenhanced CT: An analysis of the CT literature. Am. J. Roentgenol. 1998, 171, 201–204. [Google Scholar] [CrossRef]
- Caoili, E.M.; Korobkin, M.; Francis, I.R.; Cohan, R.H.; Platt, J.F.; Dunnick, N.R.; Raghupathi, K.I. Adrenal masses: Characterization with combined unenhanced and delayed enhanced CT. Radiology 2002, 222, 629–633. [Google Scholar] [CrossRef]
- Boyce, C.J.; Pickhardt, P.J.; Kim, D.H.; Taylor, A.J.; Winter, T.C.; Bruce, R.J.; Lindstrom, M.J.; Hinshaw, J.L. Hepatic steatosis (fatty liver disease) in asymptomatic adults identified by unenhanced low-dose CT. Am. J. Roentgenol. 2010, 194, 623–628. [Google Scholar] [CrossRef]
- Zerhouni, E.A.; Boukadoum, M.; Siddiky, M.A.; Newbold, J.M.; Stone, D.C.; Shirey, M.P.; Spivey, J.F.; Hesselman, C.W.; Leo, F.P.; Stitik, F.P. A standard phantom for quantitative CT analysis of pulmonary nodules. Radiology 1983, 149, 767–773. [Google Scholar] [CrossRef]
- Szczykutowicz, T.P.; DuPlissis, A.; Pickhardt, P.J. Variation in CT number and image noise uniformity according to patient positioning in MDCT. Am. J. Roentgenol. 2017, 208, 1064–1072. [Google Scholar] [CrossRef]
- Mali, S.A.; Ibrahim, A.; Woodruff, H.C.; Andrearczyk, V.; Müller, H.; Primakov, S.; Salahuddin, Z.; Chatterjee, A.; Lambin, P. Making Radiomics more reproducible across scanner and imaging protocol variations: A review of harmonization methods. J. Pers. Med. 2021, 11, 842. [Google Scholar] [CrossRef]
- Mehta, D.; Thompson, R.; Morton, T.; Dhanantwari, A.; Shefer, E. Iterative model reconstruction: Simultaneously lowered computed tomography radiation dose and improved image quality. Med. Phys. Int. J. 2013, 1, 147–155. [Google Scholar]
- Thomas, G.; Chu, R.Y.; Rabe, F. A study of GafChromic XR Type R film response with reflective-type densitometers and economical flatbed scanners. J. Appl. Clin. Med. Phys. 2003, 4, 307–314. [Google Scholar] [CrossRef]
- Blair, A.; Meyer, J. Characteristics of Gafchromic XR-RV2 radiochromic film. Med. Phys. 2009, 36, 3050–3058. [Google Scholar] [CrossRef]
- Rampado, O.; Garelli, E.; Ropolo, R. Computed tomography dose measurements with radiochromic films and a flatbed scanner. Med. Phys. 2010, 37, 189–196. [Google Scholar] [CrossRef]
- Tominaga, M.; Kawataa, Y.; Niki, N.; Moriyama, N.; Yamada, K.; Ueno, J.; Nishitani, H. Measurements of multidetector CT surface dose distributions using a film dosimeter and chest phantom. Med. Phys. 2011, 38, 2467–2478. [Google Scholar] [CrossRef]
- Jackson, S.R.; Ahmad, S.; Hu, Y.; Ruan, C. Evaluation of different techniques for CT radiation profile width measurement. J. Appl. Clin. Med. Phys. 2013, 14, 4122. [Google Scholar] [CrossRef]
- Li, B.; Behrman, R.H. An investigation into factors affecting the precision of CT radiation dose profile width measurements using radiochromic films. Med. Phys. 2015, 42, 1765–1772. [Google Scholar] [CrossRef]
- Niroomand-Rad, A.; Blackwell, C.R.; Coursey, B.M.; Gall, K.P.; Galvin, J.M.; McLaughlin, W.L.; Meigooni, A.S.; Nath, R.; Rodgers, J.E.; Soares, C.G. Radiochromic film dosimetry: Recommendations of AAPM radiation therapy Committee Task Group 55. Med. Phys. 1998, 25, 2093–2115. [Google Scholar] [CrossRef] [PubMed]
- Niroomand-Rad, A.; Chiu-Tsao, S.T.; Grams, M.P.; Lewis, D.F.; Soares, C.G.; Van Battum, L.J.; Das, I.J.; Trichter, S.; Kissick, M.W.; Massillon-Jl, G.; et al. Report of AAPM task Group 235 Radiochromic film dosimetry: An update to TG-55. Med. Phys. 2020, 47, 5986–6025. [Google Scholar] [CrossRef] [PubMed]
- Buck, J.R.; Daniel, M.M.; Singer, A.C. Computer Explorations in Signals and Systems Using MATLAB, 2nd ed.; Prentice Hall: Upper Saddle River, NJ, USA, 2001. [Google Scholar]
- Oppenheim, A.V.; Ronald, W.S.; John, R.B. Discrete-Time Signal Processing; Prentice Hall: Upper Saddle River, NJ, USA, 1999. [Google Scholar]
- Christianson, O.; Winslow, J.; Frush, D.P.; Samei, E. Automated technique to measure noise in clinical CT examinations. Am. J. Roentgenol. 2015, 205, W93–W99. [Google Scholar] [CrossRef] [PubMed]
- Tian, X.; Samei, E. Accurate assessment and prediction of noise in clinical CT images. Med. Phys. 2016, 41, 475–482. [Google Scholar] [CrossRef]


| Film Dosimeter | Ionization Chamber Dosimeter | Average Film Dose/Average Ionization Chamber Dose (%) | |||
|---|---|---|---|---|---|
| Pitch | Average Film Dose (mGy) | S.D. | Average Ionization Chamber Dose (mGy) | S.D. | |
| 0.992 | 32.81 | 1.151 | 32.40 | 0.210 | 1.013 |
| 0.696 | 31.80 | 0.828 | 32.42 | 0.188 | 0.981 |
| 0.399 | 31.64 | 0.627 | 32.18 | 0.013 | 0.983 |
| Pitch | Surface Dose (mGy) | Image Noise (HU) | ||||||||
|---|---|---|---|---|---|---|---|---|---|---|
| FBP | IMR | |||||||||
| ROI1 | ROI2 | ROI3 | ROI4 | ROI1 | ROI2 | ROI3 | ROI4 | |||
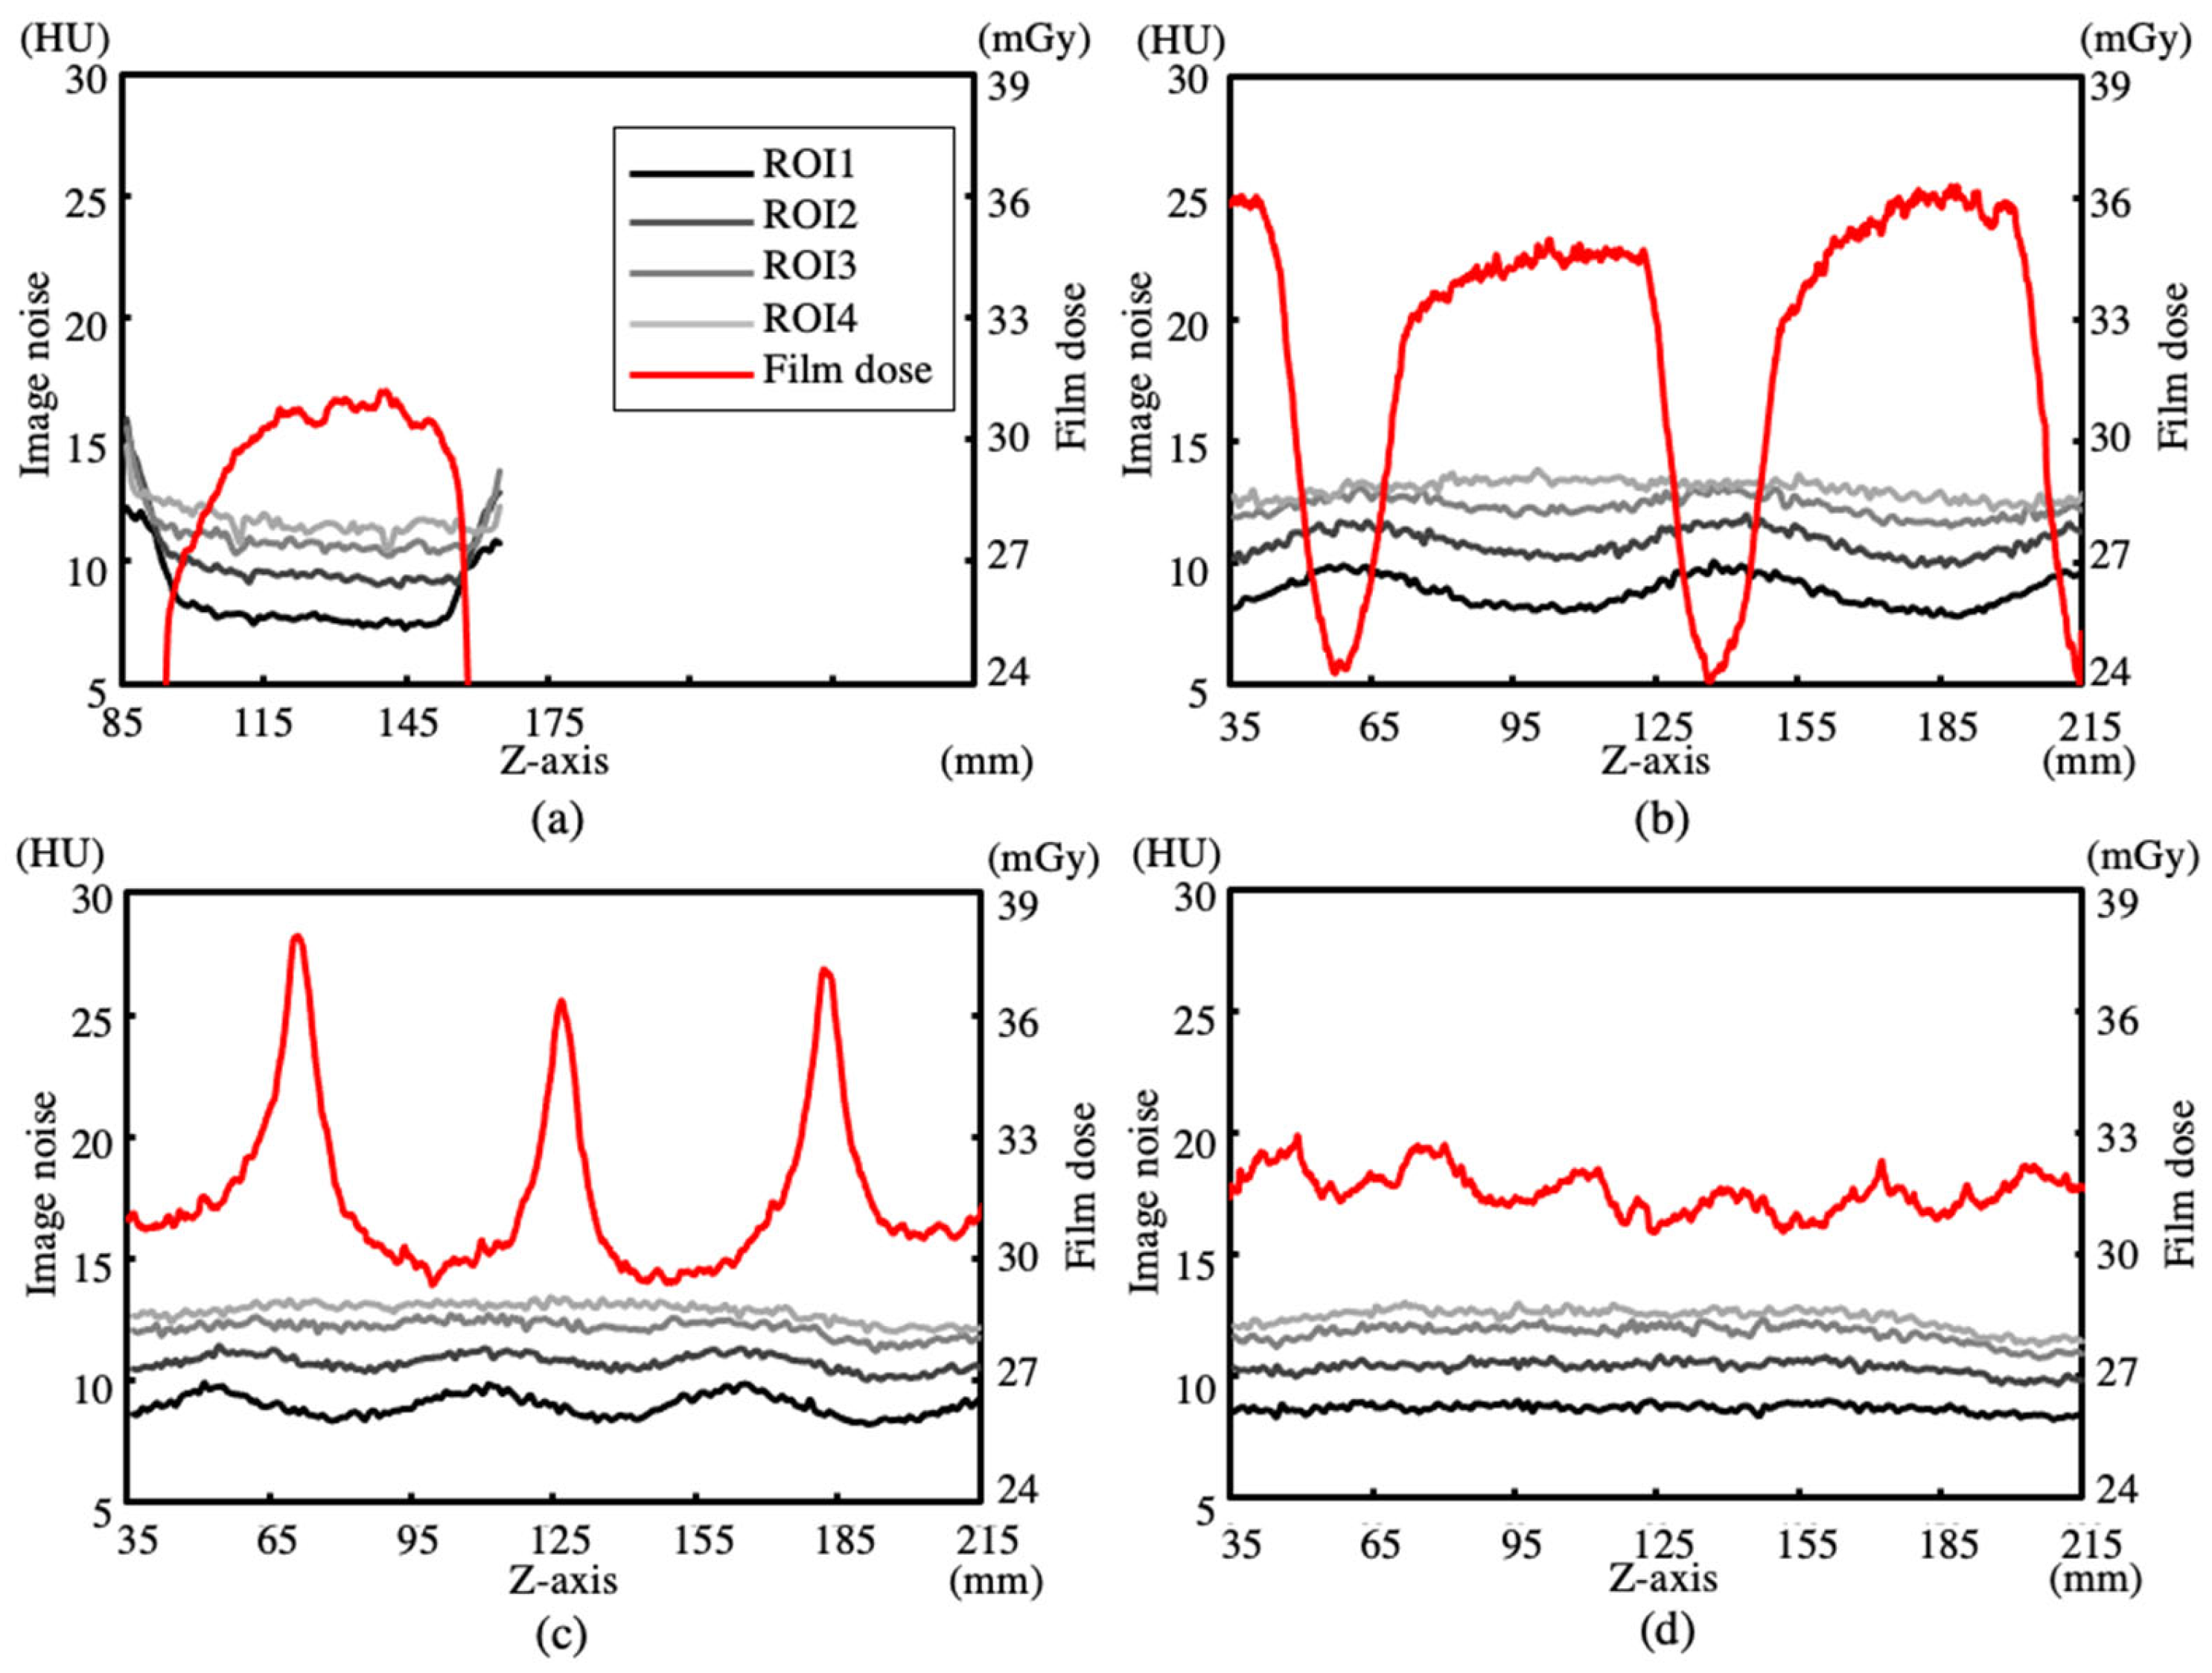
| Axial scan | Profile average | 27.06 | 20.42 | 25.47 | 28.76 | 30.23 | 8.44 | 10.10 | 11.09 | 11.68 |
| Profile S.D. | 5.53 | 2.94 | 3.23 | 2.48 | 1.70 | 1.37 | 1.38 | 0.95 | 0.62 | |
| Helical scan with a pitch of 0.992 | Profile average | 31.67 | 21.69 | 27.64 | 32.16 | 34.38 | 8.96 | 10.86 | 12.31 | 13.04 |
| Profile S.D. | 4.11 | 1.97 | 1.62 | 0.98 | 0.48 | 0.63 | 0.53 | 0.40 | 0.37 | |
| Helical scan with a pitch of 0.696 | Profile average | 31.48 | 21.5 | 27.25 | 31.97 | 34.36 | 8.91 | 10.73 | 12.13 | 12.85 |
| Profile S.D. | 2.00 | 1.59 | 1.04 | 0.56 | 0.37 | 0.45 | 0.34 | 0.32 | 0.32 | |
| Helical scan with a pitch of 0.399 | Profile average | 31.45 | 21.24 | 27.12 | 32.34 | 34.31 | 8.67 | 10.39 | 11.77 | 12.44 |
| Profile S.D. | 0.50 | 0.80 | 0.73 | 0.51 | 0.35 | 0.17 | 0.25 | 0.38 | 0.39 | |
Disclaimer/Publisher’s Note: The statements, opinions and data contained in all publications are solely those of the individual author(s) and contributor(s) and not of MDPI and/or the editor(s). MDPI and/or the editor(s) disclaim responsibility for any injury to people or property resulting from any ideas, methods, instructions or products referred to in the content. |
© 2023 by the authors. Licensee MDPI, Basel, Switzerland. This article is an open access article distributed under the terms and conditions of the Creative Commons Attribution (CC BY) license (https://creativecommons.org/licenses/by/4.0/).
Share and Cite
Yamada, K.; Kawata, Y.; Amano, M.; Suzuki, H.; Tominaga, M.; Sasaki, M.; Nishiyama, H.; Harada, M.; Niki, N. Influence of Pitch on Surface Dose Distribution and Image Noise of Computed Tomography Scans. Sensors 2023, 23, 3472. https://doi.org/10.3390/s23073472
Yamada K, Kawata Y, Amano M, Suzuki H, Tominaga M, Sasaki M, Nishiyama H, Harada M, Niki N. Influence of Pitch on Surface Dose Distribution and Image Noise of Computed Tomography Scans. Sensors. 2023; 23(7):3472. https://doi.org/10.3390/s23073472
Chicago/Turabian StyleYamada, Kenji, Yoshiki Kawata, Masafumi Amano, Hidenobu Suzuki, Masahide Tominaga, Motoharu Sasaki, Hikaru Nishiyama, Masafumi Harada, and Noboru Niki. 2023. "Influence of Pitch on Surface Dose Distribution and Image Noise of Computed Tomography Scans" Sensors 23, no. 7: 3472. https://doi.org/10.3390/s23073472
APA StyleYamada, K., Kawata, Y., Amano, M., Suzuki, H., Tominaga, M., Sasaki, M., Nishiyama, H., Harada, M., & Niki, N. (2023). Influence of Pitch on Surface Dose Distribution and Image Noise of Computed Tomography Scans. Sensors, 23(7), 3472. https://doi.org/10.3390/s23073472


