


Effects of the Uncertainty of Interpersonal Communications on Behavioral Responses of the Participants in an Immersive Virtual Reality Experience: A Usability Study


Abstract
:1. Introduction
- RQ1: How do the participants rate their experience with different tasks in terms of perceived uncertainty?
- RQ2: How do different degrees of uncertainty affect users’ behavior and performance in this immersive virtual workplace scenario?
- RQ3: How are the users’ subjective responses to uncertainty related to the objective responses?
- RQ4: How does the user evaluate the quality of his/her experience?
2. Related Work
- Gone Home [54] is a first-person exploration game designed to put players in unknown situations, engaging them to stay and accomplish some tasks, such as uncovering the narration by non-linear progression through searching the space. This game puts a player in the shoes of a young woman who returns home and finds that her family is absent. As Veale et al. [55] also discussed, Gone Home is a video game that uses effective storytelling to create empathy and a sense of responsibility in users by placing them within a recent historical moment. In this way, it exposes the user to the positive and negative elements of the past and encourages him/her to stay in the game and reflect on these elements [56]. While not strong on interactivity, the game through a careful visual, spatial, and audio design of the environment leads its users to explore the house along a twisting, uncertain path and find out what happened to the woman’s family through an analysis of imperfect clues from the memorabilia, journals, and other items left around the various rooms. During the experience, there are notes, voices, and letters from or to her family that motivate and guide her in the exploration. These items of cues can be kept in the inventory and reviewed whenever desired [54]. Considering an interest in the study of navigational behaviors of users, Bonnie Ruberg [57] argues that with a deeper analysis of the interactive elements of the game, the player path is linear instead of meandering despite what it seems the game encourages players to do. The path is already set and the locked, or hidden doors prevent the user to have access to some areas unless they trigger an event or find an object that unlocks this barrier in a predefined order.
- Don’t Starve [58] is a survival game that places the user in the role of a scientist who finds himself in a strange and unfamiliar world. The goal is to collect and effectively use survival tools. An uncertain scenario amounts to the interaction with the frogs in the game, as this creates ambiguity, as it is unclear whether they are hostile. For example, they can represent food, but different outcomes may result from eating them. The game successfully engages the user to accept this ambiguity till effectively able to develop higher-level strategies to interact with them. Farah et al. [59] studied the multiplayer expansion of the game to track cooperative features and teamwork behavioral markers.
- Wenge xu et al. [60] developed a motion-based survival game, GestureFit, that involves the user in a fight with a monster. They induced uncertainty in the system through three uncertain game elements: false attacks (creating the perception that there would be a chance that the system is tricking the player to waste a defense move by defending against a false attack), misses (creating the perception that there would be a chance that the actual hit will be interpreted as a miss), and critical hits (creating the perception that there would be a chance that an attack would be a critical attack and produce more damage than a normal one). In this way, they created two different levels of uncertainty, one with inducing these uncertain elements into the game and the other without. After, they conducted a study to measure the effects of levels of uncertainty (certain and uncertain), the display type (VR and LD), and age (young adults and middle-aged adults) on the game experience, performance, and exertion level. Their results showed that for the kind of game they designed, virtual reality could improve game performance. In addition, they found that the uncertain elements that they applied in their design might not help enhance the overall game experience, but could help increase the user’s exertion.
- RelicVE [61] is a virtual reality (VR) game that gives the user a similar role to an archaeologist and engages him in an exploration process of an archaeological discovery experience. It exploits uncertainty in the design of their exploration process by placing the user in a situation where s/he does not know the shape and features of the target artifact and only can discover it by gradually and strategically using available tools and physical movements. In this way, when the user hits specific triggers, a new part of the information about the artifact will be uncovered. They also managed the complexity of the game by the complexity of the shape and volume of the artifact. They integrated VR interaction techniques in the design of their virtual system to create an experience close to the real-world experience of archaeologists and in this way increased the immersion and physical activity of the user during the experience. In addition, they used a timer and a health bar to add the element of time pressure to the experience. To evaluate the experience, the authors also conducted a usability study that found the experience to be innovative as it can improve players’ learning and motivation by adding the elements of uncertainty into the design.
3. Experimental Setting
3.1. Participants
3.2. Materials
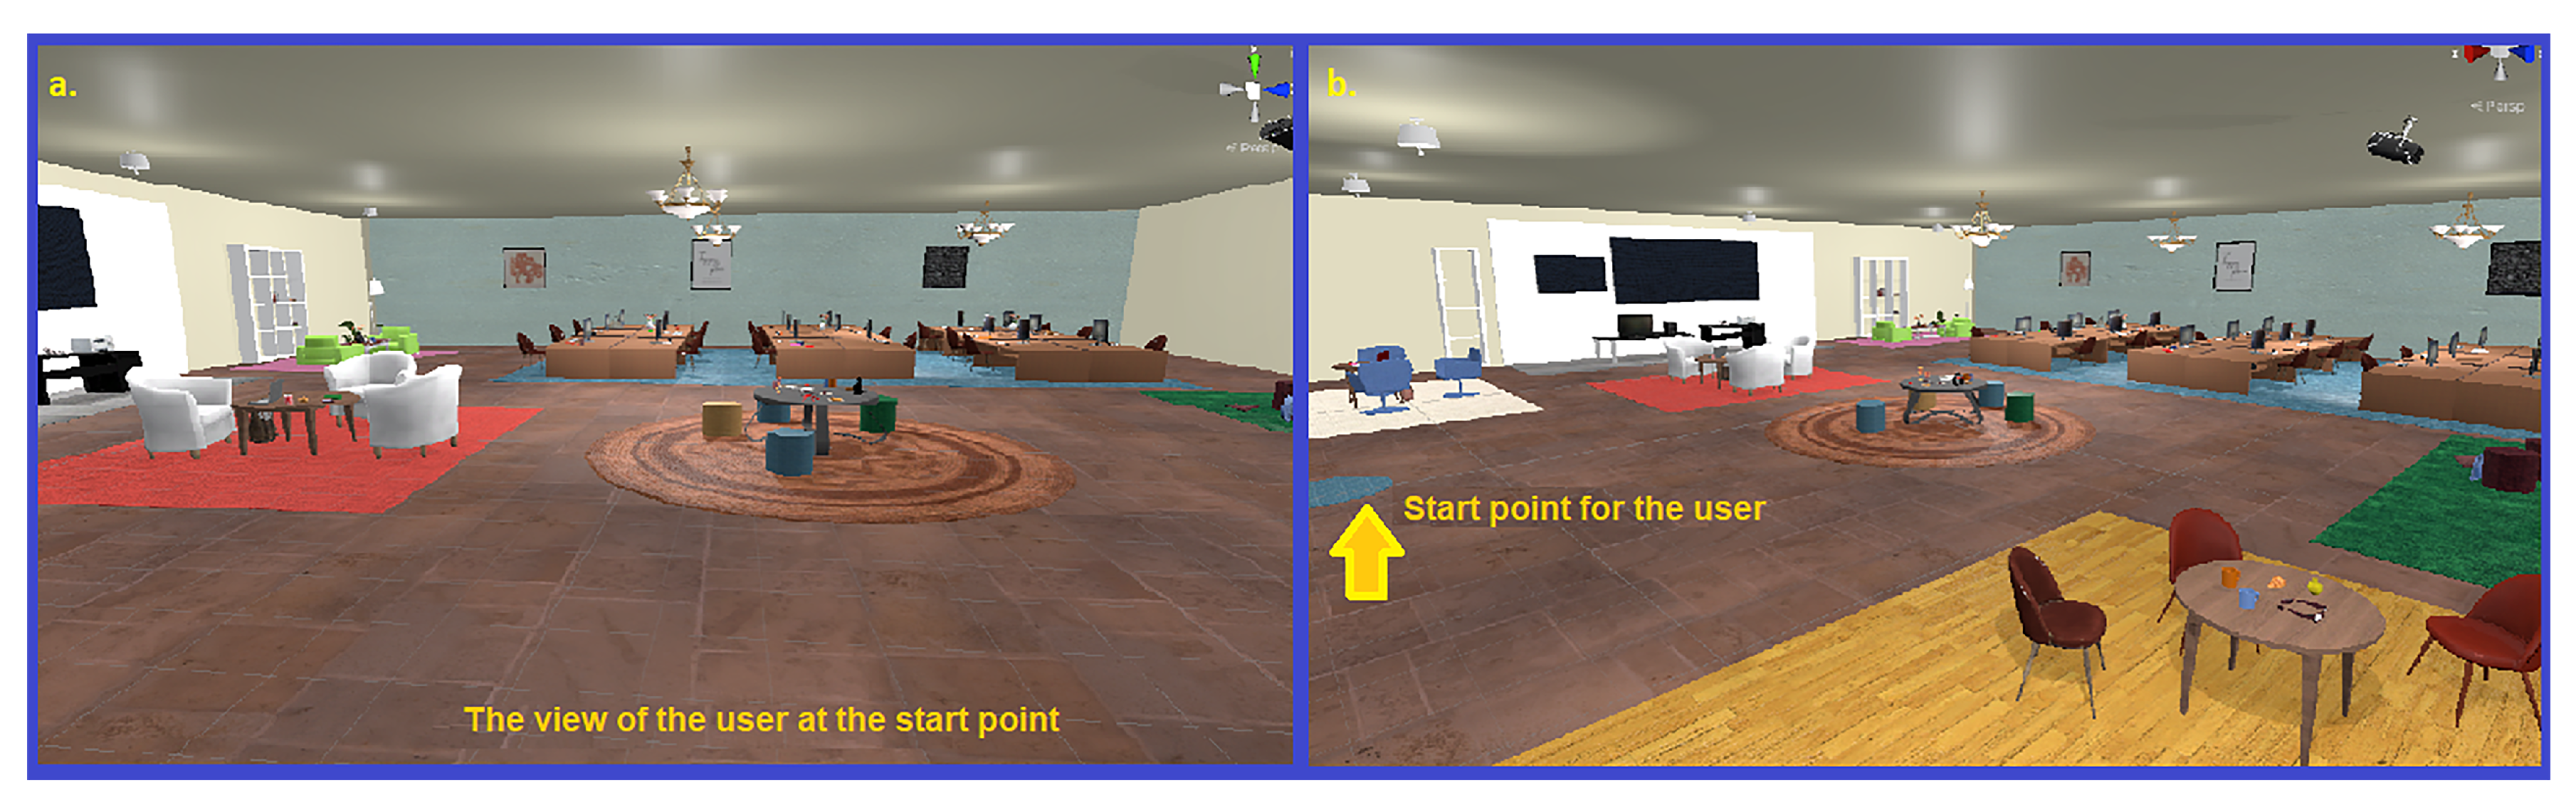
3.2.1. Setup
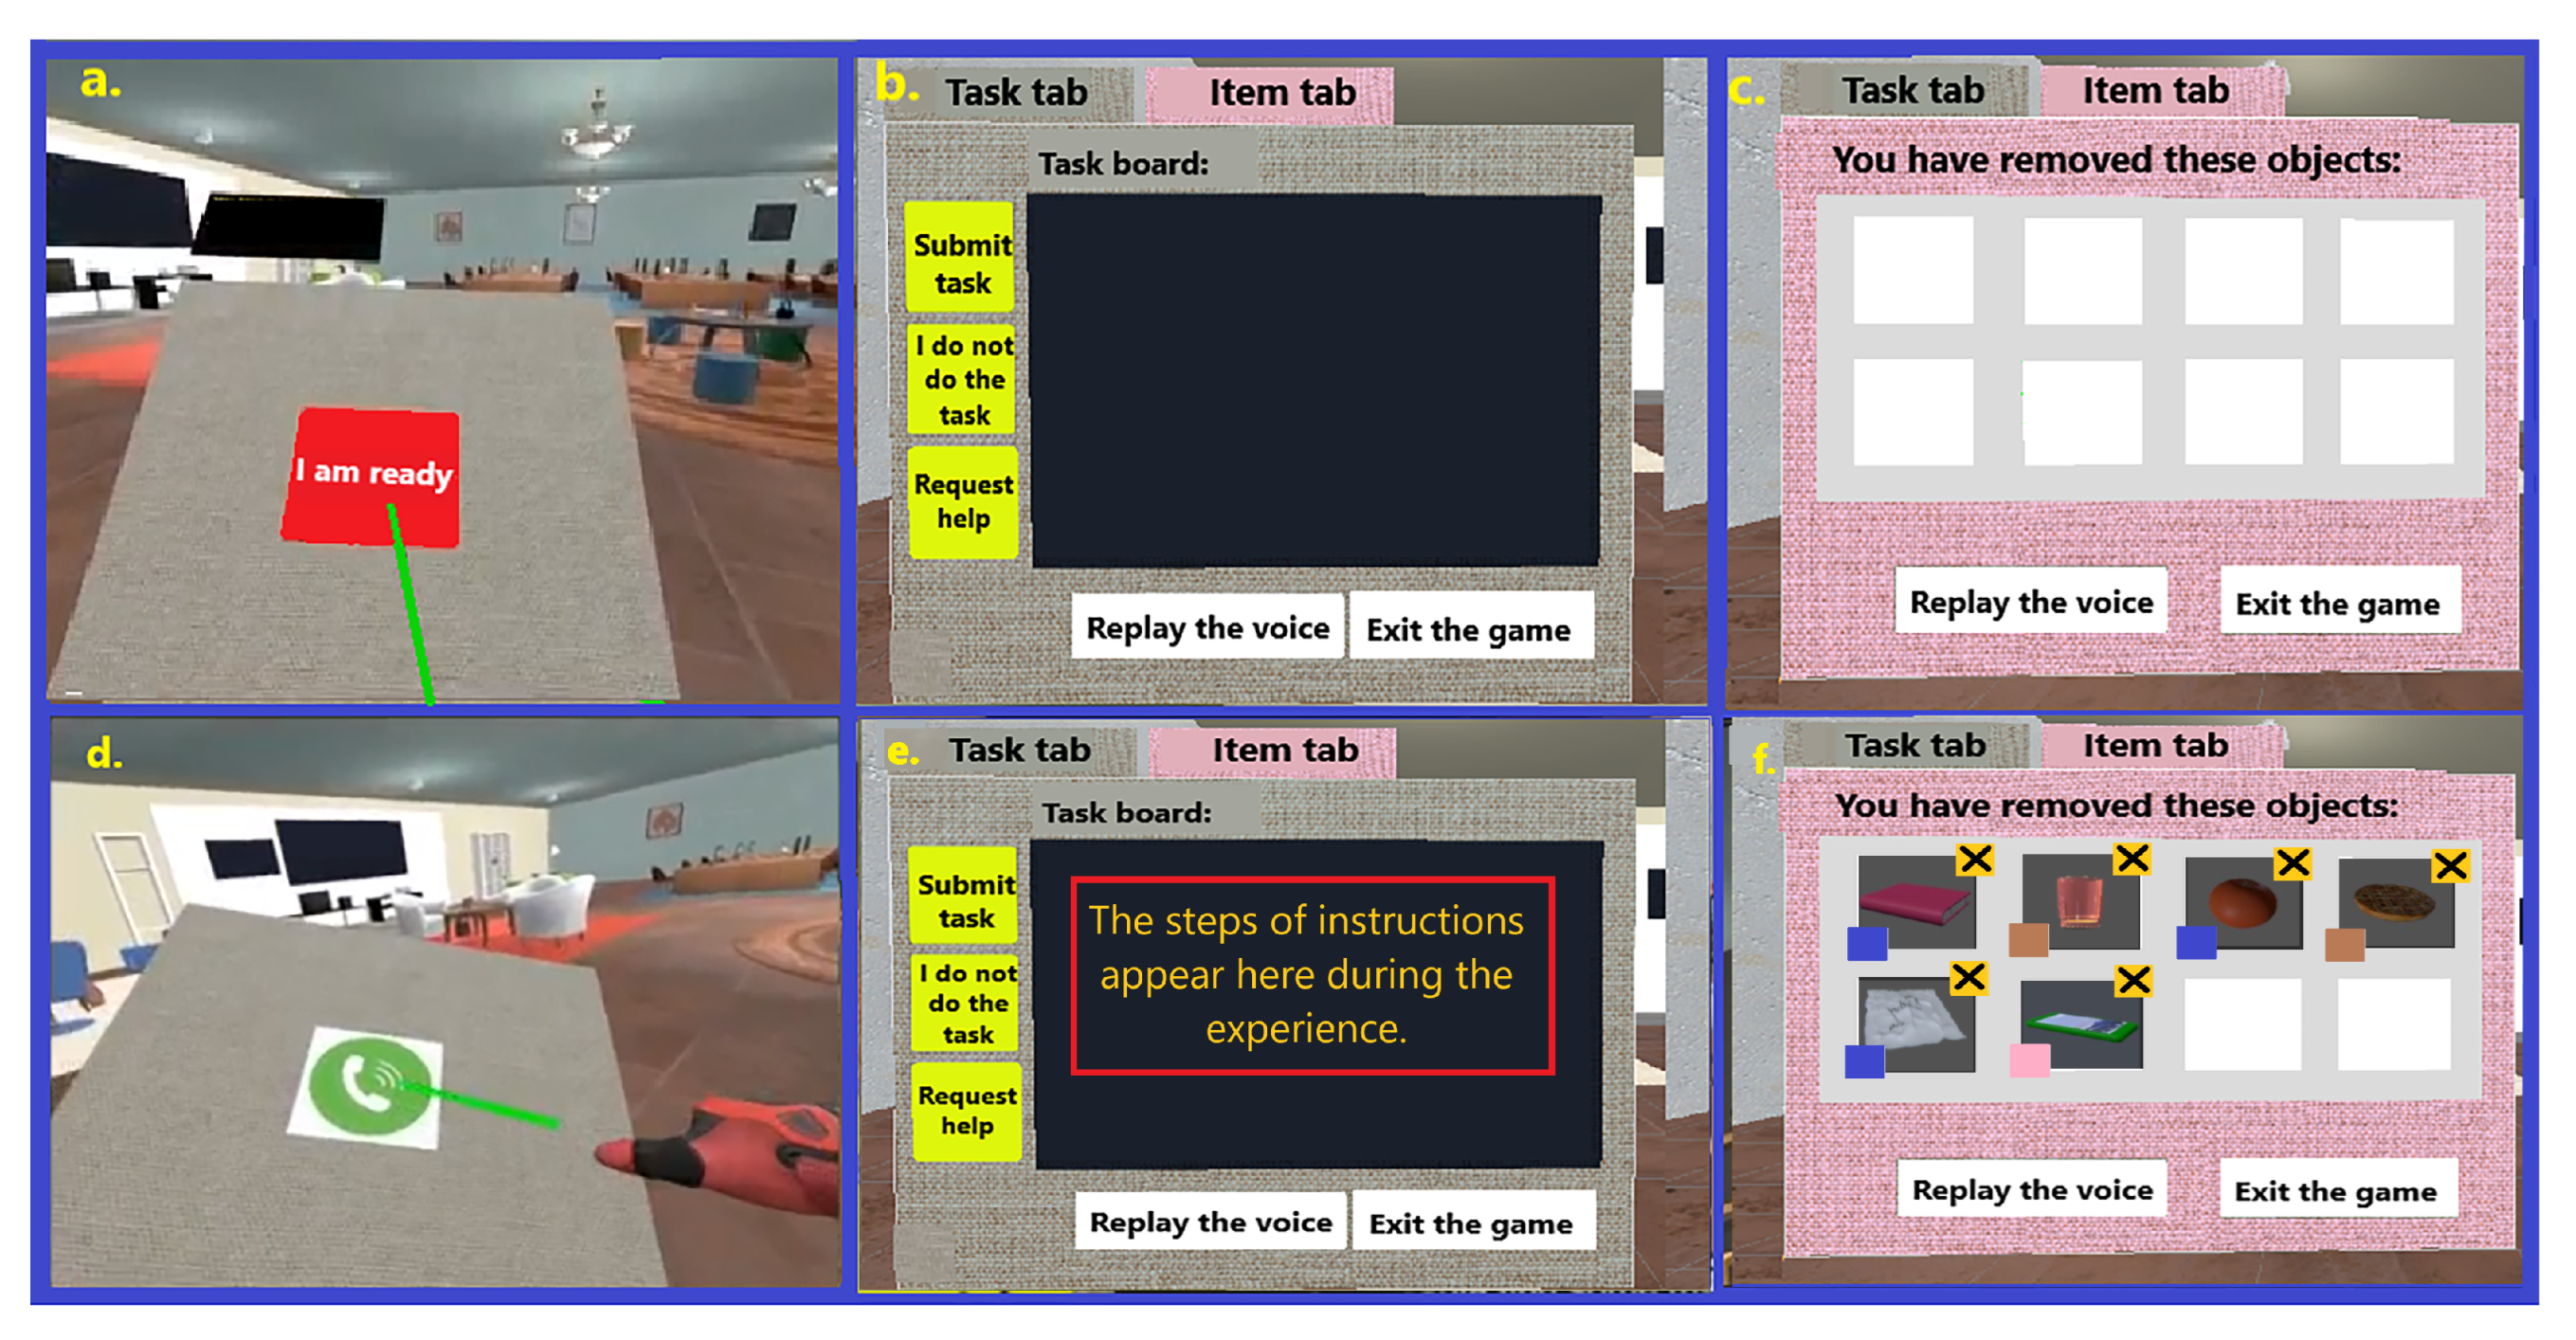
3.2.2. Experience Design
- An absence of guidance when a user is following and executing given instructions. This design limits the access to sources of information, asking the user to focus and rely on the already provided knowledge or information that may come after from sources such as panels and phone calls;
- Specific means of communicating instructions, which may be textual with the use of panels (and sometimes verbal, e.g., through phone calls) as a result of the absence of guidance;
- Specific instruction communication patterns in the form of sequences of sentences, such as what appears in step-by-step construction manuals. At the same time, it enables an experiment designer to purposely reduce the amount of available information and change the complexity of the sentences to control the amount of ambiguity and complexity in the system;
- The possibility of applying lexical ambiguity, as another potential source of confusion;
- A friendly environment supporting understanding and empathy in interpersonal communications.
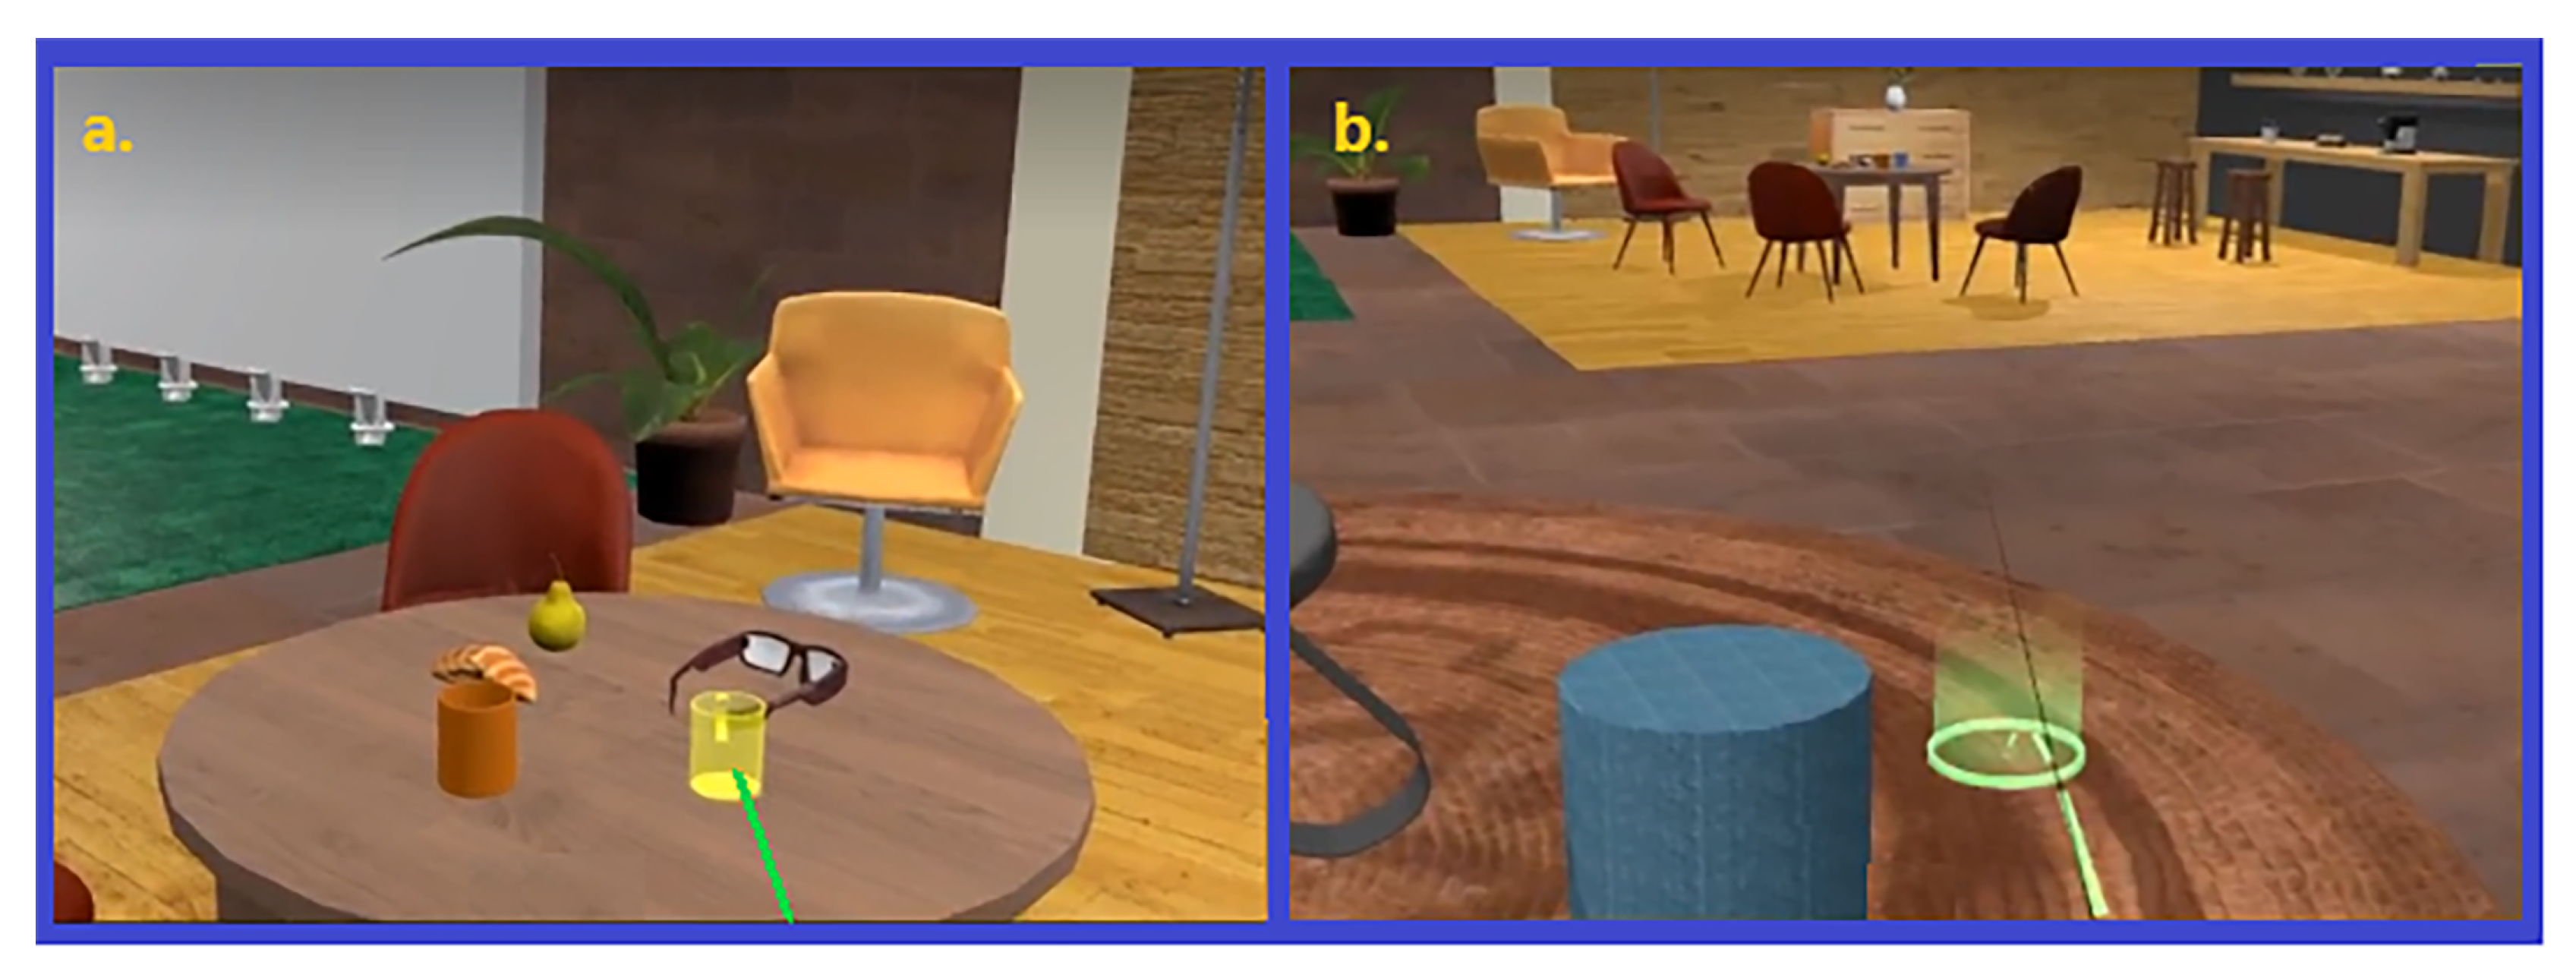
- Step 1: Go to the blue rug area. Remove the red glasses and green smartphone from the desk.
- Step 2: Go to the blue rug area. Remove the apple and orange from the tables.
- Step 3: Go to the brown rug area. Remove the blue cup from the table.
- Step 4: Go to the red rug area. Remove the green wallet and the sandwich from the table.
- Step 5: Go to the white rug area. Remove the pink book from the table.
- Step 1: Go to the brown rug area. Remove any food not positioned on a plate from the table.
- Step 2: Remove the glasses from the brown rug area.
- Step 3: If you find some mugs in the pink rug area, remove the orange one.
- Step 4: Go to the green rug area. Remove the pillows that are closest to the hat.
- Step 5: If you find calculators on the table and a bag under the table in the white rug area, remove the calculators.
- Step 1: Go to the brown rug area. Remove any food on plates on the table.
- Step 2: Remove the glasses (if you find them there) from the brown rug area.
- Step 3: If you find any books in the blue rug area, remove any pencils near them.
- Step 4: Go to the red rug area. If a bag lies under the table, do not remove the smartphone.
- Step 5: If you see any mugs on the table in the yellow rug area, remove them.
3.3. Methods
3.3.1. Procedure
3.3.2. Measures
- Objective measures
- Variables related to the time:
- −
- Time to submit Task 1;
- −
- Time to submit Task 2;
- −
- Response time to new messages in Task 1;
- −
- Response time to new messages in Task 2.
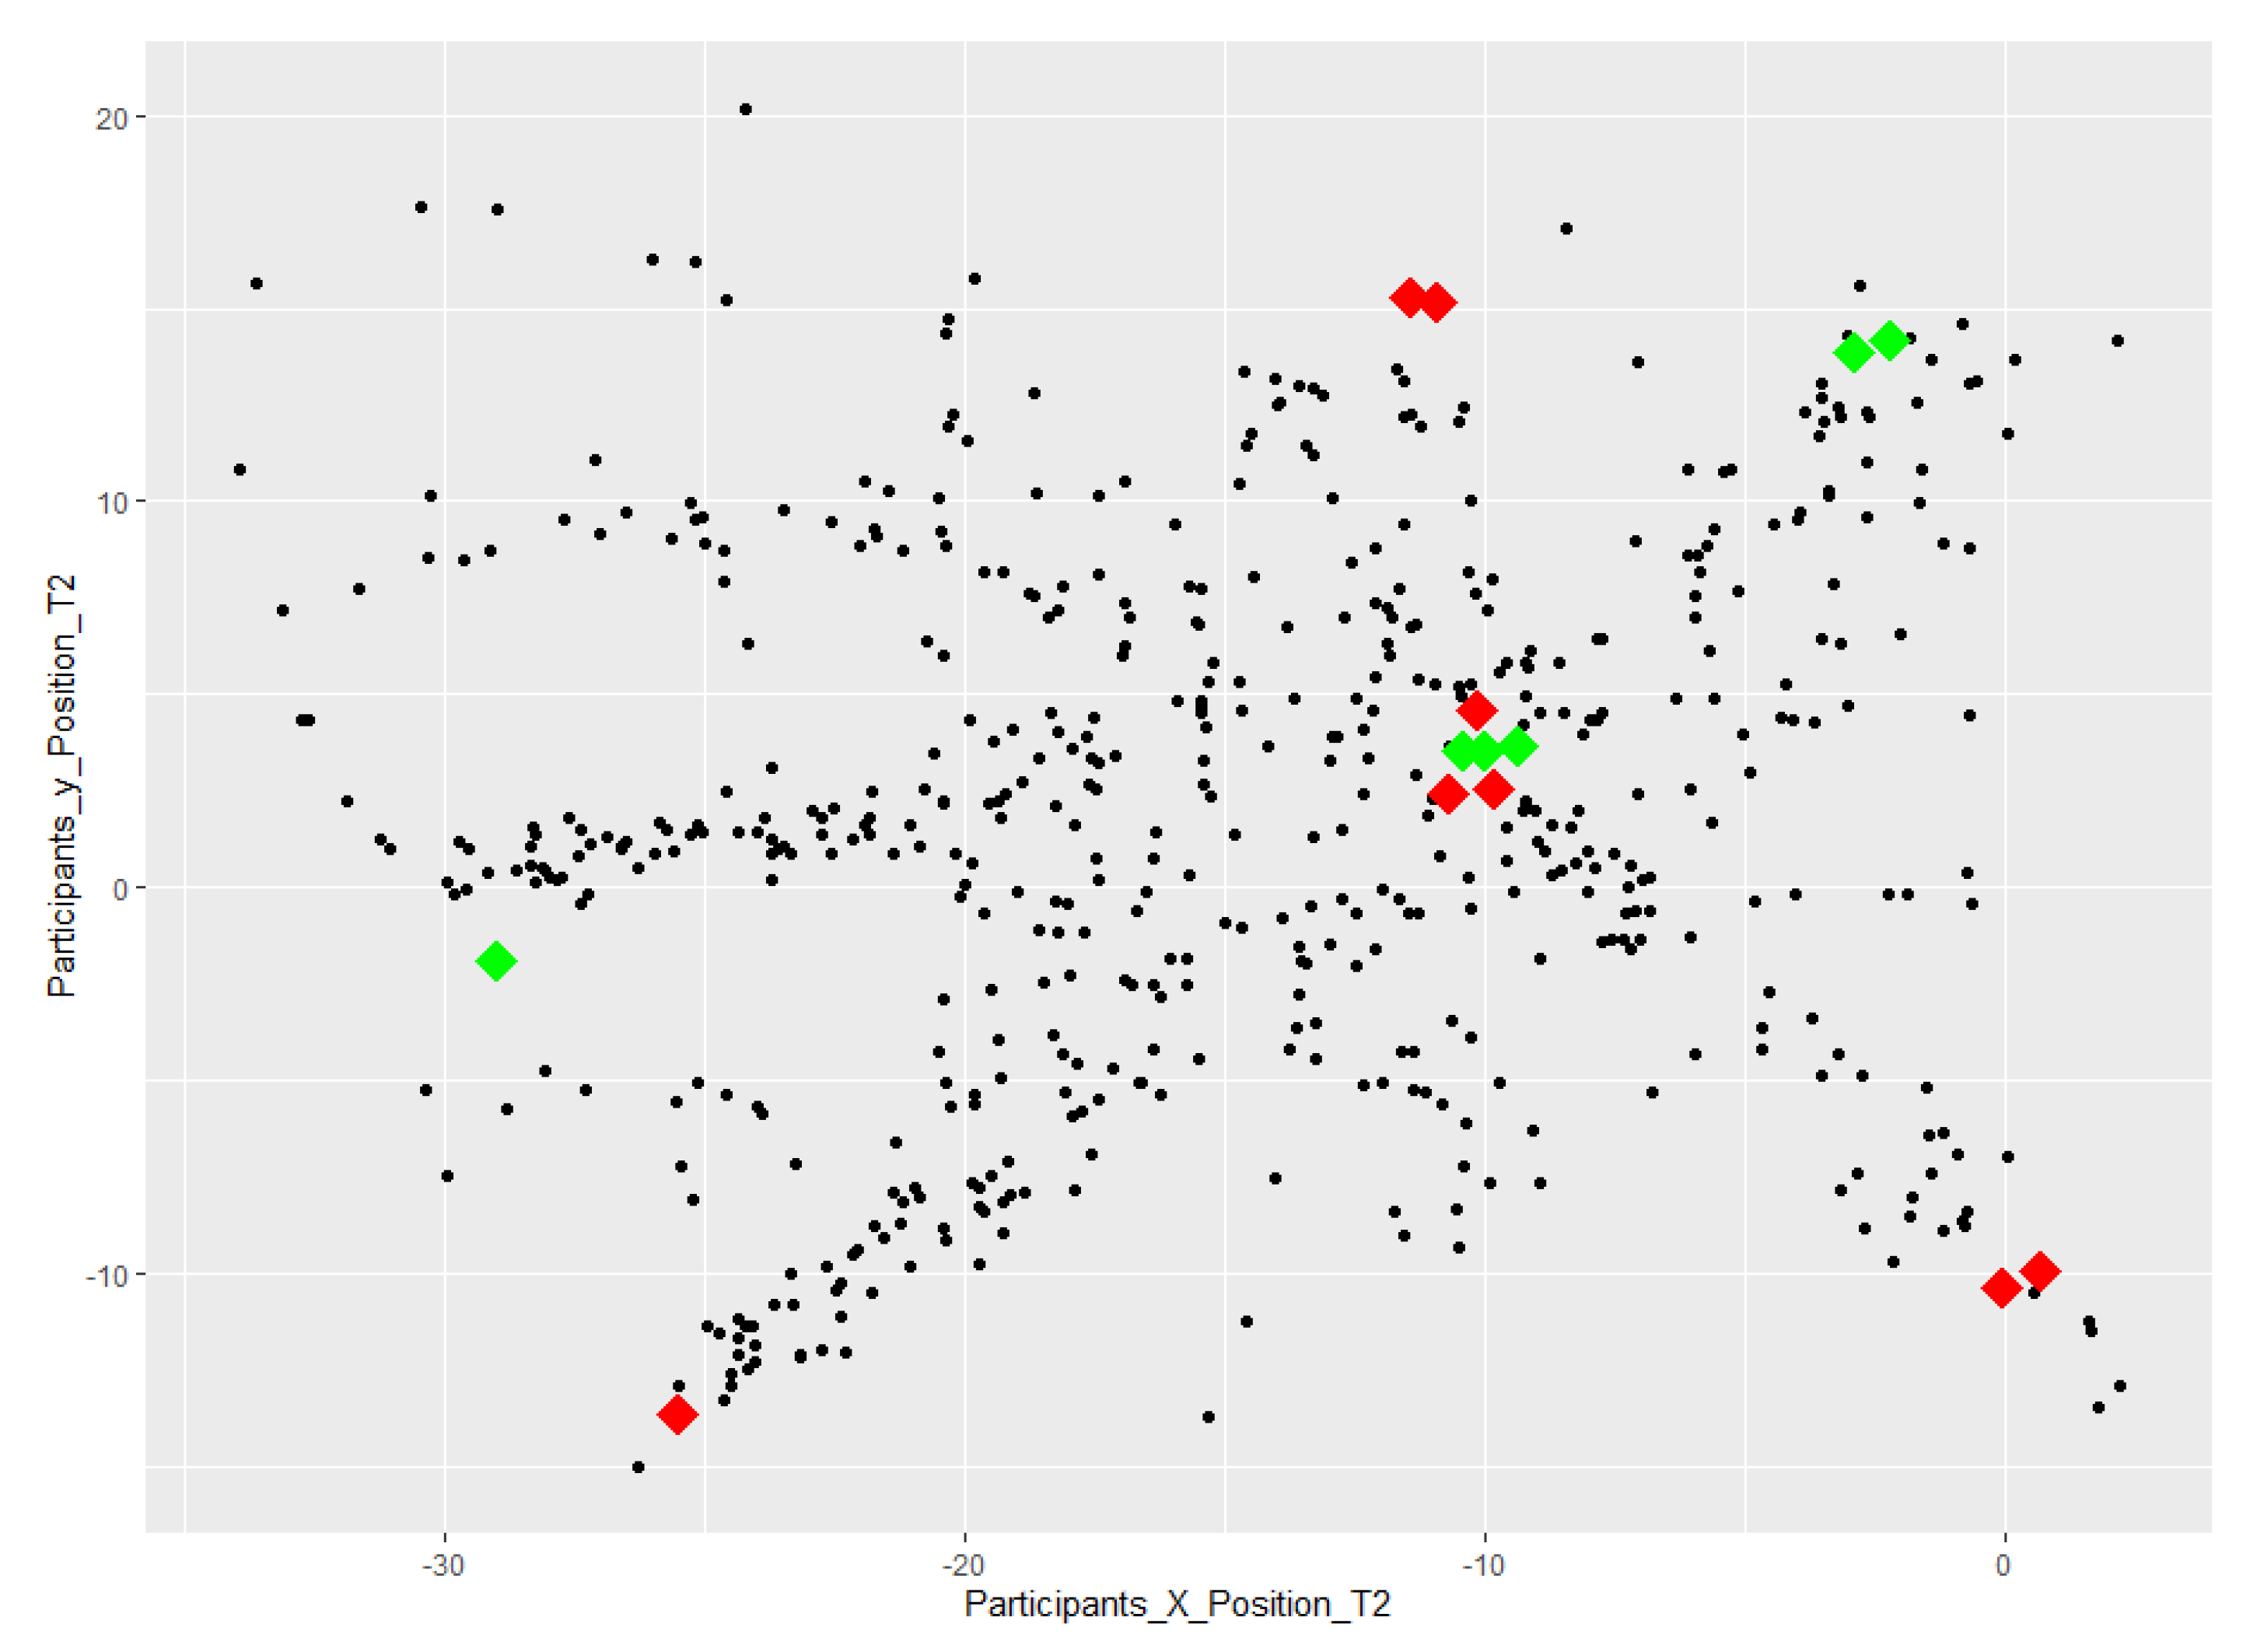
- Variables related to the position: Position of the user in each moment.
- Subjective measures
- The Demographic questionnaire: This questionnaire asked participants about their nationality, sex, age, and education level.
- Level of English proficiency questionnaire: A five-point Likert scale was used to rate the level of English proficiency of participants (See Table 4).
- Previous Experience with immersive VR: A five-point Likert scale was used to rate the previous experience with immersive VR of participants (See Table 4).
- Perceived uncertainty questionnaire: In this questionnaire, using a five-point Likert scale, participants were asked to rate their level of perceived uncertainty for each task after the experiment (See Table 4).
- System Usability Scale (SUS) questionnaire: This questionnaire [64] consists of 10 items and utilizes a scale of 1 (Strongly disagree) to 5 (Strongly agree) to provide a “quick and dirty” reliable tool for measuring usability.
- Slater–Usoh–Steed presence questionnaire (SUS): This questionnaire [65] consists of five items and utilizes a scale of one to seven to assess participants’ sense of being there in a virtual office.
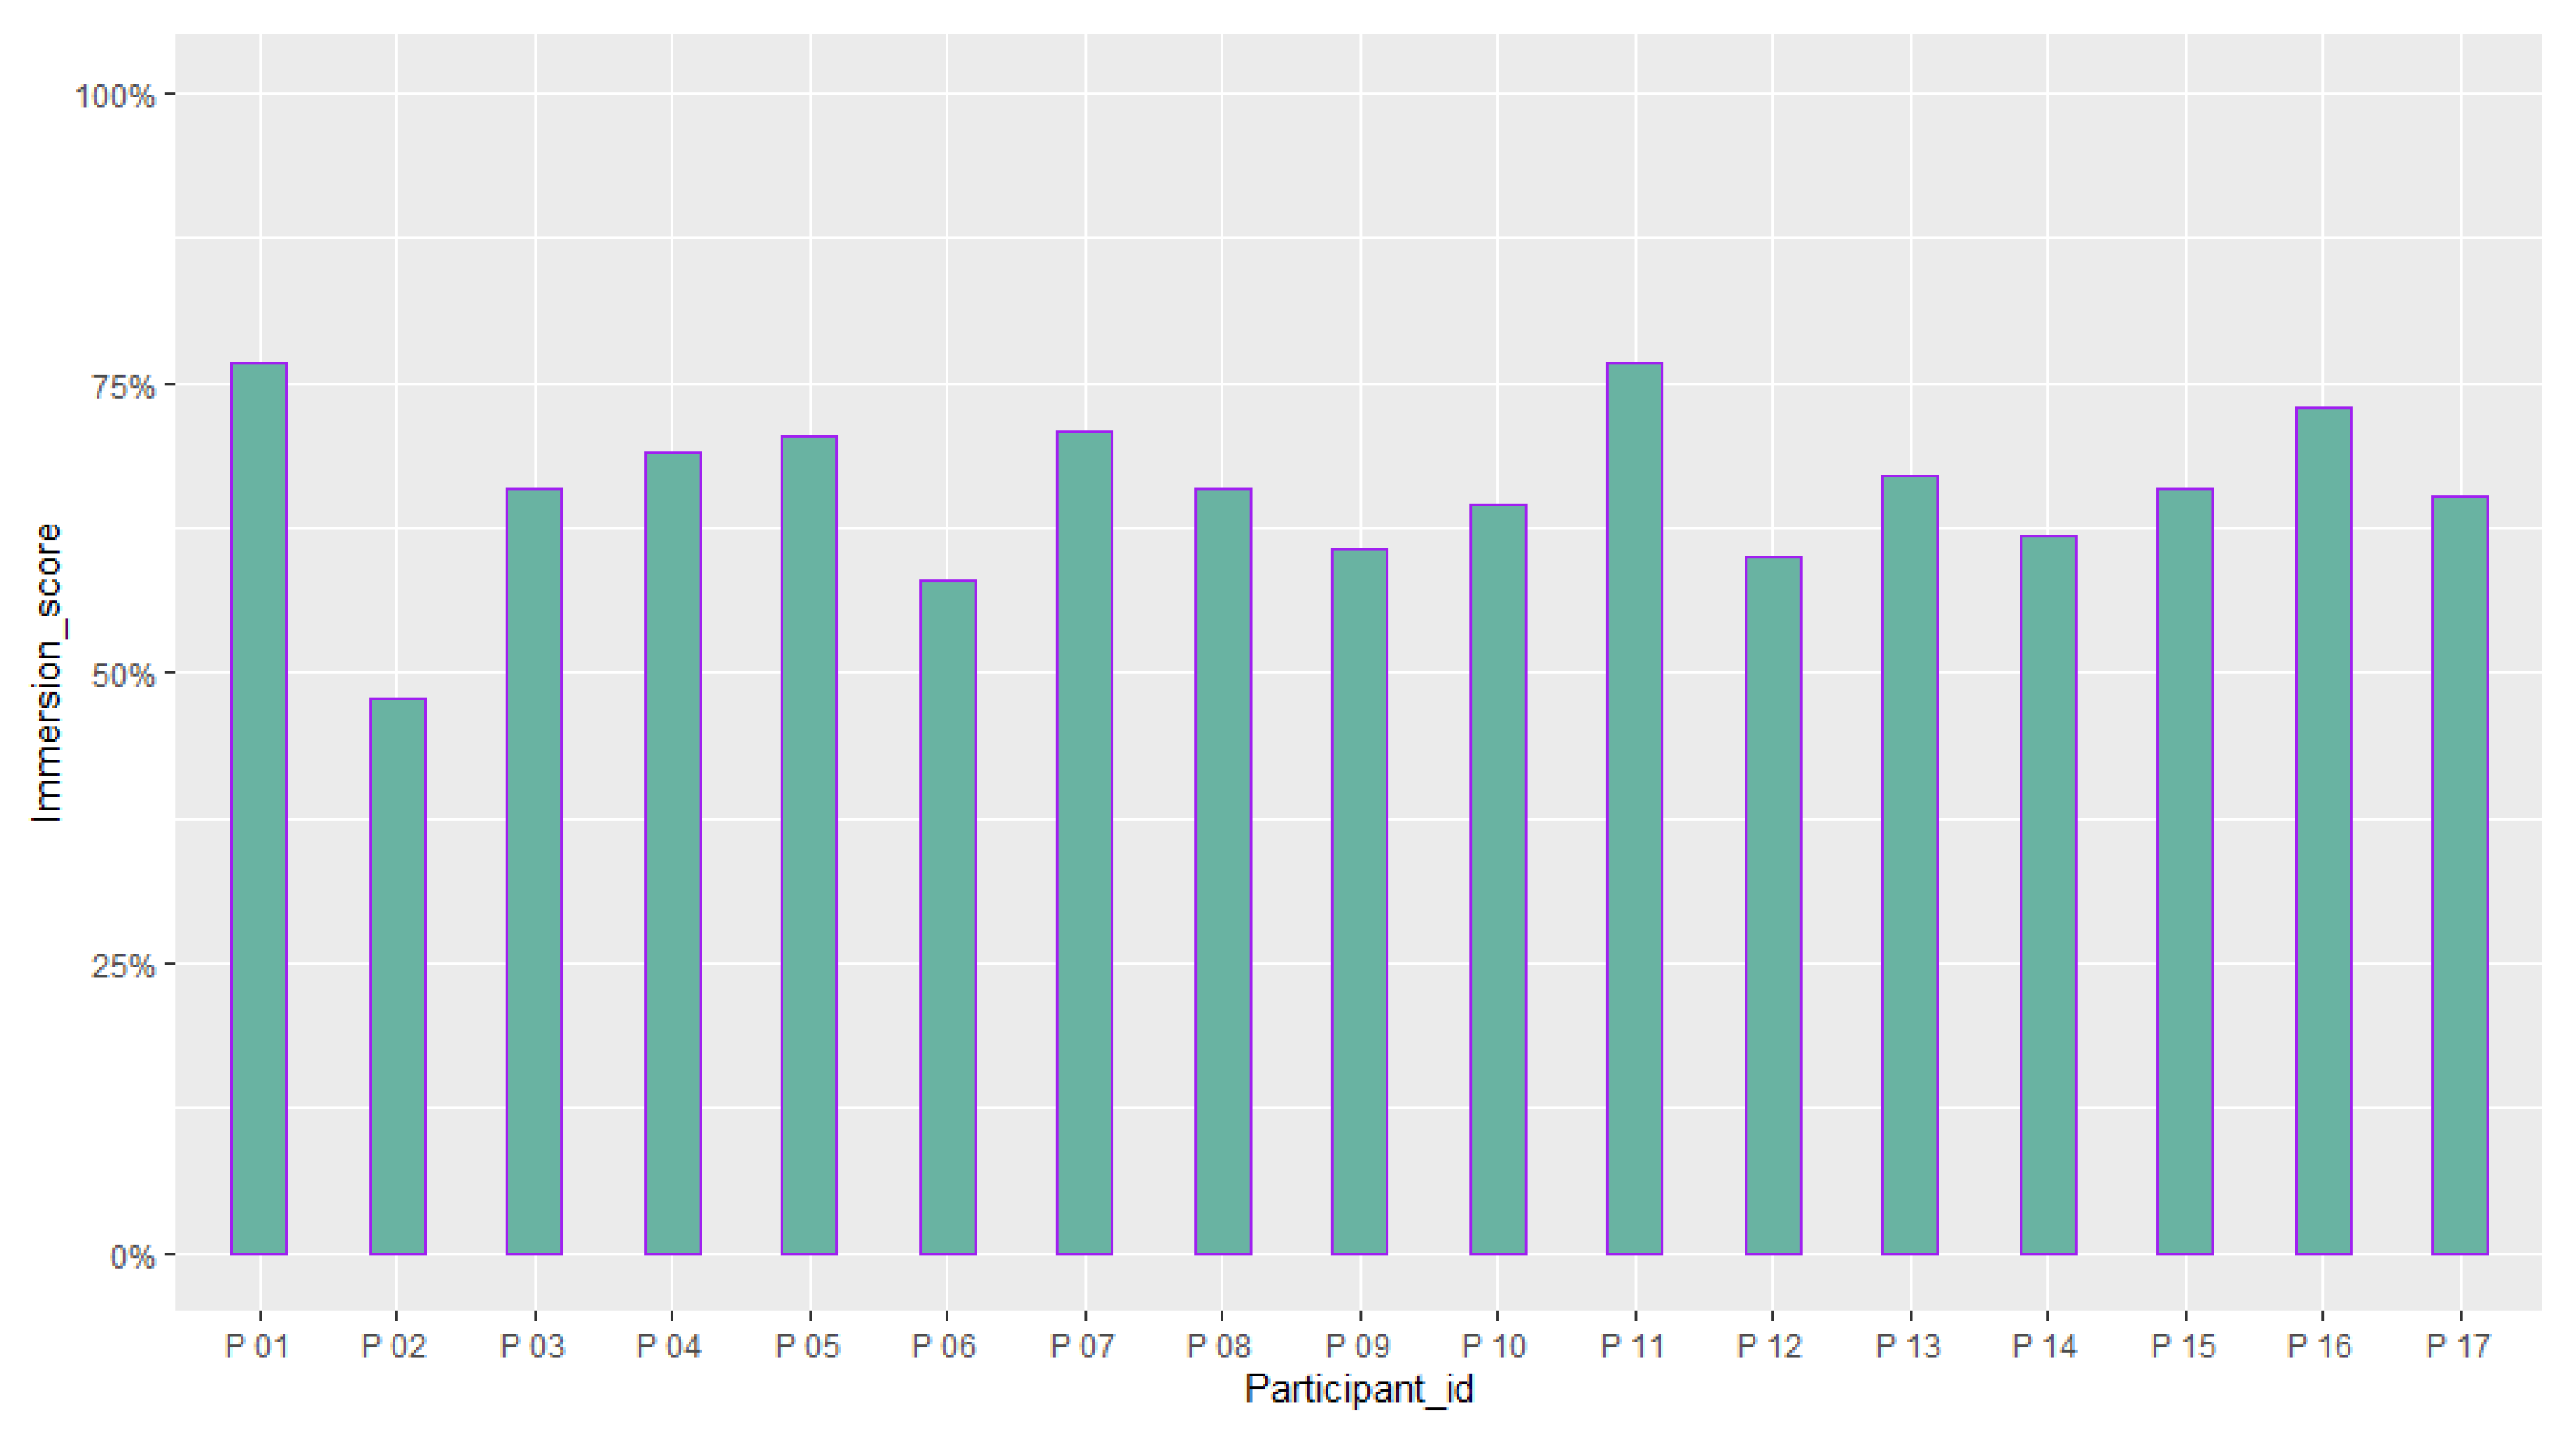
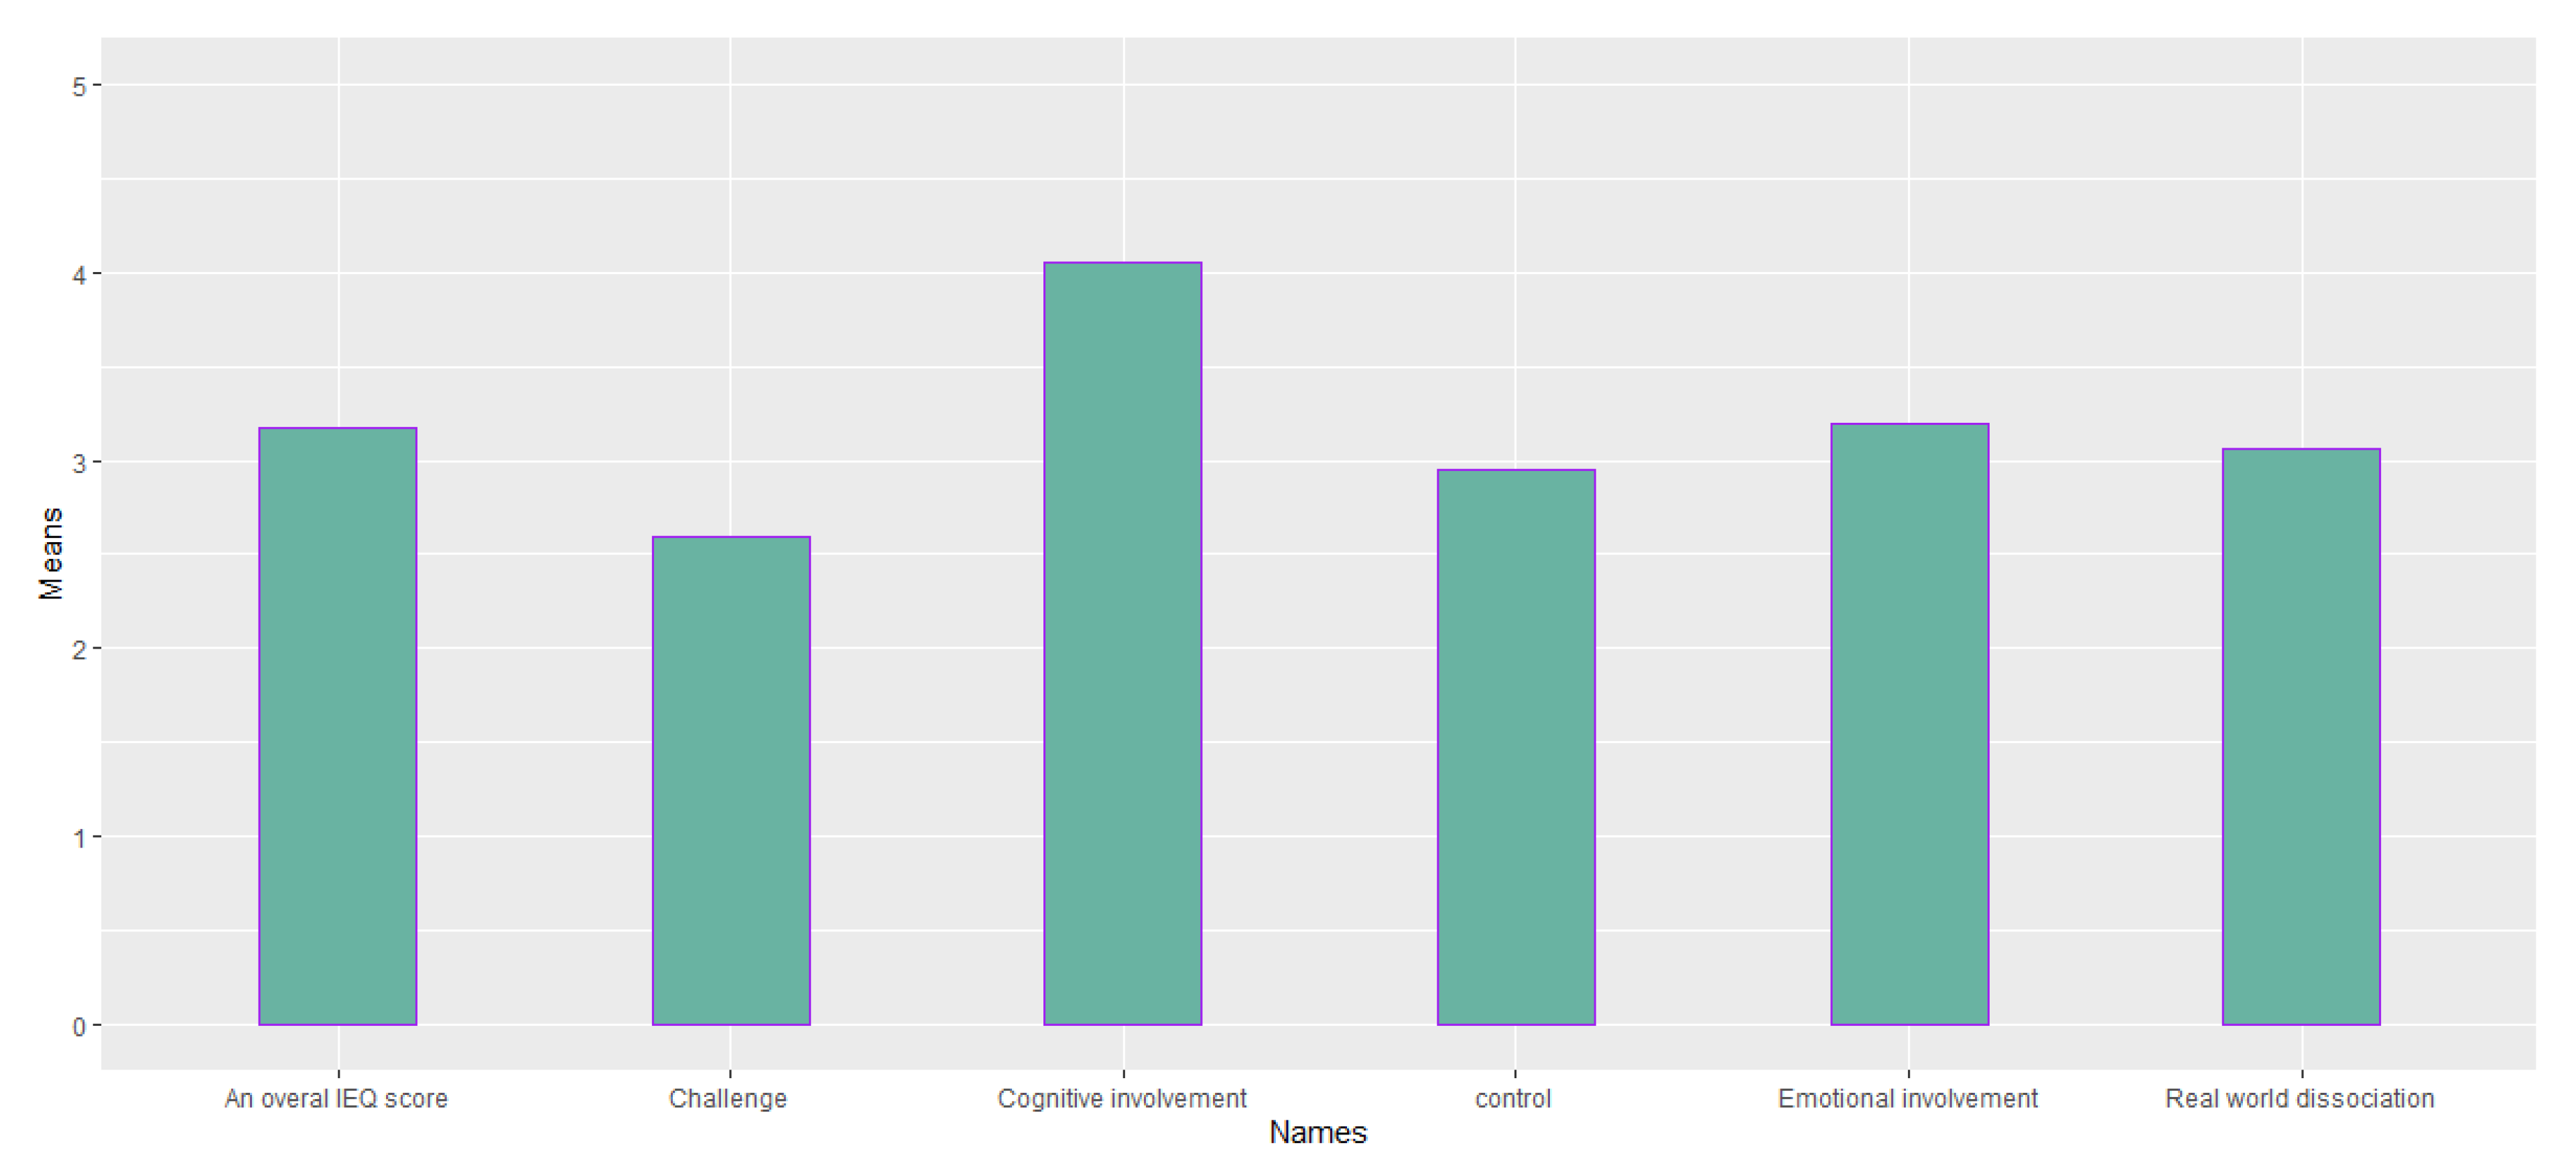
- The immersive experience questionnaire (IEQ): This questionnaire [66] comprises 31 items and utilizes a scale of 1 (Not at all) to 7 (A lot) to measure the subjective experience of being immersed while playing a virtual serious game.
- Motion sickness questionnaire (MSAQ): This questionnaire [67] comprises 16 items, utilizes a scale of 1 to 9, and is a valid instrument for the assessment of motion sickness.
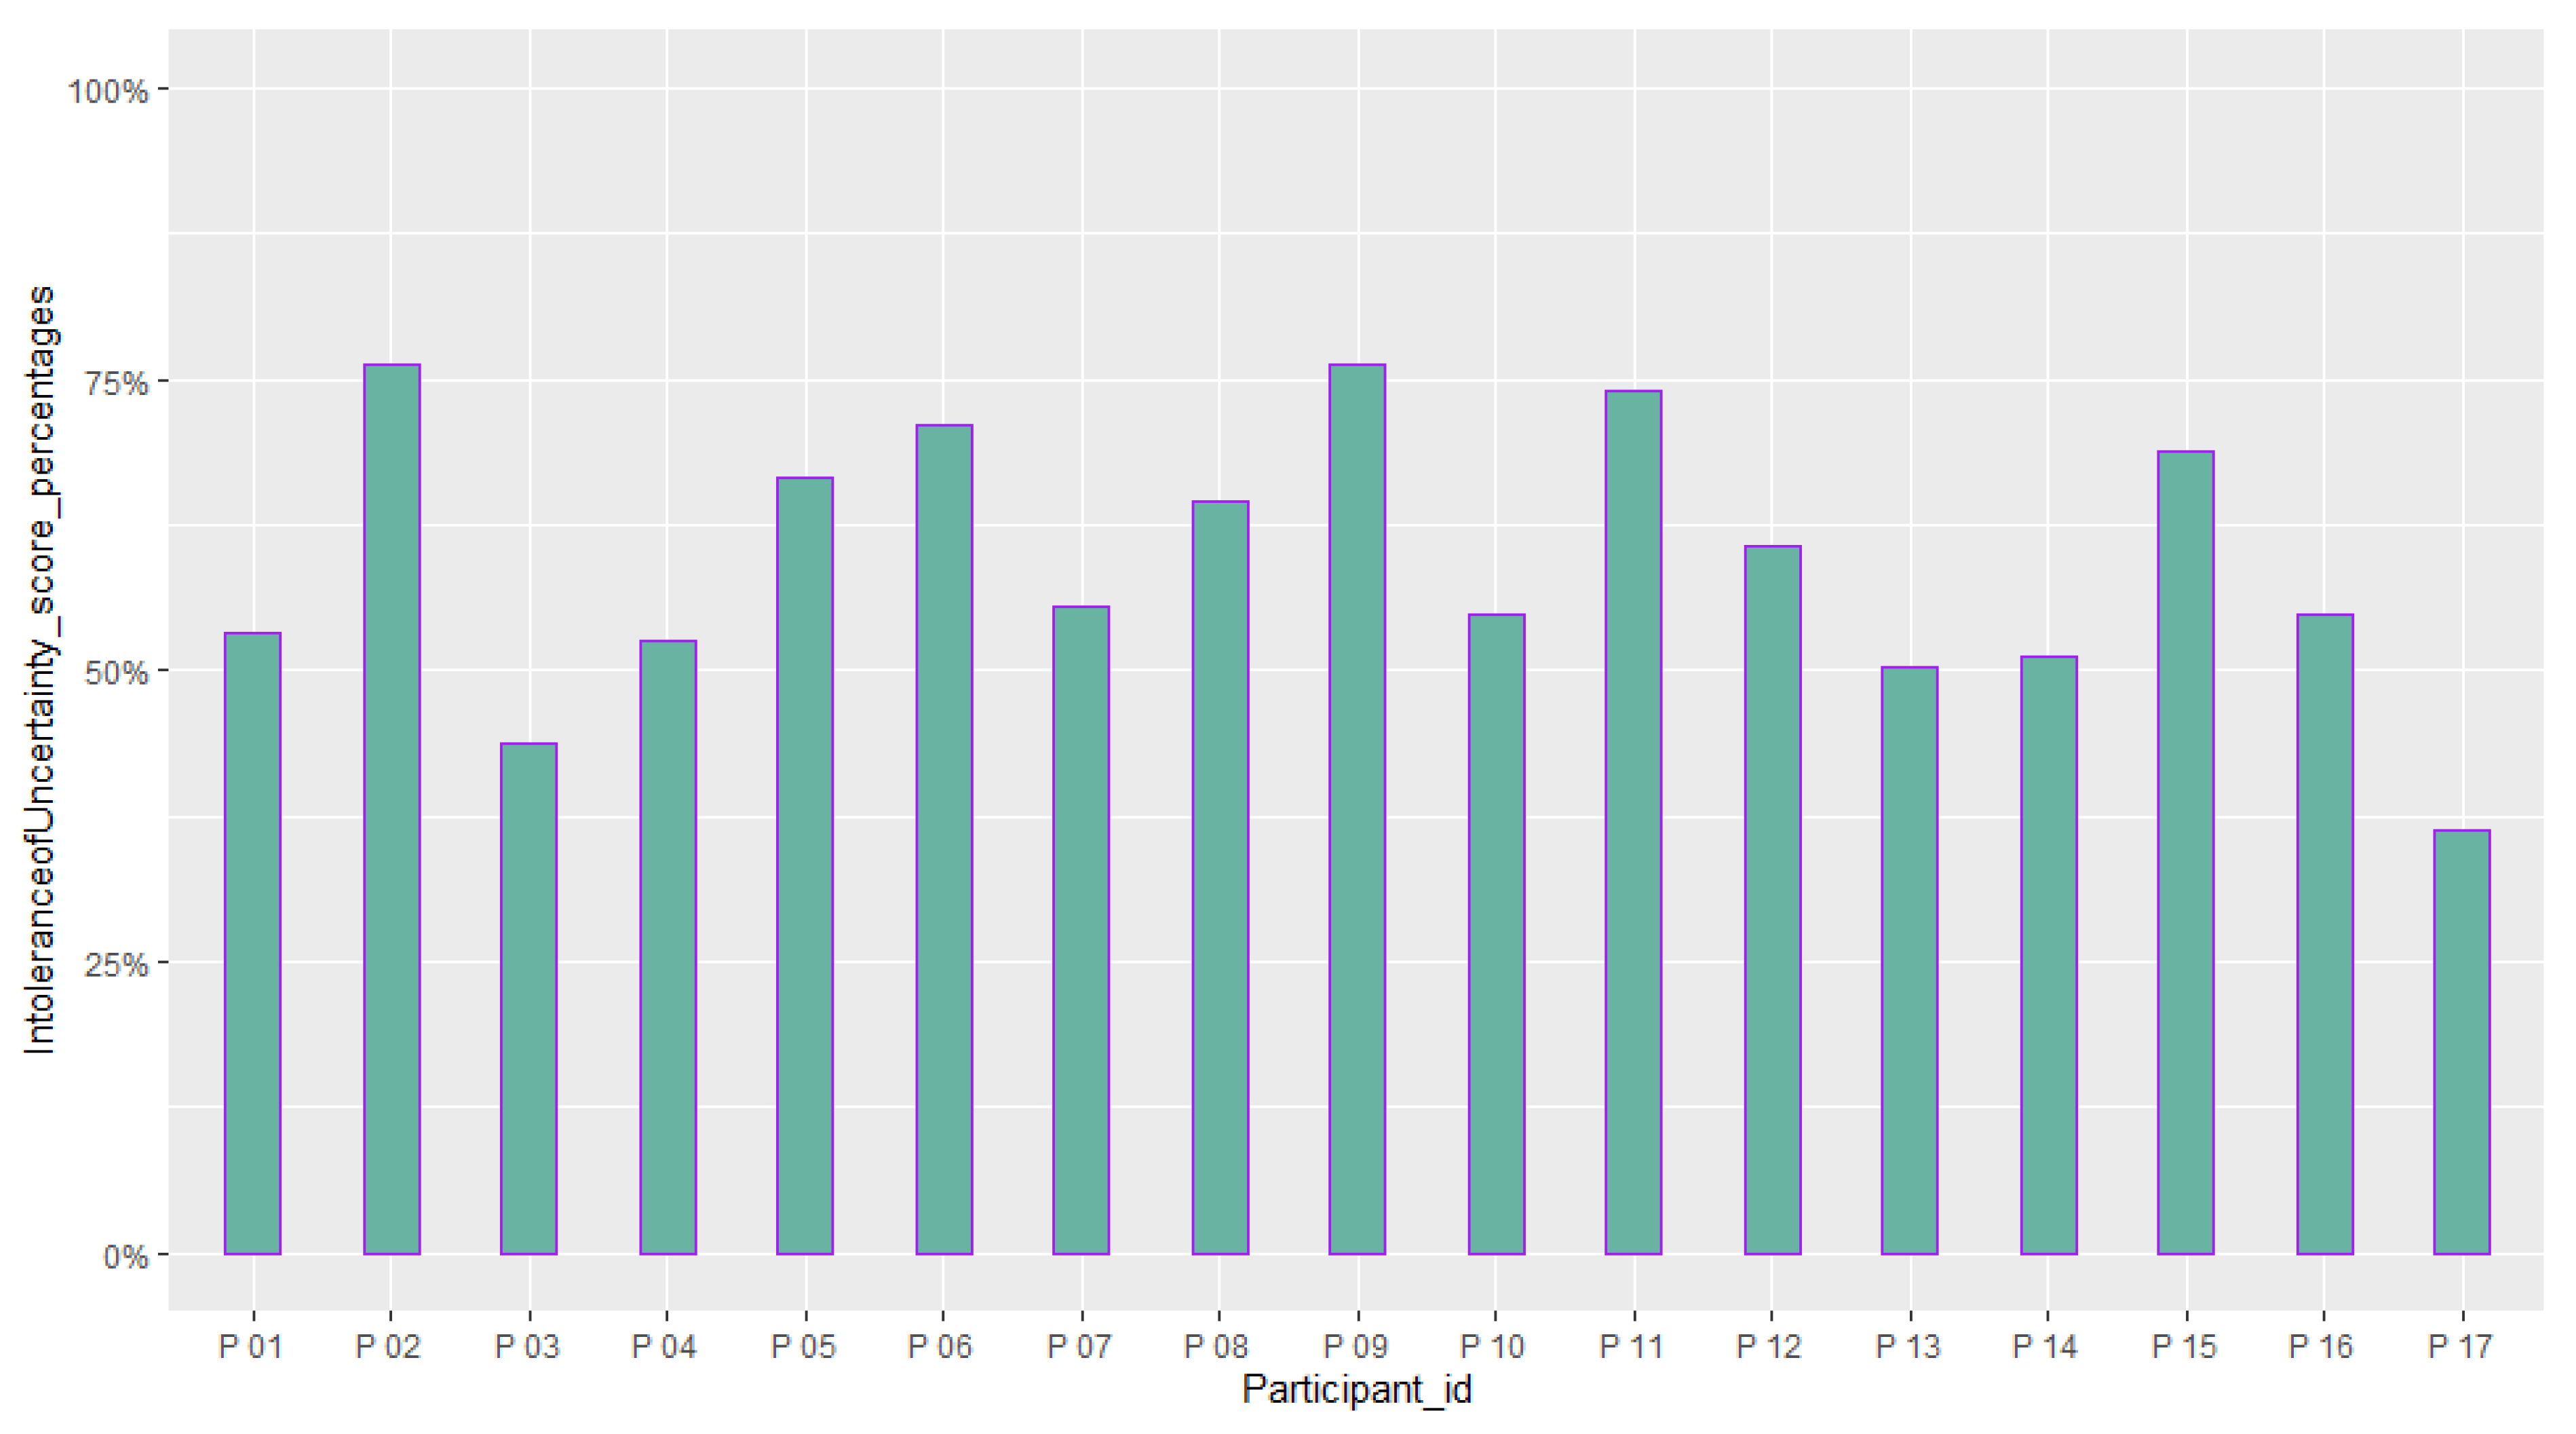
- Intolerance of Uncertainty Scale (IUS): This questionnaire [68] consists of 27 items and utilizes a scale of 1 (Not at all characteristic of me) to 5 (Entirely characteristic of me) that assesses emotional, cognitive, and behavioral reactions to ambiguous situations, implications of being uncertain, and attempts to control the future.
4. Results
5. Discussion
- RQ2-1: Does the response time of the user to reach the source of information (the phone call) differ in the two tasks?
- RQ2-2: Does the task completion time for the user for each task differ?
- RQ2-3: How does the change of participants’ position in Task 1 differ from Task 2?
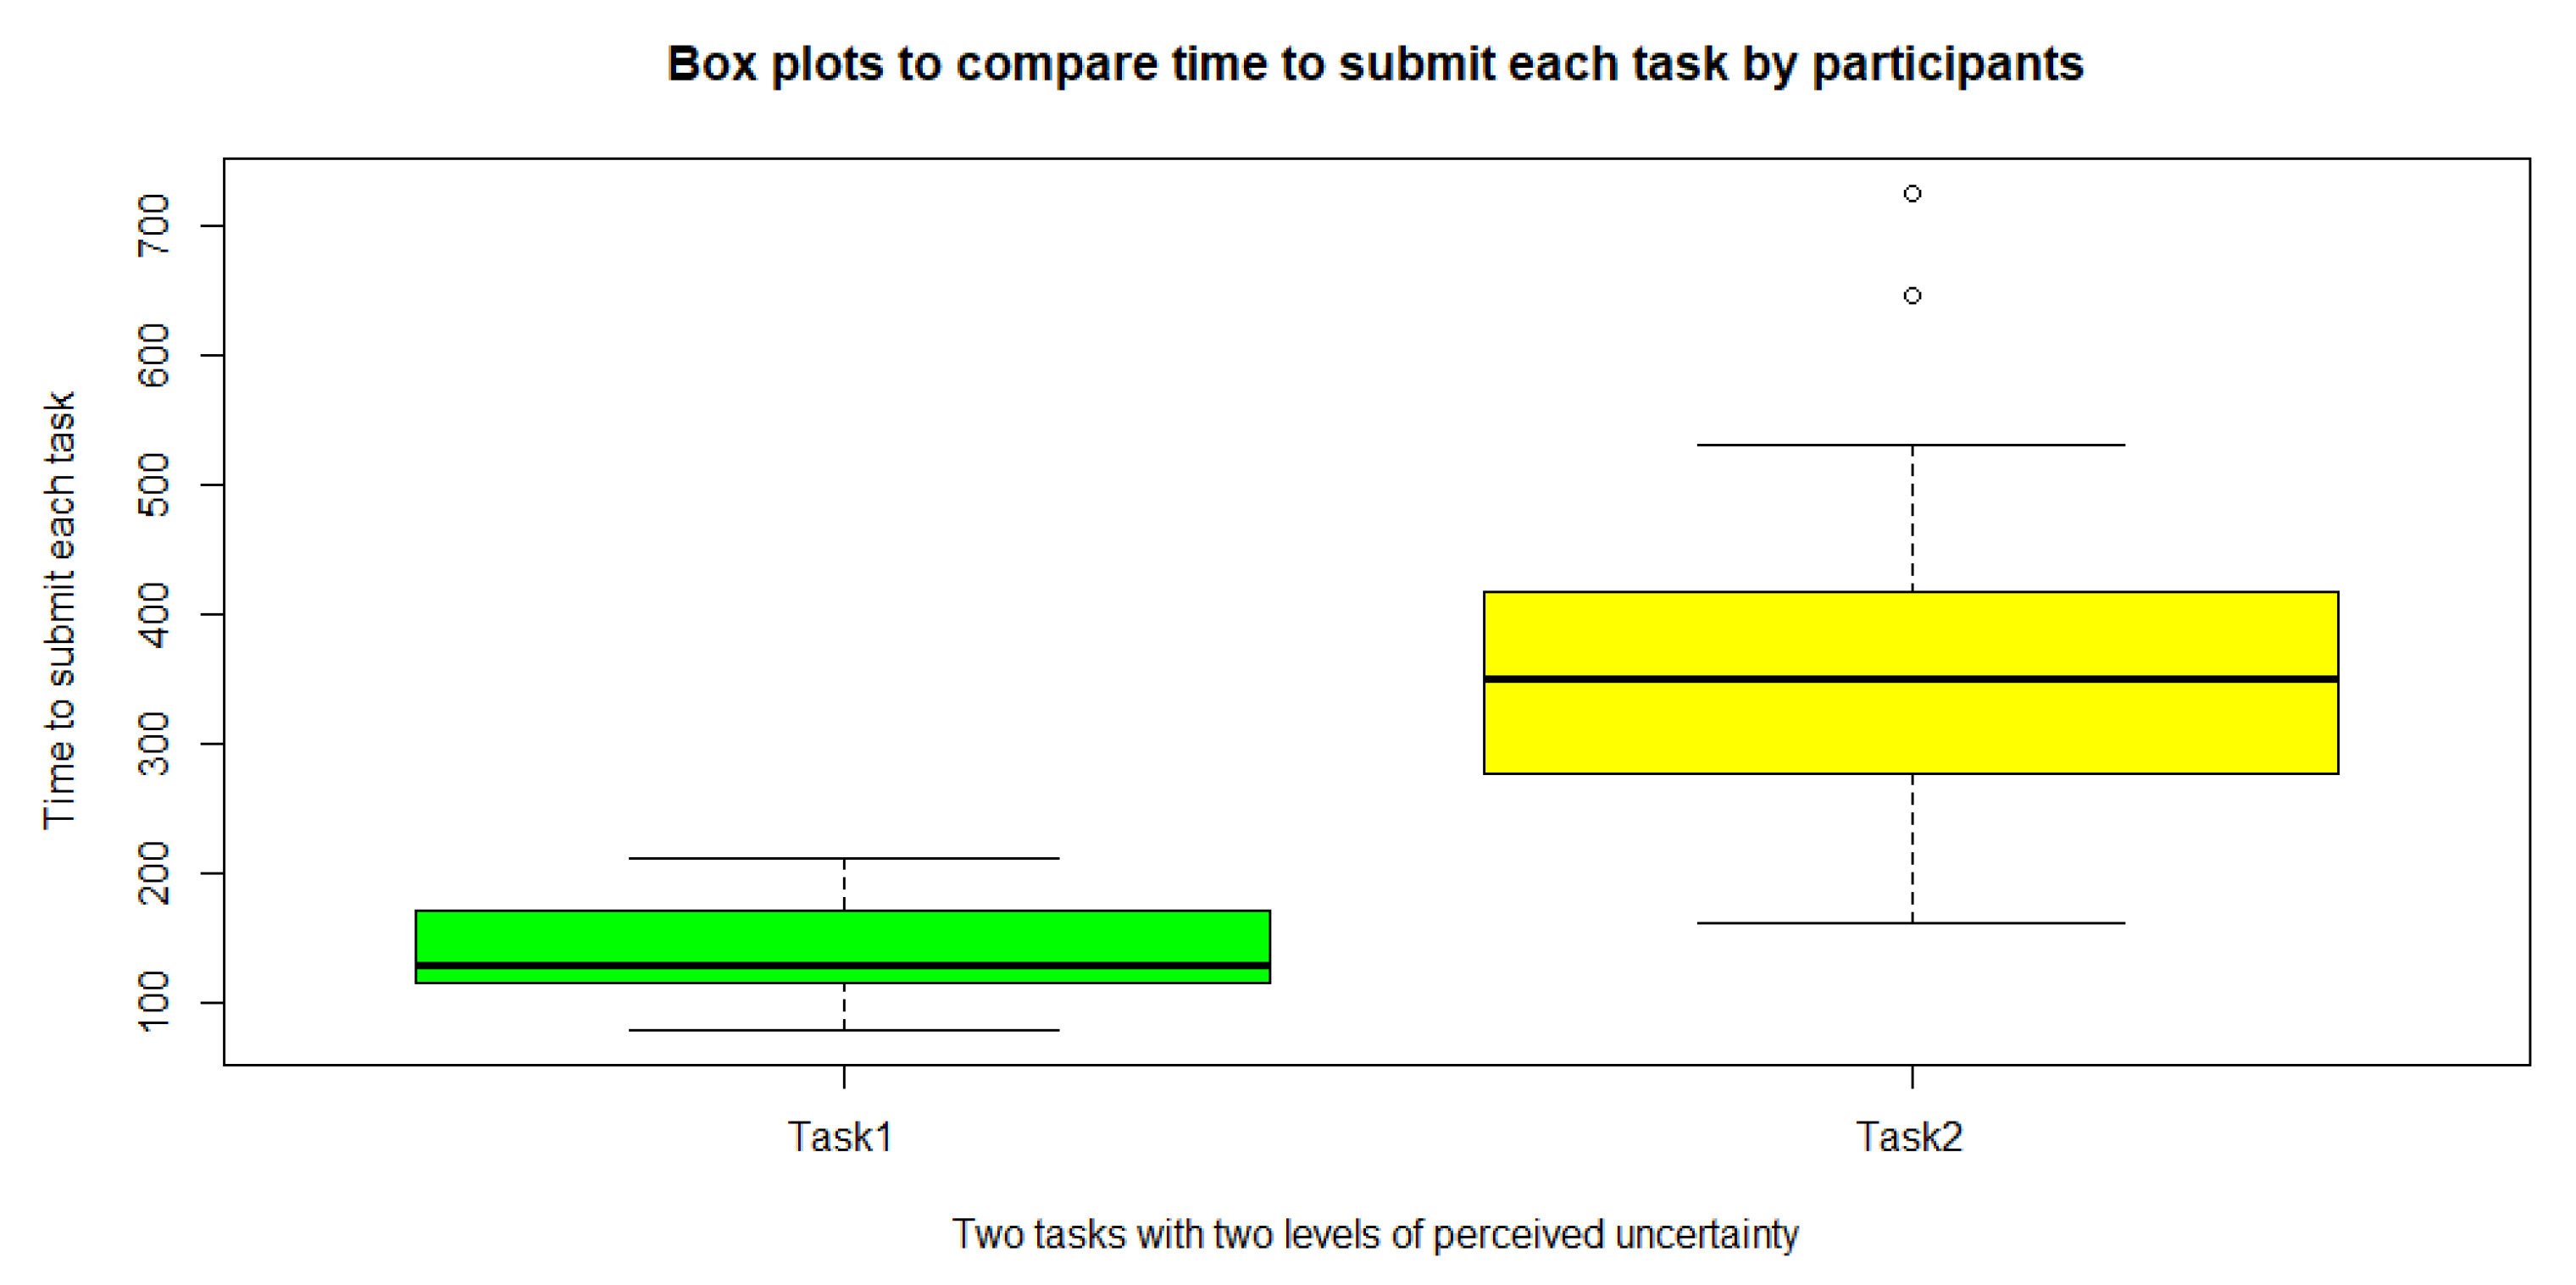
- Response time: In particular, we were interested in the participant’s response time to new information coming from a highly influential source that was directly associated with the boss, a phone call. Our expectation was that by increasing the degree of induced uncertainty, the participant would show a different response time, but we did not find a significant difference in this comparison with the applied statistical test.
- Task completion time: In particular, we were interested in the time that the participants persist in accomplishing each task as an objective measure of the user’s tolerance to the change of uncertainty in the system. For this reason, we did not consider the correctness or wrongness of following the instructions, and the user was free to end tasks at any moment without experiencing any time pressure or encouraging or discouraging feedback. Related to this setting, by increasing the level of uncertainty of the task, our expectation was that the participant spends a different amount of time accomplishing the task. The results of the study were aligned with this expectation by reporting a significantly higher completion time for Task 2.
6. Conclusions and Future Works
Author Contributions
Funding
Institutional Review Board Statement
Informed Consent Statement
Data Availability Statement
Conflicts of Interest
References
- Costikyan, G. Uncertainty in Games; Mit Press: Cambridge, MA, USA, 2013. [Google Scholar]
- Peters, A.; McEwen, B.S.; Friston, K. Uncertainty AND stress: Why it causes diseases and how it is mastered by the brain. Prog. Neurobiol. 2017, 156, 164–188. [Google Scholar] [CrossRef]
- Mobbs, D.; Hagan, C.C.; Dalgleish, T.; Silston, B.; Prévost, C. The ecology of human fear: Survival optimization and the nervous system. Front. Neurosci. 2015, 9, 55. [Google Scholar] [CrossRef]
- Kessler, O.; Daase, C. From insecurity to uncertainty: Risk and the paradox of security politics. Alternatives 2008, 33, 211–232. [Google Scholar] [CrossRef]
- Bensi, L.; Giusberti, F. Trait anxiety and reasoning under uncertainty. Personal. Individ. Differ. 2007, 43, 827–838. [Google Scholar] [CrossRef]
- Konstantellou, A.; Sternheim, L.; Hale, L.; Simic, M.; Eisler, I. The experience of intolerance of uncertainty for parents of young people with a restrictive eating disorder. Eat. Weight Disord.-Stud. Anorex. Bulim. Obes. 2022, 27, 1339–1348. [Google Scholar] [CrossRef]
- Grupe, D.W.; Nitschke, J.B. Uncertainty and anticipation in anxiety: An integrated neurobiological and psychological perspective. Nat. Rev. Neurosci. 2013, 14, 488–501. [Google Scholar] [CrossRef] [PubMed]
- Mason, J.W. A review of psychoendocrine research on the pituitary-adrenal cortical system. Psychosom. Med. 1968, 30, 576–607. [Google Scholar] [CrossRef]
- Stirling, A. Keep it complex. Nature 2010, 468, 1029–1031. [Google Scholar] [CrossRef] [PubMed]
- Stirling, A. Science, precaution, and the politics of technological risk: Converging implications in evolutionary and social scientific perspectives. Ann. N. Y. Acad. Sci. 2008, 1128, 95–110. [Google Scholar] [CrossRef]
- Lee, H.S.; Anderson, J.R. Student learning: What has instruction got to do with it? Annu. Rev. Psychol. 2013, 64, 445–469. [Google Scholar] [CrossRef] [PubMed]
- Bacon, A.M.; Krupić, D.; Caki, N.; Corr, P.J. Emotional and Behavioral Responses to COVID-19. Eur. Psychol. 2022, 26, 334–347. [Google Scholar] [CrossRef]
- Duch, B.J.; Groh, S.E.; Allen, D.E. The Power of Problem-Based Learning: A Practical “How to” for Teaching Undergraduate Courses in Any Discipline; Stylus Publishing, LLC.: Sterling, VA, USA, 2001. [Google Scholar]
- Pigott, J. Less is more: Education for uncertain times. Glob. Soc. Educ. 2022, 20, 251–261. [Google Scholar] [CrossRef]
- Beghetto, R.A. What If?: Building Students’ Problem-Solving Skills Through Complex Challenges; ASCD: Alexandria, VA, USA, 2018. [Google Scholar]
- Beghetto, R.A. Structured uncertainty: How creativity thrives under constraints and uncertainty. In Creativity under Duress in Education? Springer: Berlin/Heidelberg, Germany, 2019; pp. 27–40. [Google Scholar]
- Piccolo, M.; Milos, G.F.; Bluemel, S.; Schumacher, S.; Mueller-Pfeiffer, C.; Fried, M.; Ernst, M.; Martin-Soelch, C. Behavioral responses to uncertainty in weight-restored anorexia nervosa–preliminary results. Front. Psychol. 2019, 10, 2492. [Google Scholar] [CrossRef] [PubMed]
- Tanovic, E. Individual Differences in Cognitive, Affective, and Behavioral Responses to Uncertainty. Ph.D. Thesis, Yale University, New Haven, CT, USA, 2020. [Google Scholar]
- Klir, G.J. Uncertainty and Information: Foundations of Generalized Information Theory; Wiley: New York, NY, USA, 2006. [Google Scholar]
- Berger, C.R.; Calabrese, R.J. Some explorations in initial interaction and beyond: Toward a developmental theory of interpersonal communication. Hum. Commun. Res. 1974, 1, 99–112. [Google Scholar] [CrossRef]
- Berger, C.R. Interpersonal communication. In The International Encyclopedia of Communication; Routledge: Abingdon, UK, 2008. [Google Scholar]
- Koerner, N.; Dugas, M.J. A cognitive model of generalized anxiety disorder: The role of intolerance of uncertainty. In Worry and Its Psychological Disorders: Theory, Assessment and Treatment; John Wiley & Sons: Hoboken, NJ, USA, 2006; pp. 201–216. [Google Scholar]
- Kornilova, T.V.; Chumakova, M.A.; Kornilov, S.A. Tolerance and intolerance for uncertainty as predictors of decision making and risk acceptance in gaming strategies of the Iowa gambling task. Psychol. Russ. 2018, 11, 86. [Google Scholar] [CrossRef]
- Boswell, J.F.; Thompson-Hollands, J.; Farchione, T.J.; Barlow, D.H. Intolerance of uncertainty: A common factor in the treatment of emotional disorders. J. Clin. Psychol. 2013, 69, 630–645. [Google Scholar] [CrossRef] [PubMed]
- Andersen, S.M.; Schwartz, A.H. Intolerance of ambiguity and depression: A cognitive vulnerability factor linked to hopelessness. Soc. Cogn. 1992, 10, 271–298. [Google Scholar] [CrossRef]
- Hofstede, G. Culture’s Consequences; SAGE Publications, Inc.: Beverly Hills, CA, USA, 1980. [Google Scholar]
- Kuhlmann, D.O.; Ardichvili, A. Becoming an expert: Developing expertise in an applied discipline. Eur. J. Train. Dev. 2015, 39, 262–276. [Google Scholar] [CrossRef]
- Hillen, M.A.; Gutheil, C.M.; Strout, T.D.; Smets, E.M.; Han, P.K. Tolerance of uncertainty: Conceptual analysis, integrative model, and implications for healthcare. Soc. Sci. Med. 2017, 180, 62–75. [Google Scholar] [CrossRef]
- Mandal, S. Brief introduction of virtual reality & its challenges. Int. J. Sci. Eng. Res. 2013, 4, 304–309. [Google Scholar]
- Dede, C. The evolution of distance education: Emerging technologies and distributed learning. Am. J. Distance Educ. 1996, 10, 4–36. [Google Scholar] [CrossRef]
- Brookes, J.; Warburton, M.; Alghadier, M.; Mon-Williams, M.; Mushtaq, F. Studying human behavior with virtual reality: The Unity Experiment Framework. Behav. Res. Methods 2020, 52, 455–463. [Google Scholar] [CrossRef] [PubMed]
- Bohné, T.; Heine, I.; Gürerk, Ö.; Rieger, C.; Kemmer, L.; Cao, L.Y. Perception engineering learning with virtual reality. IEEE Trans. Learn. Technol. 2021, 14, 500–514. [Google Scholar] [CrossRef]
- Villagrasa, S.; Fonseca, D.; Durán, J. Teaching case: Applying gamification techniques and virtual reality for learning building engineering 3D arts. In Proceedings of the Second International Conference on Technological Ecosystems for Enhancing Multiculturality, Salamanca, Spain, 1–3 October 2014; pp. 171–177. [Google Scholar]
- Gugenheimer, J.; Stemasov, E.; Frommel, J.; Rukzio, E. Sharevr: Enabling co-located experiences for virtual reality between hmd and non-hmd users. In Proceedings of the 2017 CHI Conference on Human Factors in Computing Systems, Denver, CO, USA, 6–11 May 2017; pp. 4021–4033. [Google Scholar]
- Cobbett, S.; Snelgrove-Clarke, E. Virtual versus face-to-face clinical simulation in relation to student knowledge, anxiety, and self-confidence in maternal-newborn nursing: A randomized controlled trial. Nurse Educ. Today 2016, 45, 179–184. [Google Scholar] [CrossRef] [PubMed]
- Soto, J.B.; Ocampo, D.T.; Colon, L.B.; Oropesa, A.V. Perceptions of ImmerseMe Virtual Reality Platform to Improve English Communicative Skills in Higher Education. Int. J. Interact. Mob. Technol. 2020, 14, 4–19. [Google Scholar] [CrossRef]
- Hoffman, H.; Vu, D. Virtual reality: Teaching tool of the twenty-first century? Acad. Med. J. Assoc. Am. Med Coll. 1997, 72, 1076–1081. [Google Scholar] [CrossRef] [PubMed]
- Bossard, C.; Kermarrec, G.; Buche, C.; Tisseau, J. Transfer of learning in virtual environments: A new challenge? Virtual Real. 2008, 12, 151–161. [Google Scholar] [CrossRef]
- De Gloria, A.; Bellotti, F.; Berta, R. Serious Games for education and training. Int. J. Serious Games 2014, 1. [Google Scholar] [CrossRef]
- Moynihan, D.P. Learning under uncertainty: Networks in crisis management. Public Adm. Rev. 2008, 68, 350–365. [Google Scholar] [CrossRef]
- Zeidner, M.; Matthews, G.; Roberts, R.D. Emotional intelligence in the workplace: A critical review. Appl. Psychol. 2004, 53, 371–399. [Google Scholar] [CrossRef]
- Barseli, M.; Sembiring, K.; Ifdil, I.; Fitria, L. The concept of student interpersonal communication. JPPI J. Penelit. Pendidik. Indones. 2019, 4, 129–134. [Google Scholar] [CrossRef]
- Marris, P. The Politics of Uncertainty: Attachment in Private and Public Life; Routledge: Abingdon, UK, 2003. [Google Scholar]
- Gudykunst, W.D. Anxiety/Uncertainty Management (AUM) Theory: Current Status. In Intercultural Communication Theory; SAGE Publications, Inc.: Thousand Oaks, CA, USA, 1995. [Google Scholar]
- Stankiewicz, B.J.; Legge, G.E.; Mansfield, J.S.; Schlicht, E.J. Lost in virtual space: Studies in human and ideal spatial navigation. J. Exp. Psychol. Hum. Percept. Perform. 2006, 32, 688. [Google Scholar] [CrossRef] [PubMed]
- Brunyé, T.T.; Haga, Z.D.; Houck, L.A.; Taylor, H.A. You look lost: Understanding uncertainty and representational flexibility in navigation. In Representations in Mind and World; Routledge: Abingdon, UK, 2017; pp. 42–56. [Google Scholar]
- Brunyé, T.T.; Gagnon, S.A.; Gardony, A.L.; Gopal, N.; Holmes, A.; Taylor, H.A.; Tenbrink, T. Where did it come from, where do you go? Direction sources influence navigation decisions during spatial uncertainty. Q. J. Exp. Psychol. 2015, 68, 585–607. [Google Scholar] [CrossRef] [PubMed]
- Herdener, N.; Wickens, C.D.; Clegg, B.A.; Smith, C. Overconfidence in projecting uncertain spatial trajectories. Hum. Factors 2016, 58, 899–914. [Google Scholar] [CrossRef]
- Cheng, K.; Huttenlocher, J.; Newcombe, N.S. 25 years of research on the use of geometry in spatial reorientation: A current theoretical perspective. Psychon. Bull. Rev. 2013, 20, 1033–1054. [Google Scholar] [CrossRef]
- Hirsh, J.B.; Mar, R.A.; Peterson, J.B. Psychological entropy: A framework for understanding uncertainty-related anxiety. Psychol. Rev. 2012, 119, 304. [Google Scholar] [CrossRef] [PubMed]
- Keller, A.M.; Taylor, H.A.; Brunyé, T.T. Uncertainty promotes information-seeking actions, but what information? Cogn. Res. Princ. Implic. 2020, 5, 1–17. [Google Scholar] [CrossRef]
- Stanley, D.; Latimer, K. ‘The Ward’: A simulation game for nursing students. Nurse Educ. Pract. 2011, 11, 20–25. [Google Scholar] [CrossRef]
- Caillois, R. Man, Play, and Games; University of Illinois Press: Champaign, IL, USA, 2001. [Google Scholar]
- Yap, C.M.; Kadobayashi, Y.; Yamaguchi, S. Conceptualizing Player-Side Emergence in Interactive Games: Between Hardcoded Software and the Human Mind in Papers, Please and Gone Home. Int. J. Gaming Comput.-Mediat. Simul. (IJGCMS) 2015, 7, 1–21. [Google Scholar] [CrossRef]
- Veale, K. Gone Home, and the power of affective nostalgia. Int. J. Herit. Stud. 2017, 23, 654–666. [Google Scholar] [CrossRef]
- Smith, L.; Campbell, G. The elephant in the room: Heritage, affect, and emotion. In A Companion to Heritage Studies; Wiley: New York, NY, USA, 2015; pp. 443–460. [Google Scholar]
- Ruberg, B. Straight paths through queer walking simulators: Wandering on rails and speedrunning in Gone Home. Games Cult. 2020, 15, 632–652. [Google Scholar] [CrossRef]
- Klei Entertainment. Don’t Starve. Video game. PC, IOS, Android, Xbox, Playstation, Wii U. Klei Entertainment, Canada. 2013. Available online: https://www.klei.com/games/dont-starve (accessed on 28 December 2022).
- Farah, Y.A.; Dorneich, M.C.; Gilbert, S.B. Evaluating Team Metrics in Cooperative Video Games. In Proceedings of the Human Factors and Ergonomics Society Annual Meeting; SAGE Publications Sage CA: Los Angeles, CA, USA, 2022; Volume 66, pp. 70–74. [Google Scholar]
- Xu, W.; Liang, H.N.; Yu, K.; Baghaei, N. Effect of gameplay uncertainty, display type, and age on virtual reality exergames. In Proceedings of the 2021 CHI Conference on Human Factors in Computing Systems, Yokohama, Japan, 8–13 May 2021; pp. 1–14. [Google Scholar]
- Liu, Y.; Lin, Y.; Shi, R.; Luo, Y.; Liang, H.-N. Relicvr: A virtual reality game for active exploration of archaeological relics. In Proceedings of the Extended Abstracts of the 2021 Annual Symposium on Computer-Human Interaction in Play, Virtual, Austria, 18–21 October 2021; pp. 326–332. [Google Scholar]
- Parish, P.; Siebel, F.; Thomas, B.S.; Canetti, Y. Amelia Bedelia; Harper & Row: New York, NY, USA, 1963. [Google Scholar]
- Tabbers, H.; Martens, R.; van Merriënboer, J.J. Multimedia instructions and cognitive load theory: Split-attention and modality effects. In Proceedings of the National Convention of the Association for Educational Communications and Technology, Long Beach, CA, USA, 17 February 2000; Citeseer: Princeton, NJ, USA, 2000. [Google Scholar]
- Brooke, J. SUS-A quick and dirty usability scale. Usability Eval. Ind. 1996, 189, 4–7. [Google Scholar]
- Usoh, M.; Catena, E.; Arman, S.; Slater, M. Using presence questionnaires in reality. Presence 2000, 9, 497–503. [Google Scholar] [CrossRef]
- Rigby, J.M.; Brumby, D.P.; Gould, S.J.; Cox, A.L. Development of a questionnaire to measure immersion in video media: The Film IEQ. In Proceedings of the 2019 ACM International Conference on Interactive Experiences for TV and Online Video, Salford, UK, 5–7 June 2019; pp. 35–46. [Google Scholar]
- Gianaros, P.J.; Muth, E.R.; Mordkoff, J.T.; Levine, M.E.; Stern, R.M. A questionnaire for the assessment of the multiple dimensions of motion sickness. Aviat. Space Environ. Med. 2001, 72, 115. [Google Scholar] [PubMed]
- Buhr, K.; Dugas, M.J. The intolerance of uncertainty scale: Psychometric properties of the English version. Behav. Res. Ther. 2002, 40, 931–945. [Google Scholar] [CrossRef]
- Brooke, J. SUS: A retrospective. J. Usability Stud. 2013, 8, 29–40. [Google Scholar]
- Bangor, A.; Kortum, P.; Miller, J. Determining what individual SUS scores mean: Adding an adjective rating scale. J. Usability Stud. 2009, 4, 114–123. [Google Scholar]
- Zika-Viktorsson, A.; Sundström, P.; Engwall, M. Project overload: An exploratory study of work and management in multi-project settings. Int. J. Proj. Manag. 2006, 24, 385–394. [Google Scholar] [CrossRef]


| Name of the Game | Type of the Game | Type of the Experience | Applied Uncertainty Approach | Requested Task |
|---|---|---|---|---|
| Gone Home | Exploration game; Role-playing game | Video game | Put players in unknown situations; Encourage the user to explore scattered objects along a twisting, uncertain path | To find out what has happened to the character’s sister and family by digging through scattered documents |
| Don’t Starve | Exploration game; Role-playing game | Video game | Put the user in a strange and unfamiliar world; Put the user in a situation that is uncertain about the outcome of some of his/her choices | To find through trial and error the way that can survive from the threats coming from the environment |
| GestureFit | Motion-based survival game | Immersive virtual reality | Induce uncertainty in the system through three uncertain gameplay elements (false attacks, misses, and critical hits) | To stay alive and perform gestures to defeat a monster |
| RelicVE | Exploration game; Role-playing game | Immersive virtual reality | Place the user in a situation where s/he does not know the shape and features of the target artifact from the beginning | To take away earth from the artifact using the available tools and physical movement without damaging it |
| Sex | Number | Percentage (%) |
| Female | 3 | 17.65 |
| Male | 14 | 82.35 |
| Age | Number | Percentage (%) |
| 20–30 | 17 | 100 |
| 30–35 | 0 | 0 |
| Nationality | Number | Percentage (%) |
| Italian | 17 | 100 |
| Others | 0 | 0 |
| Education level | Number | Percentage (%) |
| High school graduate, diploma or the equivalent | 1 | 5.9 |
| Bachelor’s degree | 12 | 70.59 |
| Master’s degree | 3 | 17.65 |
| Doctorate degree | 1 | 5.9 |
| Name of the Element | Description of the Element in Amelia Bedelia Story | Description of the Element in Our platform | Reason for Use |
|---|---|---|---|
| Absence of guidance | The housekeeper is asked to accomplish tasks based on the given instructions while does not have access to anybody to communicate her doubts. | The same situation is true here for the user but also s/he can save in the system the type of problem which is facing (a problem with the interface and/or a problem with the instruction). | This design choice limits the access to the sources of information, asking to focus and rely on the already provided knowledge or may come after, from sources such as panels and phone calls. |
| Specific means of communicating instruction | Textual on a printed paper | Both textual and verbal that comes from the panels and voice calls | Communicating instructions in both verbal and textual forms would be in favor of cognitive load and managing the attention of the user during the experience [63]. |
| Specific instruction communication patterns and sources of ambiguity | Instructions are presented in sequences of sentences, as appearing in step-by-step construction manuals. These instructions include lexical ambiguity coming from each sentence. | The same is followed here. In addition, the complexity of instructions also changes with increasing the degree of interconnectivity among parts of the sentences. In addition, available tasks and information change with receiving unpredictable phone calls coming from the boss. | This design choice provides the possibility for the experiment designer to purposely reduce the amount of available information and change the complexity of the sentences to control the amount of ambiguity and complexity in the system. In addition, the possibility of applying lexical ambiguity, as another potential source of confusion is provided. |
| A friendly environment supporting understanding and empathy in interpersonal communications | A nice house with friendly relationships between Amelia and the family | A nice virtual office and the friendly voice of the boss | Experiencing this environment potentially keeps the user’s interest to stay till the end of the experiment and accept the challenges. |
| Measuring Item | Question | Range |
|---|---|---|
| Level of English proficiency | How do you rate your level of English proficiency? | (1. Poor–5. Very good) |
| Previous Experience with immersive VR | Have you experienced virtual reality with a head-mounted display in the past? | (1. Never–5. Everyday) |
| Rating the perceived uncertainty of Tasks 1 and 2 | From the definition of Hillen et al. [28], changes in three sources can provide uncertainty in an information system: probability, ambiguity, or/and complexity of information. You can perceive uncertainty if you can become aware of its existence. Based on this definition and your experiment with the virtual office, what score will you give to the perceived uncertainty of Task 1 (the same question for Task 2)? | 1–5 |
| Questionnaire Name | Time to Answer the Call in Task 2 | Task Competition Time for Task 2 |
|---|---|---|
| The System Usability Scale (SUS) | r = −0.38 | r = −0.15 |
| Immersive Experience Questionnaire (IEQ) | r = 0.15 | r = 0.4 |
| Slater–Usoh–Steed presence questionnaire (SUS) | r = 0.24 | r = 0.29 |
| Motion sickness questionnaire (MASQ) | r = 0.21 | r = 0.16 |
| Intolerance of Uncertainty Scale (IUS) | r = −0.09 | r = 0.07 |
| Questionnaire Name | Mean | SD | Range |
|---|---|---|---|
| The System Usability Scale (SUS) | 76.32 | 9.89 | [1–100] |
| Immersive Experience Questionnaire (IEQ) | 65.84 | 7.13 | [1–100] |
| Slater–Usoh–Steed presence questionnaire (SUS) | 64.37 | 14.50 | [1–100] |
| Motion sickness questionnaire (MASQ) | 22.18 | 12.48 | [1–100] |
| Intolerance of Uncertainty Scale (IUS) | 59.48 | 11.63 | [1–100] |
Disclaimer/Publisher’s Note: The statements, opinions and data contained in all publications are solely those of the individual author(s) and contributor(s) and not of MDPI and/or the editor(s). MDPI and/or the editor(s) disclaim responsibility for any injury to people or property resulting from any ideas, methods, instructions or products referred to in the content. |
© 2023 by the authors. Licensee MDPI, Basel, Switzerland. This article is an open access article distributed under the terms and conditions of the Creative Commons Attribution (CC BY) license (https://creativecommons.org/licenses/by/4.0/).
Share and Cite
Hajahmadi, S.; Marfia, G. Effects of the Uncertainty of Interpersonal Communications on Behavioral Responses of the Participants in an Immersive Virtual Reality Experience: A Usability Study. Sensors 2023, 23, 2148. https://doi.org/10.3390/s23042148
Hajahmadi S, Marfia G. Effects of the Uncertainty of Interpersonal Communications on Behavioral Responses of the Participants in an Immersive Virtual Reality Experience: A Usability Study. Sensors. 2023; 23(4):2148. https://doi.org/10.3390/s23042148
Chicago/Turabian StyleHajahmadi, Shirin, and Gustavo Marfia. 2023. "Effects of the Uncertainty of Interpersonal Communications on Behavioral Responses of the Participants in an Immersive Virtual Reality Experience: A Usability Study" Sensors 23, no. 4: 2148. https://doi.org/10.3390/s23042148
APA StyleHajahmadi, S., & Marfia, G. (2023). Effects of the Uncertainty of Interpersonal Communications on Behavioral Responses of the Participants in an Immersive Virtual Reality Experience: A Usability Study. Sensors, 23(4), 2148. https://doi.org/10.3390/s23042148