

More Reliable Neighborhood Contrastive Learning for Novel Class Discovery in Sensor-Based Human Activity Recognition


Abstract
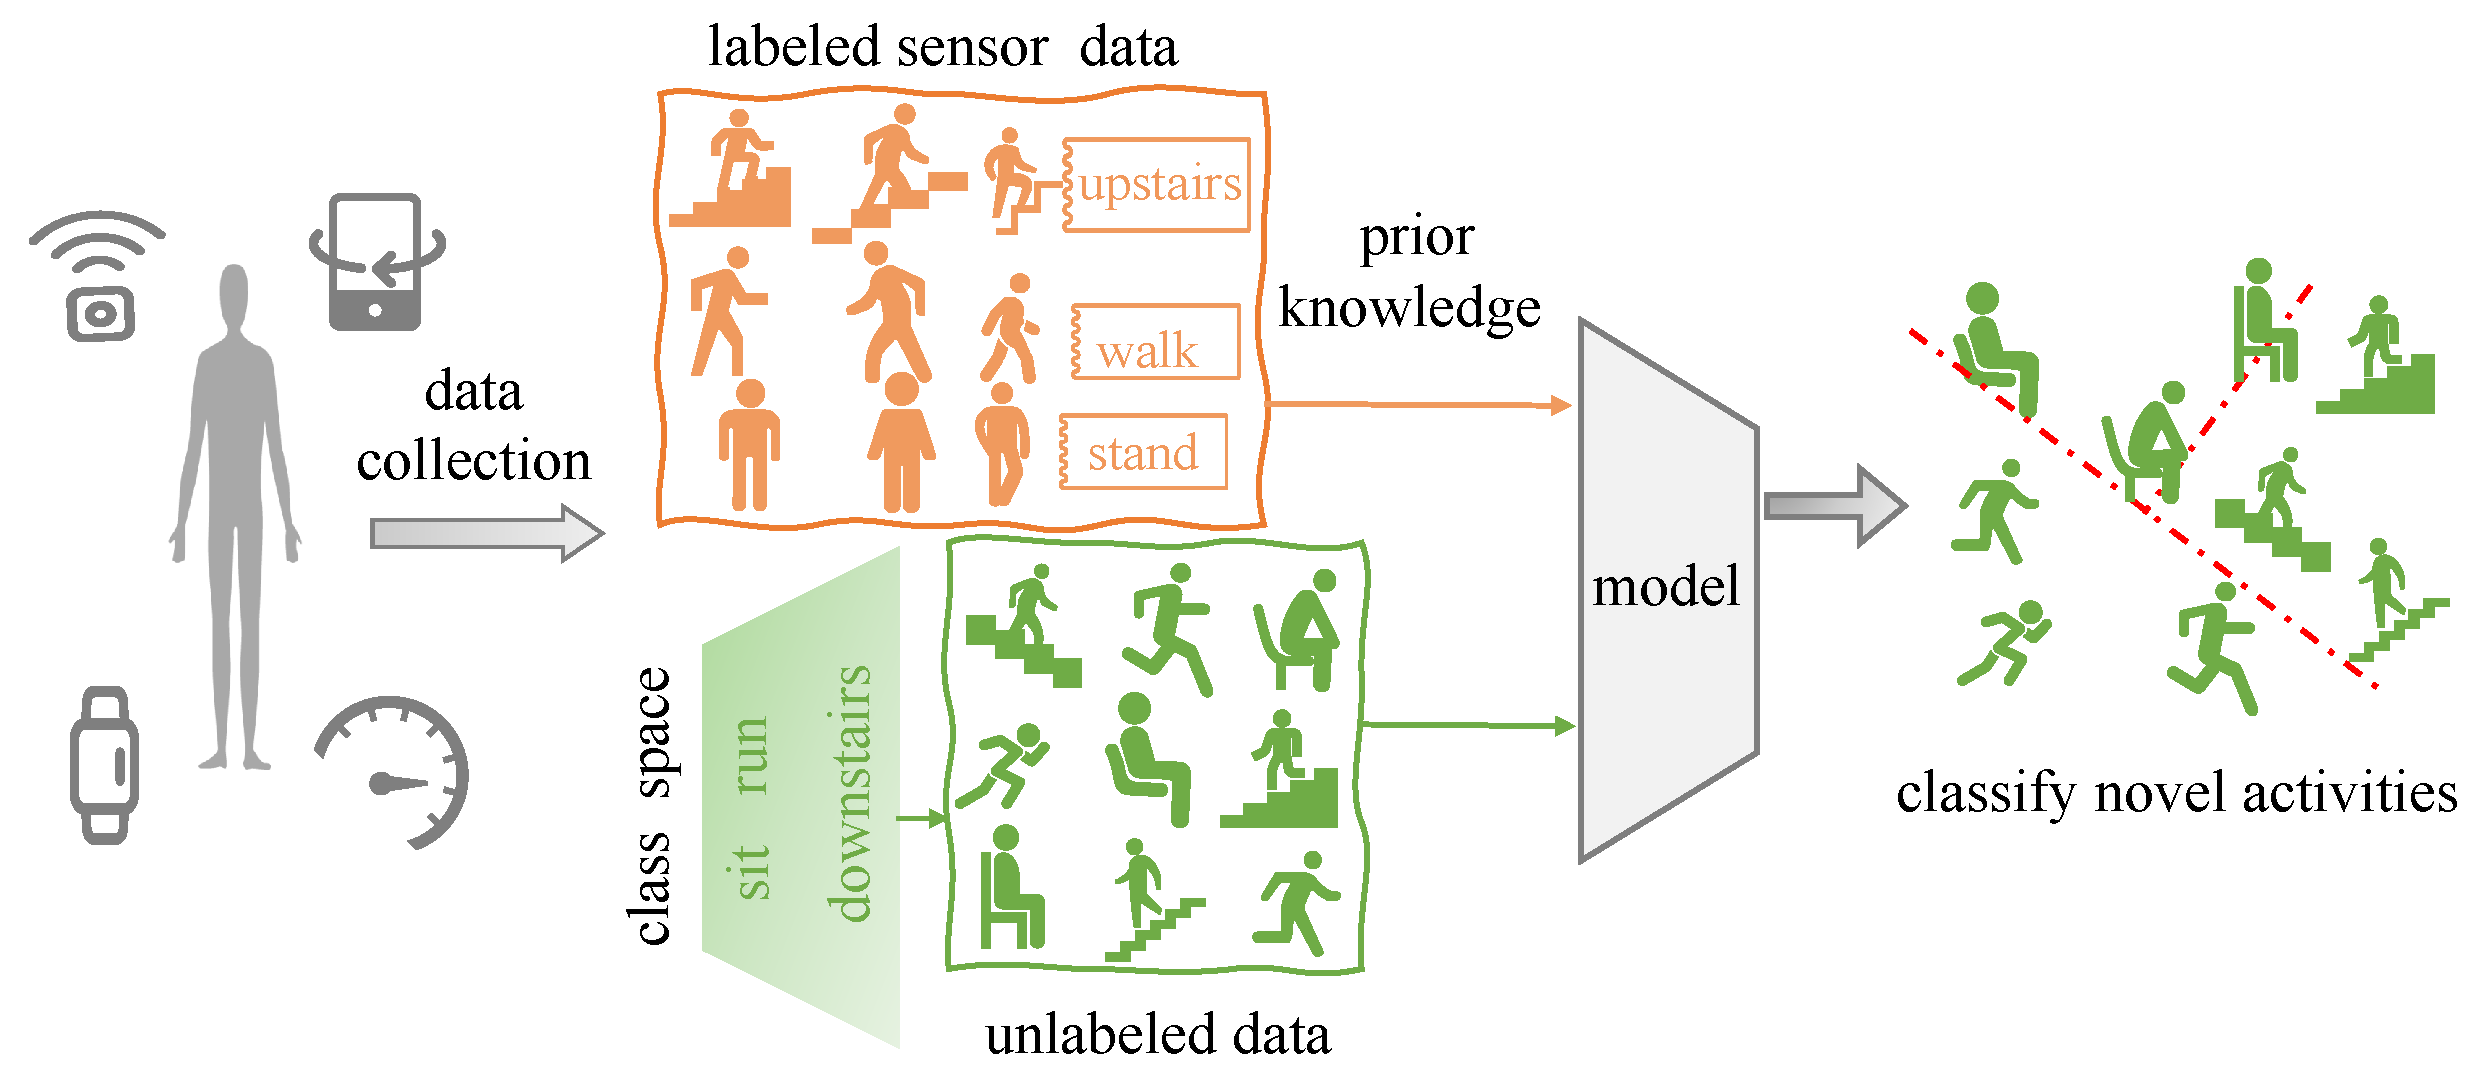
:1. Introduction
2. Related Work
2.1. Deep Learning for Sensor-Based HAR
2.2. Novel Class Discovery
2.3. Unsupervised Clustering
2.4. Contrastive Learning for HAR
2.5. Similarity Measure Application
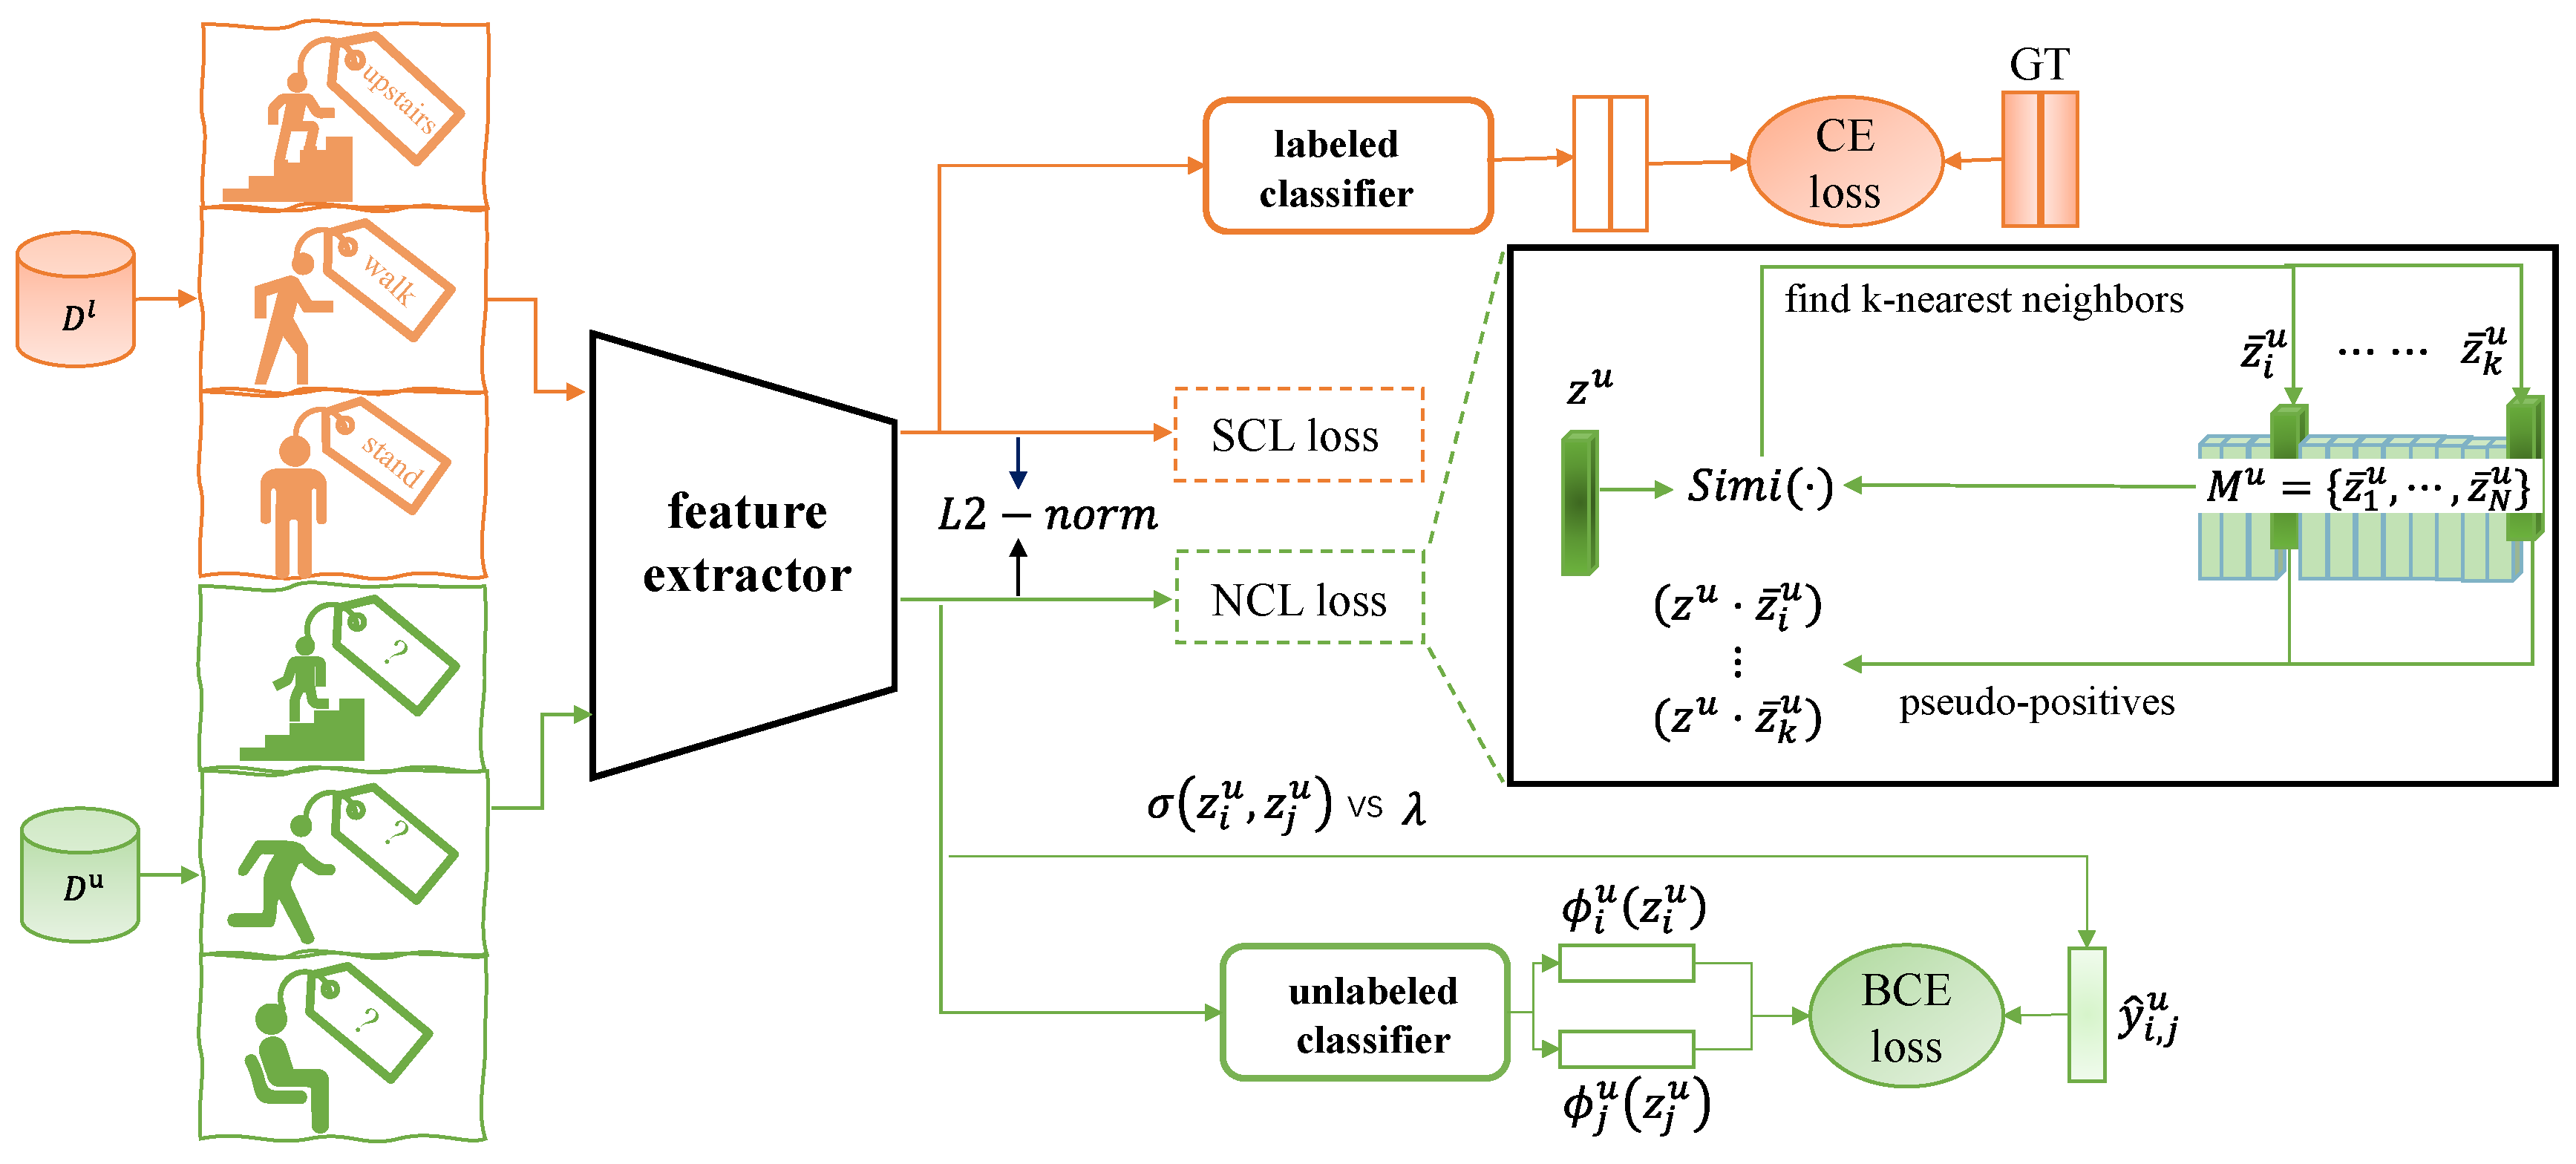
3. Methods
3.1. Baseline Framework
3.2. Supervised and Neighborhood Contrastive Learning
3.3. Overall Loss
3.4. Similarity Measure for Neighborhoods
| Algorithm 1: Calculation of overall loss. |
 |
4. Experiments
4.1. Experiment Materials
4.1.1. Dataset
4.1.2. Backbone Network
4.1.3. Implementation Details
4.1.4. Evaluation Metric
4.2. Ablation Reviews
4.3. Reasons for Two Reductions
4.4. Comparison with State-of-the-Art Methods
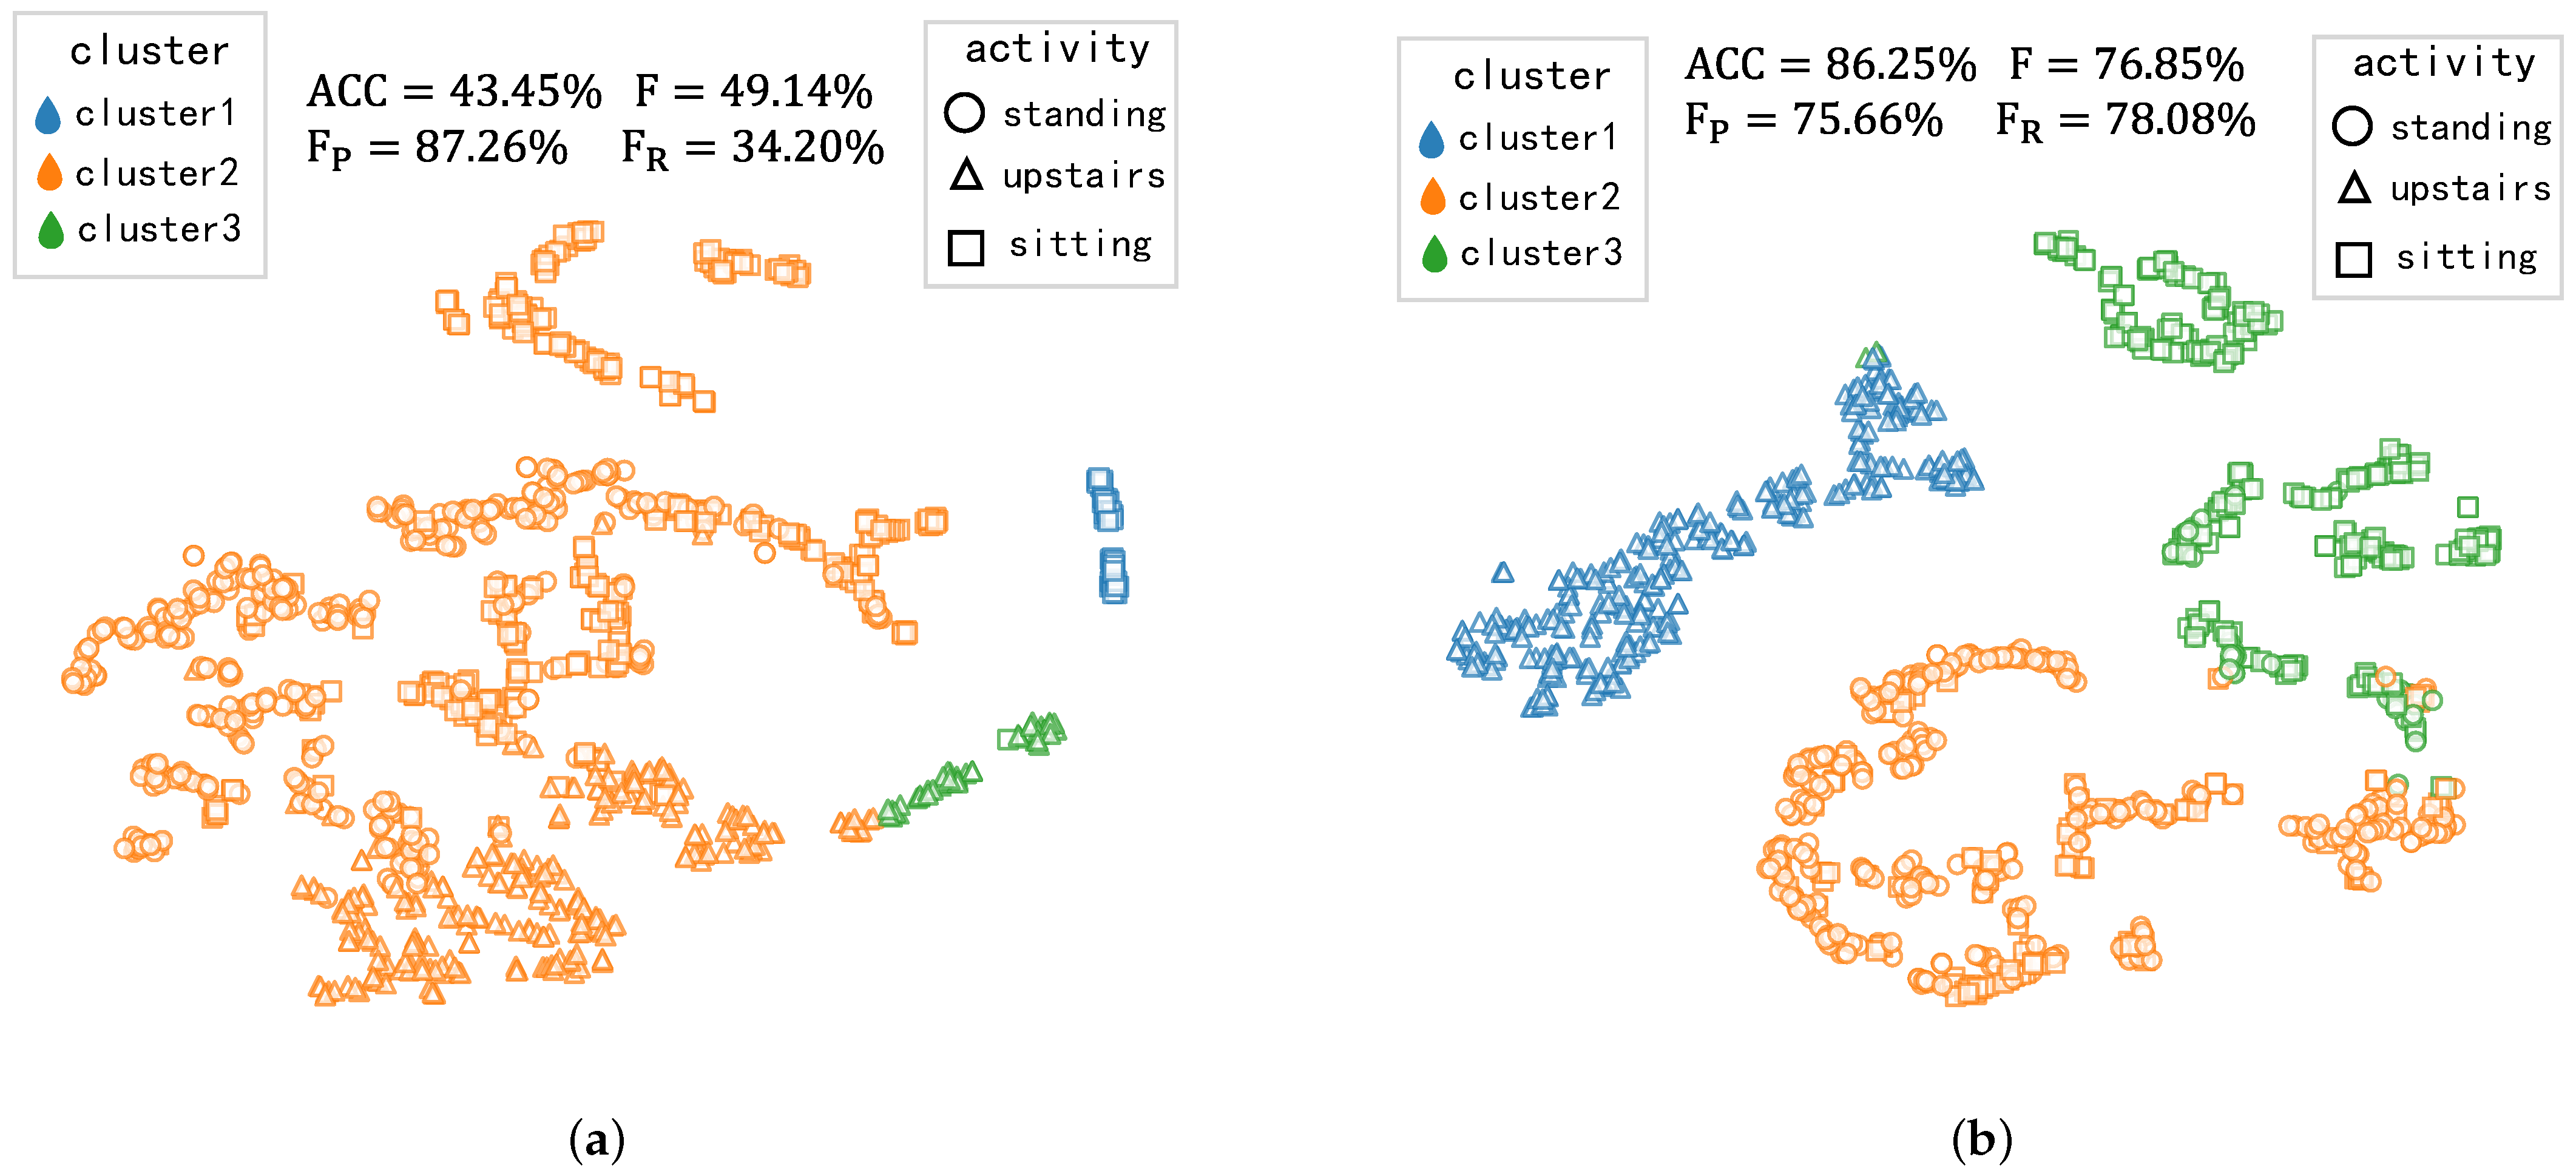
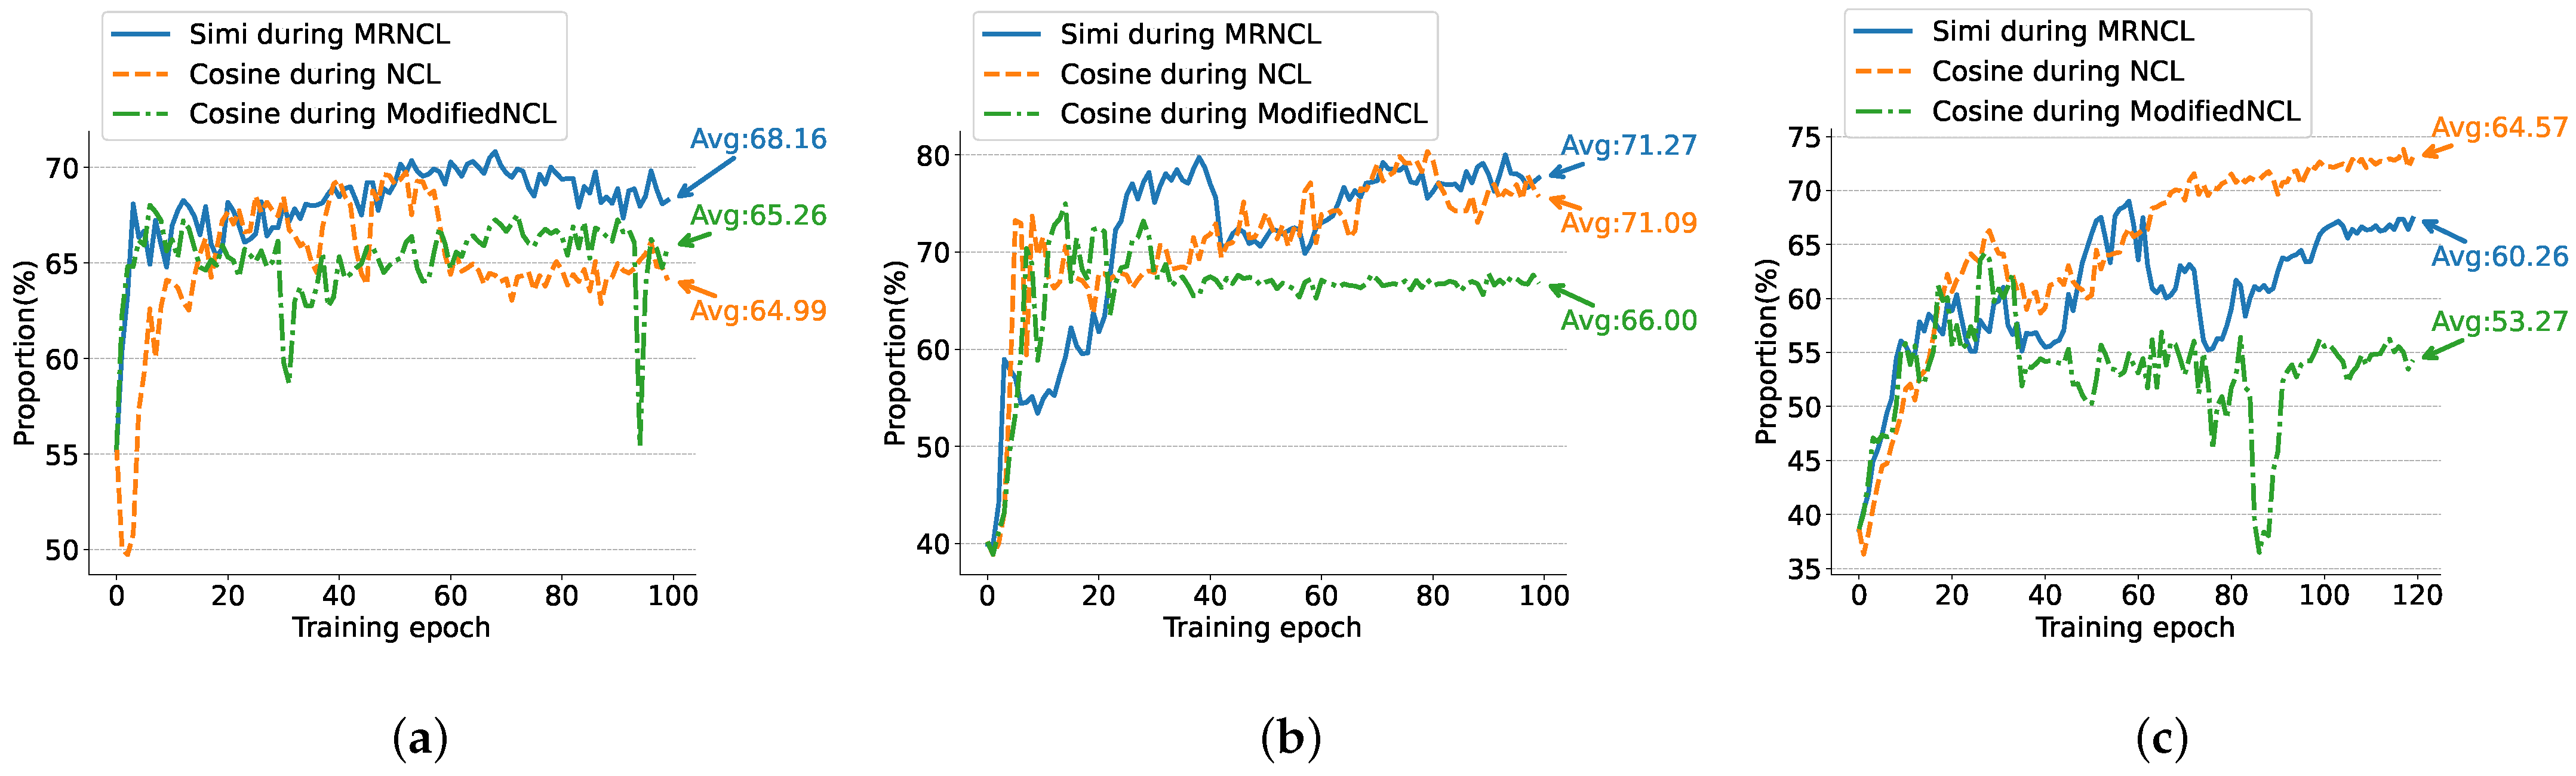
4.5. More Reliable Neighborhoods
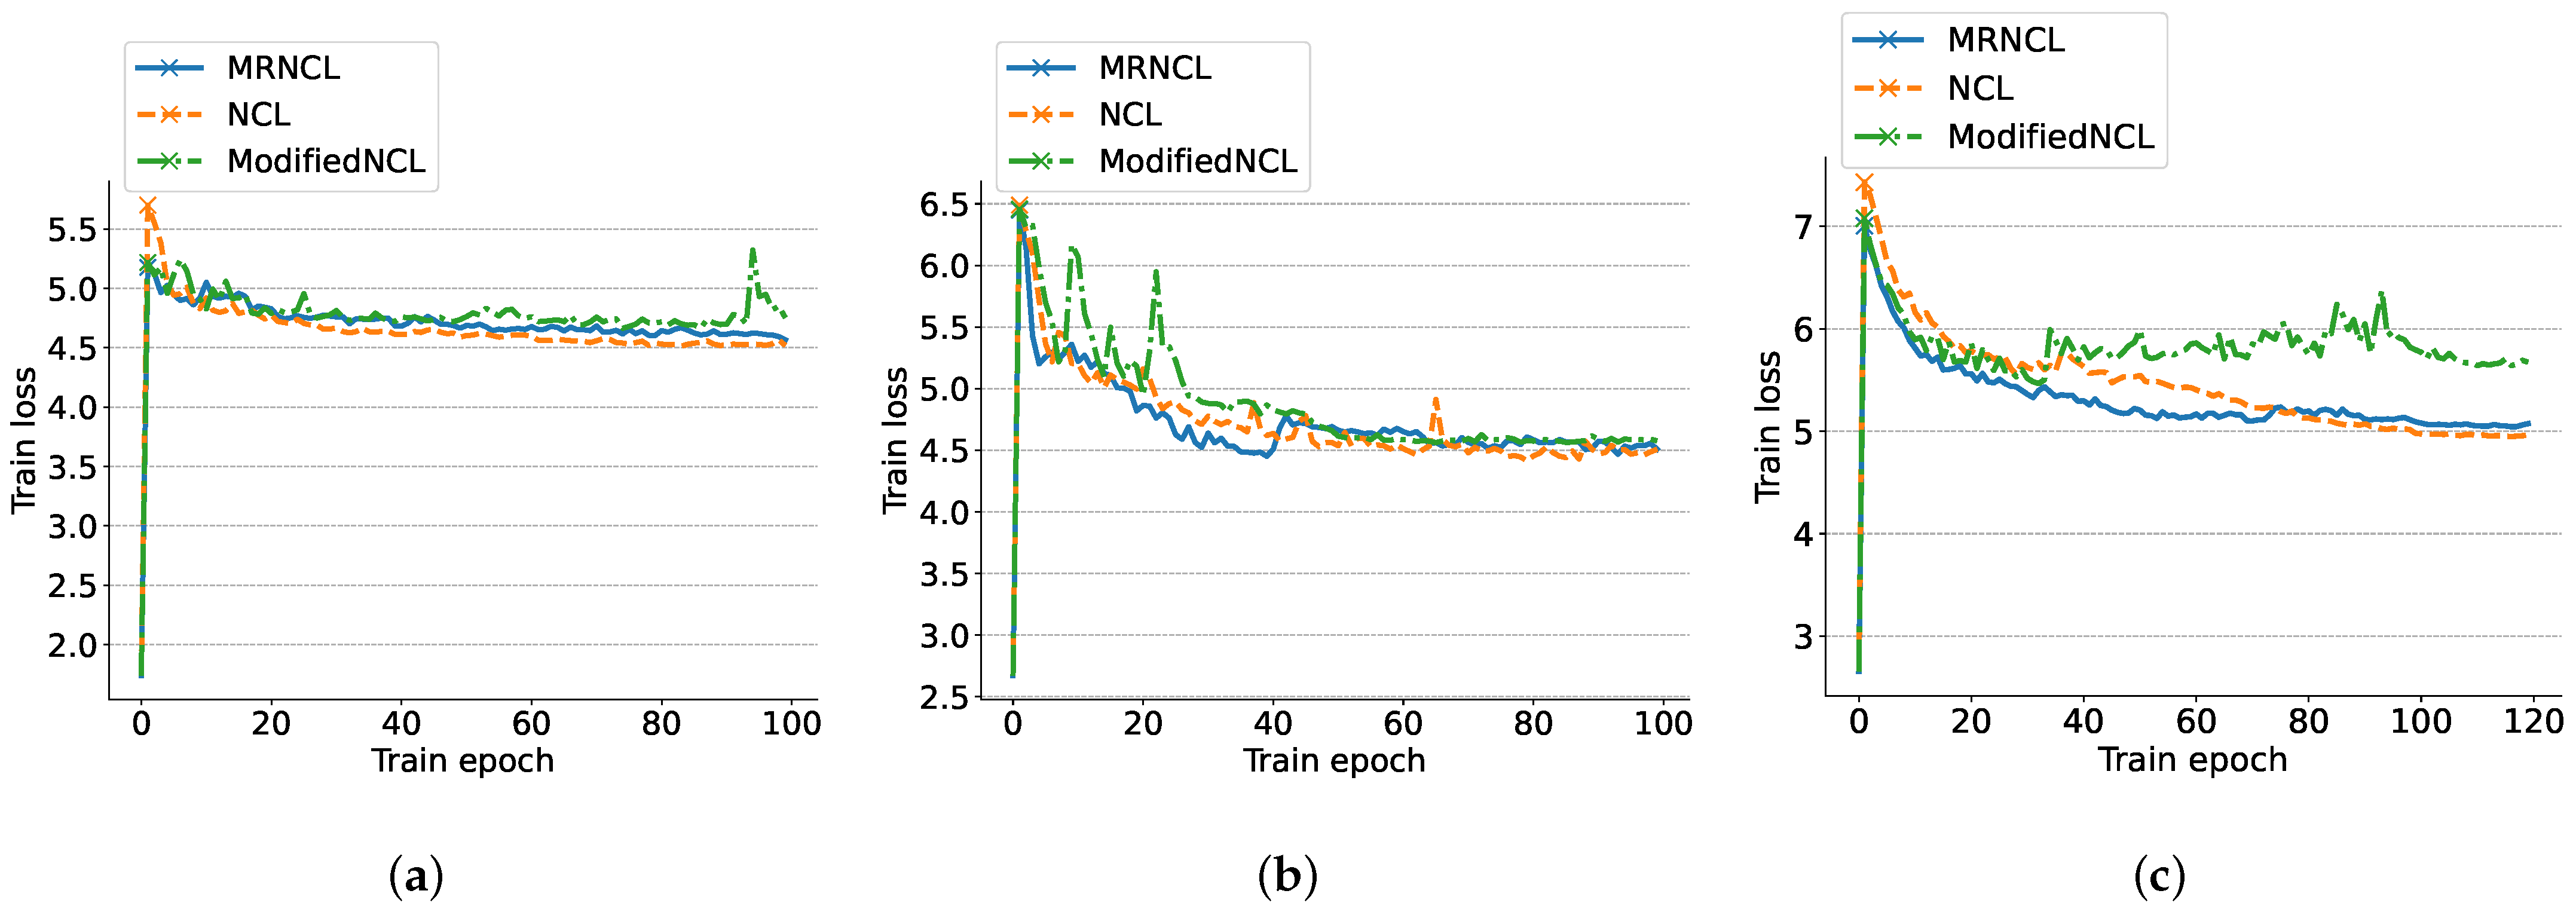
- Cosine during ModifiedNCL: the ModifiedNCL framework, employing the cosine similarity to select neighborhoods. Compared with NCL [26], this framework removes CS and AP.
- Cosine during NCL: the original NCL framework [26], employing the cosine similarity for neighborhoods.
- Simi during MRNCL: our framework, which employs a new similarity measure, .
5. Discussion
6. Conclusions
Author Contributions
Funding
Data Availability Statement
Conflicts of Interest
Abbreviations
| HAR | Human Activity Recognition |
| NCD | Novel Class Discovery |
| NCL | Neighborhood Contrastive Learning |
| KNNS | K-nearest neighbors |
| MRNCL | More Reliable Neighborhood Contrastive Learning |
| GT | Ground-truth |
| CE | Cross-entropy |
| BCE | Binary cross-entropy |
| SCL | Supervised contrastive learning |
| CS | Consistency loss |
| AP | Augment-positives |
| AC | Agglomerative Clustering |
References
- Duan, F.; Zhu, T.; Wang, J.; Chen, L.; Ning, H.; Wan, Y. A Multi-Task Deep Learning Approach for Sensor-based Human Activity Recognition and Segmentation. IEEE Trans. Instrum. Meas. 2023, 72, 2514012. [Google Scholar] [CrossRef]
- Xiao, Y.; Chen, Y.; Nie, M.; Zhu, T.; Liu, Z.; Liu, C. Exploring LoRa and Deep Learning-Based Wireless Activity Recognition. Electronics 2023, 12, 629. [Google Scholar] [CrossRef]
- Ghayvat, H.; Liu, J.; Mukhopadhyay, S.C.; Gui, X. Wellness sensor networks: A proposal and implementation for smart home for assisted living. IEEE Sens. J. 2015, 15, 7341–7348. [Google Scholar] [CrossRef]
- Uddin, M.Z.; Hassan, M.M. Activity recognition for cognitive assistance using body sensors data and deep convolutional neural network. IEEE Sens. J. 2018, 19, 8413–8419. [Google Scholar] [CrossRef]
- Zhang, X.; Cui, S.; Zhu, T.; Chen, L.; Zhou, F.; Ning, H. CASL: Capturing Activity Semantics through Location Information for enhanced activity recognition. IEEE ACM Trans. Comput. Biol. Bioinform. 2023, 22, 37027660. [Google Scholar] [CrossRef] [PubMed]
- Cornacchia, M.; Ozcan, K.; Zheng, Y.; Velipasalar, S. A survey on activity detection and classification using wearable sensors. IEEE Sens. J. 2016, 17, 386–403. [Google Scholar] [CrossRef]
- Ahmad, Z.; Khan, N. CNN-based multistage gated average fusion (MGAF) for human action recognition using depth and inertial sensors. IEEE Sens. J. 2020, 21, 3623–3634. [Google Scholar] [CrossRef]
- Hammerla, N.Y.; Halloran, S.; Plötz, T. Deep, convolutional, and recurrent models for human activity recognition using wearables. In Proceedings of the Twenty-Fifth International Joint Conference on Artificial Intelligence, New York, NY, USA, 9–15 July 2016; pp. 1533–1540. [Google Scholar]
- Zhang, H.; Xiao, Z.; Wang, J.; Li, F.; Szczerbicki, E. A novel IoT-perceptive human activity recognition (HAR) approach using multihead convolutional attention. IEEE Internet Things J. 2019, 7, 1072–1080. [Google Scholar] [CrossRef]
- Park, H.; Kim, N.; Lee, G.H.; Choi, J.K. MultiCNN-FilterLSTM: Resource-efficient sensor-based human activity recognition in IoT applications. Future Gener. Comput. Syst. 2023, 139, 196–209. [Google Scholar] [CrossRef]
- Ramanujam, E.; Perumal, T.; Padmavathi, S. Human activity recognition with smartphone and wearable sensors using deep learning techniques: A review. IEEE Sens. J. 2021, 21, 13029–13040. [Google Scholar] [CrossRef]
- Ray, A.; Kolekar, M.H.; Balasubramanian, R.; Hafiane, A. Transfer learning enhanced vision-based human activity recognition: A decade-long analysis. Int. J. Inf. Manag. Data Insights 2023, 3, 100142. [Google Scholar] [CrossRef]
- An, S.; Bhat, G.; Gumussoy, S.; Ogras, U. Transfer learning for human activity recognition using representational analysis of neural networks. ACM Trans. Comput. Healthc. 2023, 4, 1–21. [Google Scholar] [CrossRef]
- Liu, D.; Abdelzaher, T. Semi-supervised contrastive learning for human activity recognition. In Proceedings of the 2021 17th International Conference on Distributed Computing in Sensor Systems (DCOSS), Virtual, 14–16 July 2021; pp. 45–53. [Google Scholar]
- Qu, Y.; Tang, Y.; Yang, X.; Wen, Y.; Zhang, W. Context-aware mutual learning for semi-supervised human activity recognition using wearable sensors. Expert Syst. Appl. 2023, 219, 119679. [Google Scholar] [CrossRef]
- Jha, S.; Schiemer, M.; Zambonelli, F.; Ye, J. Continual learning in sensor-based human activity recognition: An empirical benchmark analysis. Inf. Sci. 2021, 575, 1–21. [Google Scholar] [CrossRef]
- Kwon, Y.; Kang, K.; Bae, C. Unsupervised learning for human activity recognition using smartphone sensors. Expert Syst. Appl. 2014, 41, 6067–6074. [Google Scholar] [CrossRef]
- Konak, O.; Wegner, P.; Albert, J.A.; Arnrich, B. Unsupervised Activity Recognition Using Trajectory Heatmaps from Inertial Measurement Unit Data. Proc. ICAART 2022, 2, 304–312. [Google Scholar]
- Ma, H.; Zhang, Z.; Li, W.; Lu, S. Unsupervised human activity representation learning with multi-task deep clustering. Proc. Acm Interact. Mob. Wearable Ubiquitous Technol. 2021, 5, 1–25. [Google Scholar] [CrossRef]
- Abedin, A.; Motlagh, F.; Shi, Q.; Rezatofighi, H.; Ranasinghe, D. Towards deep clustering of human activities from wearables. In Proceedings of the 2020 ACM International Symposium on Wearable Computers, Virtual, 12–16 September 2020; pp. 1–6. [Google Scholar]
- Amrani, H.; Micucci, D.; Napoletano, P. Unsupervised Deep Learning-based clustering for Human Activity Recognition. In Proceedings of the 2022 IEEE 12th International Conference on Consumer Electronics (ICCE), Berlin, Germany, 12–18 November 2022; pp. 1–6. [Google Scholar]
- Chen, K.; Zhang, D.; Yao, L.; Guo, B.; Yu, Z.; Liu, Y. Deep learning for sensor-based human activity recognition: Overview, challenges, and opportunities. ACM Comput. Surv. CSUR 2021, 54, 1–40. [Google Scholar] [CrossRef]
- Ige, A.O.; Noor, M.H.M. A survey on unsupervised learning for wearable sensor-based activity recognition. Appl. Soft Comput. 2022, 127, 109363. [Google Scholar] [CrossRef]
- Bulling, A.; Blanke, U.; Schiele, B. A tutorial on human activity recognition using body-worn inertial sensors. ACM Comput. Surv. CSUR 2014, 46, 1–33. [Google Scholar] [CrossRef]
- Tian, Y.; Krishnan, D.; Isola, P. Contrastive multiview coding. In Proceedings of the Computer Vision–ECCV 2020: 16th European Conference, Glasgow, UK, 23–28 August 2020; pp. 776–794. [Google Scholar]
- Zhong, Z.; Fini, E.; Roy, S.; Luo, Z.; Ricci, E.; Sebe, N. Neighborhood contrastive learning for novel class discovery. In Proceedings of the IEEE/CVF Conference on Computer Vision and Pattern Recognition, Nashville, TN, USA, 20–25 June 2021; pp. 10867–10875. [Google Scholar]
- Rahutomo, F.; Kitasuka, T.; Aritsugi, M. Semantic cosine similarity. In Proceedings of the The 7th International Student Conference on Advanced Science and Technology ICAST, Seoul, Republic of Korea, 29–30 October 2012; p. 1. [Google Scholar]
- Han, K.; Vedaldi, A.; Zisserman, A. Learning to discover novel visual categories via deep transfer clustering. In Proceedings of the IEEE/CVF International Conference on Computer Vision, Seoul, Republic of Korea, 27 October–2 November 2019; pp. 8401–8409. [Google Scholar]
- Dwibedi, D.; Aytar, Y.; Tompson, J.; Sermanet, P.; Zisserman, A. With a little help from my friends: Nearest-neighbor contrastive learning of visual representations. In Proceedings of the IEEE/CVF International Conference on Computer Vision, Montreal, BC, Canada, 11–17 October 2021; pp. 9588–9597. [Google Scholar]
- Hamerly, G.; Elkan, C. Learning the k in k-means. Adv. Neural Inf. Process. Syst. 2003, 16, 1–8. [Google Scholar]
- Zhang, S.; Li, Y.; Zhang, S.; Shahabi, F.; Xia, S.; Deng, Y.; Alshurafa, N. Deep learning in human activity recognition with wearable sensors: A review on advances. Sensors 2022, 22, 1476. [Google Scholar] [CrossRef]
- Müllner, D. Modern hierarchical, agglomerative clustering algorithms. arXiv 2011, arXiv:1109.2378. [Google Scholar]
- Tang, C.I.; Perez-Pozuelo, I.; Spathis, D.; Mascolo, C. Exploring contrastive learning in human activity recognition for healthcare. arXiv 2020, arXiv:2011.11542. [Google Scholar]
- Wang, J.; Zhu, T.; Gan, J.; Chen, L.L.; Ning, H.; Wan, Y. Sensor Data Augmentation by Resampling in Contrastive Learning for Human Activity Recognition. IEEE Sens. J. 2022, 22, 22994–23008. [Google Scholar] [CrossRef]
- Qian, H.; Tian, T.; Miao, C. What makes good contrastive learning on small-scale wearable-based tasks? In Proceedings of the 28th ACM SIGKDD Conference on Knowledge Discovery and Data Mining, Washington, DC, USA, 14–18 August 2022; pp. 3761–3771. [Google Scholar]
- Fei, G.; Liu, B. Social media text classification under negative covariate shift. In Proceedings of the 2015 Conference on Empirical Methods in Natural Language Processing, Lisbon, Portugal, 17–21 September 2015; pp. 2347–2356. [Google Scholar]
- Kerimbekov, Y.; Bilge, H.Ş.; Uğurlu, H.H. The use of Lorentzian distance metric in classification problems. Pattern Recognit. Lett. 2016, 84, 170–176. [Google Scholar] [CrossRef]
- Xia, P.; Zhang, L.; Li, F. Learning similarity with cosine similarity ensemble. Inf. Sci. 2015, 307, 39–52. [Google Scholar] [CrossRef]
- Scheirer, W.J.; de Rezende Rocha, A.; Sapkota, A.; Boult, T.E. Toward open set recognition. IEEE Trans. Pattern Anal. Mach. Intell. 2012, 35, 1757–1772. [Google Scholar] [CrossRef]
- Chen, Z.; Liu, B. Lifelong Machine Learning; Springer: Berlin, Germany, 2018; Volume 1. [Google Scholar]
- He, K.; Fan, H.; Wu, Y.; Xie, S.; Girshick, R. Momentum contrast for unsupervised visual representation learning. In Proceedings of the IEEE/CVF Conference on Computer Vision and Pattern Recognition, Seattle, WA, USA, 13–19 June 2020; pp. 9729–9738. [Google Scholar]
- Khosla, P.; Teterwak, P.; Wang, C.; Sarna, A.; Tian, Y.; Isola, P.; Maschinot, A.; Liu, C.; Krishnan, D. Supervised contrastive learning. Adv. Neural Inf. Process. Syst. 2020, 33, 18661–18673. [Google Scholar]
- Gower, J.C. A general coefficient of similarity and some of its properties. Biometrics 1971, 27, 857–871. [Google Scholar] [CrossRef]
- Jaffe, A. Lorentz transformations, rotations, and boosts. Lect. Notes 2013. [Google Scholar]
- Deza, M.M.; Deza, E. Dictionary of Distances; Elsevier: Amsterdam, The Netherlands, 2006. [Google Scholar]
- Jaccard, P. Étude comparative de la distribution florale dans une portion des Alpes et des Jura. Bull. Soc. Vaudoise Sci. Nat. 1901, 37, 547–579. [Google Scholar]
- Morishita, M. Measuring of Interspecific Association and Similarity Between Communities. Mem. Fac. Sci. Kyushu Univ. Ser. E Biol. 1959, 3, 64–80. [Google Scholar]
- Kwapisz, J.R.; Weiss, G.M.; Moore, S.A. Activity recognition using cell phone accelerometers. ACM SigKDD Explor. Newsl. 2011, 12, 74–82. [Google Scholar] [CrossRef]
- Bulbul, E.; Cetin, A.; Dogru, I.A. Human activity recognition using smartphones. In Proceedings of the 2018 2nd International Symposium on Multidisciplinary Studies and Innovative Technologies (ISMSIT), Ankara, Turkey, 19–21 October 2018; pp. 1–6. [Google Scholar]
- Zhang, M.; Sawchuk, A.A. USC-HAD: A daily activity dataset for ubiquitous activity recognition using wearable sensors. In Proceedings of the 2012 ACM Conference on Ubiquitous Computing, Pittsburgh, PA, USA, 5–8 September 2012; pp. 1036–1043. [Google Scholar]
- Kuhn, H.W. The Hungarian method for the assignment problem. Nav. Res. Logist. Q. 1955, 2, 83–97. [Google Scholar] [CrossRef]
- Wang, J.; Zhu, T.; Chen, L.; Ning, H.; Wan, Y. Negative selection by clustering for contrastive learning in human activity recognition. IEEE Internet Things J. 2023, 10, 10833–10844. [Google Scholar] [CrossRef]
- Van Der Maaten, L. Accelerating t-SNE using tree-based algorithms. J. Mach. Learn. Res. 2014, 15, 3221–3245. [Google Scholar]


| Dataset | Labeled Set | Unlabeled Set | ||||
|---|---|---|---|---|---|---|
| Instance | Class | Activity | Instance | Class | Activity | |
| WISDM | ≈5 K | 3 | downstairs, jogging, sitting | ≈5.2 K | 3 | standing, upstairs, walking |
| UCI-HAR | ≈6.3 K | 3 | downstairs, laying, walking | ≈7.4 K | 3 | standing, upstairs, sitting |
| USC-HAD | ≈12 K | 6 | walking-forward, upstairs, walking-left | ≈12 K | 6 | walking-right, running, standing |
| elevator-down, sitting, elevator-up | downstairs, jumping, sleeping | |||||
| Method | WISDM | UCI-HAR | USC-HAD |
|---|---|---|---|
| Basel. w/o CE | 70.17 | 35.91 | 49.05 |
| Basel. w/o BCE | 71.85 | 55.21 | 57.37 |
| Baseline | 80.97 | 84.53 | 74.52 |
| +MRNCL w/o PP | 81.77 () | 83.86 () | 73.28 () |
| +MRNCL w/o LA | 83.71 () | 81.57 () | 60.31 () |
| +MRNCL | 83.78 () | 86.25 () | 76.06 () |
| Method | WISDM | UCI-HAR | USC-HAD |
|---|---|---|---|
| MRNCL | 83.78 | 86.25 | 76.06 |
| MRNCL w CS | 82.31 () | 85.29 () | 65.95 () |
| MRNCL w AP | 71.78 () | 88.16 () | 71.79 () |
| Method | WISDM | UCI-HAR | USC-HAD | |||||||||
|---|---|---|---|---|---|---|---|---|---|---|---|---|
| k-means | 69.97 | 61.94 | 54.91 | 71.03 | 43.45 | 49.14 | 87.26 | 34.20 | 72.07 | 65.02 | 64.70 | 65.34 |
| AC-Average | 68.70 | 61.12 | 54.19 | 70.09 | 42.44 | 49.11 | 88.58 | 33.97 | 66.90 | 61.27 | 80.99 | 49.28 |
| AC-Complete | 66.82 | 59.65 | 52.67 | 68.77 | 42.79 | 49.13 | 88.11 | 34.06 | 63.05 | 60.11 | 72.80 | 51.19 |
| AC-Ward | 68.23 | 60.94 | 55.50 | 67.57 | 42.22 | 49.14 | 88.89 | 33.95 | 65.91 | 60.93 | 66.68 | 56.10 |
| ModifiedNCL | 80.16 | 76.02 | 71.08 | 81.70 | 83.48 | 72.75 | 70.35 | 75.31 | 73.16 | 72.49 | 65.50 | 81.14 |
| NCL | 74.26 | 69.78 | 68.52 | 71.09 | 84.91 | 75.18 | 73.11 | 77.38 | 74.94 | 67.75 | 67.40 | 68.10 |
| MRNCL(ours) | 83.78 | 80.82 | 71.70 | 92.60 | 86.25 | 76.85 | 75.66 | 78.08 | 76.06 | 68.46 | 67.61 | 69.34 |
Disclaimer/Publisher’s Note: The statements, opinions and data contained in all publications are solely those of the individual author(s) and contributor(s) and not of MDPI and/or the editor(s). MDPI and/or the editor(s) disclaim responsibility for any injury to people or property resulting from any ideas, methods, instructions or products referred to in the content. |
© 2023 by the authors. Licensee MDPI, Basel, Switzerland. This article is an open access article distributed under the terms and conditions of the Creative Commons Attribution (CC BY) license (https://creativecommons.org/licenses/by/4.0/).
Share and Cite
Zhang, M.; Zhu, T.; Nie, M.; Liu, Z. More Reliable Neighborhood Contrastive Learning for Novel Class Discovery in Sensor-Based Human Activity Recognition. Sensors 2023, 23, 9529. https://doi.org/10.3390/s23239529
Zhang M, Zhu T, Nie M, Liu Z. More Reliable Neighborhood Contrastive Learning for Novel Class Discovery in Sensor-Based Human Activity Recognition. Sensors. 2023; 23(23):9529. https://doi.org/10.3390/s23239529
Chicago/Turabian StyleZhang, Mingcong, Tao Zhu, Mingxing Nie, and Zhenyu Liu. 2023. "More Reliable Neighborhood Contrastive Learning for Novel Class Discovery in Sensor-Based Human Activity Recognition" Sensors 23, no. 23: 9529. https://doi.org/10.3390/s23239529
APA StyleZhang, M., Zhu, T., Nie, M., & Liu, Z. (2023). More Reliable Neighborhood Contrastive Learning for Novel Class Discovery in Sensor-Based Human Activity Recognition. Sensors, 23(23), 9529. https://doi.org/10.3390/s23239529