
Laboratory Performance Evaluation of a Low-Cost Electrochemical Formaldehyde Sensor


Abstract
:1. Introduction
2. Materials and Methods
2.1. Sensor Preparation
2.2. Broadband Cavity-Enhanced Absorption Spectrometer
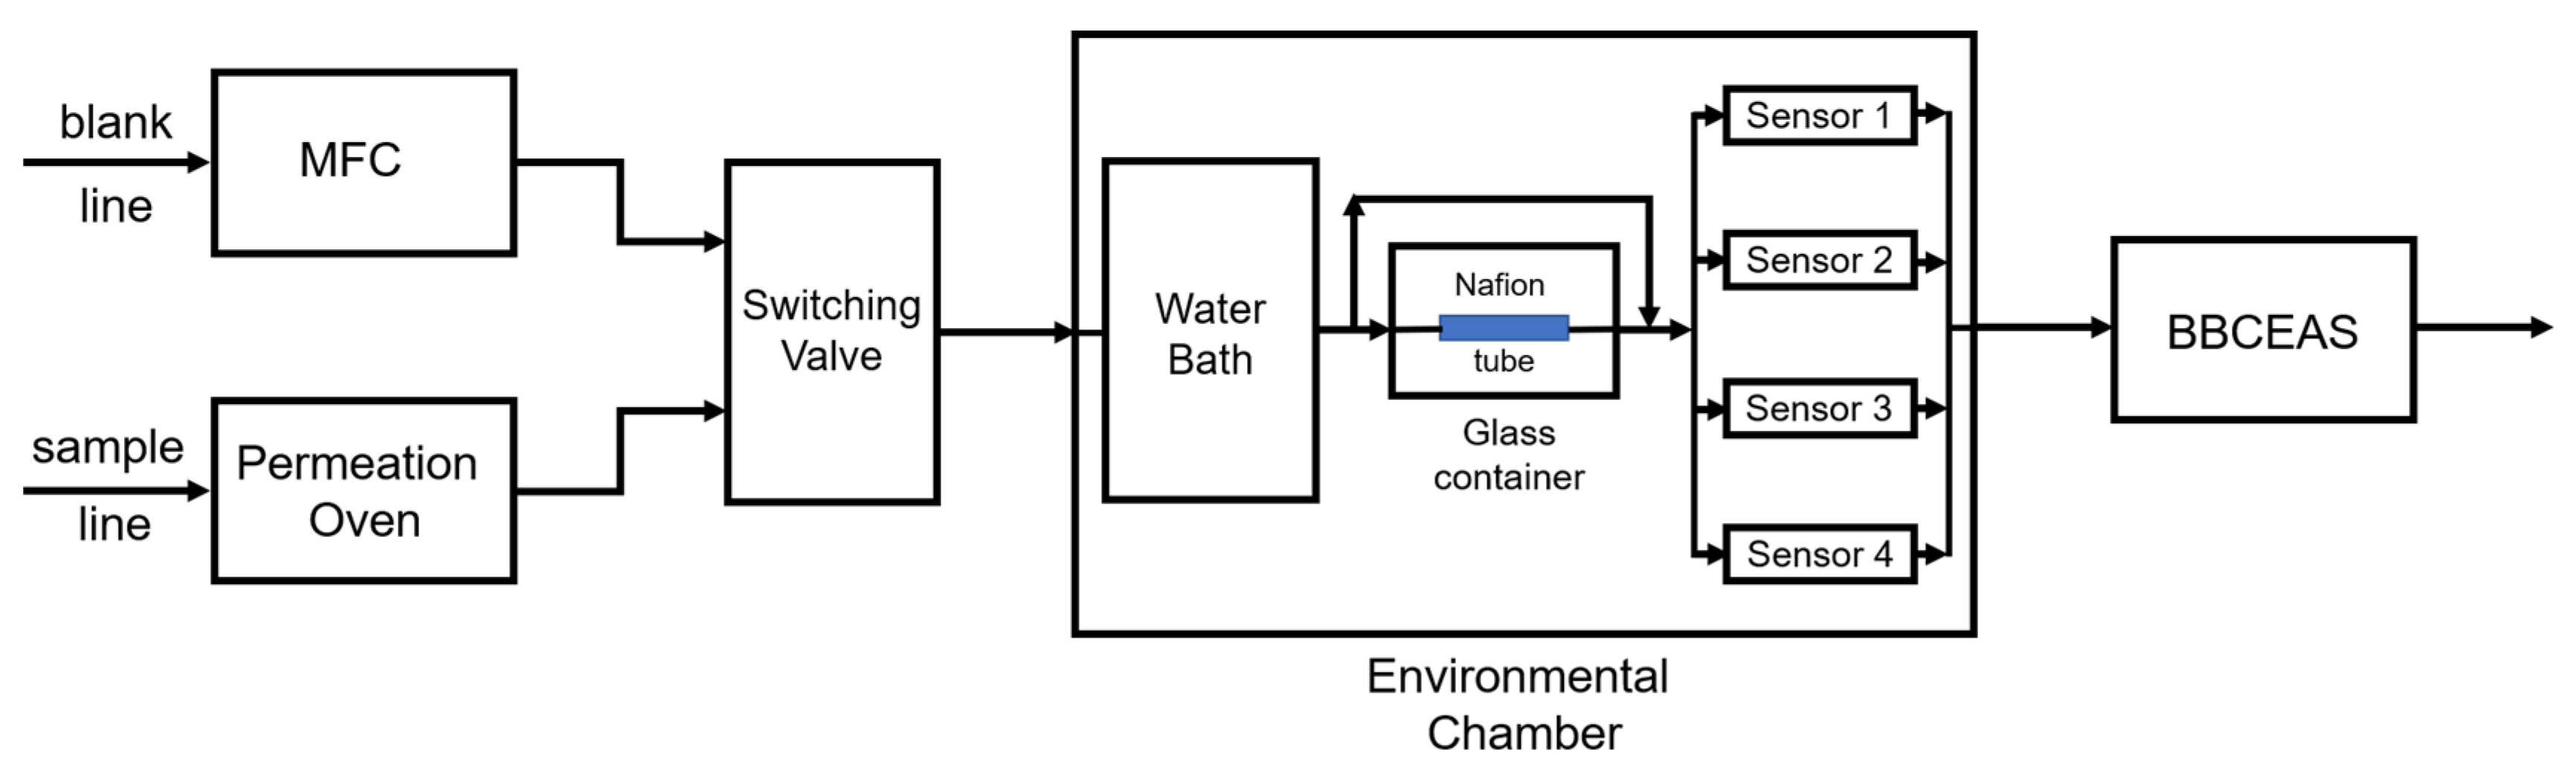
2.3. Laboratory Evaluation System
2.4. Experimental Design
- Concentration-only tests
- b.
- Effects of temperature and RH
2.5. Data Analysis
- Linear regression (LR) model
- b.
- Multiple linear regression model
2.6. Sensor Performance Metrics
- Linearity of response
- b.
- Limit of detection
- c.
- Sensor accuracy
- d.
- Sensor repeatability
- e.
- Response time
- f.
- Inter-sensor variability
2.7. Preliminary Cross-Sensitivity Tests
3. Results and Discussion
3.1. Concentration-Only Tests
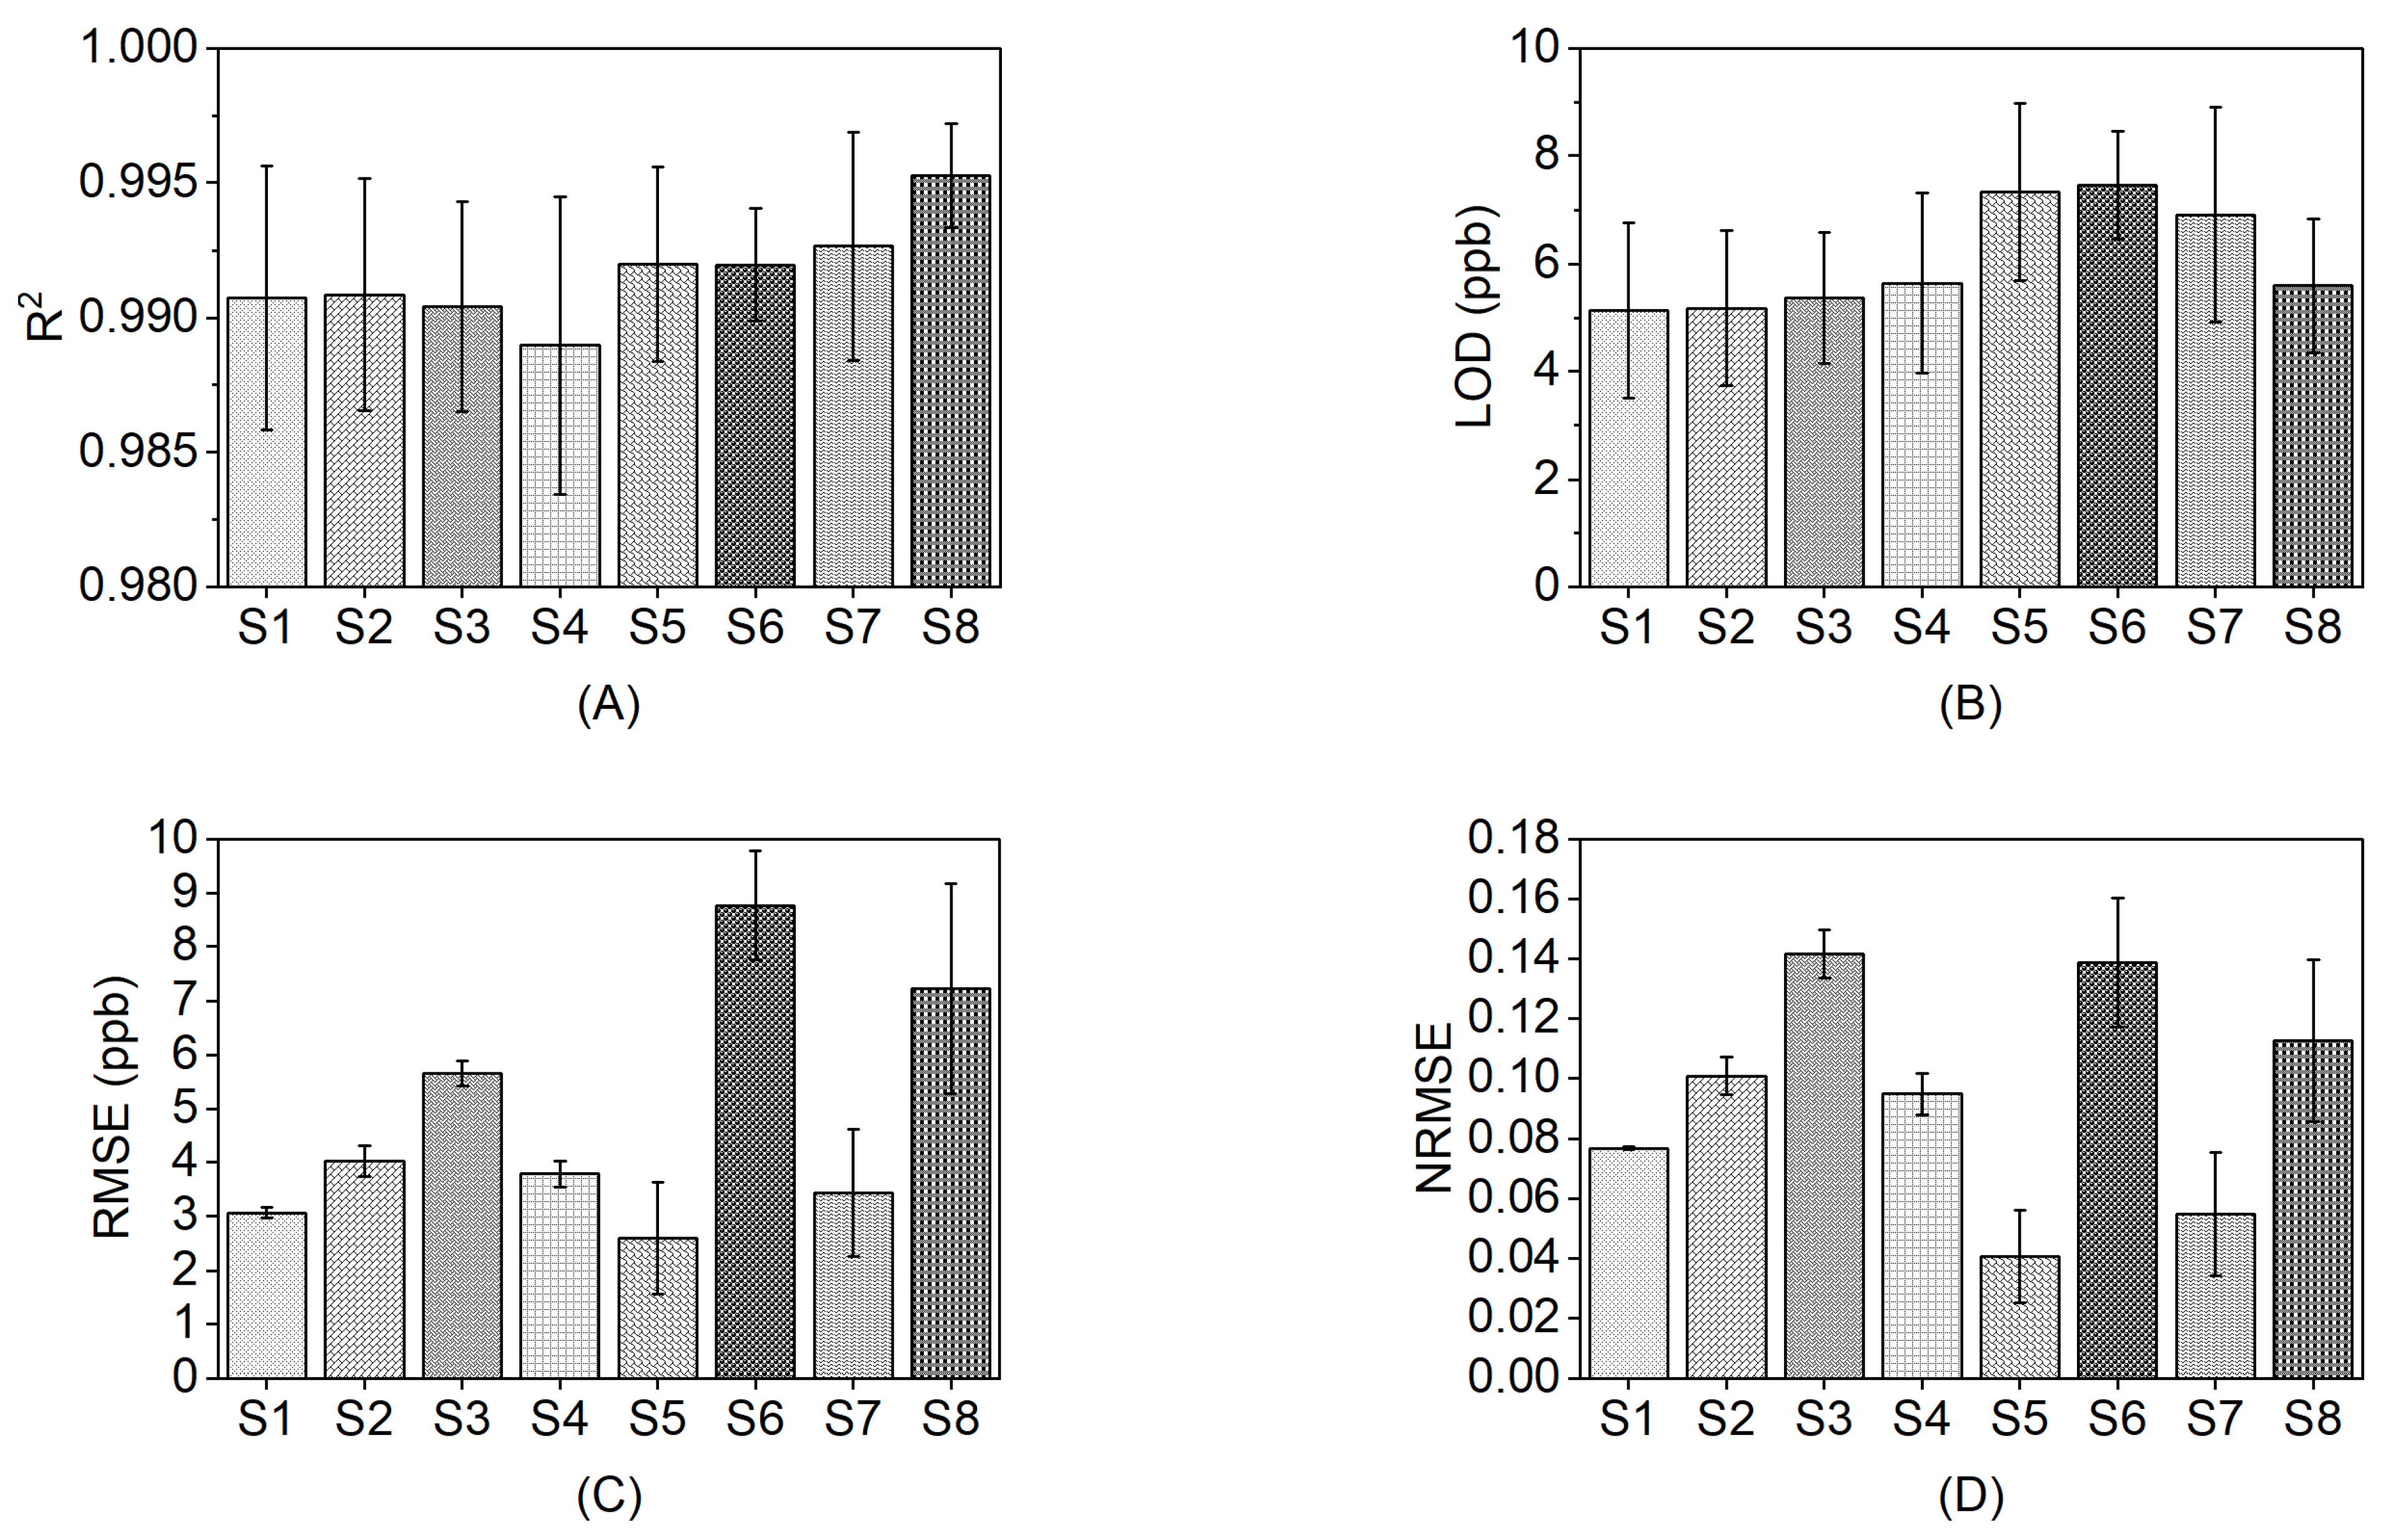
- Linearity of response
- b.
- Limit of detection
- c.
- Sensor accuracy
- d.
- Sensor repeatability
- e.
- Response time
- f.
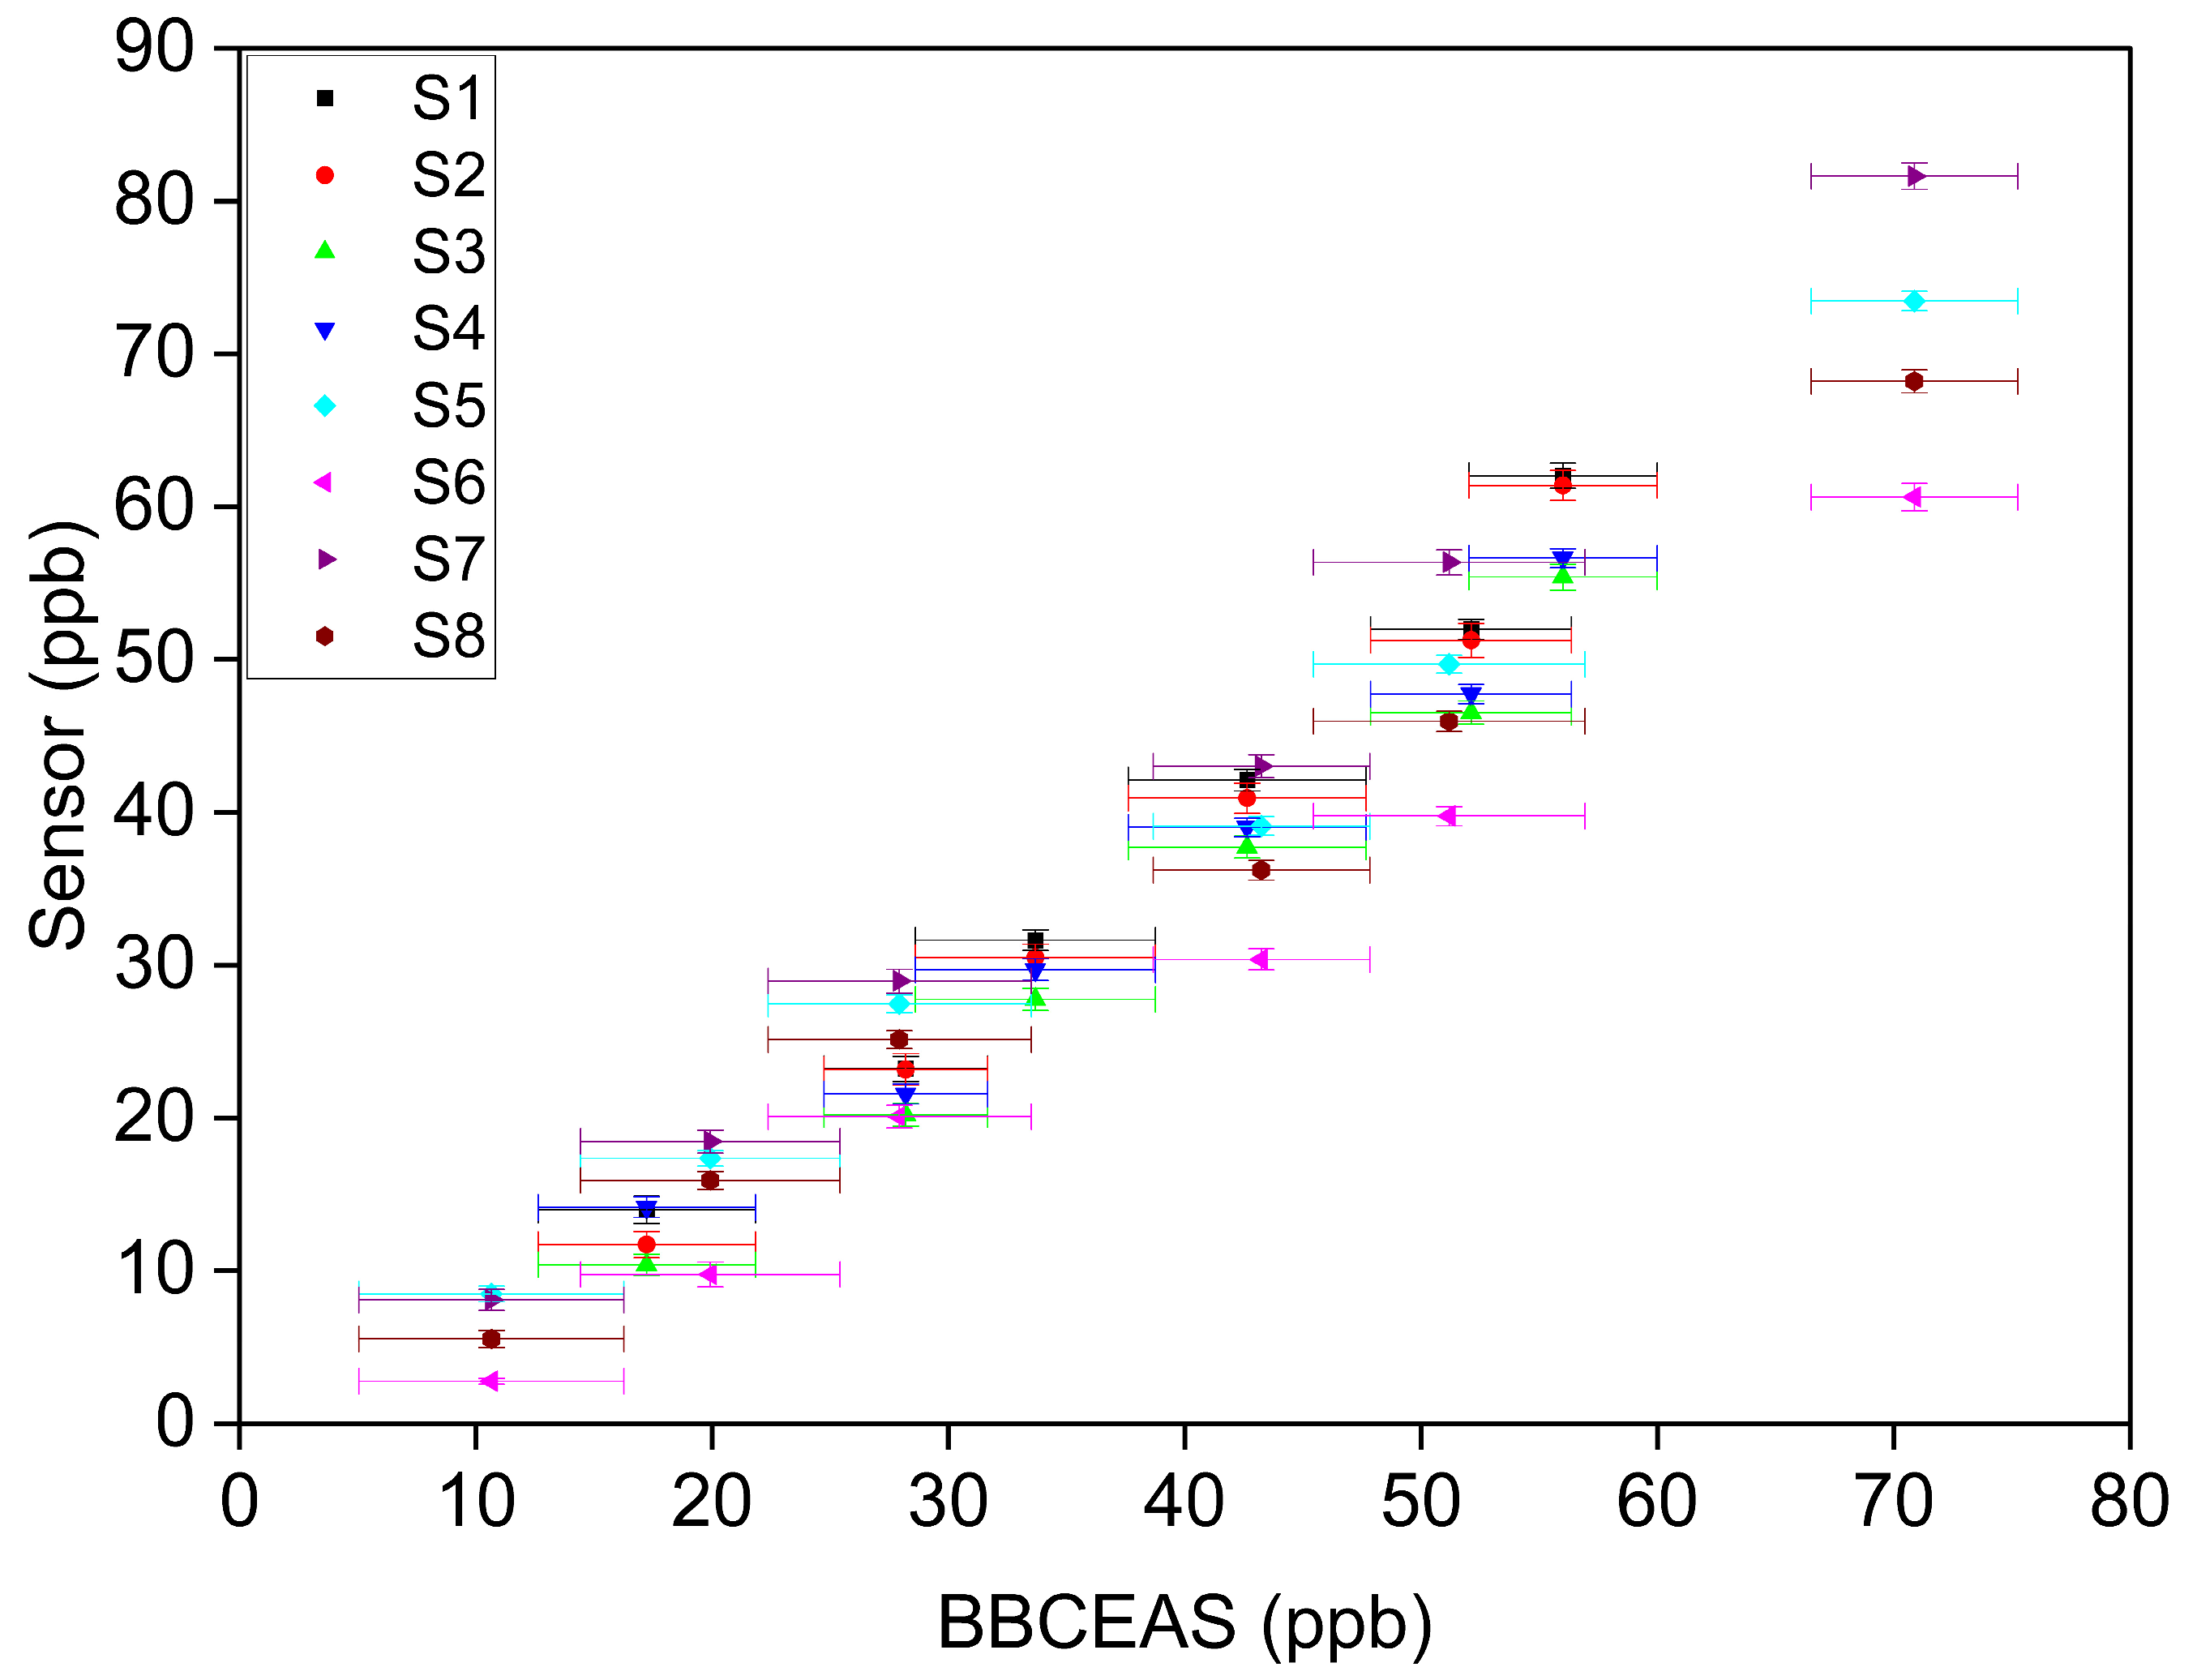
- Inter-sensor variability
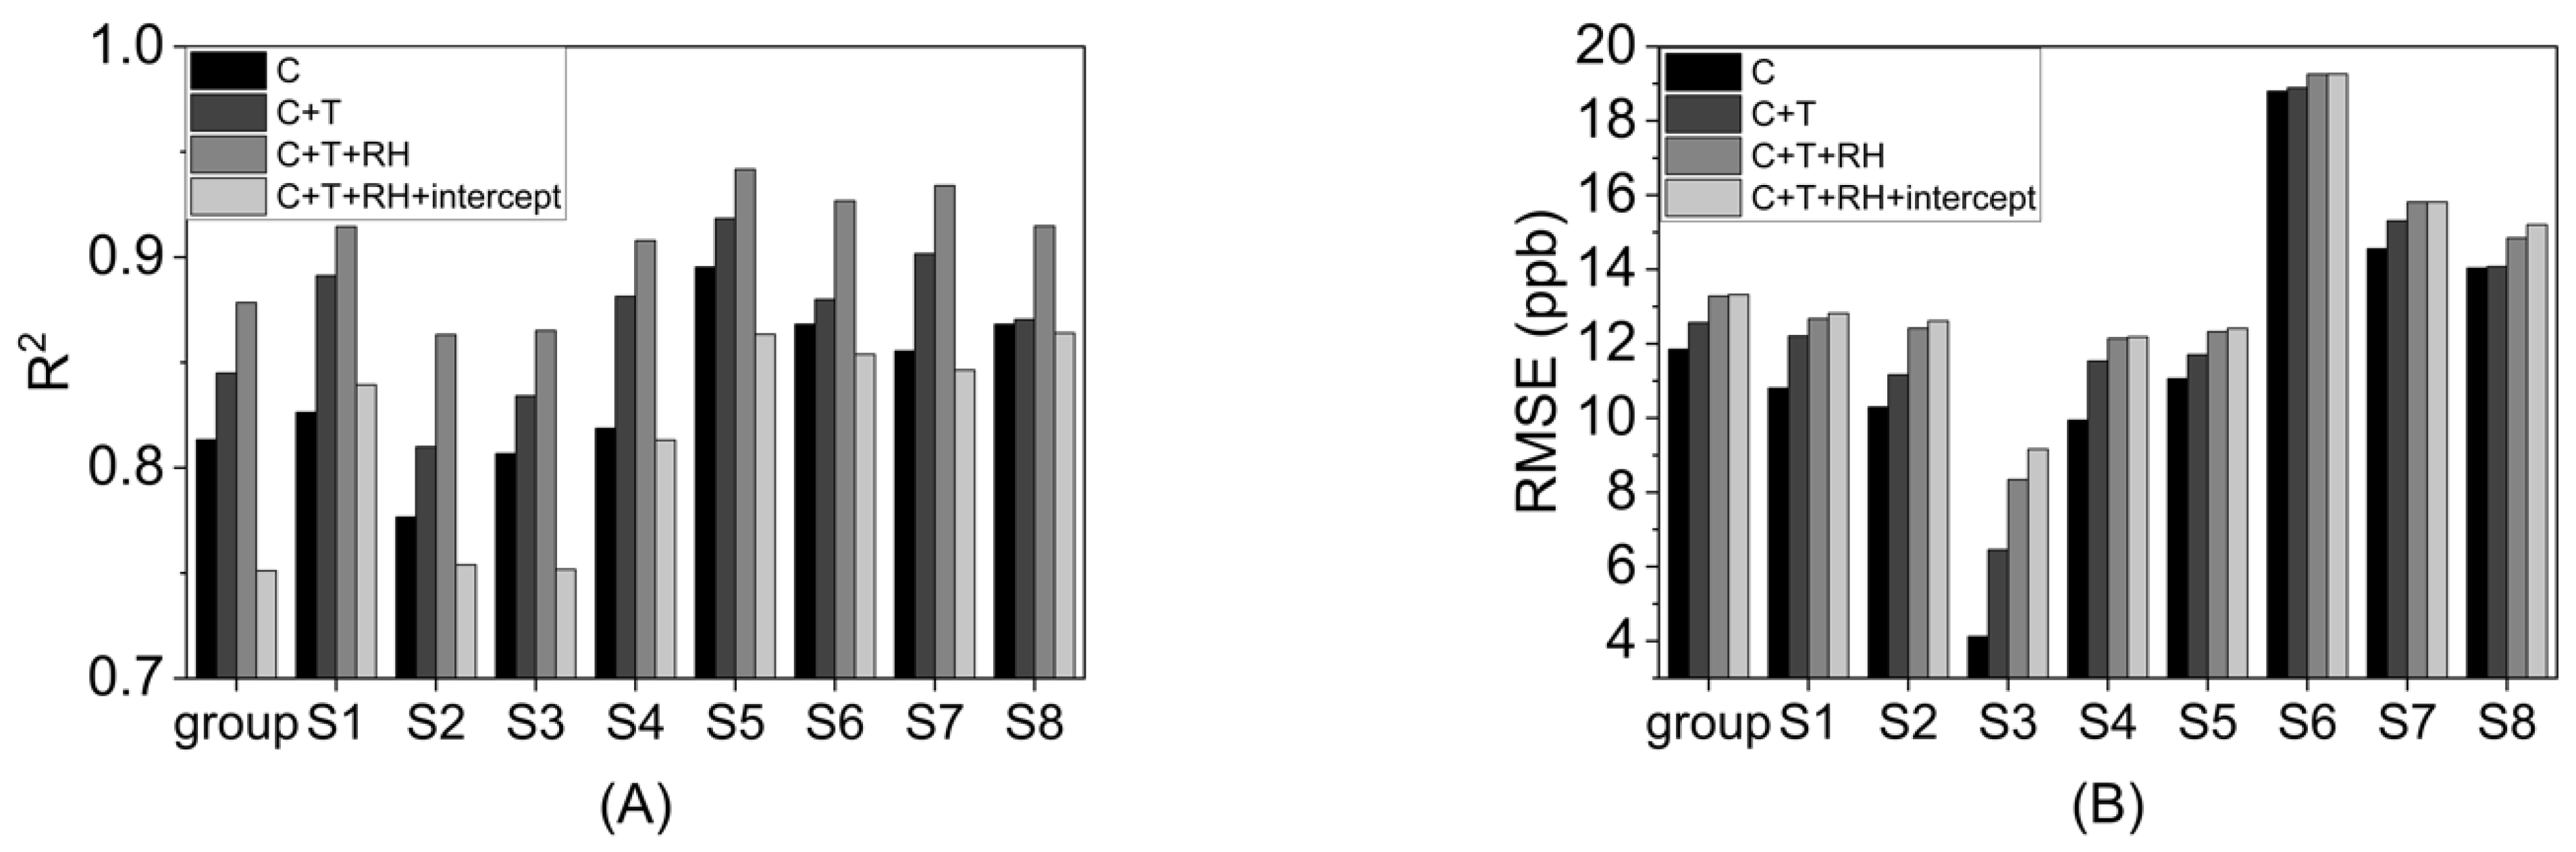
3.2. Environmental Simulation Tests
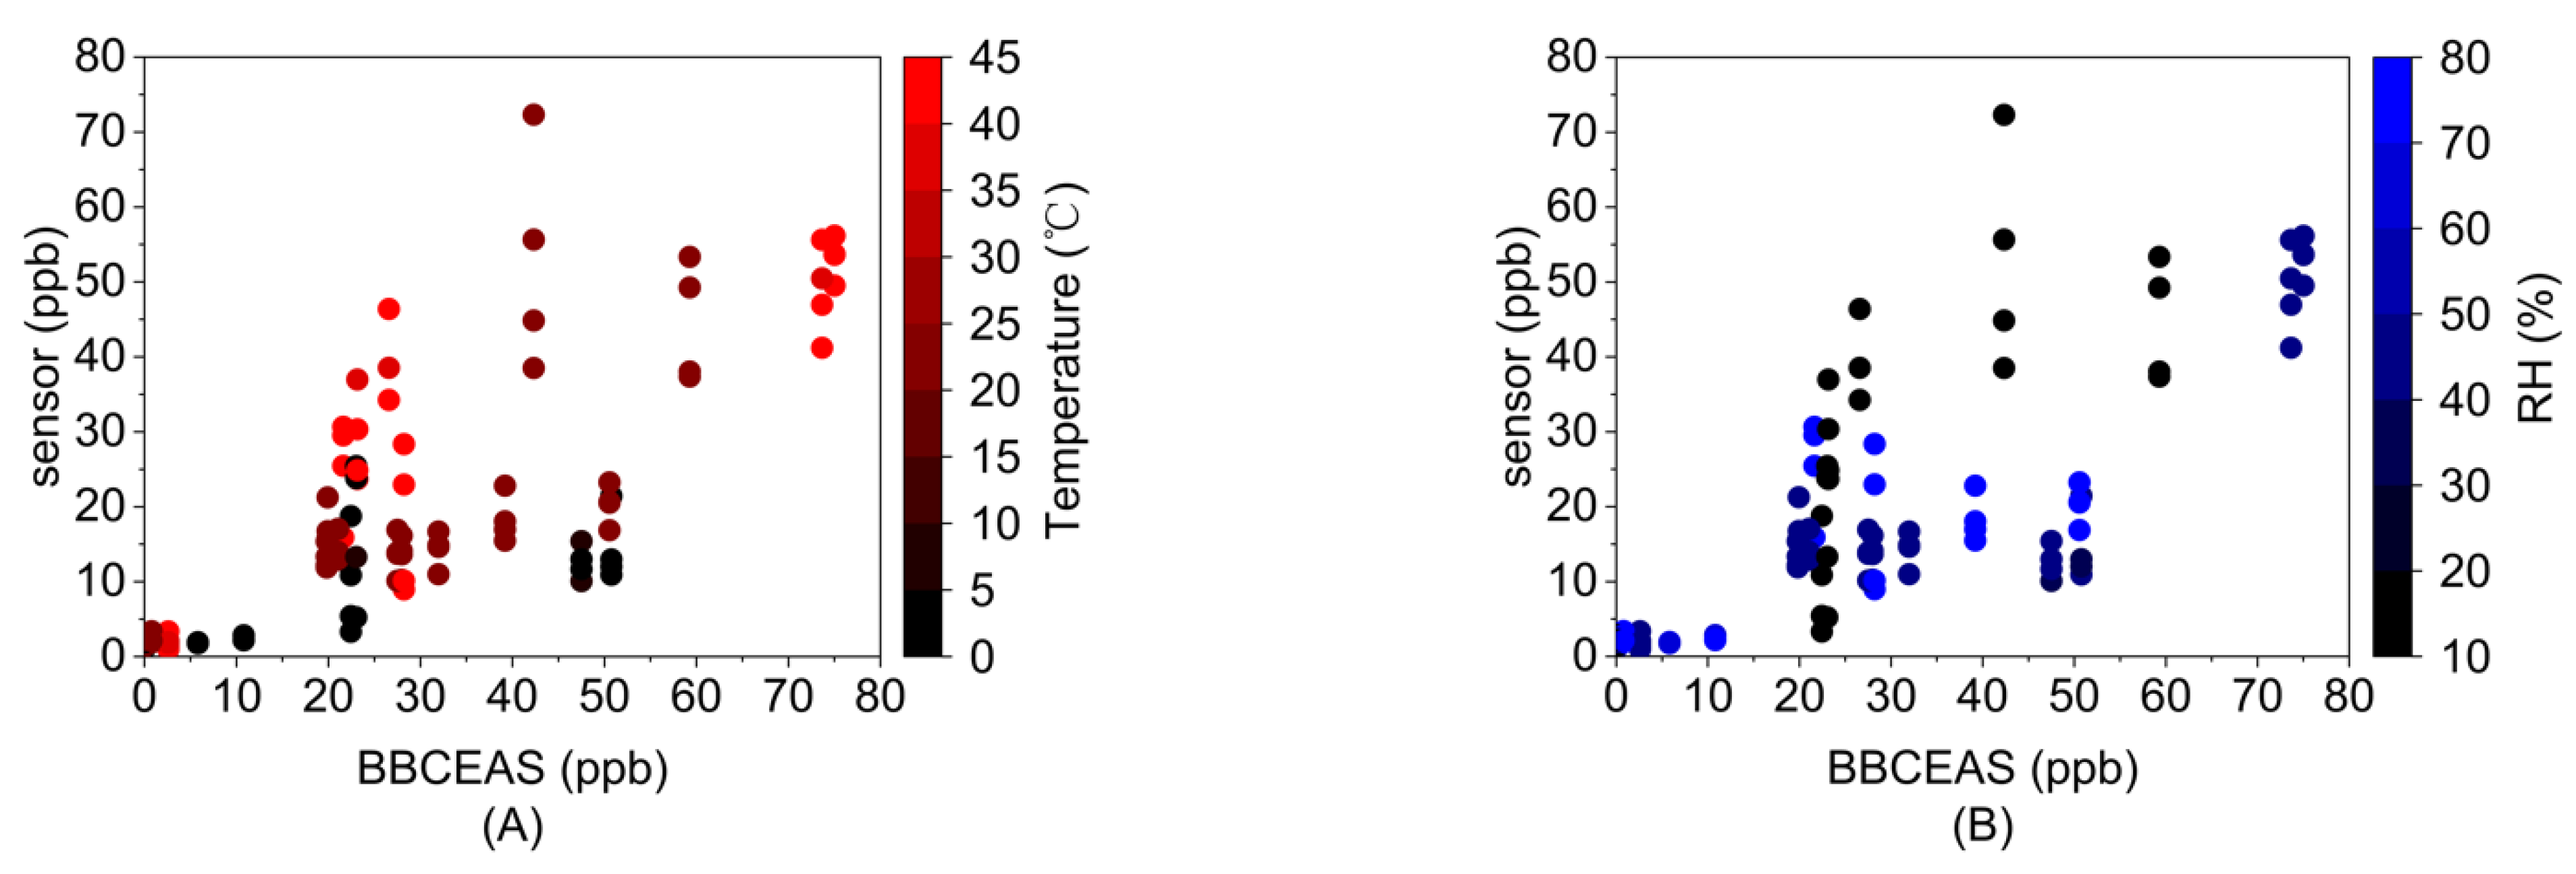
- Sensor response to temperature and RH
- b.
- Effects of RH
3.3. Preliminary Cross-Sensitivity Tests
3.4. Limitations
4. Conclusions
Supplementary Materials
Author Contributions
Funding
Institutional Review Board Statement
Informed Consent Statement
Data Availability Statement
Conflicts of Interest
References
- Hak, C.; Pundt, I.; Trick, S.; Kern, C.; Platt, U.; Dommen, J.; Ordóñez, C.; Prévôt, A.S.H.; Junkermann, W.; Astorga-Lloréns, C.; et al. Intercomparison of Four Different In-Situ Techniques for Ambient Formaldehyde Measurements in Urban Air. Atmos. Chem. Phys. 2005, 5, 2881–2900. [Google Scholar] [CrossRef]
- McLaughlin, J.K. Formaldehyde and Cancer: A Critical Review. Int. Arch. Occup. Environ. Health 1994, 66, 295–301. [Google Scholar] [CrossRef]
- Nielsen, G.D.; Wolkoff, P. Cancer Effects of Formaldehyde: A Proposal for an Indoor Air Guideline Value. Arch. Toxicol. 2010, 84, 423–446. [Google Scholar] [CrossRef]
- EPA, U.S. Summary of Results for the 2005 National—Scale Assessment; U.S. Environmental Protection Agency: Washington, DC, USA, 2012; pp. 1–7.
- Initial List of Hazardous Air Pollutants with Modifications | US EPA. Available online: https://www.epa.gov/haps/initial-list-hazardous-air-pollutants-modifications (accessed on 17 August 2023).
- Ailshire, J.A.; Crimmins, E.M. Fine Particulate Matter Air Pollution and Cognitive Function among Older US Adults. Am. J. Epidemiol. 2014, 180, 359–366. [Google Scholar] [CrossRef]
- Beard, J.D.; Beck, C.; Graham, R.; Packham, S.C.; Traphagan, M.; Giles, R.T.; Morgan, J.G. Winter Temperature Inversions and Emergency Department Visits for Asthma in Salt Lake County, Utah, 2003–2008. Environ. Health Perspect. 2012, 120, 1385–1390. [Google Scholar] [CrossRef]
- Weinmayr, G.; Romeo, E.; de Sario, M.; Weiland, S.K.; Forastiere, F. Short-Term Effects of PM10 and NO2 on Respiratory Health among Children with Asthma or Asthma-like Symptoms: A Systematic Review and Meta-Analysis. Environ. Health Perspect. 2010, 118, 449–457. [Google Scholar] [CrossRef]
- Zhu, L.; Jacob, D.J.; Keutsch, F.N.; Mickley, L.J.; Scheffe, R.; Strum, M.; González Abad, G.; Chance, K.; Yang, K.; Rappenglück, B.; et al. Formaldehyde (HCHO) As a Hazardous Air Pollutant: Mapping Surface Air Concentrations from Satellite and Inferring Cancer Risks in the United States. Environ. Sci. Technol. 2017, 51, 5650–5657. [Google Scholar] [CrossRef] [PubMed]
- Król, S.; Zabiegała, B.; Namieśnik, J. Monitoring VOCs in Atmospheric Air I. On-Line Gas Analyzers. Trends Anal. Chem. 2010, 29, 1092–1100. [Google Scholar] [CrossRef]
- Suzuki, Y.; Nakano, N.; Suzuki, K. Portable Sick House Syndrome Gas Monitoring System Based on Novel Colorimetric Reagents for the Highly Selective and Sensitive Detection of Formaldehyde. Environ. Sci. Technol. 2003, 37, 5695–5700. [Google Scholar] [CrossRef] [PubMed]
- Chang, C.Y.; Cheng, Y.H.; Ho, C.Y. Surface Engineering of a Triboelectric Nanogenerator for Room Temperature High-Performance Self-Powered Formaldehyde Sensors. J. Mater. Chem. A Mater. 2022, 10, 22373–22389. [Google Scholar] [CrossRef]
- Lou, C.; Lei, G.; Liu, X.; Xie, J.; Li, Z.; Zheng, W.; Goel, N.; Kumar, M.; Zhang, J. Design and Optimization Strategies of Metal Oxide Semiconductor Nanostructures for Advanced Formaldehyde Sensors. Coord. Chem. Rev. 2022, 452, 214280. [Google Scholar] [CrossRef]
- Shooshtari, M.; Vollebregt, S.; Vaseghi, Y.; Rajati, M.; Pahlavan, S. The Sensitivity Enhancement of TiO2-Based VOCs Sensor Decorated by Gold at Room Temperature. Nanotechnology 2023, 34, 255501. [Google Scholar] [CrossRef] [PubMed]
- Sayahi, T.; Garff, A.; Quah, T.; Lê, K.; Becnel, T.; Powell, K.M.; Gaillardon, P.E.; Butterfield, A.E.; Kelly, K.E. Long-Term Calibration Models to Estimate Ozone Concentrations with a Metal Oxide Sensor. Environ. Pollut. 2020, 267, 115363. [Google Scholar] [CrossRef]
- Kang, Y.; Aye, L.; Ngo, T.D.; Zhou, J. Performance Evaluation of Low-Cost Air Quality Sensors: A Review. Sci. Total Environ. 2022, 818, 151769. [Google Scholar] [CrossRef] [PubMed]
- Collier-Oxandale, A.M.; Thorson, J.; Halliday, H.; Milford, J.; Hannigan, M. Understanding the Ability of Low-Cost MOx Sensors to Quantify Ambient VOCs. Atmos. Meas. Tech. 2019, 12, 1441–1460. [Google Scholar] [CrossRef]
- Karagulian, F.; Barbiere, M.; Kotsev, A.; Spinelle, L.; Gerboles, M.; Lagler, F.; Redon, N.; Crunaire, S.; Borowiak, A. Review of the Performance of Low-Cost Sensors for Air Quality Monitoring. Atmosphere 2019, 10, 506. [Google Scholar] [CrossRef]
- Castell, N.; Dauge, F.R.; Schneider, P.; Vogt, M.; Lerner, U.; Fishbain, B.; Broday, D.; Bartonova, A. Can Commercial Low-Cost Sensor Platforms Contribute to Air Quality Monitoring and Exposure Estimates? Environ. Int. 2017, 99, 293–302. [Google Scholar] [CrossRef]
- Chung, P.R.; Tzeng, C.T.; Ke, M.T.; Lee, C.Y. Formaldehyde Gas Sensors: A Review. Sensors 2013, 13, 4468–4484. [Google Scholar] [CrossRef]
- Nikolic, M.V.; Milovanovic, V.; Vasiljevic, Z.Z.; Stamenkovic, Z. Semiconductor Gas Sensors: Materials, Technology, Design, and Application. Sensors 2020, 20, 6694. [Google Scholar] [CrossRef]
- Wang, C.; Yin, L.; Zhang, L.; Xiang, D.; Gao, R. Metal Oxide Gas Sensors: Sensitivity and Influencing Factors. Sensors 2010, 10, 2088–2106. [Google Scholar] [CrossRef]
- Dhall, S.; Mehta, B.R.; Tyagi, A.K.; Sood, K. A Review on Environmental Gas Sensors: Materials and Technologies. Sens. Int. 2021, 2, 100116. [Google Scholar] [CrossRef]
- Sun, L.; Wong, K.C.; Wei, P.; Ye, S.; Huang, H.; Yang, F.; Westerdahl, D.; Louie, P.K.K.; Luk, C.W.Y.; Ning, Z. Development and Application of a next Generation Air Sensor Network for the Hong Kong Marathon 2015 Air Quality Monitoring. Sensors 2016, 16, 211. [Google Scholar] [CrossRef]
- Cross, E.S.; Williams, L.R.; Lewis, D.K.; Magoon, G.R.; Onasch, T.B.; Kaminsky, M.L.; Worsnop, D.R.; Jayne, J.T. Use of Electrochemical Sensors for Measurement of Air Pollution: Correcting Interference Response and Validating Measurements. Atmos. Meas. Tech. 2017, 10, 3575–3588. [Google Scholar] [CrossRef]
- Chattopadhyay, A.; Huertas, A.; Rebeiro-Hargrave, A.; Fung, P.L.; Varjonen, S.; Hieta, T.; Tarkoma, S.; Petaja, T. Low-Cost Formaldehyde Sensor Evaluation and Calibration in a Controlled Environment. IEEE Sens. J. 2022, 22, 11791–11802. [Google Scholar] [CrossRef]
- Deng, H.; Li, H.-R.; Wang, F.; Yuan, C.-X.; Liu, S.; Wang, P.; Xie, L.-Z.; Sun, Y.-Z.; Chang, F.Z. A High Sensitive and Low Detection Limit of Formaldehyde Gas Sensor Based on Hierarchical Flower-like CuO Nanostructure Fabricated by Sol–Gel Method. J. Mater. Sci. Mater. Electron. 2016, 27, 6766–6772. [Google Scholar] [CrossRef]
- Gautam, V.; Kumar, A.; Nagpal, S.; Jain, V.K. Ultrasensitive Detection of Formaldehyde at Room Temperature Using Si-Chip Assisted MOS/SiNWs Nanocomposite Based Sensor. J. Alloys Compd. 2022, 919, 165840. [Google Scholar] [CrossRef]
- Li, Y.; Chen, N.; Deng, D.; Xing, X.; Xiao, X.; Wang, Y. Formaldehyde Detection: SnO2 Microspheres for Formaldehyde Gas Sensor with High Sensitivity, Fast Response/Recovery and Good Selectivity. Sens. Actuators B Chem. 2017, 238, 264–273. [Google Scholar] [CrossRef]
- Hu, J.; Chen, X.; Zhang, Y. Batch Fabrication of Formaldehyde Sensors Based on LaFeO3 Thin Film with Ppb-Level Detection Limit. Sens. Actuators B Chem. 2021, 349, 130738. [Google Scholar] [CrossRef]
- Hun, D.E.; Corsi, R.L.; Morandi, M.T.; Siegel, J.A. Formaldehyde in Residences: Long-Term Indoor Concentrations and Influencing Factors. Indoor Air 2010, 20, 196–203. [Google Scholar] [CrossRef]
- Weisel, C.P.; Zhang, J.; Turpin, B.J.; Morandi, M.T.; Colome, S.; Stock, T.H.; Spektor, D.M.; Korn, L.; Winer, A.; Alimokhtari, S.; et al. Relationship of Indoor, Outdoor and Personal Air (RIOPA) Study: Study Design, Methods and Quality Assurance/Control Results. J. Expo. Anal. Environ. Epidemiol. 2005, 15, 123–137. [Google Scholar] [CrossRef]
- Ouyang, B. First-Principles Algorithm for Air Quality Electrochemical Gas Sensors. ACS Sens. 2020, 5, 2742–2746. [Google Scholar] [CrossRef] [PubMed]
- Farquhar, A.K.; Henshaw, G.S.; Williams, D.E. Understanding and Correcting Unwanted Influences on the Signal from Electrochemical Gas Sensors. ACS Sens. 2021, 6, 1295–1304. [Google Scholar] [CrossRef] [PubMed]
- Wei, P.; Ning, Z.; Ye, S.; Sun, L.; Yang, F.; Wong, K.C.; Westerdahl, D.; Louie, P.K.K. Impact Analysis of Temperature and Humidity Conditions on Electrochemical Sensor Response in Ambient Air Quality Monitoring. Sensors 2018, 18, 59. [Google Scholar] [CrossRef]
- Hitchman, M.L.; Saffell, J.R. Considerations of Thermodynamics and Kinetics for the Effects of Relative Humidity on the Electrolyte in Electrochemical Toxic Gas Sensors. ACS Sens. 2021, 6, 3985–3993. [Google Scholar] [CrossRef] [PubMed]
- Justo Alonso, M.; Madsen, H.; Liu, P.; Jørgensen, R.B.; Jørgensen, T.B.; Christiansen, E.J.; Myrvang, O.A.; Bastien, D.; Mathisen, H.M. Evaluation of Low-Cost Formaldehyde Sensors Calibration. Build. Environ. 2022, 222, 109380. [Google Scholar] [CrossRef]
- Alolaywi, H.Y.; Duanghathaipornsuk, S.; Kim, S.S.; Li, C.-H.; Jinschek, J.R.; Kim, D.-S.; Alba-Rubio, A.C. Electrochemical MoOx/Carbon Nanocomposite-Based Gas Sensor for Formaldehyde Detection at Room Temperature. J. Electrochem. Soc. 2021, 168, 067525. [Google Scholar] [CrossRef]
- Descamps, M.N.; Bordy, T.; Hue, J.; Mariano, S.; Nonglaton, G.; Schultz, E.; Tran-Thi, T.H.; Vignoud-Despond, S. Real-Time Detection of Formaldehyde by a Sensor. Sens. Actuators B Chem. 2012, 170, 104–108. [Google Scholar] [CrossRef]
- Song, Y.; Zhang, Y.; Ma, M.; Ren, J.; Liu, C.; Tan, J. Visible Light-Assisted Formaldehyde Sensor Based on HoFeO3 Nanoparticles with Sub-Ppm Detection Limit. Ceram. Int. 2020, 46, 16337–16344. [Google Scholar] [CrossRef]
- Washenfelder, R.A.; Attwood, A.R.; Flores, J.M.; Zarzana, K.J.; Rudich, Y.; Brown, S.S. Broadband Cavity-Enhanced Absorption Spectroscopy in the Ultraviolet Spectral Region for Measurements of Nitrogen Dioxide and Formaldehyde. Atmos. Meas. Tech. 2016, 9, 41–52. [Google Scholar] [CrossRef]
- Bhardwaj, N.; Kelsch, A.; Eatough, D.J.; Thalman, R.; Daher, N.; Kelly, K.; Jaramillo, I.C.; Hansen, J.C. Sources of Formaldehyde in Bountiful, Utah. Atmosphere 2021, 12, 375. [Google Scholar] [CrossRef]
- Meller, R.; Moortgat, G.K. Temperature Dependence of the Absorption Cross Sections of Formaldehyde between 223 and 323 K in the Wavelength Range 225-375 Nm. J. Geophys. Res. Atmos. 2000, 105, 7089–7101. [Google Scholar] [CrossRef]
- Clements, A.; Duvall, R.; Green, D.; Dye, T. Enhanced Air Sensor Guidebook; U.S. Environmental Protection Agency: Washington, DC, USA, 2022.
- Shrivastava, A.; Gupta, V. Methods for the Determination of Limit of Detection and Limit of Quantitation of the Analytical Methods. Chron. Young Sci. 2011, 2, 21. [Google Scholar] [CrossRef]
- Spinelle, L.; Aleixandre, M.; Gerboles, M. Protocol of Evaluation and Calibration of Low-Cost Gas Sensors for the Monitoring of Air Pollution; Publications Office of the European Union: Luxembourg, 2013.
- Cicchetti, D.V. Guidelines, Criteria, and Rules of Thumb for Evaluating Normed and Standardized Assessment Instruments in Psychology. Psychol. Assess. 1994, 6, 284–290. [Google Scholar] [CrossRef]
- Liljequist, D.; Elfving, B.; Roaldsen, K.S. Intraclass Correlation—A Discussion and Demonstration of Basic Features. PloS ONE 2019, 14, e0219854. [Google Scholar] [CrossRef] [PubMed]
- Koo, T.K.; Li, M.Y. A Guideline of Selecting and Reporting Intraclass Correlation Coefficients for Reliability Research. J. Chiropr. Med. 2016, 15, 155–163. [Google Scholar] [CrossRef]
- Mead, M.I.; Popoola, O.A.M.; Stewart, G.B.; Landshoff, P.; Calleja, M.; Hayes, M.; Baldovi, J.J.; McLeod, M.W.; Hodgson, T.F.; Dicks, J.; et al. The Use of Electrochemical Sensors for Monitoring Urban Air Quality in Low-Cost, High-Density Networks. Atmos. Environ. 2013, 70, 186–203. [Google Scholar] [CrossRef]
- Lewis, A.C.; Lee, J.D.; Edwards, P.M.; Shaw, M.D.; Evans, M.J.; Moller, S.J.; Smith, K.R.; Buckley, J.W.; Ellis, M.; Gillot, S.R.; et al. Evaluating the Performance of Low Cost Chemical Sensors for Air Pollution Research. Faraday Discuss. 2016, 189, 85–103. [Google Scholar] [CrossRef]
- NAAQS Table | US EPA. Available online: https://www.epa.gov/criteria-air-pollutants/naaqs-table (accessed on 19 August 2023).
- Yang, Z.; Cao, W.; Peng, C.; Wang, T.; Li, B.; Ma, H.; Su, Y.; Zhou, Z.; Yang, J.; Zeng, M. Construction, Application and Verification of a Novel Formaldehyde Gas Sensor System Based on Ni-Doped SnO2Nanoparticles. IEEE Sens. J. 2021, 21, 11023–11030. [Google Scholar] [CrossRef]
- Myers, G.E.; Nagaoka, M. Environmental Protection Agency EPA Hazard Summary. In Formaldehyde; U.S. Environmental Protection Agency: Washington, DC, USA, 2000. [Google Scholar]
- Parrish, D.D.; Ryerson, T.B.; Mellqvist, J.; Johansson, J.; Fried, A.; Richter, D.; Walega, J.G.; Washenfelder, R.A.; De Gouw, J.A.; Peischl, J.; et al. Primary and Secondary Sources of Formaldehyde in Urban Atmospheres: Houston Texas Region. Atmos. Chem. Phys. 2012, 12, 3273–3288. [Google Scholar] [CrossRef]
- Duvall, R.M.; Clements, A.L.; Hagler, G.; Kamal, A.; Kilaru, V.; Goodman, L.; Frederick, S.; Barkjohn, K.K.; VonWald, I.; Greene, D.; et al. Performance Testing Protocols, Metrics, and Target Values for Ozone Air Sensors; EPA/600/R-20/279, 2021; U.S. EPA Office of Research and Development: Washington, DC, USA, 2021.
- Duvall, R.M.; Clements, A.L.; Hagler, G.; Kamal, A.; Kilaru, V.; Goodman, L.; Frederick, S.; Barkjohn, K.K.; VonWald, I.; Greene, D.; et al. Performance Testing Protocols, Metrics, and Target Values for Fine Particulate Matter Air Sensors: Use in Ambient, Outdoor, Fixed Site, Non-Regulatory Supplemental and Informational Monitoring Applications; EPA/600/R-20/280, 2021; U.S. EPA Office of Research and Development: Washington, DC, USA, 2021.
- Song, H.; Ma, L.; Pei, S.; Dong, C.; Zhu, E.; Zhang, B. Quantitative Detection of Formaldehyde and Ammonia Using a Yttrium-Doped ZnO Sensor Array Combined with a Back-Propagation Neural Network Model. Sens. Actuators A Phys. 2021, 331, 112940. [Google Scholar] [CrossRef]
- Li, X.; Li, X.; Wang, J.; Lin, S. Highly Sensitive and Selective Roomerature Formaldehyde Sensors Using Hollow TiO2 Microspheres. Sens. Actuators B Chem. 2015, 219, 158–163. [Google Scholar] [CrossRef]
- Chen, D.; Yuan, Y.J. Thin-Film Sensors for Detection of Formaldehyde: A Review. IEEE Sens. J. 2015, 15, 6749–6760. [Google Scholar] [CrossRef]
- Hitchman, M.L.; Cade, N.J.; Kim Gibbs, T.; Hedley, N.J.M. Study of the Factors Affecting Mass Transport in Electrochemical Gas Sensors. Analyst 1997, 122, 1411–1417. [Google Scholar] [CrossRef]


| Test No. | Target Concentration * (ppb) | Target Temperature * (°C) | Target RH * (%) |
|---|---|---|---|
| 1 | 25 | 0 | 15 |
| 2 | 25 | 40 | 15 |
| 3 | 25 | 0 | 75 |
| 4 | 25 | 40 | 75 |
| 5 | 0 | 0 | 45 |
| 6 | 0 | 40 | 45 |
| 7 | 50 | 0 | 45 |
| 8 | 50 | 40 | 45 |
| 9 | 0 | 20 | 15 |
| 10 | 0 | 20 | 75 |
| 11 | 50 | 20 | 15 |
| 12 | 50 | 20 | 75 |
| 13 | 25 | 20 | 45 |
| 14 | 25 | 20 | 45 |
| 15 | 25 | 20 | 45 |
| Metrics | Average | Standard Deviation |
|---|---|---|
| R2 | 0.964 | 0.012 |
| LOD (ppb) | 11.3 | 2.07 |
| RMSE (ppb) | 3.96 | 0.33 |
| NRMSE% | 6.23 | 0.33 |
Disclaimer/Publisher’s Note: The statements, opinions and data contained in all publications are solely those of the individual author(s) and contributor(s) and not of MDPI and/or the editor(s). MDPI and/or the editor(s) disclaim responsibility for any injury to people or property resulting from any ideas, methods, instructions or products referred to in the content. |
© 2023 by the authors. Licensee MDPI, Basel, Switzerland. This article is an open access article distributed under the terms and conditions of the Creative Commons Attribution (CC BY) license (https://creativecommons.org/licenses/by/4.0/).
Share and Cite
Pei, Z.; Balitskiy, M.; Thalman, R.; Kelly, K.E. Laboratory Performance Evaluation of a Low-Cost Electrochemical Formaldehyde Sensor. Sensors 2023, 23, 7444. https://doi.org/10.3390/s23177444
Pei Z, Balitskiy M, Thalman R, Kelly KE. Laboratory Performance Evaluation of a Low-Cost Electrochemical Formaldehyde Sensor. Sensors. 2023; 23(17):7444. https://doi.org/10.3390/s23177444
Chicago/Turabian StylePei, Zheyuan, Maxim Balitskiy, Ryan Thalman, and Kerry E. Kelly. 2023. "Laboratory Performance Evaluation of a Low-Cost Electrochemical Formaldehyde Sensor" Sensors 23, no. 17: 7444. https://doi.org/10.3390/s23177444
APA StylePei, Z., Balitskiy, M., Thalman, R., & Kelly, K. E. (2023). Laboratory Performance Evaluation of a Low-Cost Electrochemical Formaldehyde Sensor. Sensors, 23(17), 7444. https://doi.org/10.3390/s23177444