
One-Stage Brake Light Status Detection Based on YOLOv8


Abstract
:1. Introduction
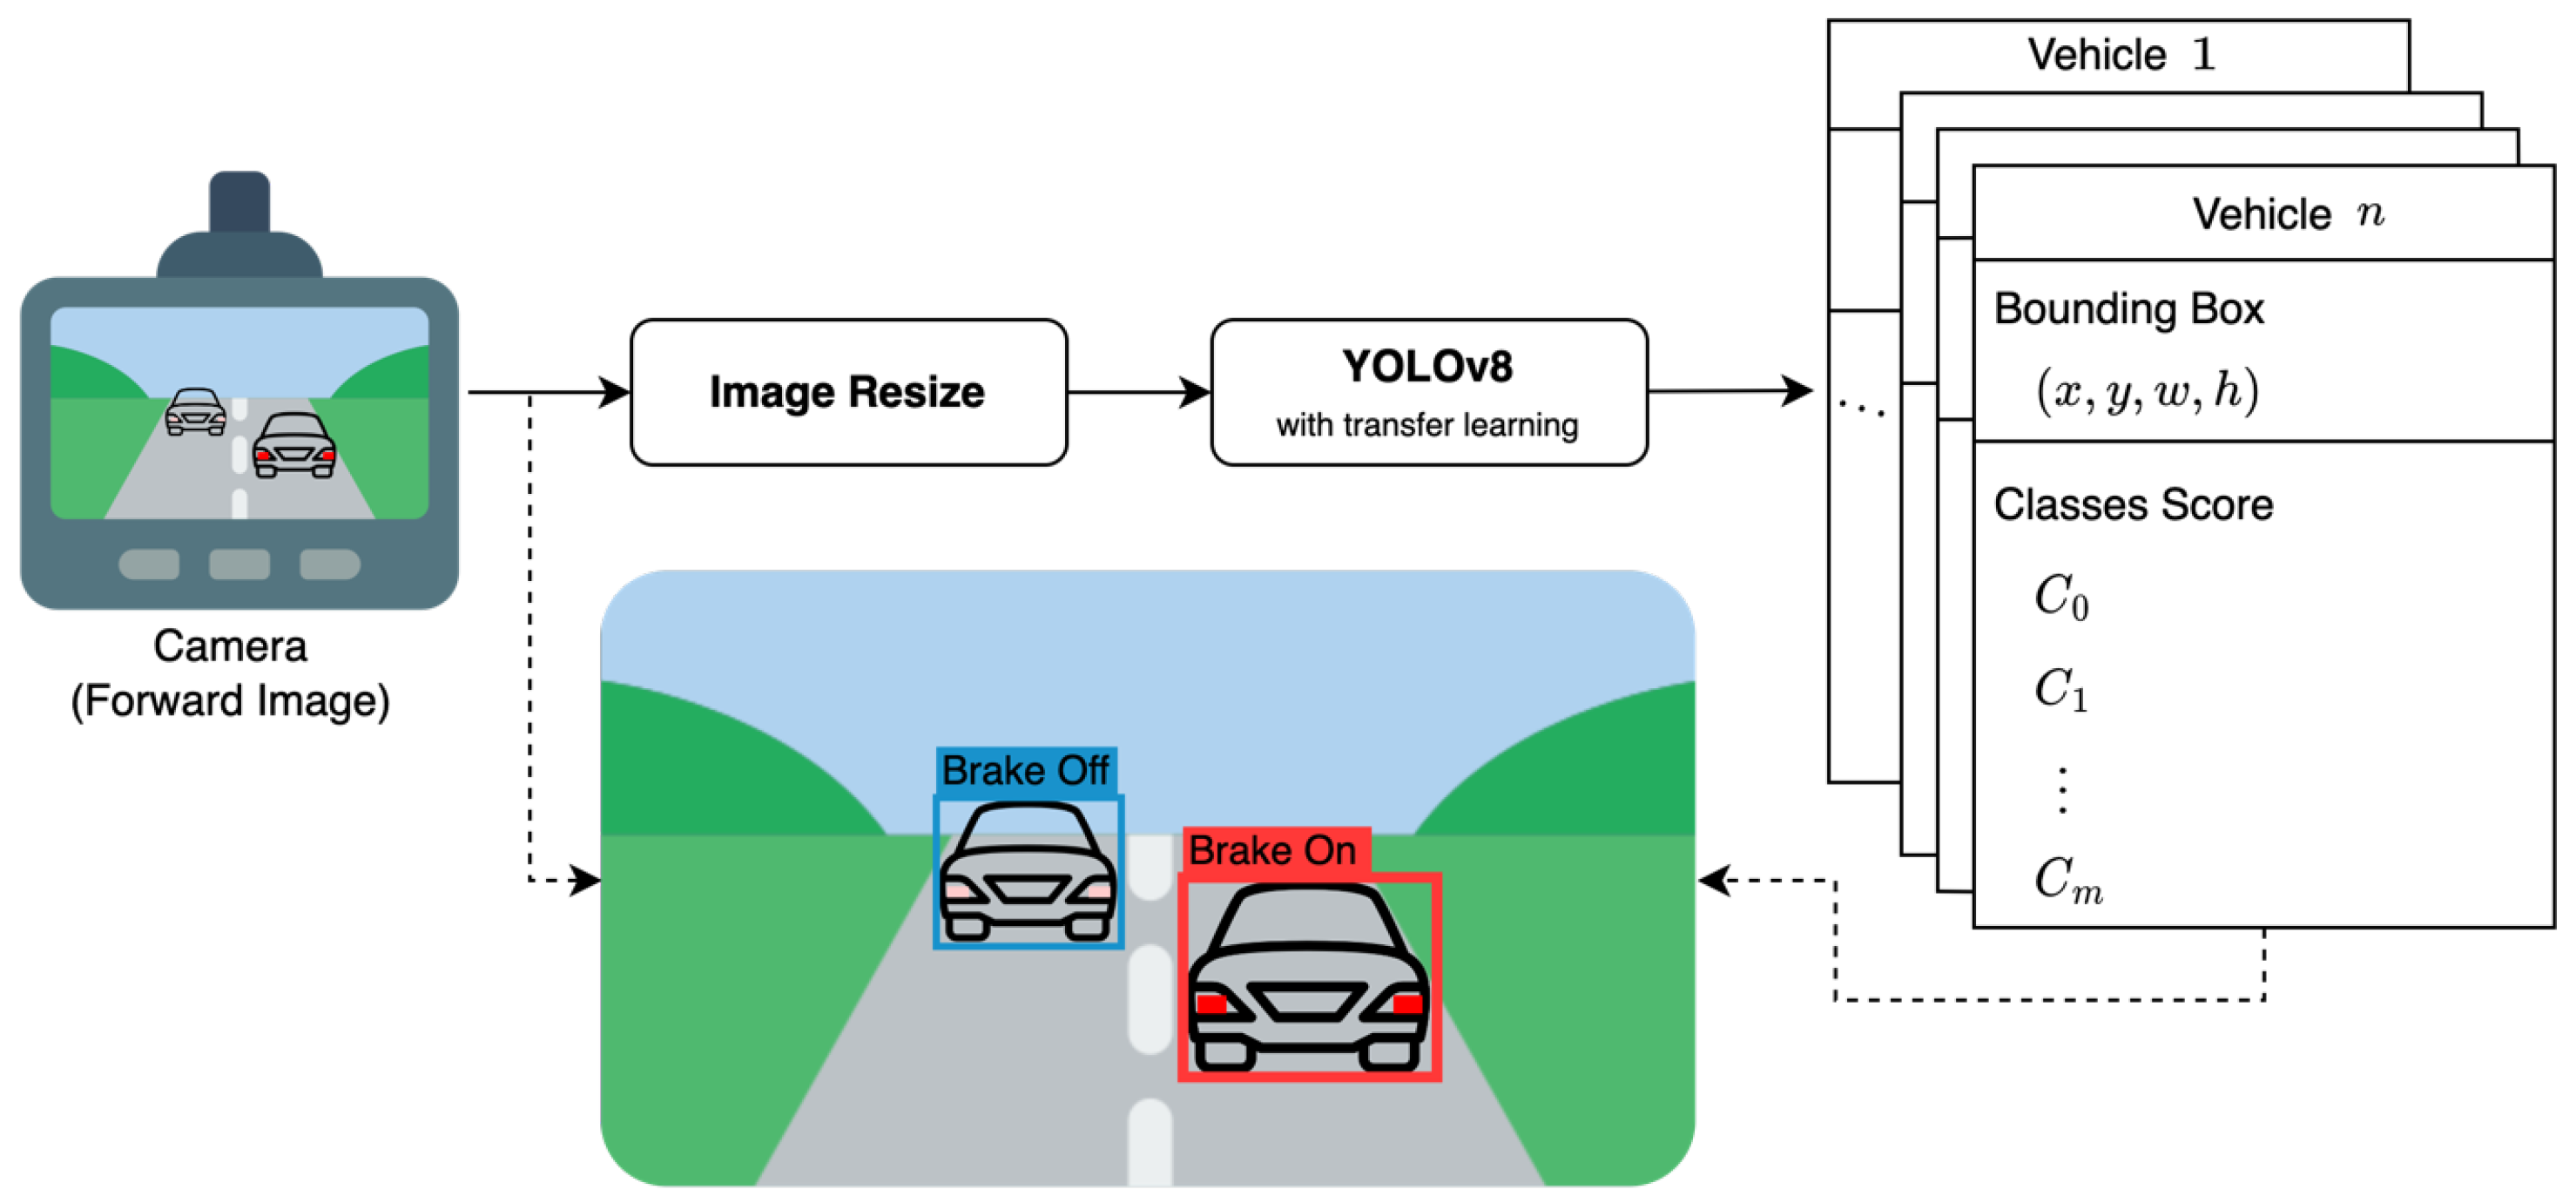
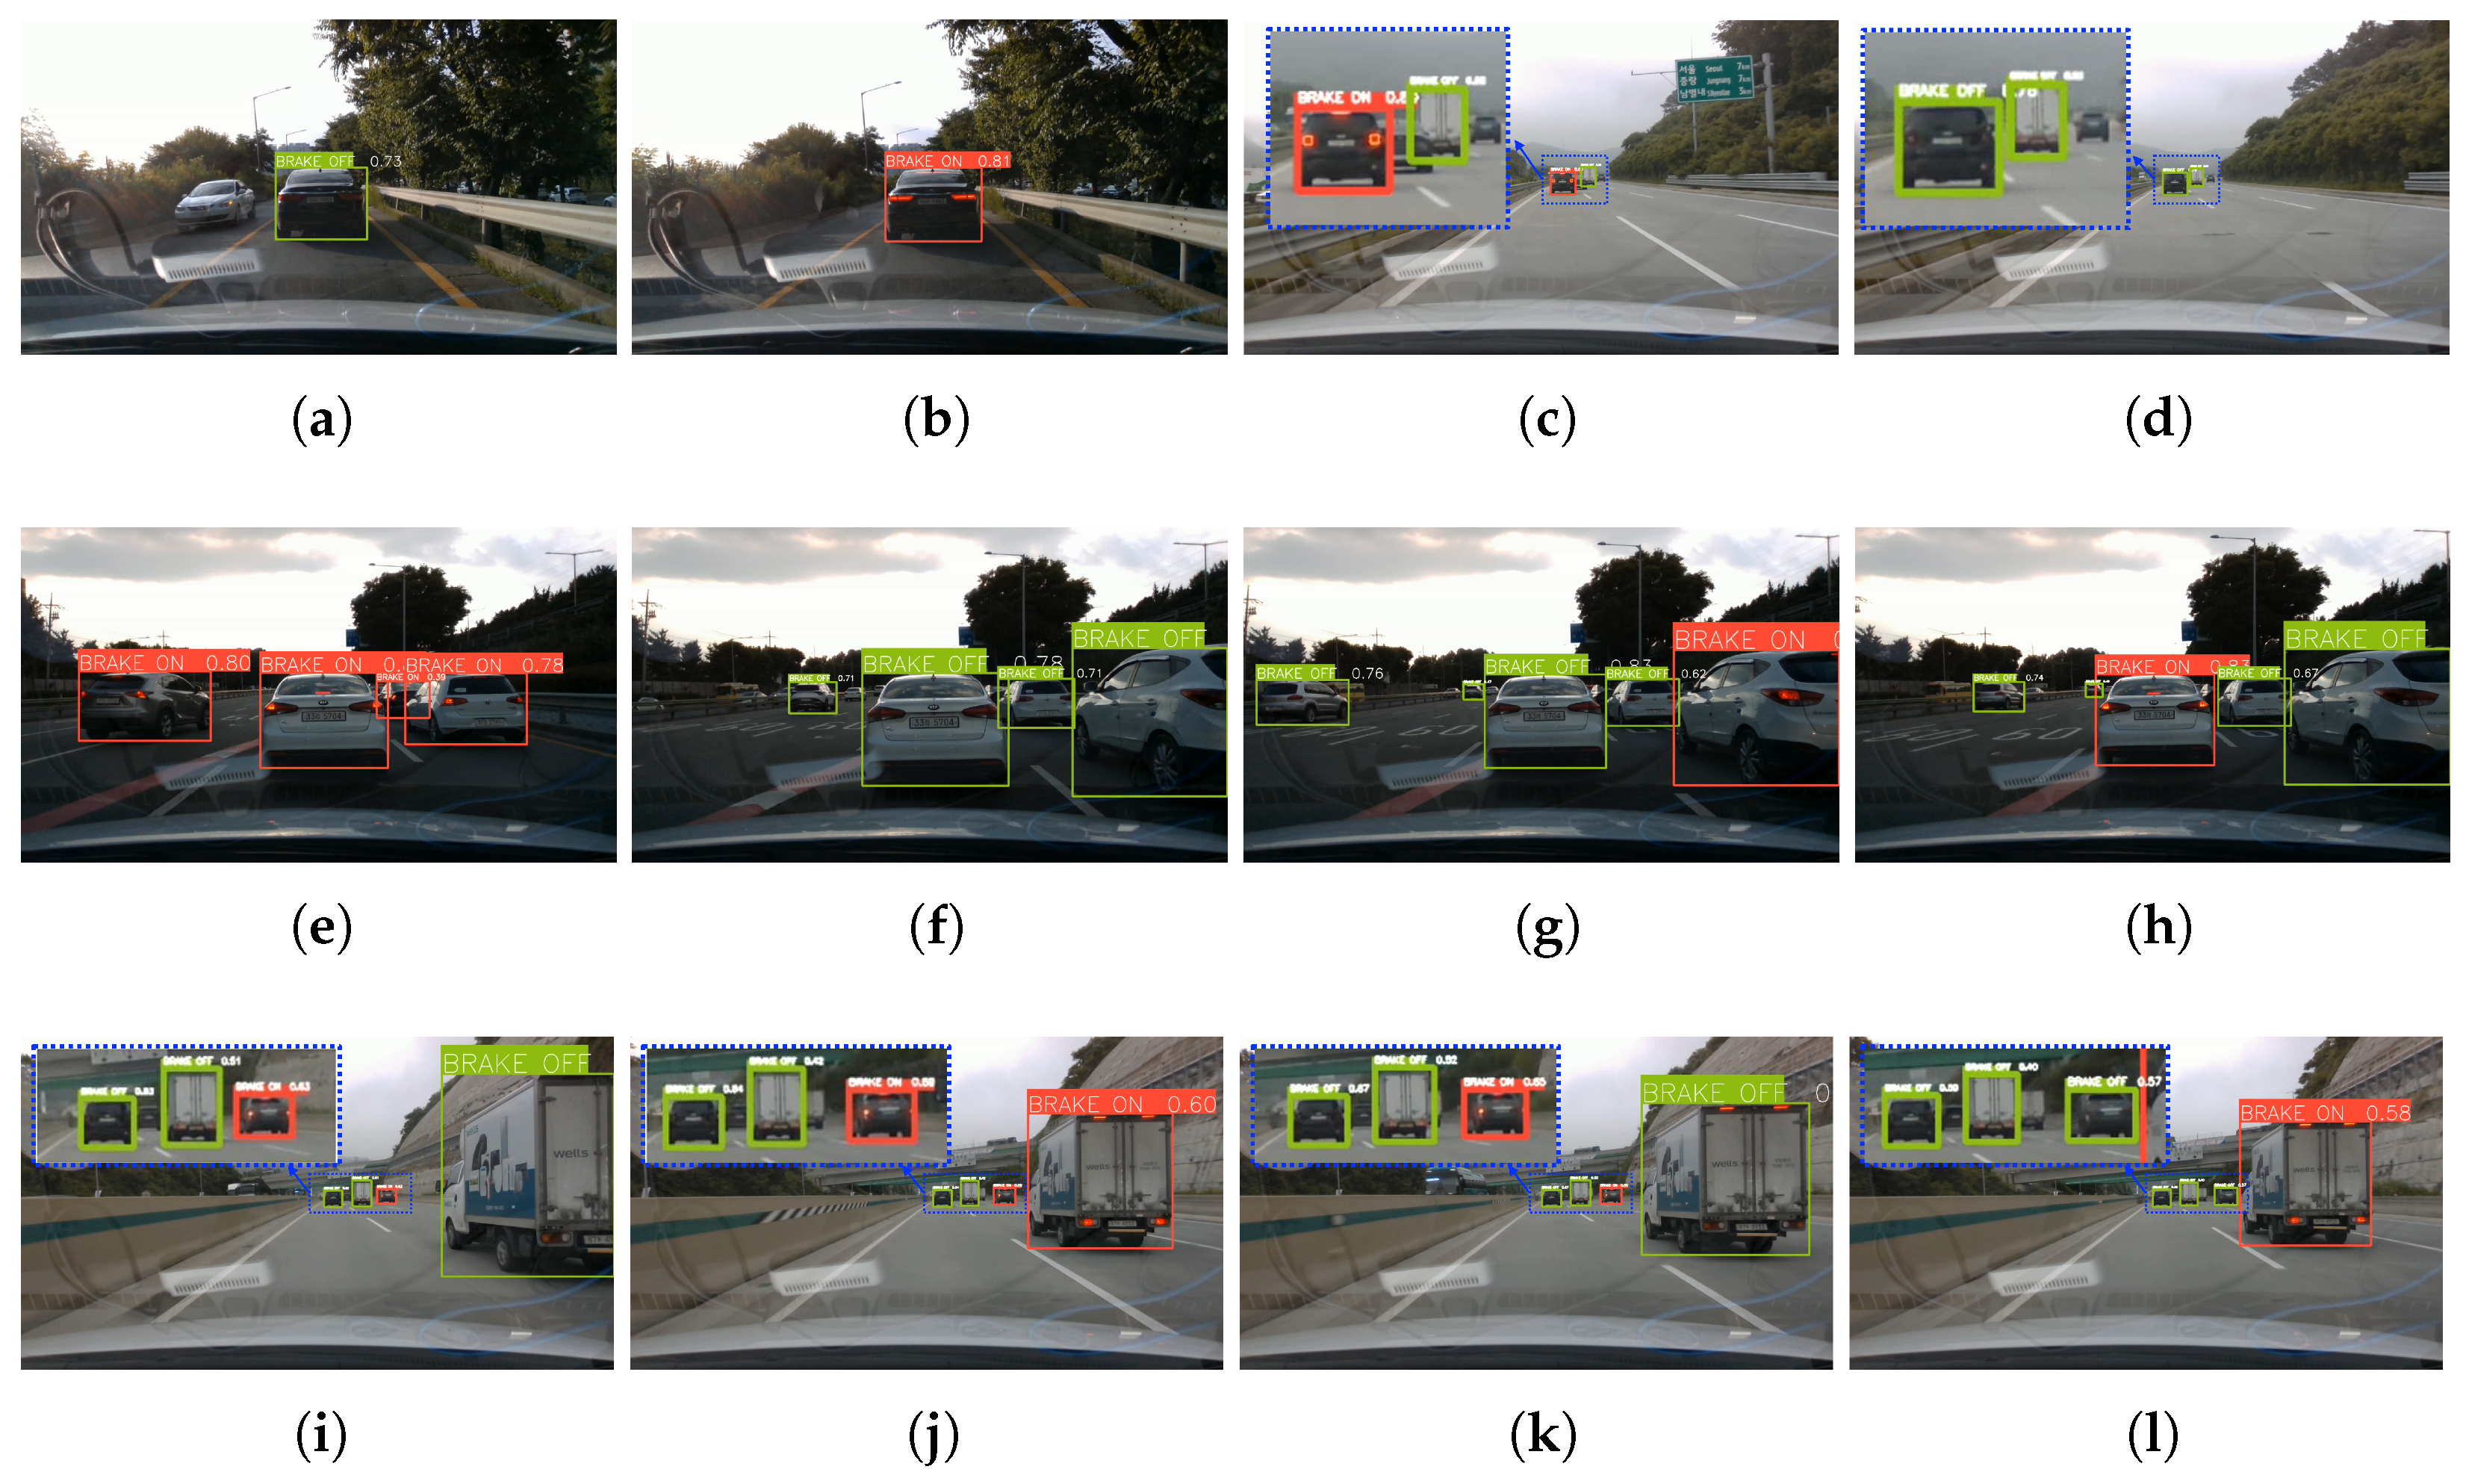
- Proposal of a one-stage network for detecting the brake light status of vehicles in the forward image during driving. The proposed network takes a single image as input and provides bounding boxes for all vehicles in the image, along with the detection of whether their brake light is on or off.
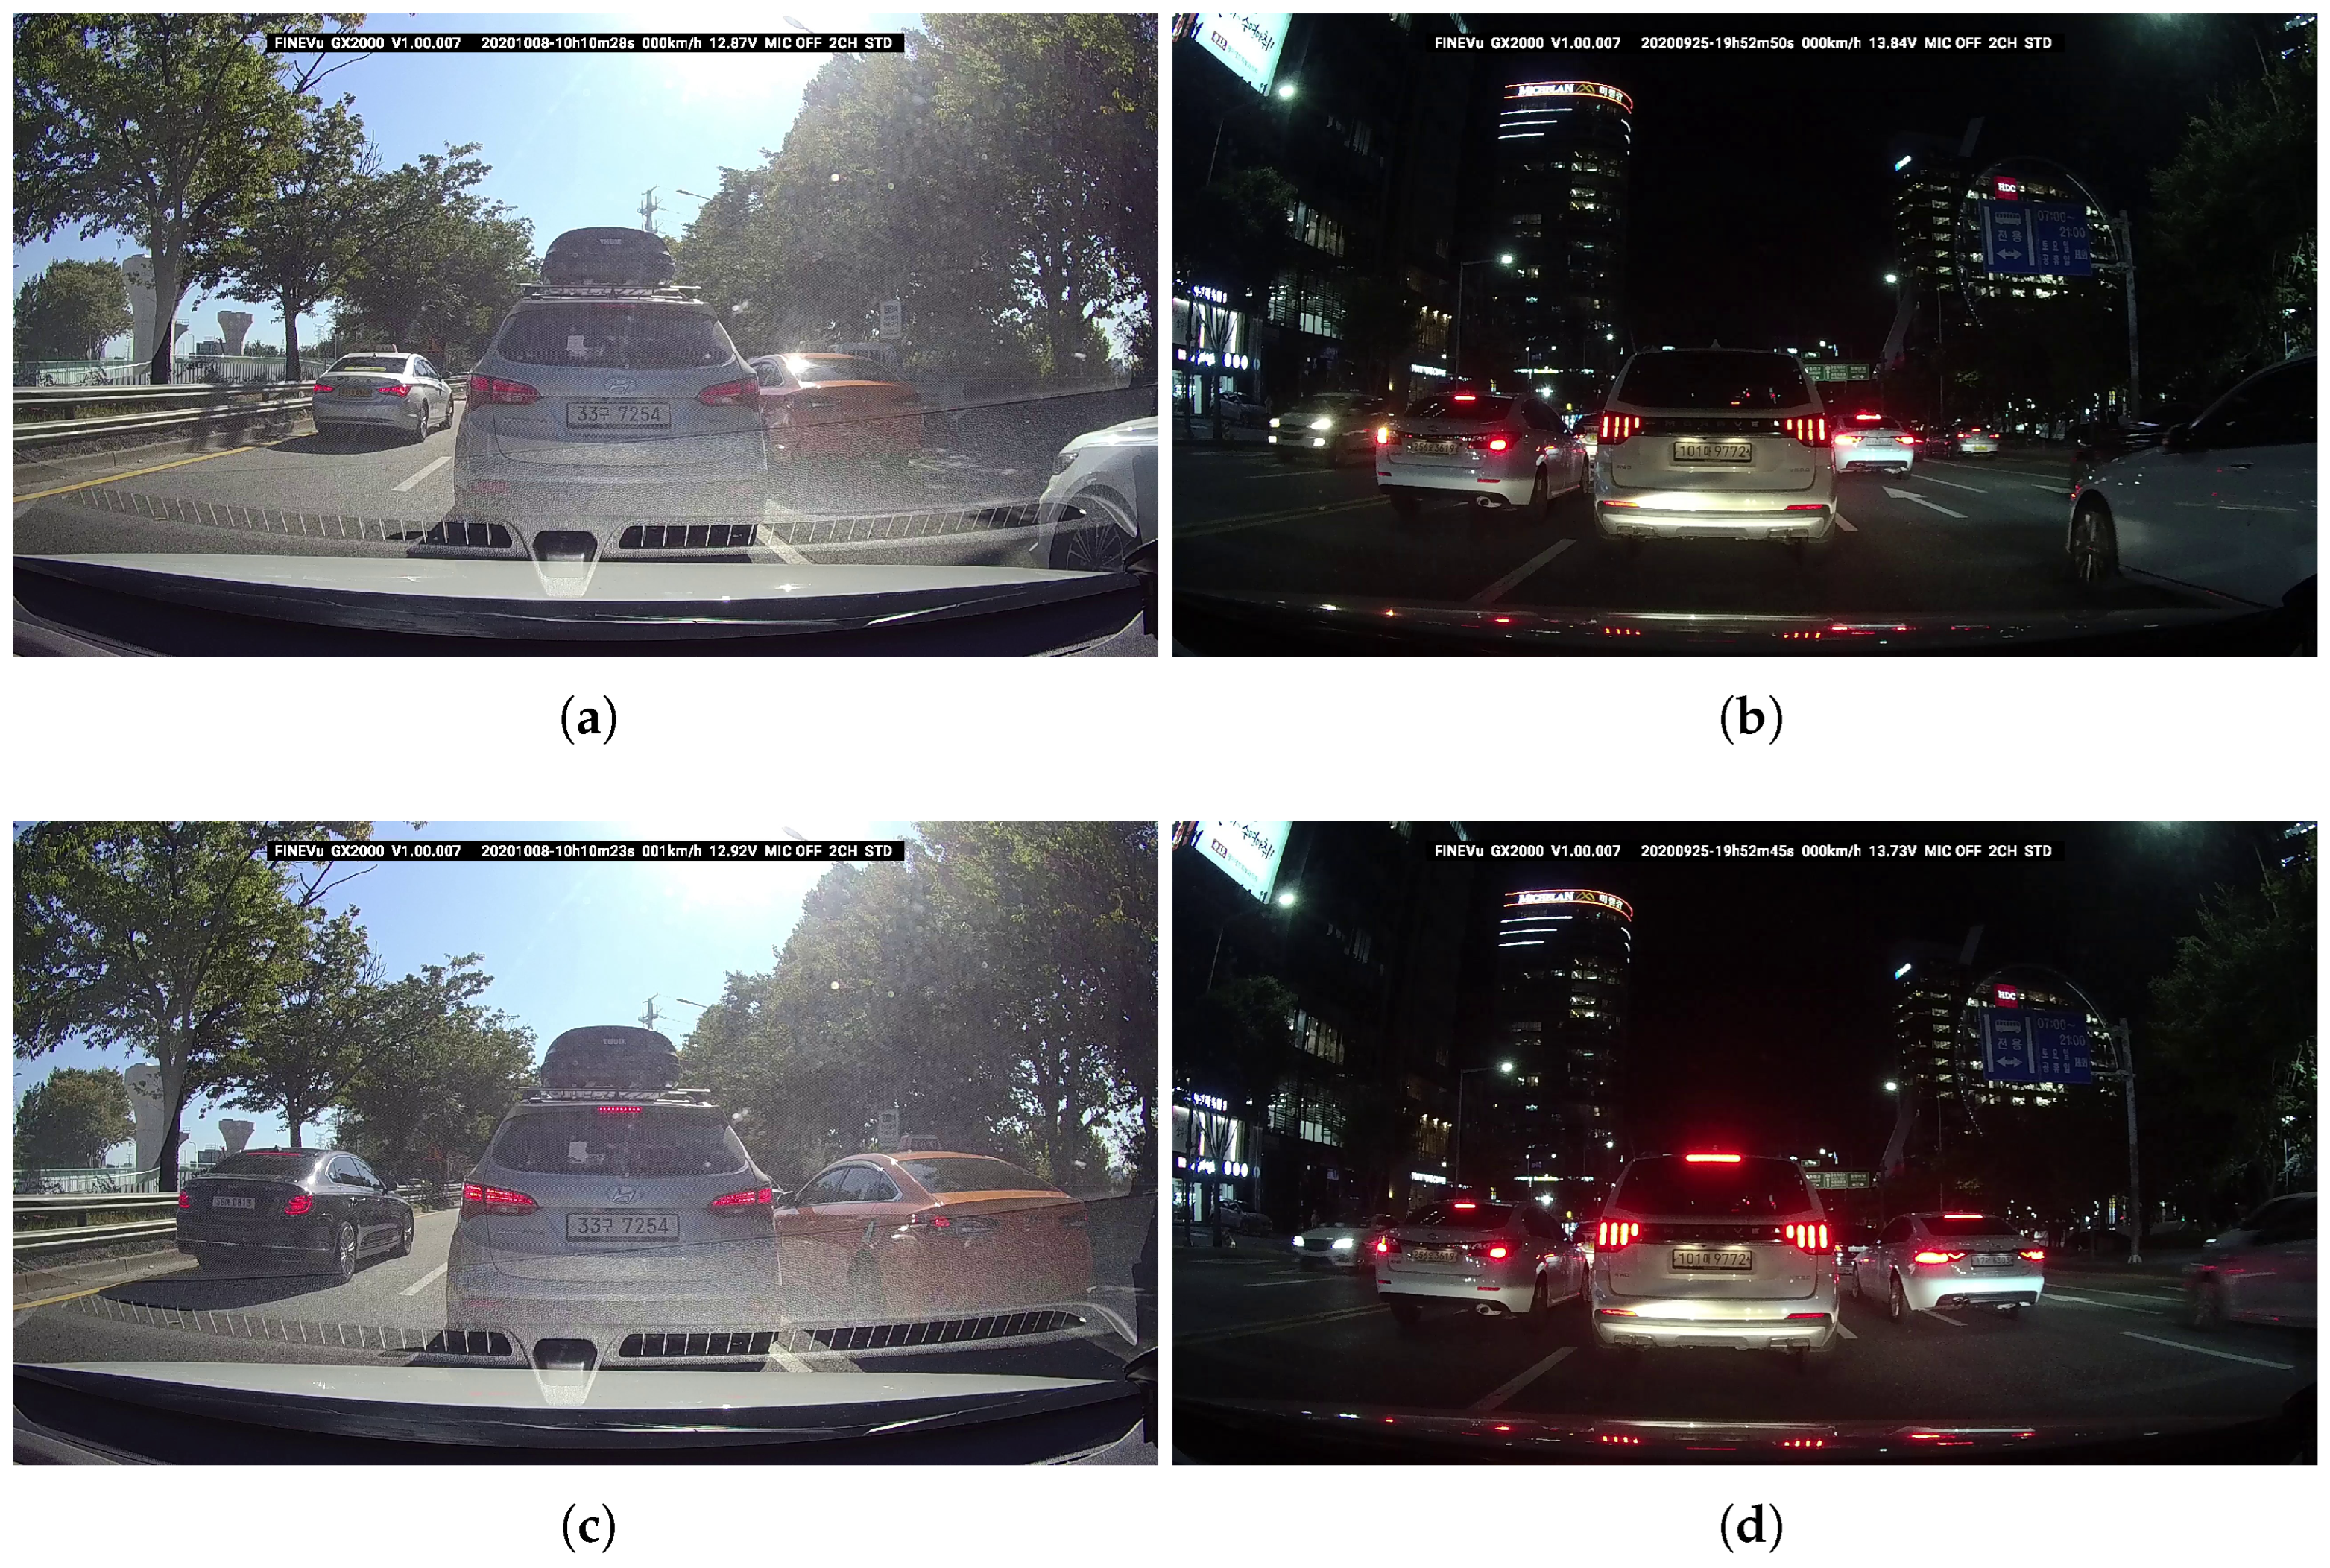
- Introduction of a dataset specifically designed for the task of driving vehicle and brake light status detection. The dataset comprises over 11,000 real-world driving images captured under various conditions, including day, night, and tunnel scenarios. Each image in the dataset is annotated by experts with vehicle-bounding boxes and brake light status.
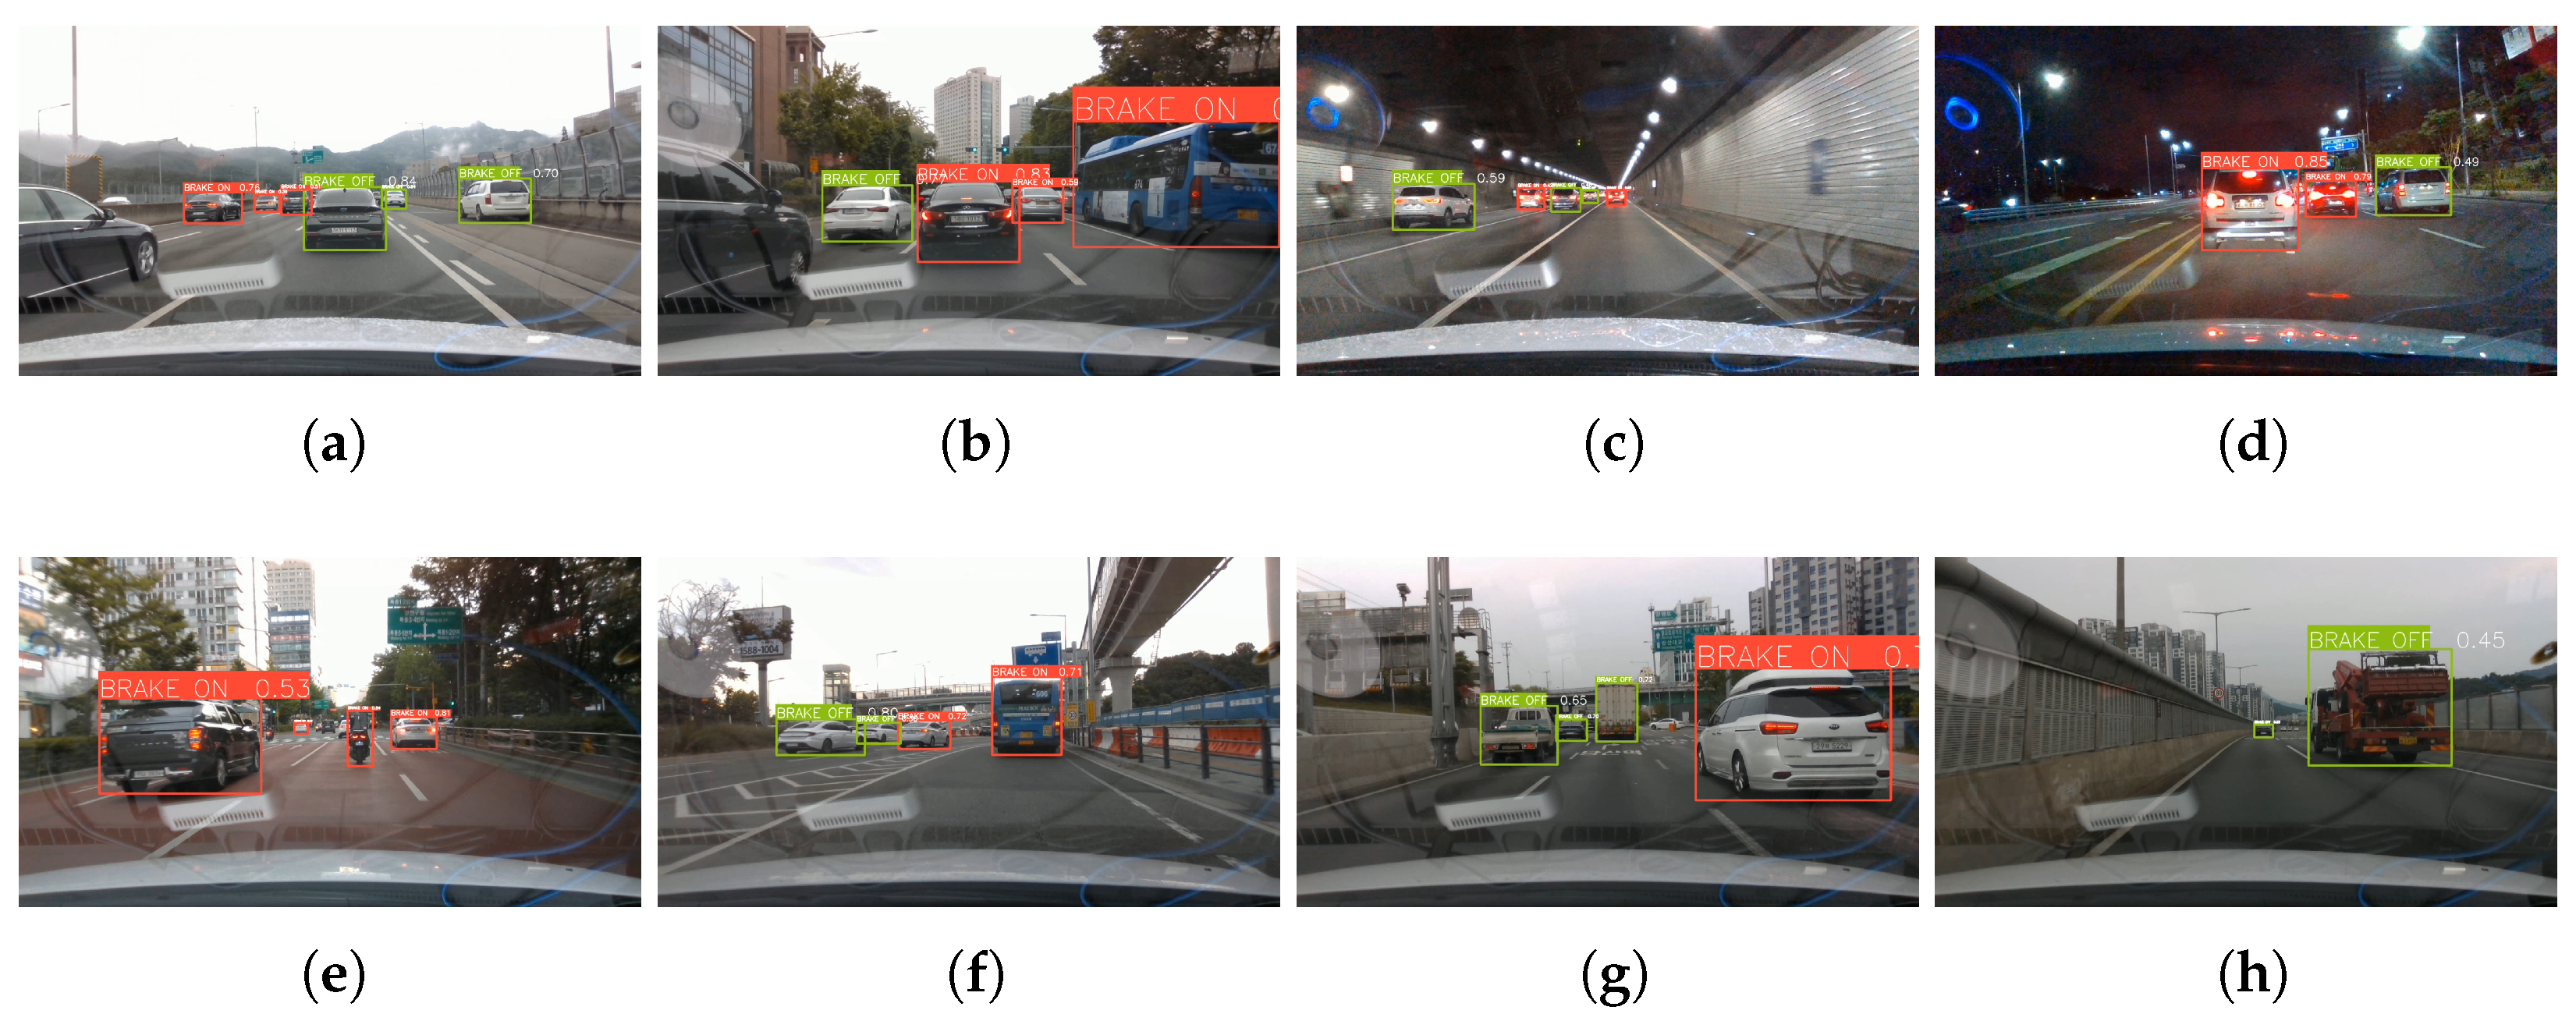
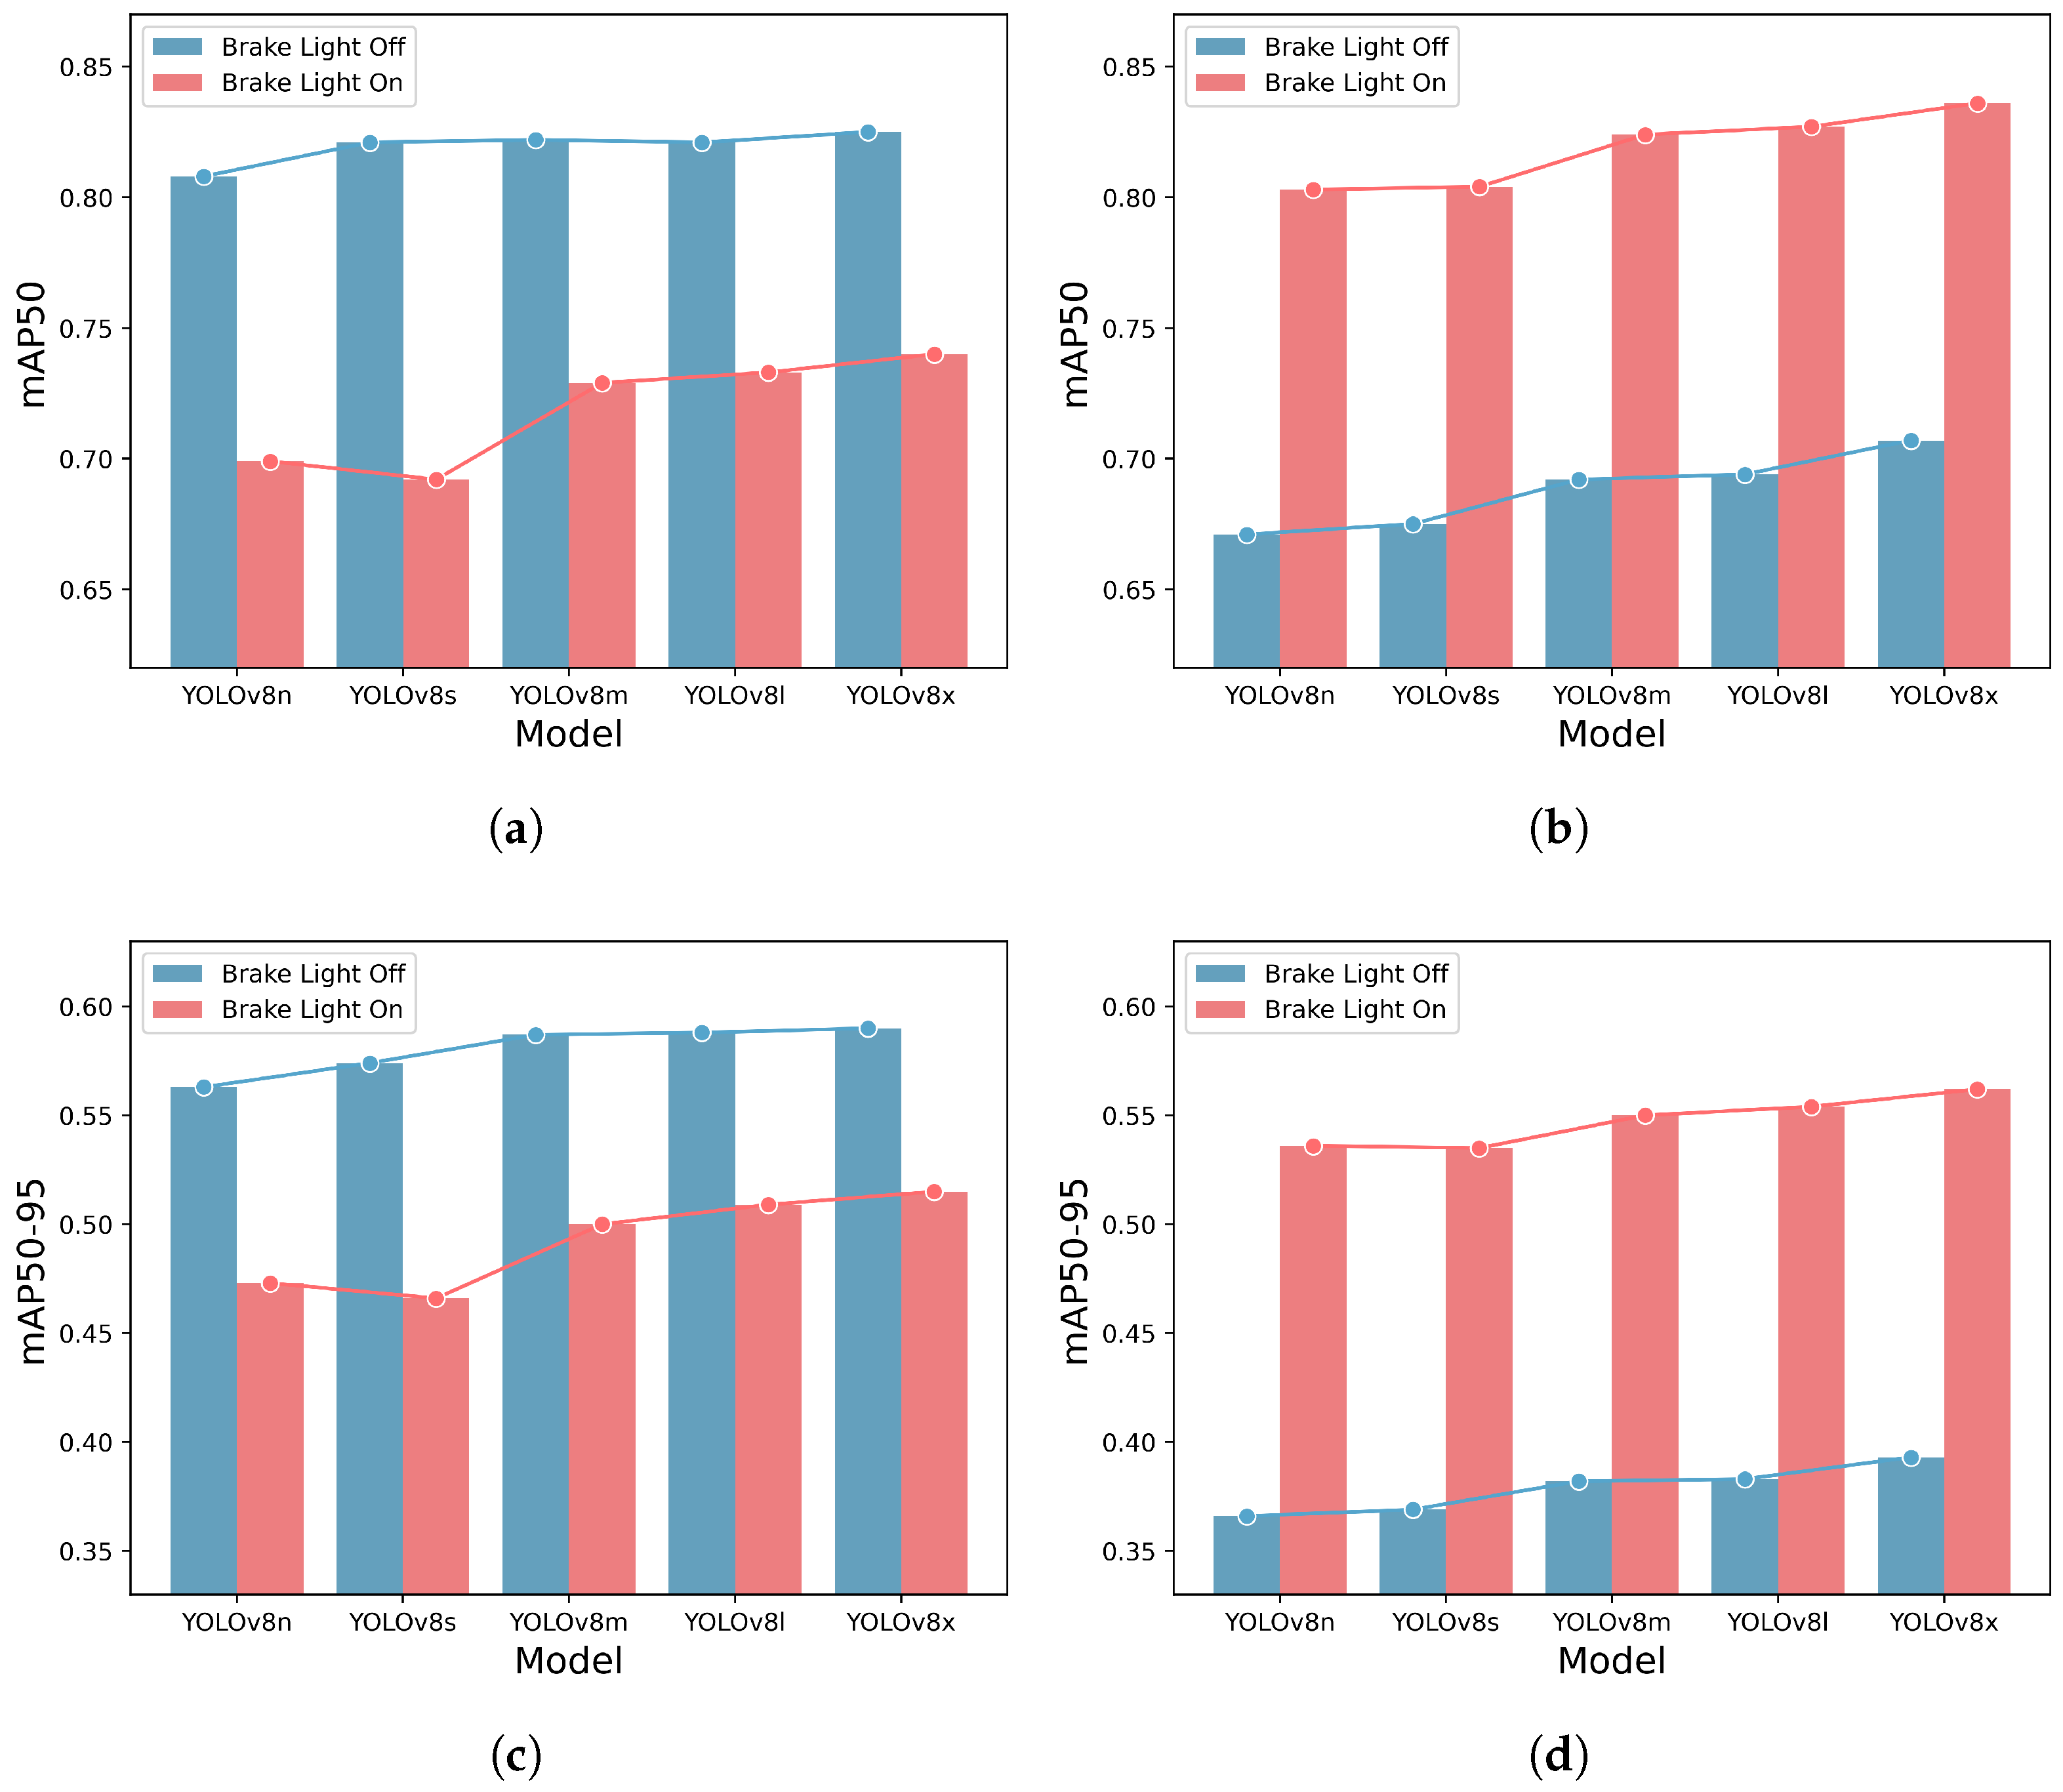
- Fine-tuning of the proposed detection network based on YOLOv8 using the introduced dataset. The trained model demonstrates high detection performance, and its real-time performance on an edge device is validated.
2. Related Works
3. Proposed Work
3.1. Dataset
3.2. YOLOv8
4. Experiments
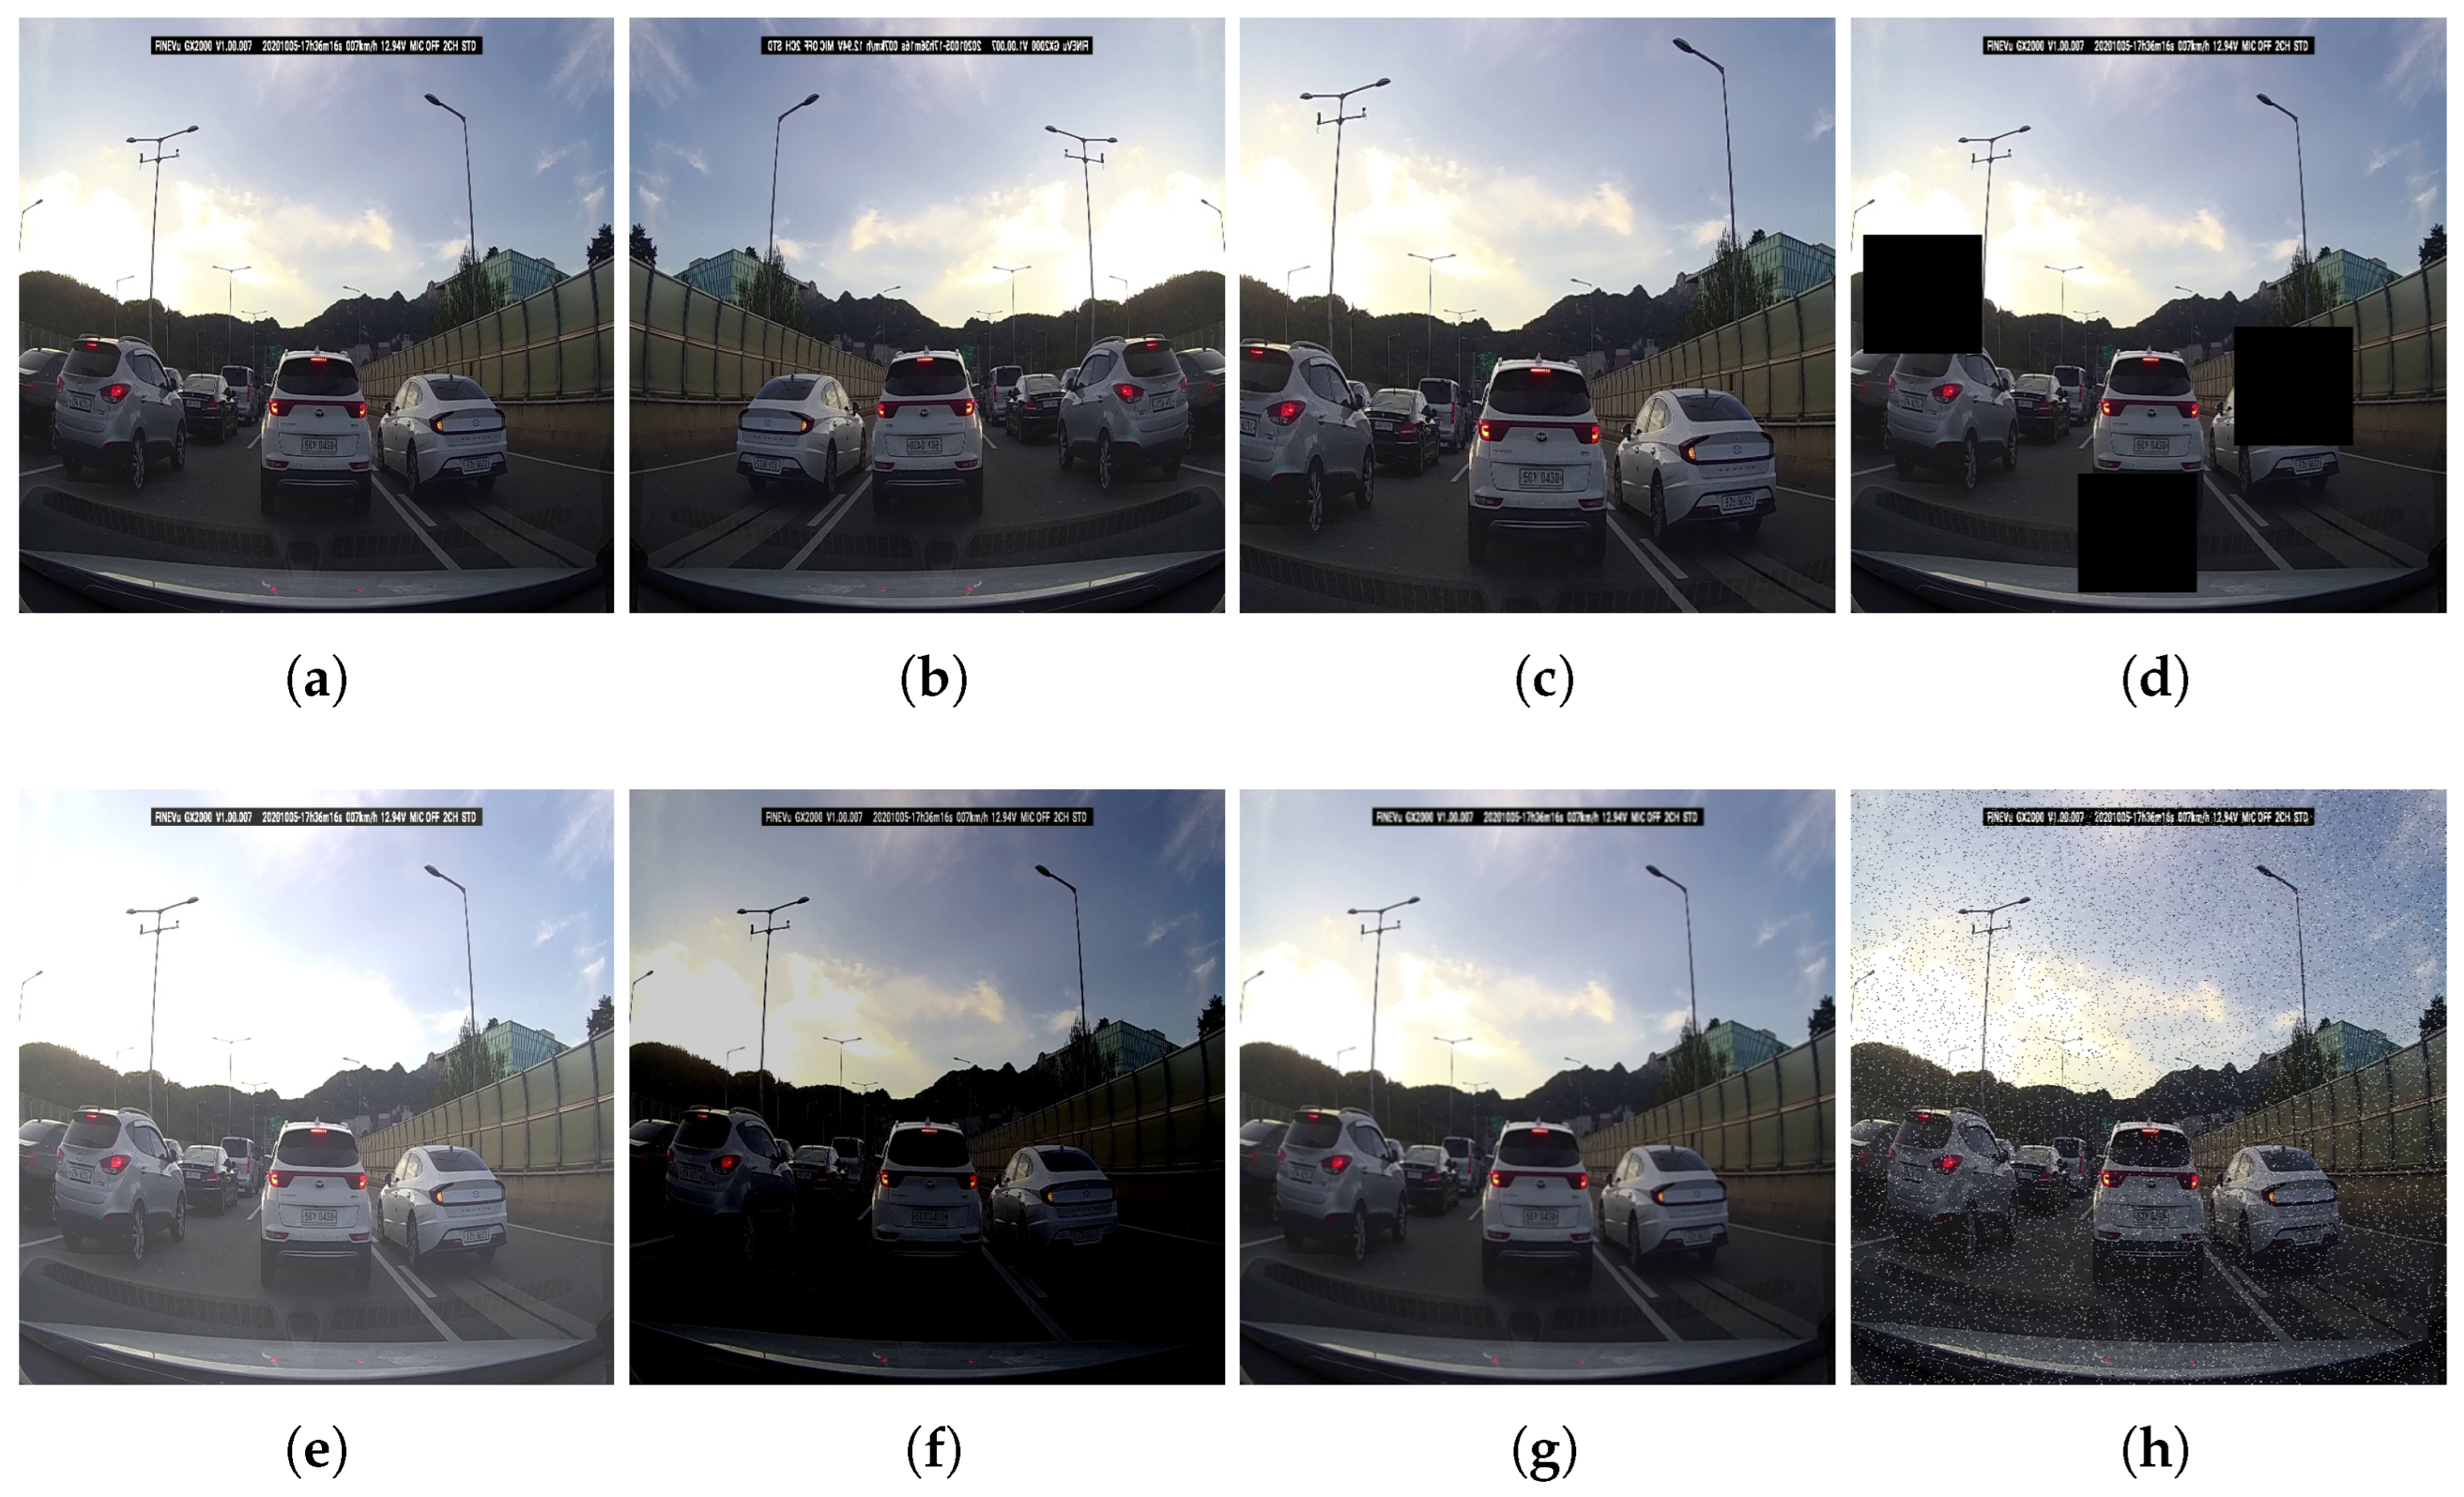
4.1. Custom Dataset and Preprocessing
- Crop: zoom rate chosen from uniform distribution within the range of to ;
- Cutout: a maximum size of black-box is of image size, a maximum of 3 boxes;
- Brightness: adjustment with a range of minimum to maximum ;
- Blur: a gaussian blur with a maximum kernel size of ;
- Noise: add noise to a maximum of of pixels.
4.2. Transfer Learning
4.3. Results
5. Conclusions
Author Contributions
Funding
Institutional Review Board Statement
Informed Consent Statement
Data Availability Statement
Acknowledgments
Conflicts of Interest
Abbreviations
| ADAS | Advanced Driver Assistance Systems |
| SAE | Society for Automotive Engineers |
| ACC | Adaptive Cruise Control |
| TTC | Time to Collision |
| RGB | Red-Green-Blue |
| HSI | Hue-Saturation-Intensity |
| HSV | Hue-Saturation-Value |
| SVM | Support Vector Machine |
| CNN | Convolutional Neural Networks |
| LSTM | Long Short-Term Memory |
| HOG | Histogram of Oriented Gradients |
| SSP | Spatial Pyramid Pooling |
| HDR | High Dynamic Range |
| LED | Light Emitting Diode |
| CIoU | Complete Intersection over Union |
| DFL | Distribution Focal Loss |
| NMS | Nonmaximum Suppression |
| SGD | Stochastic Gradient Descent |
| NAG | Nesterov Accelerated Gradient |
| mAP | mean Average Precision |
| IoU | Intersection over Union |
| ONNX | Open Neural Network Exchange |
References
- J3016; Taxonomy and Definitions for Terms Related to On-Road Motor Vehicle Automated Driving Systems. On-Road Automated Driving (ORAD) Committee, SAE International: Warrendale, PA, USA, 2021.
- Diels, C.; Bos, J.E. Self-driving carsickness. Appl. Ergon. 2016, 53, 374–382. [Google Scholar] [CrossRef] [PubMed]
- Iskander, J.; Attia, M.; Saleh, K.; Nahavandi, D.; Abobakr, A.; Mohamed, S.; Asadi, H.; Khosravi, A.; Lim, C.P.; Hossny, M. From car sickness to autonomous car sickness: A review. Transp. Res. Part F Traffic Psychol. Behav. 2019, 62, 716–726. [Google Scholar] [CrossRef]
- Reason, J.T.; Brand, J.J. Motion Sickness; Academic Press: Cambridge, MA, USA, 1975. [Google Scholar]
- Reason, J.T. Motion sickness adaptation: A neural mismatch model. J. R. Soc. Med. 1978, 71, 819–829. [Google Scholar] [CrossRef] [PubMed]
- Pirhonen, J.; Ojala, R.; Kivekäs, K.; Tammi, K. Predictive Braking With Brake Light Detection—Field Test. IEEE Access 2022, 10, 49771–49780. [Google Scholar] [CrossRef]
- Ultralytics YOLOv8. Available online: https://docs.ultralytics.com/ (accessed on 21 June 2023).
- Assunção, E.; Gaspar, P.D.; Mesquita, R.; Simões, M.P.; Alibabaei, K.; Veiros, A.; Proença, H. Real-Time Weed Control Application Using a Jetson Nano Edge Device and a Spray Mechanism. Remote Sens. 2022, 14, 4217. [Google Scholar] [CrossRef]
- Thammakaroon, P.; Tangamchit, P. Predictive brake warning at night using taillight characteristic. In Proceedings of the 2009 IEEE International Symposium on Industrial Electronics, Seoul, Republic of Korea, 5–8 July 2009; IEEE: Piscataway, NJ, USA, 2009; pp. 217–221. [Google Scholar]
- Chen, H.T.; Wu, Y.C.; Hsu, C.C. Daytime preceding vehicle brake light detection using monocular vision. IEEE Sens. J. 2015, 16, 120–131. [Google Scholar] [CrossRef]
- Liu, W.; Bao, H.; Zhang, J.; Xu, C. Vision-based method for forward vehicle brake lights recognition. Int. J. Signal Process. Image Process. Pattern Recognit. 2015, 8, 167–180. [Google Scholar] [CrossRef]
- Chen, D.Y.; Peng, Y.J. Frequency-tuned taillight-based nighttime vehicle braking warning system. IEEE Sens. J. 2012, 12, 3285–3292. [Google Scholar] [CrossRef]
- Cui, Z.; Yang, S.W.; Tsai, H.M. A vision-based hierarchical framework for autonomous front-vehicle taillights detection and signal recognition. In Proceedings of the 2015 IEEE 18th International Conference on Intelligent Transportation Systems, Gran Canaria, Spain, 15–18 September 2015; IEEE: Piscataway, NJ, USA, 2015; pp. 931–937. [Google Scholar]
- Nava, D.; Panzani, G.; Savaresi, S.M. A collision warning oriented brake lights detection and classification algorithm based on a mono camera sensor. In Proceedings of the 2019 IEEE Intelligent Transportation Systems Conference (ITSC), Auckland, New Zealand, 27–30 October 2019; IEEE: Piscataway, NJ, USA, 2019; pp. 319–324. [Google Scholar]
- Pirhonen, J.; Ojala, R.; Kivekäs, K.; Vepsäläinen, J.; Tammi, K. Brake light detection algorithm for predictive braking. Appl. Sci. 2022, 12, 2804. [Google Scholar] [CrossRef]
- Wang, J.G.; Zhou, L.; Pan, Y.; Lee, S.; Song, Z.; Han, B.S.; Saputra, V.B. Appearance-based brake-lights recognition using deep learning and vehicle detection. In Proceedings of the 2016 IEEE Intelligent Vehicles Symposium (IV), Gothenburg, Sweden, 19–22 June 2016; IEEE: Piscataway, NJ, USA, 2016; pp. 815–820. [Google Scholar]
- Li, Q.; Garg, S.; Nie, J.; Li, X.; Liu, R.W.; Cao, Z.; Hossain, M.S. A highly efficient vehicle taillight detection approach based on deep learning. IEEE Trans. Intell. Transp. Syst. 2020, 22, 4716–4726. [Google Scholar] [CrossRef]
- Kim, J. Detecting the Turn on of Vehicle Brake Lights to Prevent Collisions in Highway Tunnels. Sustainability 2022, 14, 14322. [Google Scholar] [CrossRef]
- Krizhevsky, A.; Sutskever, I.; Hinton, G.E. Imagenet classification with deep convolutional neural networks. In Proceedings of the Advances in Neural Information Processing Systems 25 (NIPS 2012), Lake Tahoe, NV, USA, 3–6 December 2012; Volume 25. [Google Scholar]
- Russakovsky, O.; Deng, J.; Su, H.; Krause, J.; Satheesh, S.; Ma, S.; Huang, Z.; Karpathy, A.; Khosla, A.; Bernstein, M.; et al. Imagenet large scale visual recognition challenge. Int. J. Comput. Vis. 2015, 115, 211–252. [Google Scholar] [CrossRef]
- Freund, Y.; Schapire, R.E. Experiments with a new boosting algorithm. In Proceedings of the ICML, Bari, Italy, 3–6 July 1996; Citeseer: State College, PA, USA, 1996; Volume 96, pp. 148–156. [Google Scholar]
- Redmon, J.; Divvala, S.; Girshick, R.; Farhadi, A. You only look once: Unified, real-time object detection. In Proceedings of the IEEE Conference on Computer Vision and Pattern Recognition, Las Vegas, NV, USA, 26 June–1 July 2016; pp. 779–788. [Google Scholar]
- Redmon, J.; Farhadi, A. YOLO9000: Better, faster, stronger. In Proceedings of the IEEE Conference on Computer Vision and Pattern Recognition, Honolulu, HI, USA, 21–26 July 2017; pp. 7263–7271. [Google Scholar]
- Redmon, J.; Farhadi, A. Yolov3: An incremental improvement. arXiv 2018, arXiv:1804.02767. [Google Scholar]
- Bochkovskiy, A.; Wang, C.Y.; Liao, H.Y.M. Yolov4: Optimal speed and accuracy of object detection. arXiv 2020, arXiv:2004.10934. [Google Scholar]
- He, K.; Zhang, X.; Ren, S.; Sun, J. Spatial pyramid pooling in deep convolutional networks for visual recognition. IEEE Trans. Pattern Anal. Mach. Intell. 2015, 37, 1904–1916. [Google Scholar] [CrossRef]
- Label Studio: Data Labeling Software. Available online: https://github.com/heartexlabs/label-studio (accessed on 21 June 2023).
- Brake-Light-Detection Dataset. Available online: https://universe.roboflow.com/imlab-kookmin-univ/brake-light-detection (accessed on 21 June 2023).
- Girshick, R.; Donahue, J.; Darrell, T.; Malik, J. Rich feature hierarchies for accurate object detection and semantic segmentation. In Proceedings of the IEEE Conference on Computer Vision and Pattern Recognition, Columbus, OH, USA, 23–28 June 2014; pp. 580–587. [Google Scholar]
- Girshick, R. Fast r-cnn. In Proceedings of the IEEE International Conference on Computer Vision, Santiago, Chile, 7–13 December 2015; pp. 1440–1448. [Google Scholar]
- Ren, S.; He, K.; Girshick, R.; Sun, J. Faster r-cnn: Towards real-time object detection with region proposal networks. In Proceedings of the Advances in Neural Information Processing Systems 28 (NIPS 2015), Montreal, QC, USA, 7–12 December 2015; Volume 28. [Google Scholar]
- Ultralytics YOLOv5. Available online: https://docs.ultralytics.com/yolov5/ (accessed on 21 June 2023).
- Li, C.; Li, L.; Jiang, H.; Weng, K.; Geng, Y.; Li, L.; Ke, Z.; Li, Q.; Cheng, M.; Nie, W.; et al. YOLOv6: A single-stage object detection framework for industrial applications. arXiv 2022, arXiv:2209.02976. [Google Scholar]
- Wang, C.Y.; Bochkovskiy, A.; Liao, H.Y.M. YOLOv7: Trainable bag-of-freebies sets new state-of-the-art for real-time object detectors. In Proceedings of the IEEE/CVF Conference on Computer Vision and Pattern Recognition, Vancouver, BC, Canada, 18–22 June 2023; pp. 7464–7475. [Google Scholar]
- Lin, T.Y.; Maire, M.; Belongie, S.; Hays, J.; Perona, P.; Ramanan, D.; Dollár, P.; Zitnick, C.L. Microsoft coco: Common objects in context. In Proceedings of the Computer Vision—ECCV 2014: 13th European Conference, Zurich, Switzerland, 6–12 September 2014; Springer: Berlin/Heidelberg, Germany, 2014; pp. 740–755. [Google Scholar]
- Ye, Y.; Ren, X.; Zhu, B.; Tang, T.; Tan, X.; Gui, Y.; Yao, Q. An adaptive attention fusion mechanism convolutional network for object detection in remote sensing images. Remote Sens. 2022, 14, 516. [Google Scholar] [CrossRef]
- Zeng, N.; Wu, P.; Wang, Z.; Li, H.; Liu, W.; Liu, X. A small-sized object detection oriented multi-scale feature fusion approach with application to defect detection. IEEE Trans. Instrum. Meas. 2022, 71, 3507014. [Google Scholar] [CrossRef]
- Terven, J.; Cordova-Esparza, D. A comprehensive review of YOLO: From YOLOv1 to YOLOv8 and beyond. arXiv 2023, arXiv:2304.00501. [Google Scholar]
- Zheng, Z.; Wang, P.; Liu, W.; Li, J.; Ye, R.; Ren, D. Distance-IoU loss: Faster and better learning for bounding box regression. In Proceedings of the AAAI Conference on Artificial Intelligence, New York, NY, USA, 7–12 February 2020; Volume 34, pp. 12993–13000. [Google Scholar]
- Li, X.; Wang, W.; Wu, L.; Chen, S.; Hu, X.; Li, J.; Tang, J.; Yang, J. Generalized focal loss: Learning qualified and distributed bounding boxes for dense object detection. Adv. Neural Inf. Process. Syst. 2020, 33, 21002–21012. [Google Scholar]
- Roboflow. Available online: https://roboflow.com (accessed on 21 June 2023).
- Sutskever, I.; Martens, J.; Dahl, G.; Hinton, G. On the importance of initialization and momentum in deep learning. In Proceedings of the International Conference on Machine Learning, Atlanta, GA, USA, 16–21 June 2013; PMLR: London, UK, 2013; pp. 1139–1147. [Google Scholar]
- COCO Detection Leaderboard. Available online: https://cocodataset.org/#detection-leaderboard (accessed on 21 June 2023).
- Zou, Z.; Chen, K.; Shi, Z.; Guo, Y.; Ye, J. Object detection in 20 years: A survey. Proc. IEEE 2023, 111, 257–276. [Google Scholar] [CrossRef]


| Number of | Train | Test | |
|---|---|---|---|
| Images | 7892 | 3196 | |
| Annotations | 19,913 | 10,531 | |
| – Brake Light Off () | 10,851 | 5999 | |
| – Brake Light On () | 9062 | 4532 | |
| Model | Number of Params (M) | FLOPs (B) |
|---|---|---|
| YOLOv8n | 3.2 | 8.7 |
| YOLOv8s | 11.2 | 28.6 |
| YOLOv8m | 25.9 | 78.9 |
| YOLOv8l | 43.7 | 165.2 |
| YOLOv8x | 68.2 | 257.8 |
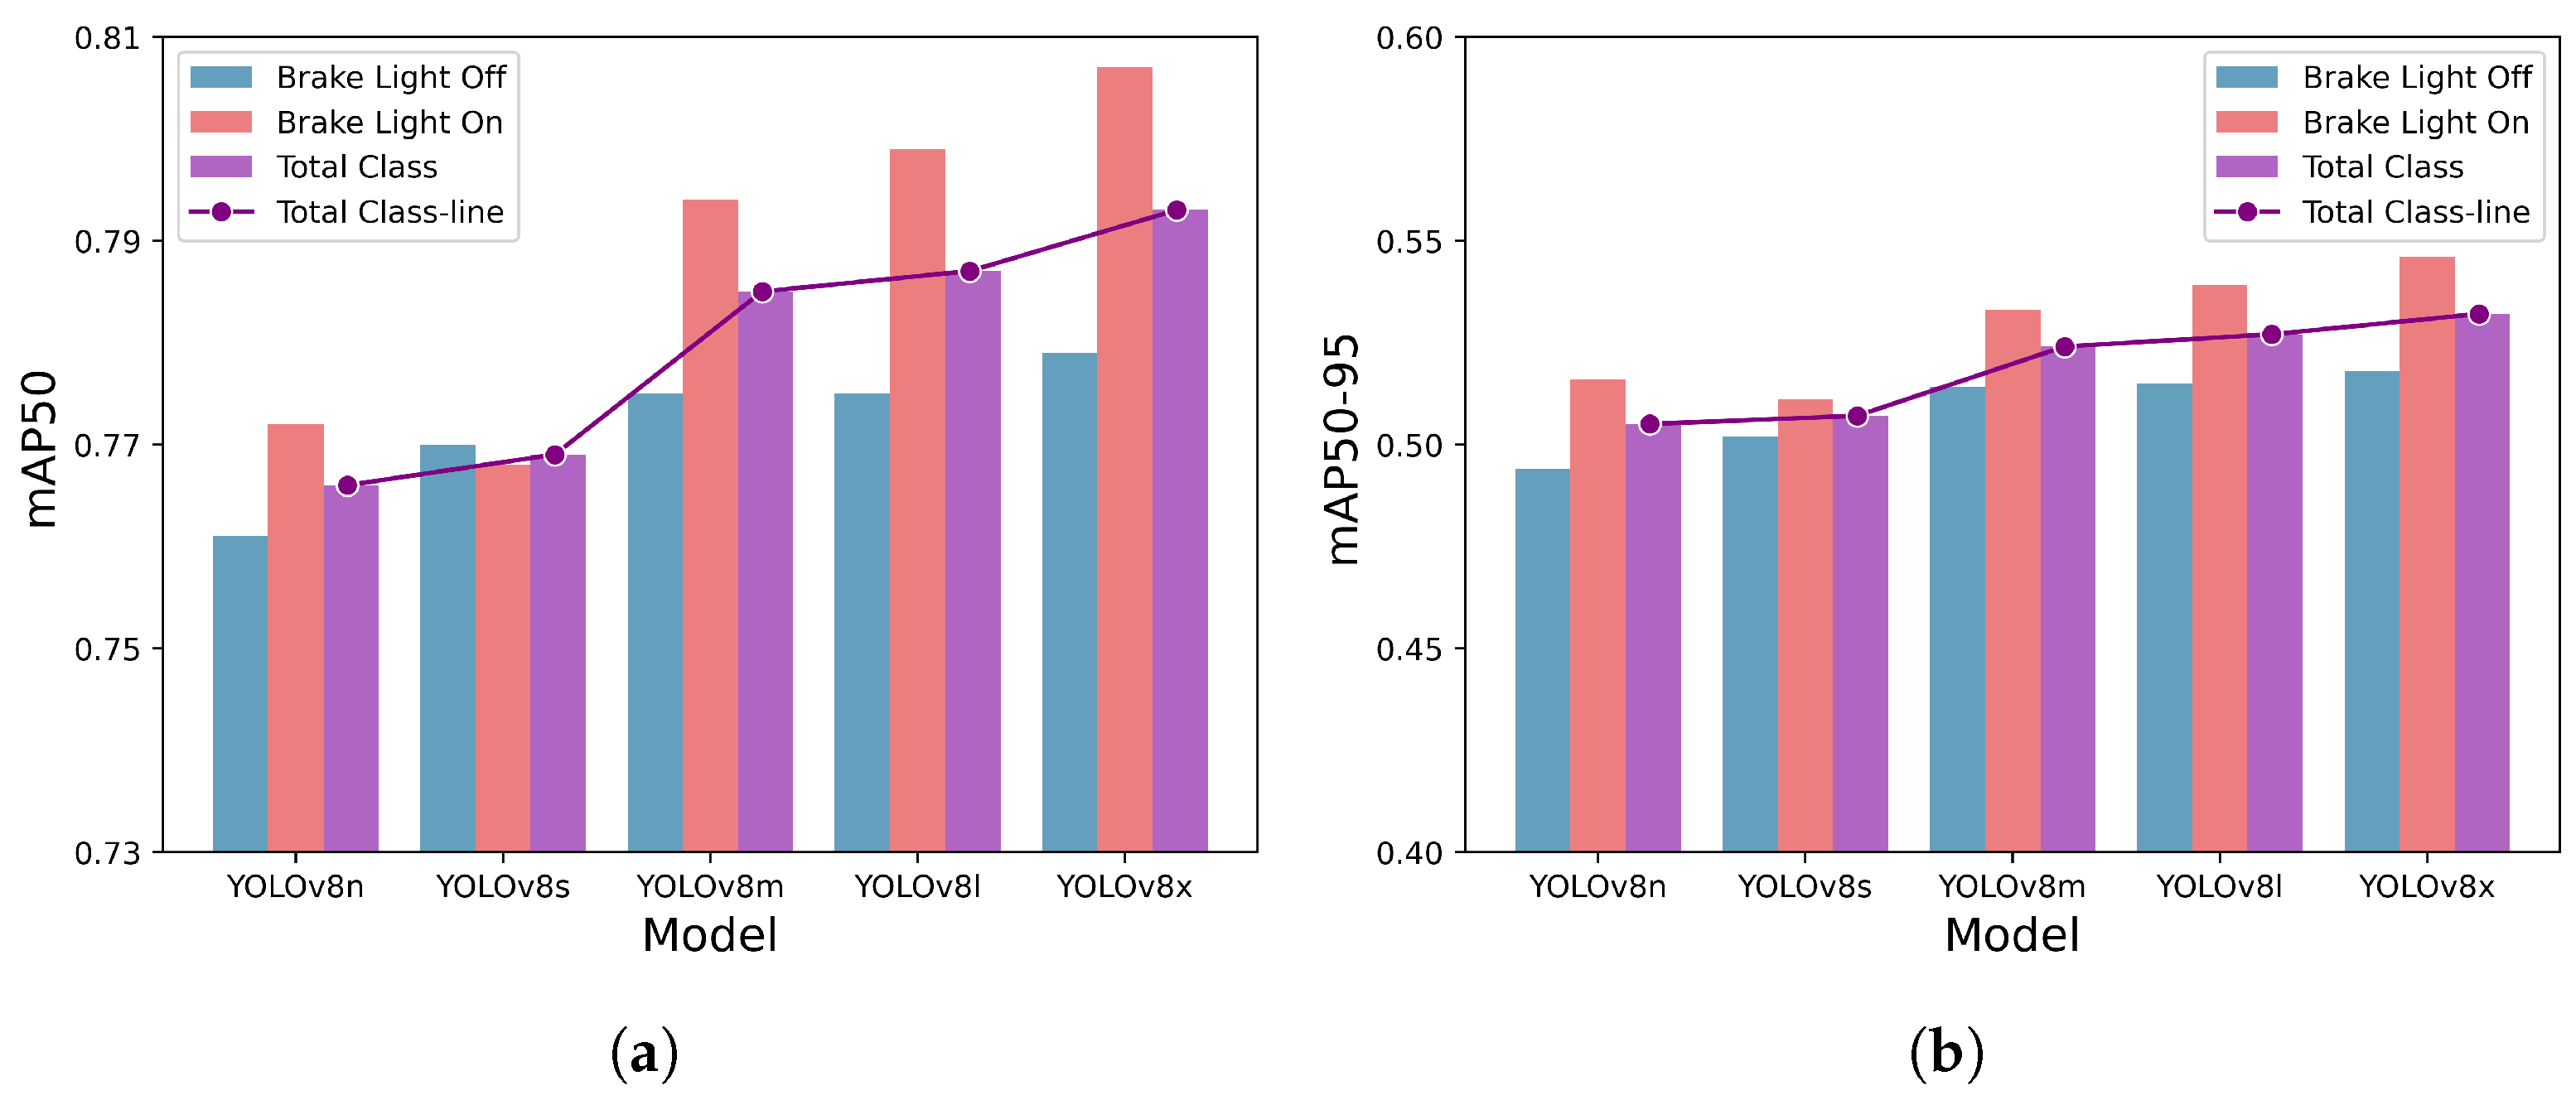
| Model | Class | Precision | Recall | F1 Score | mAP50 | mAP50-95 |
|---|---|---|---|---|---|---|
| YOLOv8n | Brake Light Off | 0.726 | 0.670 | 0.697 | 0.761 | 0.494 |
| Brake Light On | 0.549 | 0.853 | 0.668 | 0.772 | 0.516 | |
| Total | 0.638 | 0.762 | 0.695 | 0.766 | 0.505 | |
| YOLOv8s | Brake Light Off | 0.755 | 0.646 | 0.696 | 0.770 | 0.502 |
| Brake Light On | 0.591 | 0.837 | 0.693 | 0.768 | 0.511 | |
| Total | 0.673 | 0.742 | 0.706 | 0.769 | 0.507 | |
| YOLOv8m | Brake Light Off | 0.755 | 0.650 | 0.699 | 0.775 | 0.514 |
| Brake Light On | 0.579 | 0.839 | 0.685 | 0.794 | 0.533 | |
| Total | 0.667 | 0.745 | 0.704 | 0.785 | 0.524 | |
| YOLOv8l | Brake Light Off | 0.746 | 0.655 | 0.698 | 0.775 | 0.515 |
| Brake Light On | 0.552 | 0.867 | 0.675 | 0.799 | 0.539 | |
| Total | 0.649 | 0.761 | 0.701 | 0.787 | 0.527 | |
| YOLOv8x | Brake Light Off | 0.746 | 0.650 | 0.695 | 0.779 | 0.518 |
| Brake Light On | 0.578 | 0.859 | 0.691 | 0.807 | 0.546 | |
| Total | 0.662 | 0.754 | 0.705 | 0.793 | 0.532 |
| Number of | Day | Night | |
|---|---|---|---|
| Images | 1467 | 1729 | |
| Annotations | 4911 | 5620 | |
| – Brake Light Off () | 3563 | 2436 | |
| – Brake Light On () | 1348 | 3184 | |
| Model | Class | mAP50 | mAP50-95 | ||
|---|---|---|---|---|---|
| Day | Night | Day | Night | ||
| YOLOv8n | Brake Light Off | 0.808 | 0.671 | 0.563 | 0.366 |
| Brake Light On | 0.699 | 0.803 | 0.473 | 0.536 | |
| Total | 0.753 | 0.737 | 0.518 | 0.451 | |
| YOLOv8s | Brake Light Off | 0.821 | 0.675 | 0.574 | 0.369 |
| Brake Light On | 0.692 | 0.804 | 0.466 | 0.535 | |
| Total | 0.757 | 0.739 | 0.520 | 0.452 | |
| YOLOv8m | Brake Light Off | 0.822 | 0.692 | 0.587 | 0.382 |
| Brake Light On | 0.729 | 0.824 | 0.500 | 0.550 | |
| Total | 0.776 | 0.758 | 0.544 | 0.466 | |
| YOLOv8l | Brake Light Off | 0.821 | 0.694 | 0.588 | 0.383 |
| Brake Light On | 0.733 | 0.827 | 0.509 | 0.554 | |
| Total | 0.777 | 0.761 | 0.549 | 0.468 | |
| YOLOv8x | Brake Light Off | 0.825 | 0.707 | 0.590 | 0.393 |
| Brake Light On | 0.740 | 0.836 | 0.515 | 0.562 | |
| Total | 0.782 | 0.772 | 0.552 | 0.477 | |
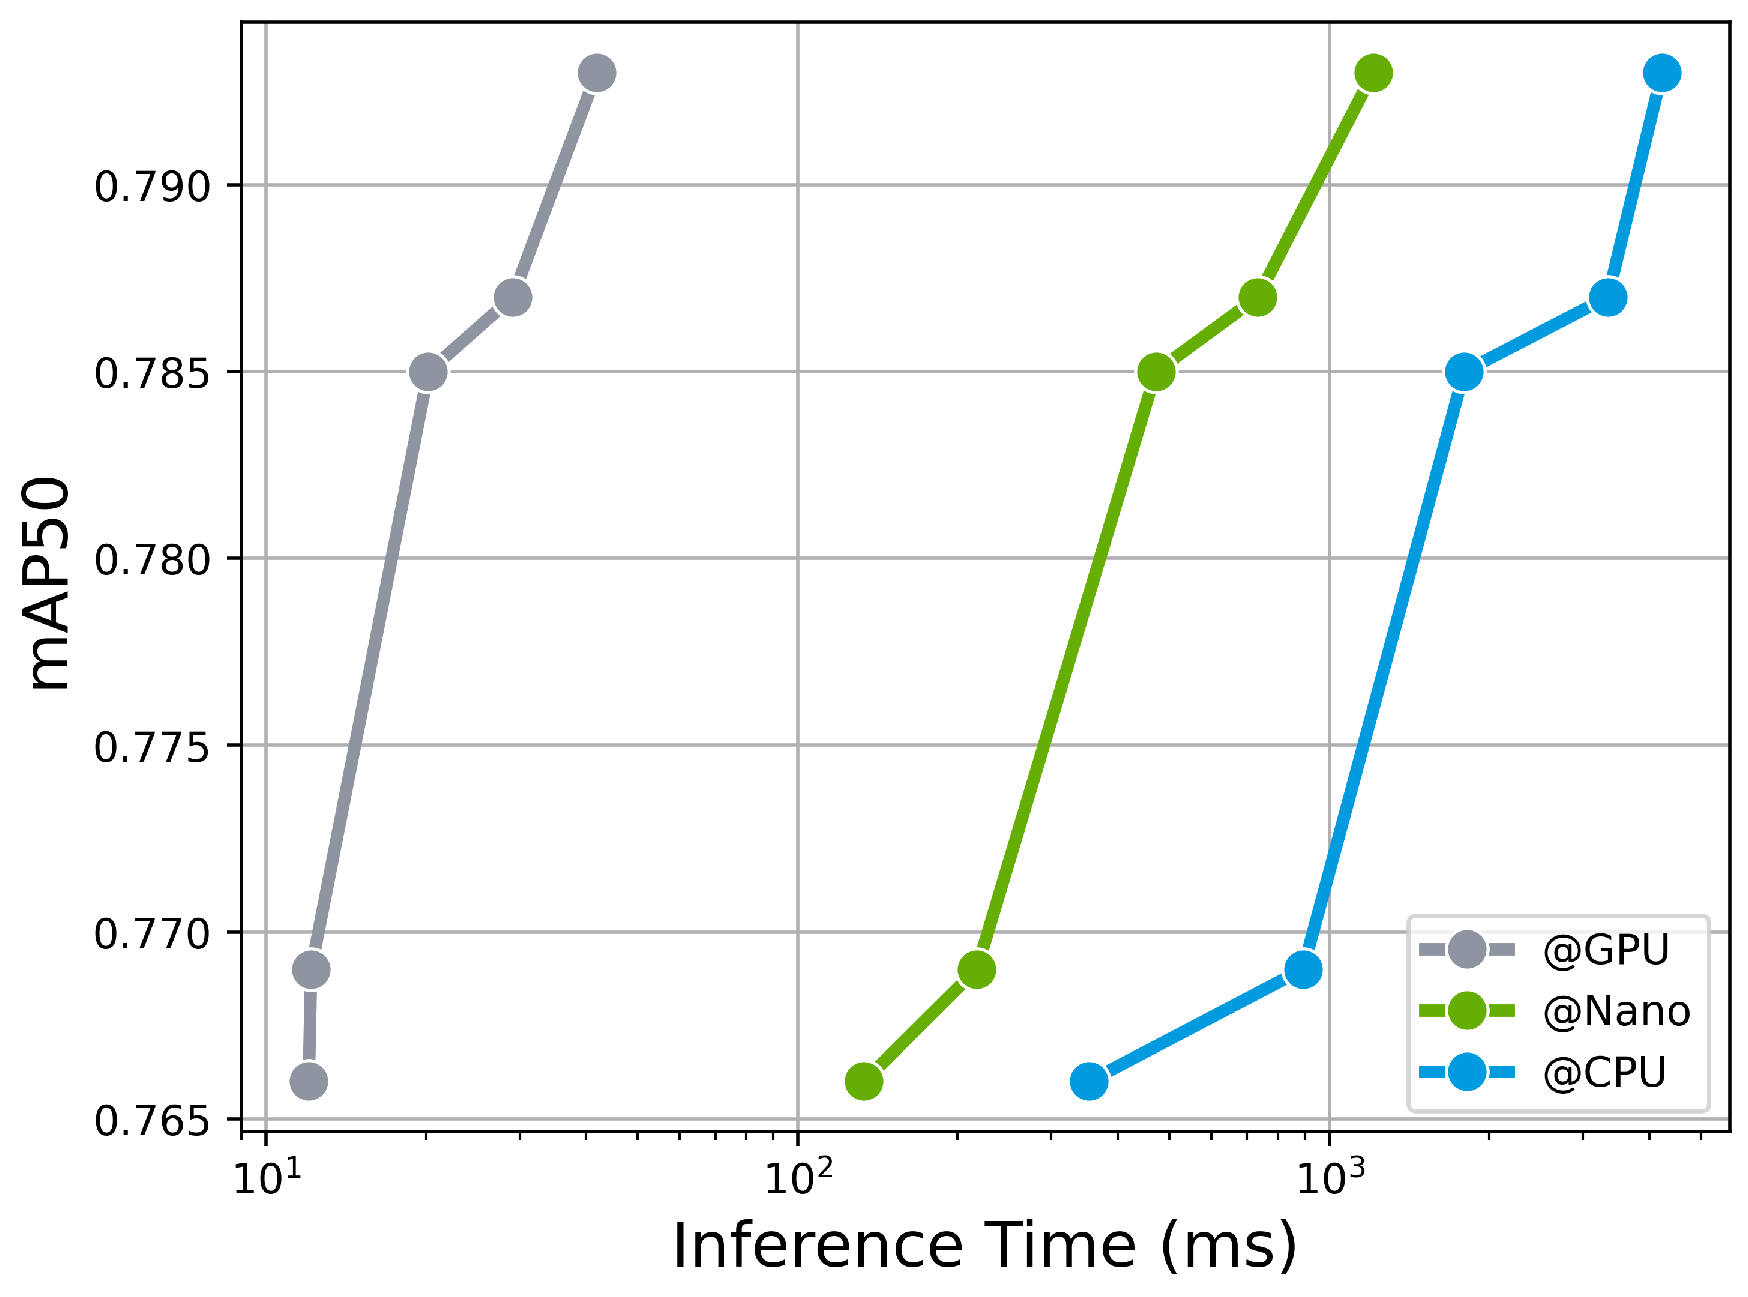
| Model | Inference Time (ms) ONNX @Nano | ONNX @GPU | ONNX @CPU |
|---|---|---|---|
| YOLOv8n | 12.04 | 133.30 | 353.13 |
| YOLOv8s | 12.16 | 217.20 | 891.93 |
| YOLOv8m | 20.20 | 471.59 | 1792.31 |
| YOLOv8l | 29.09 | 733.27 | 3340.26 |
| YOLOv8x | 41.87 | 1208.69 | 4222.87 |
| Study | Proposed Work | Dataset | Brake Light Detection | Evaluation | ||||
|---|---|---|---|---|---|---|---|---|
| # Data | # Samples | Condition | Classification | Localization | Performance | Inference Time (ms) | ||
| Cui et al. [13] | HOG, SVM | 10,000 images | – | D | Turned On | 0.75 (Detection rate) | N/T | |
| Nava et al. [14] | YOLO, SVM | 9700 images | 9700 | D | Turned On/Off | 0.95 (F1 score) | N/T | |
| Pirhonen et al. [15] | YOLOv3, RF | 822 images | 822 | D | Turned On/Off | 0.82 (Accuracy) | N/T | |
| Wang et al. [16] | HOG, CNN | 5600 images | 5600 | D | Turned On | 0.89 (Accuracy) | N/T | |
| Kim [18] | YOLOv4, CNN, LSTM | 189 videos | – | T | Turned On/Off | 0.91 (Accuracy) | N/T | |
| Li et al. [17] | YOLOv3 tiny (w/SPP) | 4618 images | 15,197 | D, N | Turned On | ✓ | 0.89 (mAP50) | 15.87 (GTX-1060) |
| Ours | YOLOv8n | 11,088 images | 30,444 | D, N, T | Turned On/Off | ✓ | 0.76 (mAP50) | 12.04 (Tesla T4) 133.30 (Jetson Nano) |
Disclaimer/Publisher’s Note: The statements, opinions and data contained in all publications are solely those of the individual author(s) and contributor(s) and not of MDPI and/or the editor(s). MDPI and/or the editor(s) disclaim responsibility for any injury to people or property resulting from any ideas, methods, instructions or products referred to in the content. |
© 2023 by the authors. Licensee MDPI, Basel, Switzerland. This article is an open access article distributed under the terms and conditions of the Creative Commons Attribution (CC BY) license (https://creativecommons.org/licenses/by/4.0/).
Share and Cite
Oh, G.; Lim, S. One-Stage Brake Light Status Detection Based on YOLOv8. Sensors 2023, 23, 7436. https://doi.org/10.3390/s23177436
Oh G, Lim S. One-Stage Brake Light Status Detection Based on YOLOv8. Sensors. 2023; 23(17):7436. https://doi.org/10.3390/s23177436
Chicago/Turabian StyleOh, Geesung, and Sejoon Lim. 2023. "One-Stage Brake Light Status Detection Based on YOLOv8" Sensors 23, no. 17: 7436. https://doi.org/10.3390/s23177436
APA StyleOh, G., & Lim, S. (2023). One-Stage Brake Light Status Detection Based on YOLOv8. Sensors, 23(17), 7436. https://doi.org/10.3390/s23177436