
Intelligent Localization and Deep Human Activity Recognition through IoT Devices

 , , and
Abstract
:1. Introduction
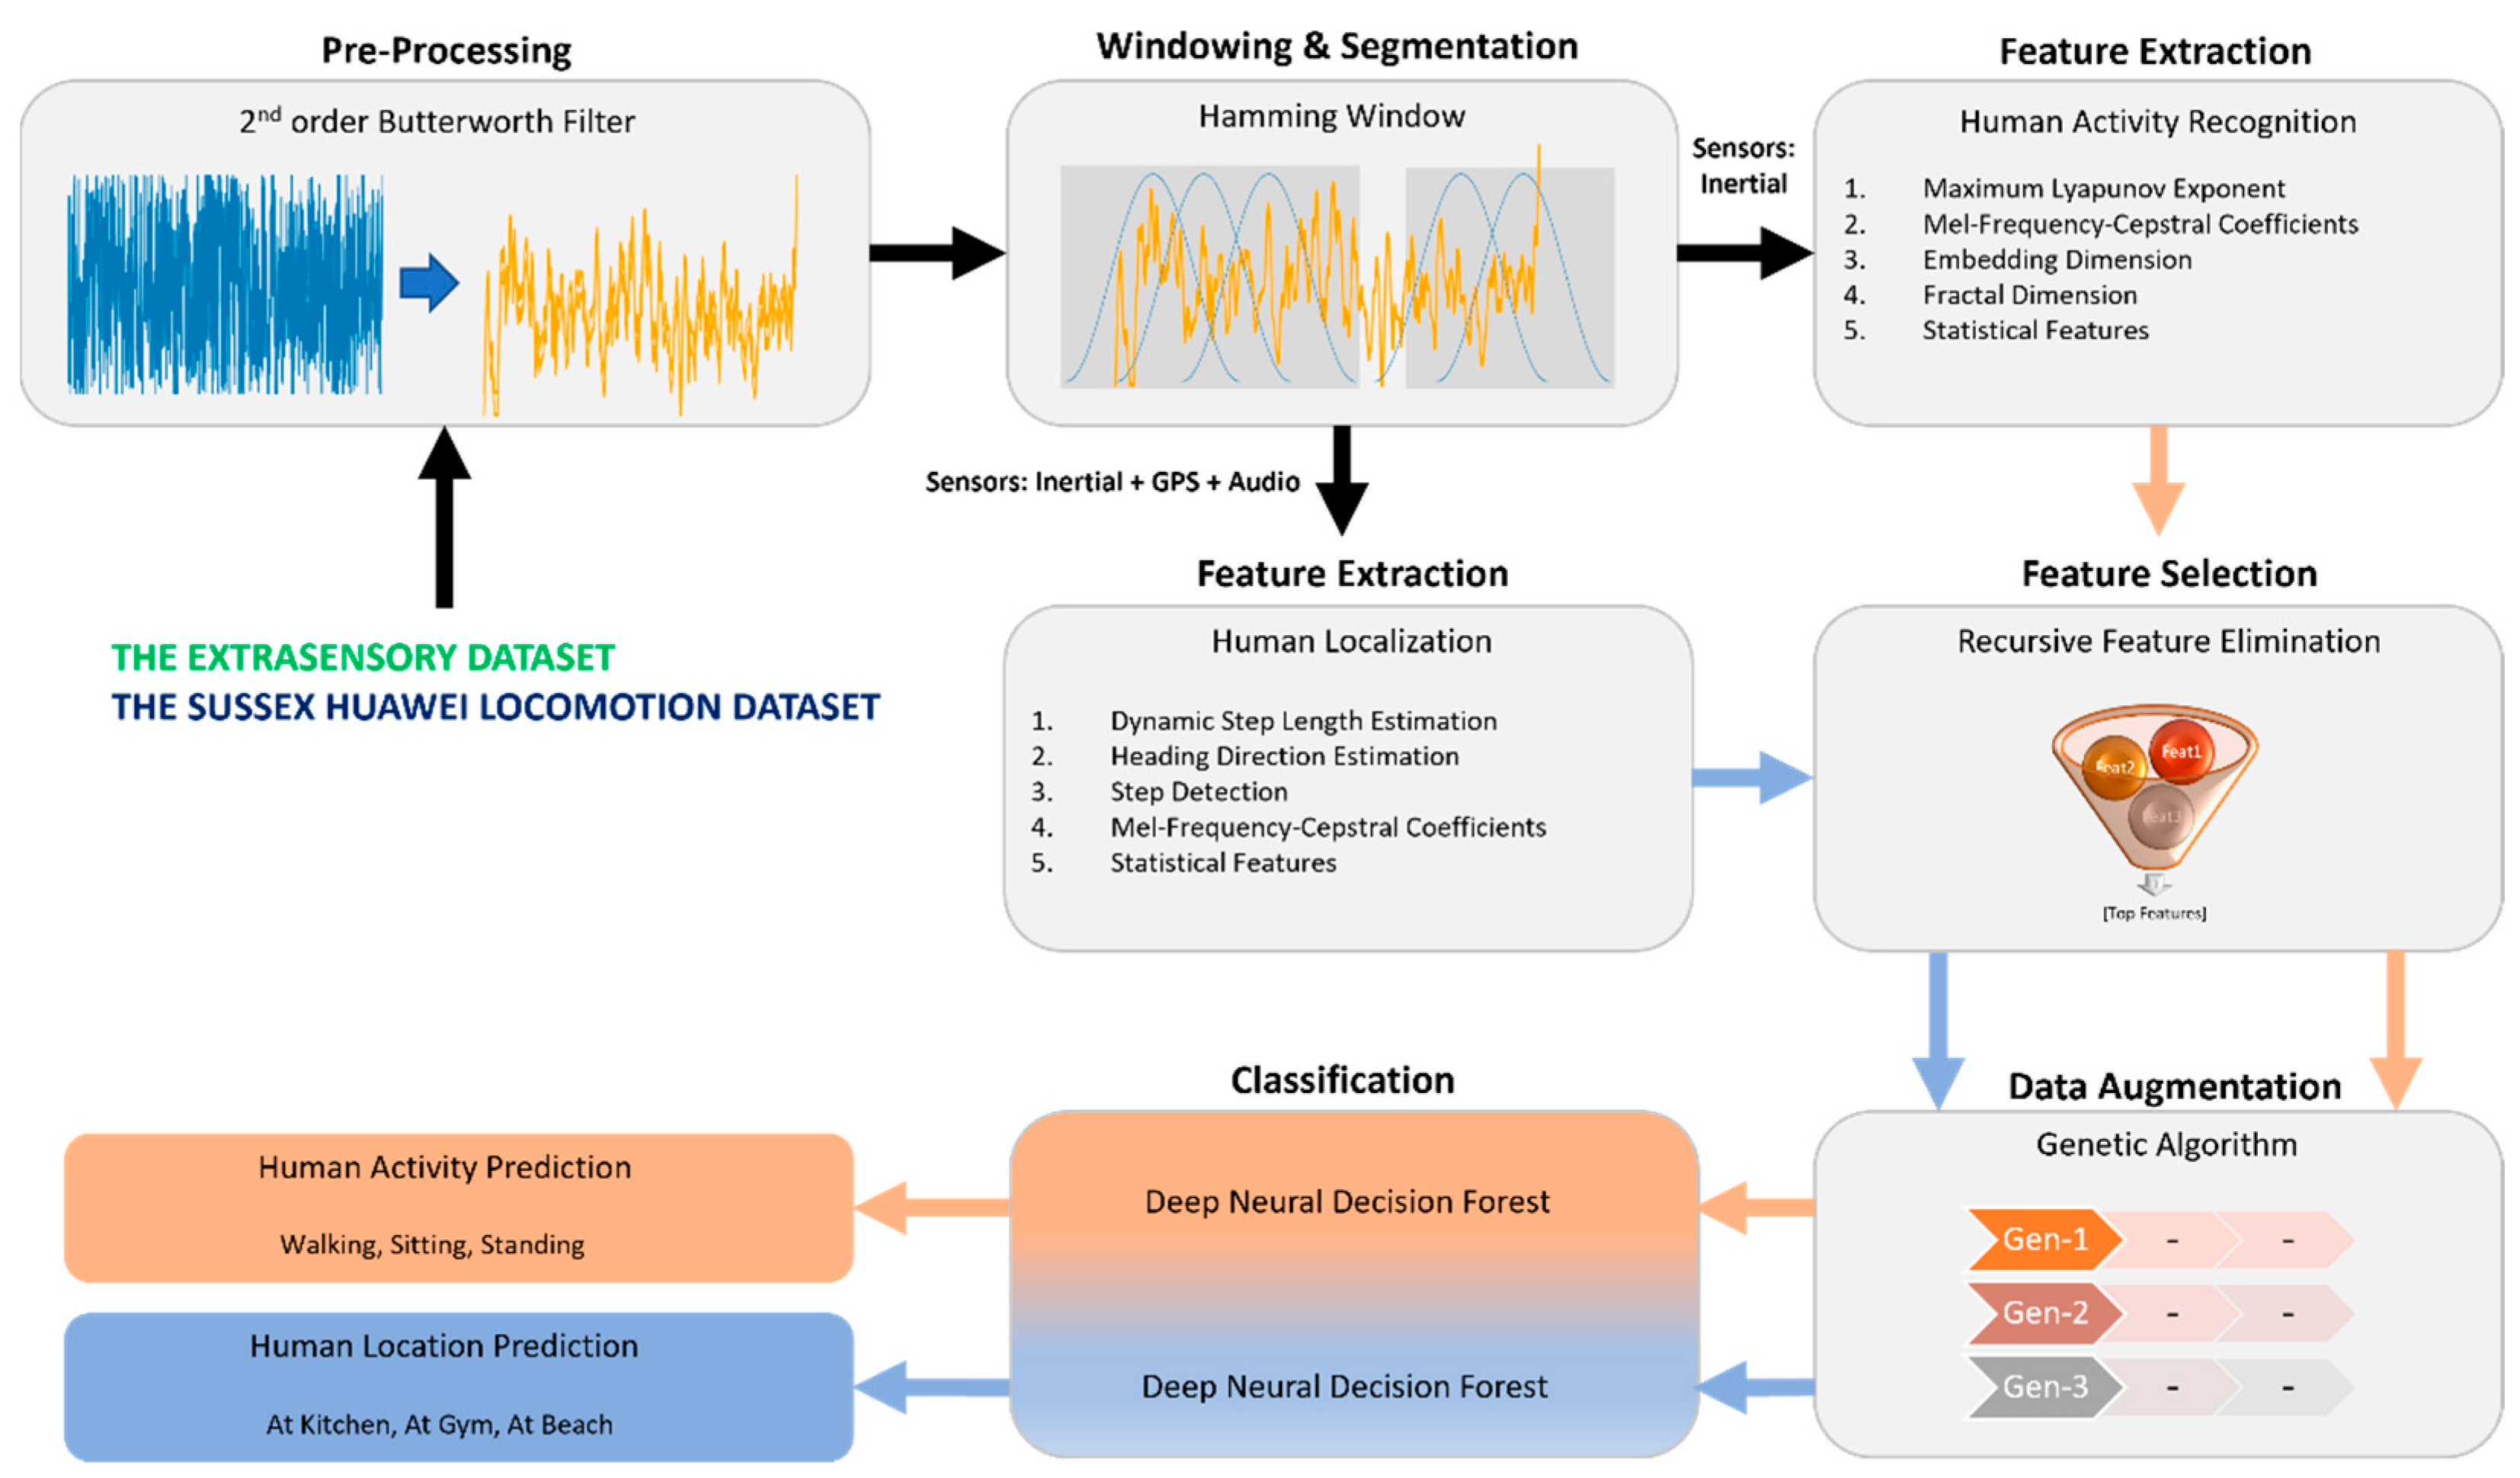
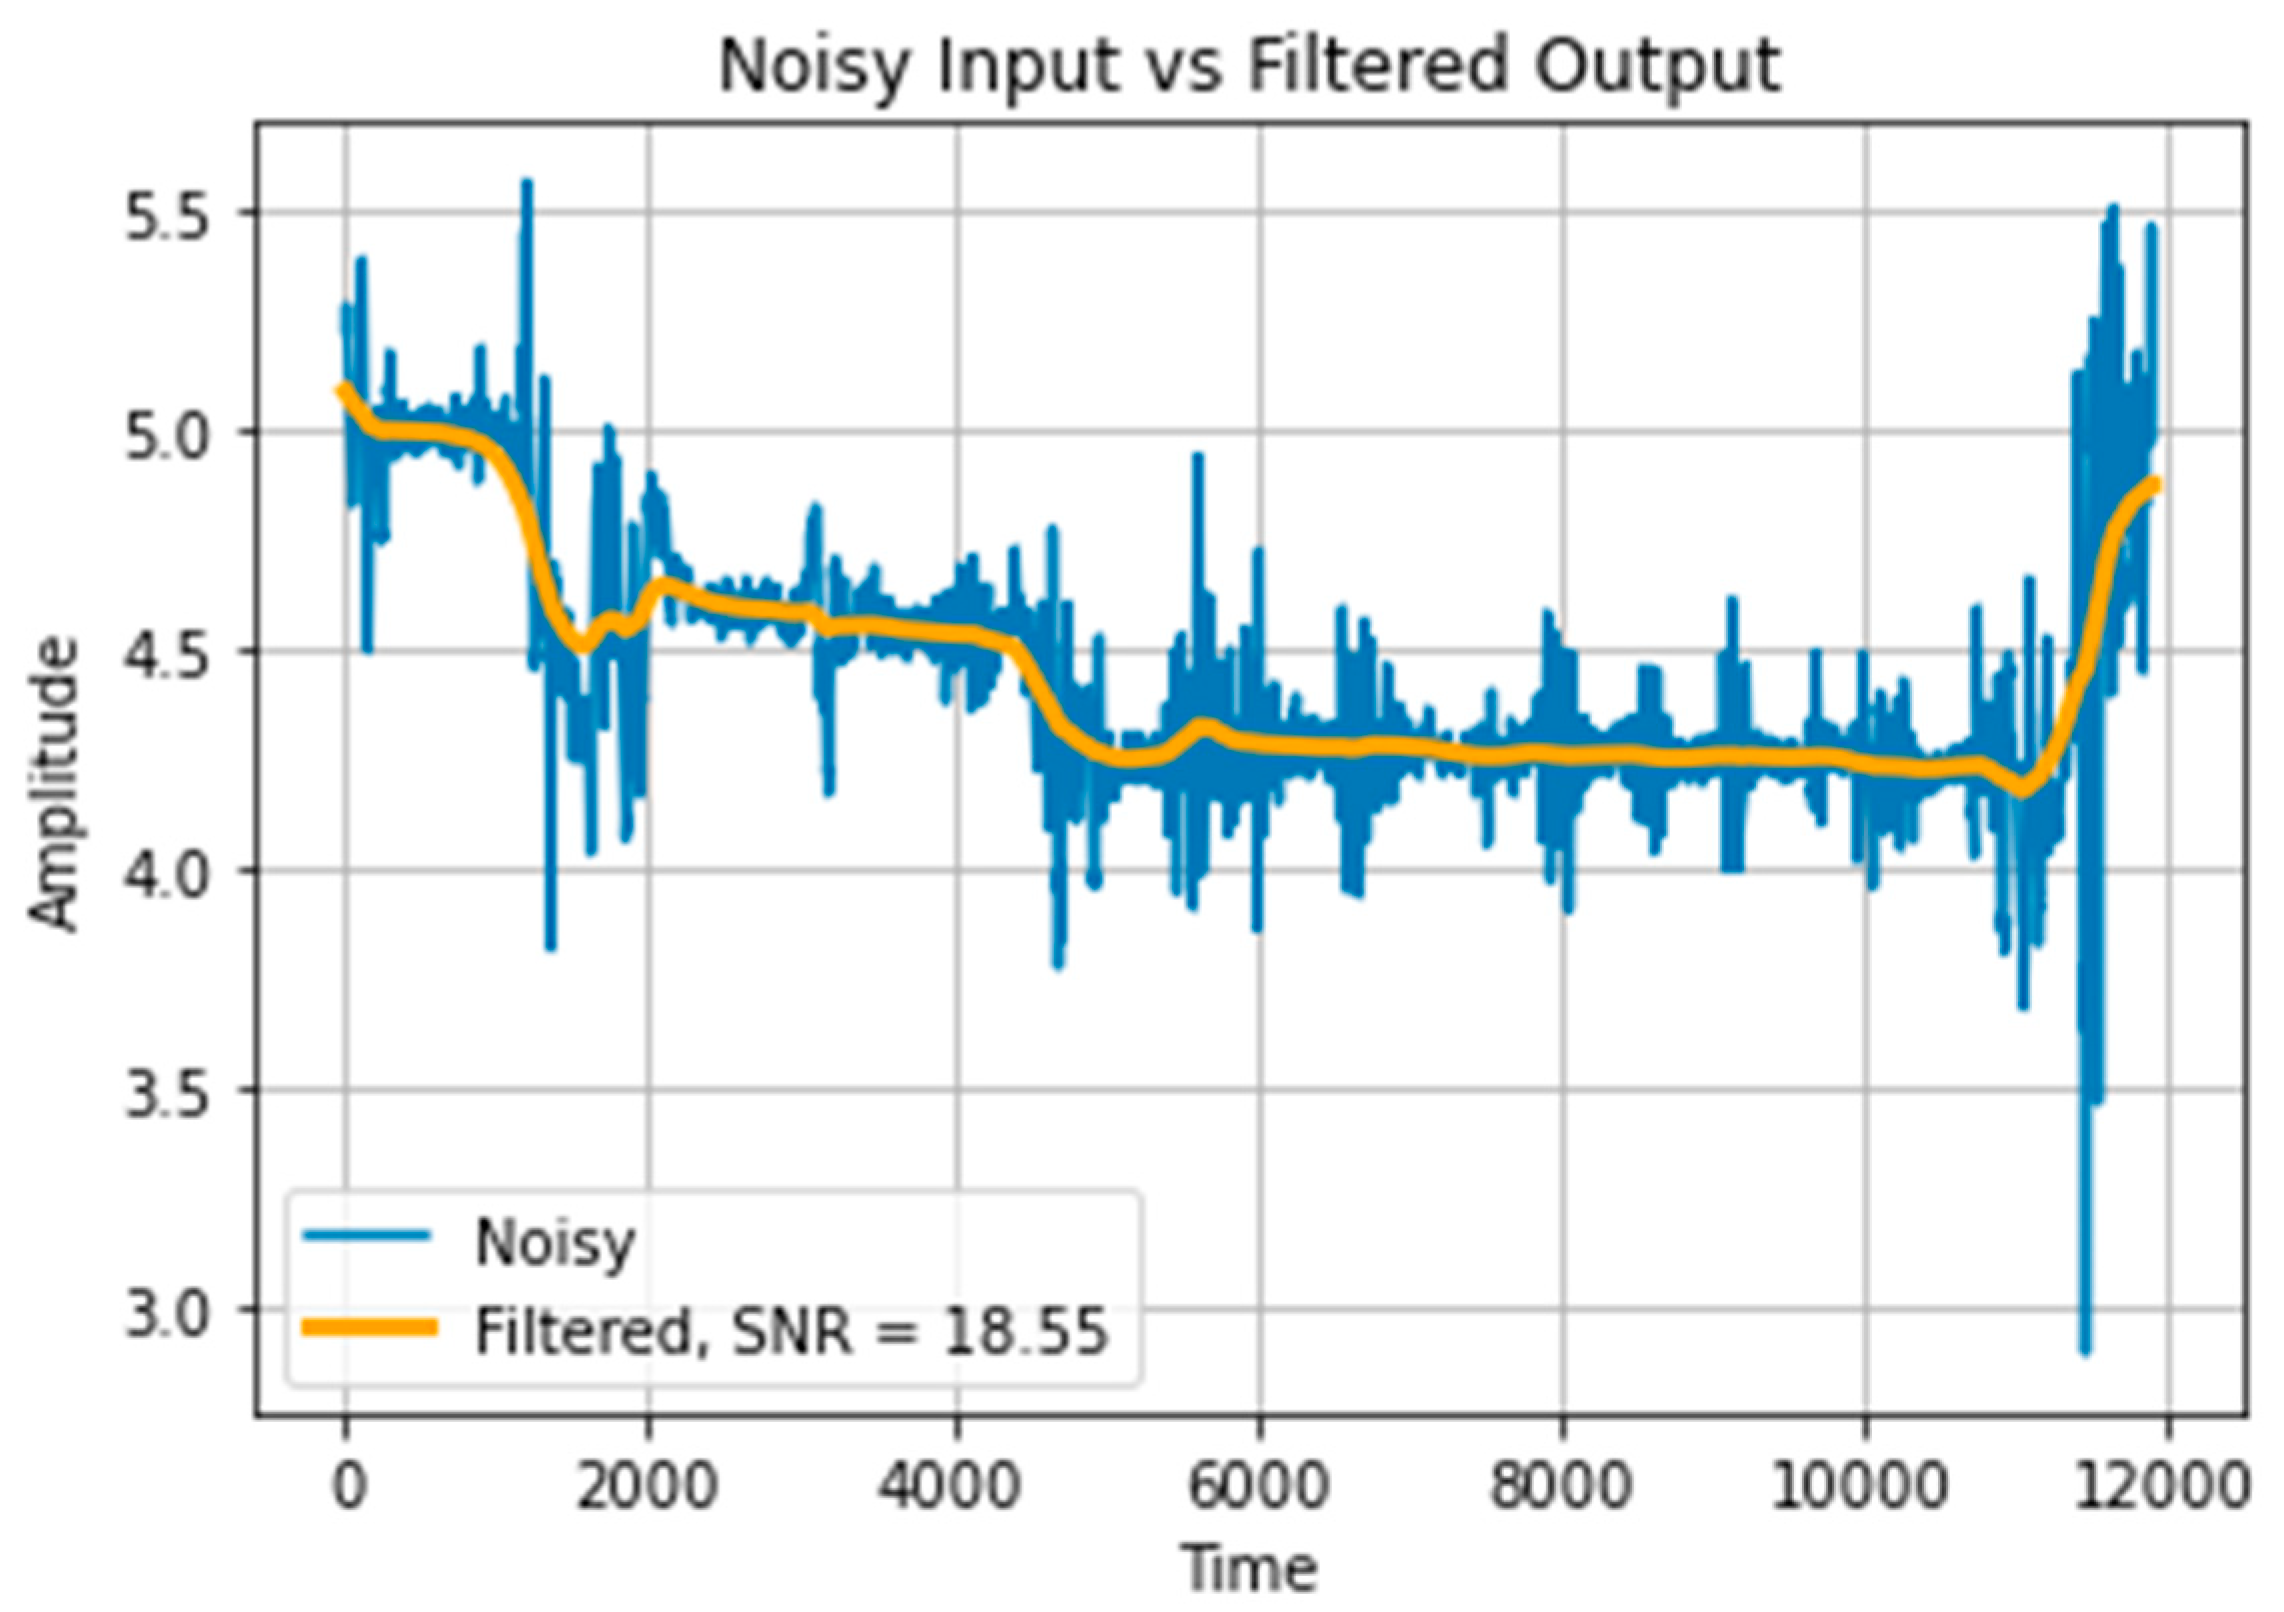
- The system applies effective denoising techniques and windowing to improve the quality of sensor data collected from smartphones and smartwatches. It extracts meaningful features from the processed data, forming a solid foundation for accurate analysis.
- The system employs parallel feature extraction blocks dedicated to human activity recognition and human localization. This parallel processing approach captures relevant features simultaneously, enhancing the system’s accuracy and reliability in recognizing activities and locating the human subject.
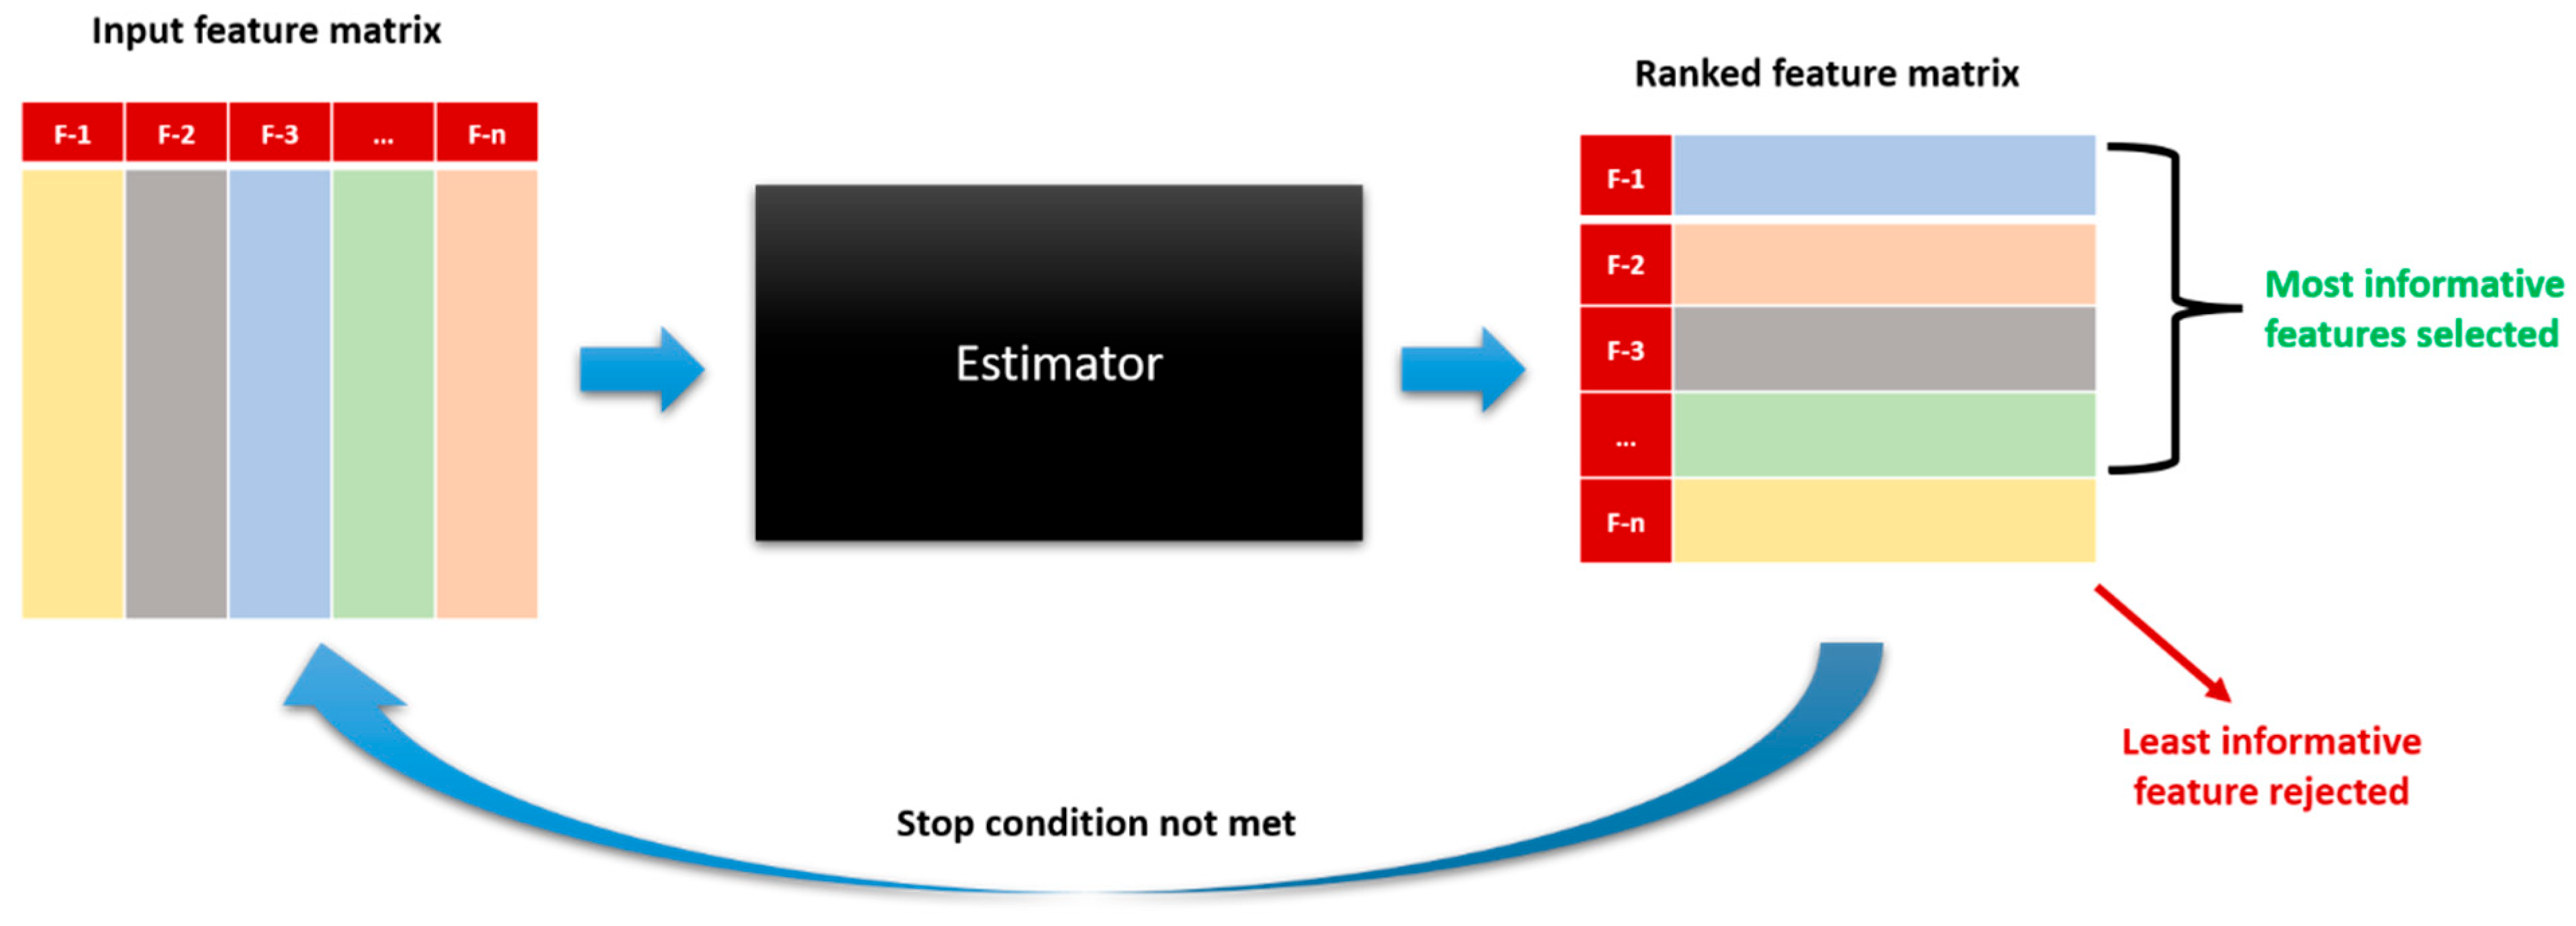
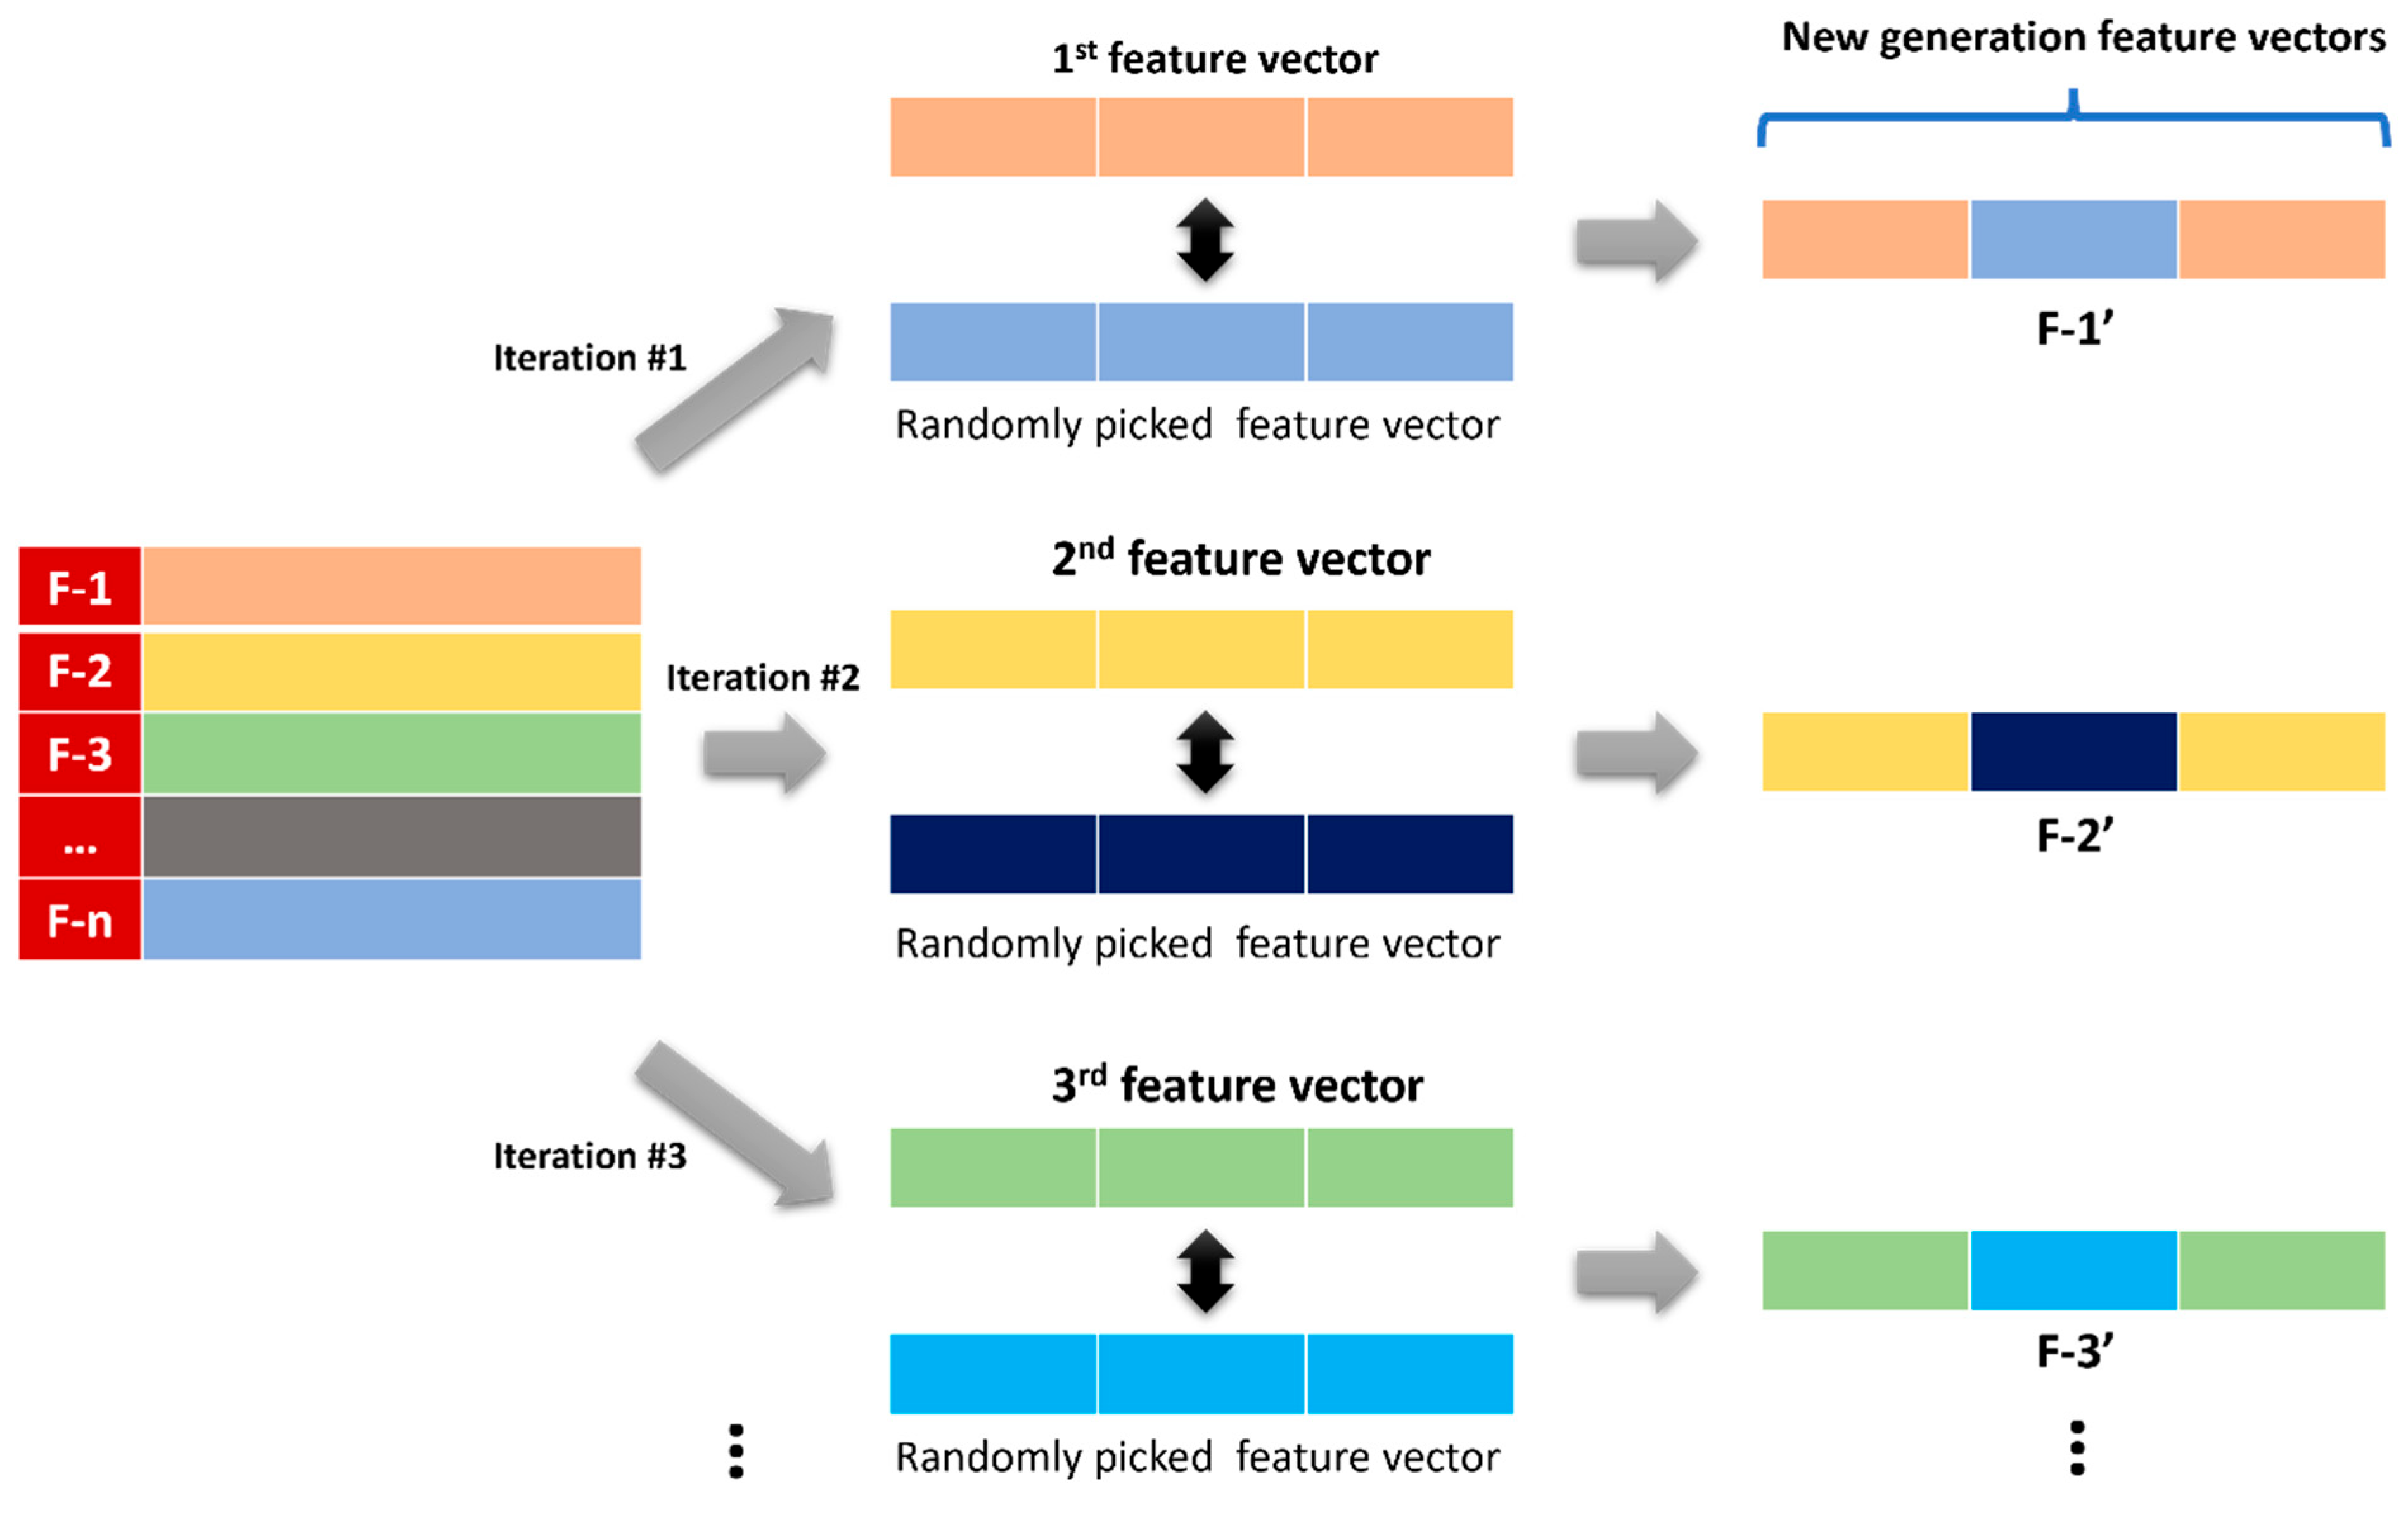
- To improve feature selection, the system independently utilizes recursive feature elimination for activity recognition and localization modules. This iterative process selects the most informative features, reducing redundancy and noise. Additionally, a genetic-algorithm-based data augmentation technique generates diverse feature vectors, enhancing the system’s performance and generalization capabilities.
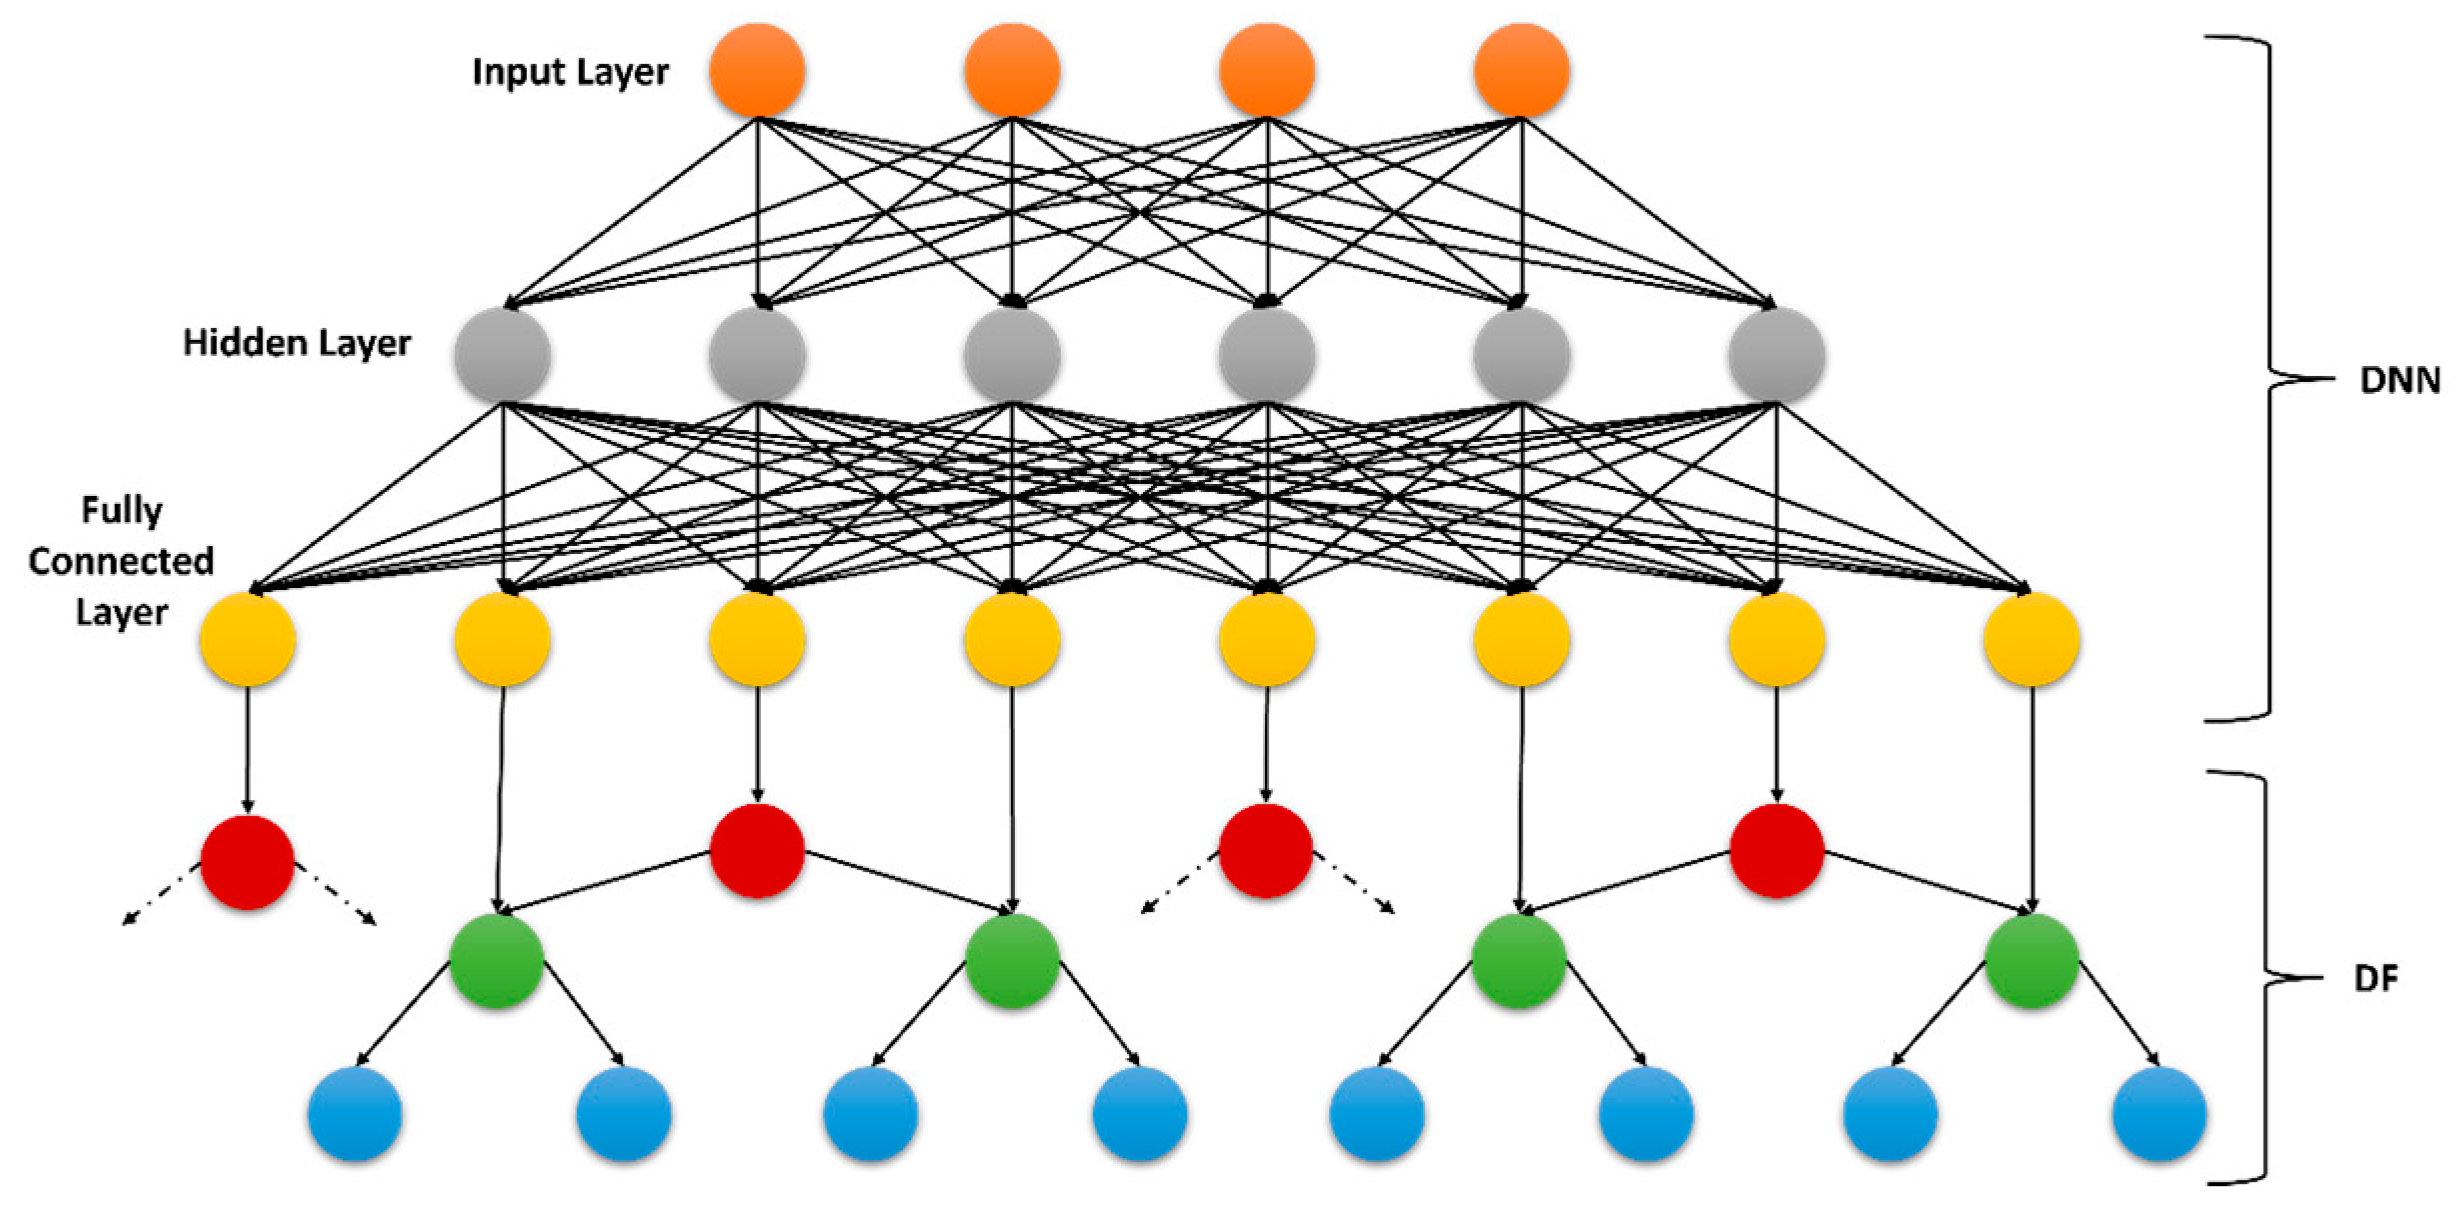
- The system uses advanced classification algorithms, such as the deep neural decision forest for activity classification and support vector machine for human localization. These algorithms provide powerful modeling capabilities, allowing the system to handle complex activity patterns and achieve a high accuracy in recognition and localization tasks.
2. Literature Review
Human Activity Recognition and Localization Using IoT Data
3. Materials and Methods
3.1. System Methodology
3.2. Pre-Processing
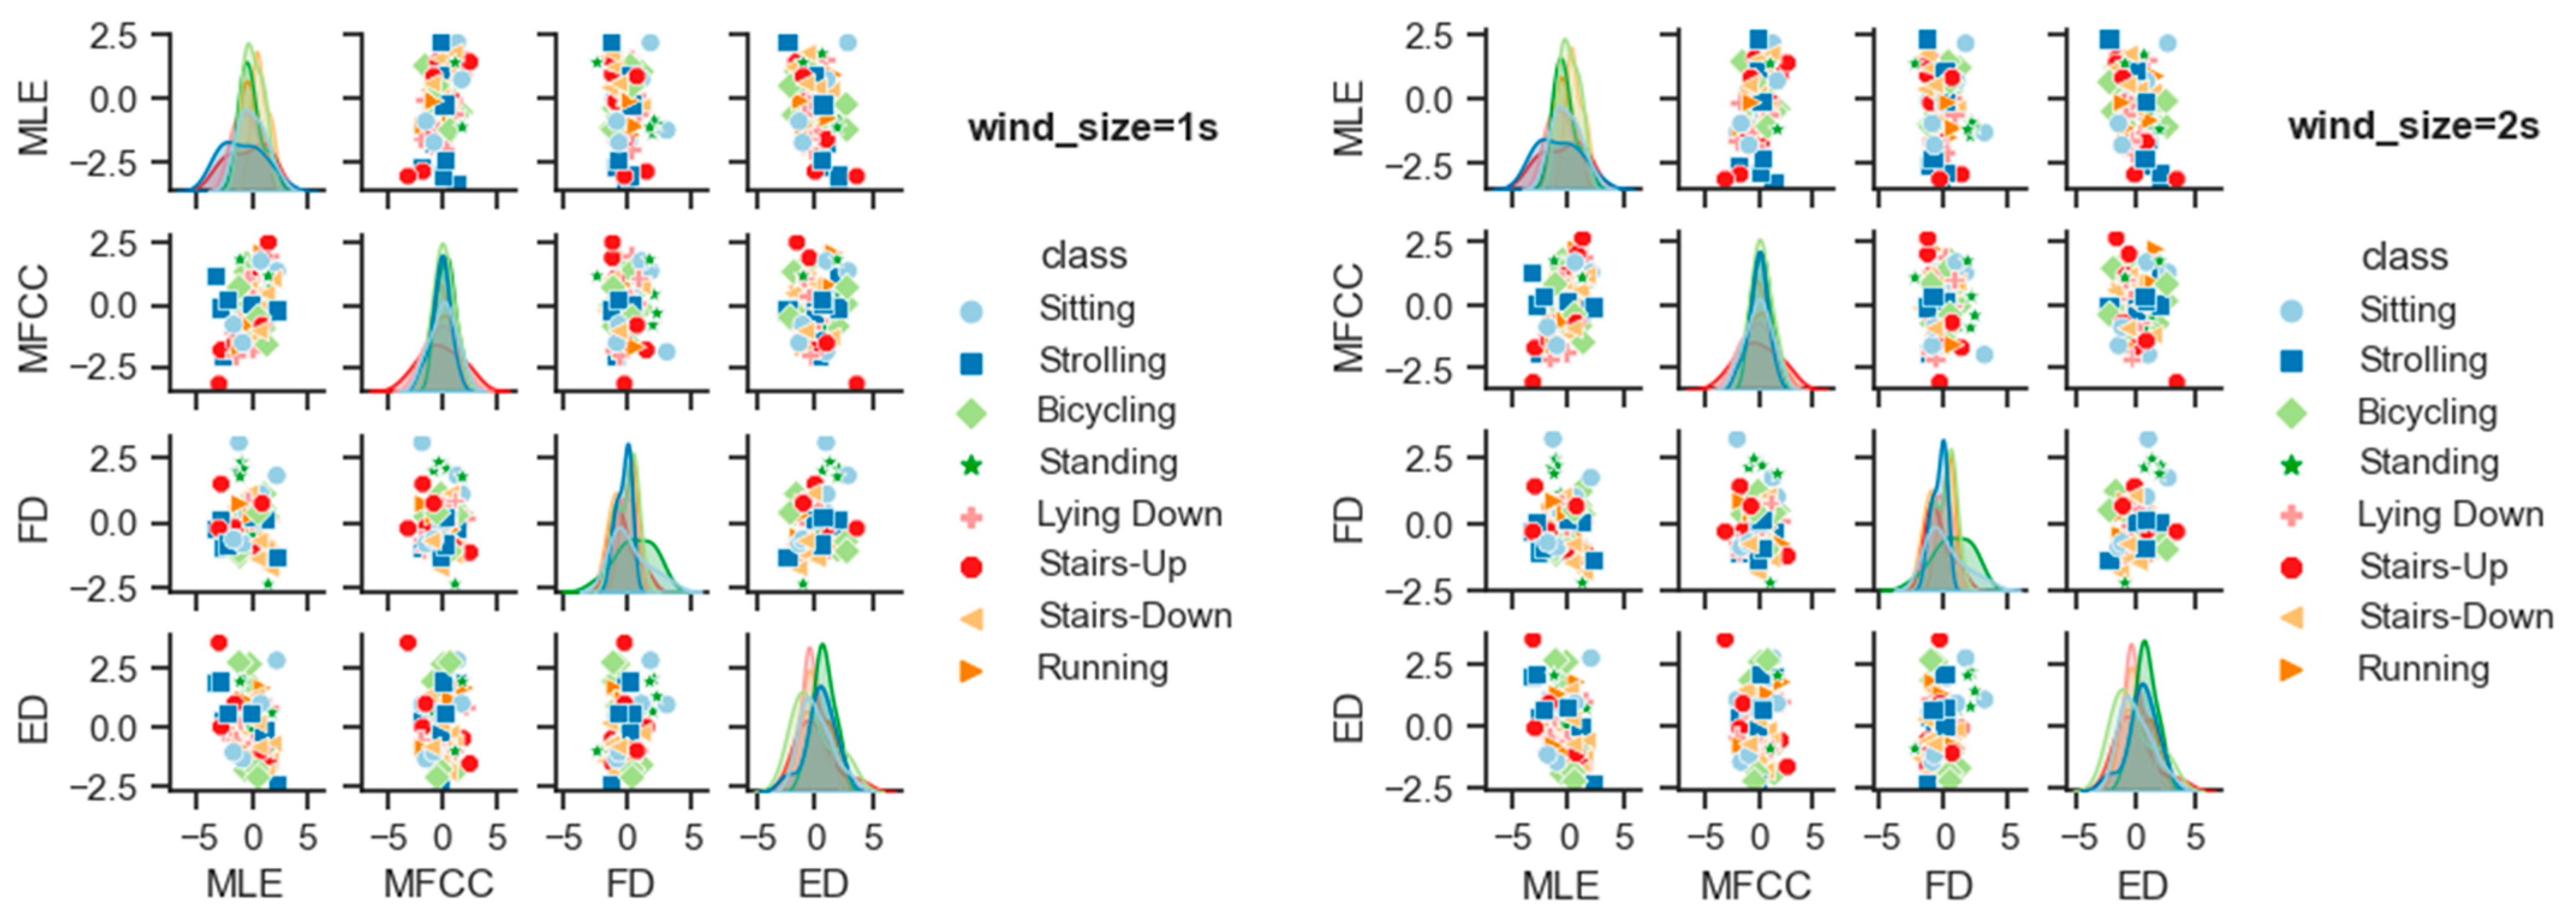
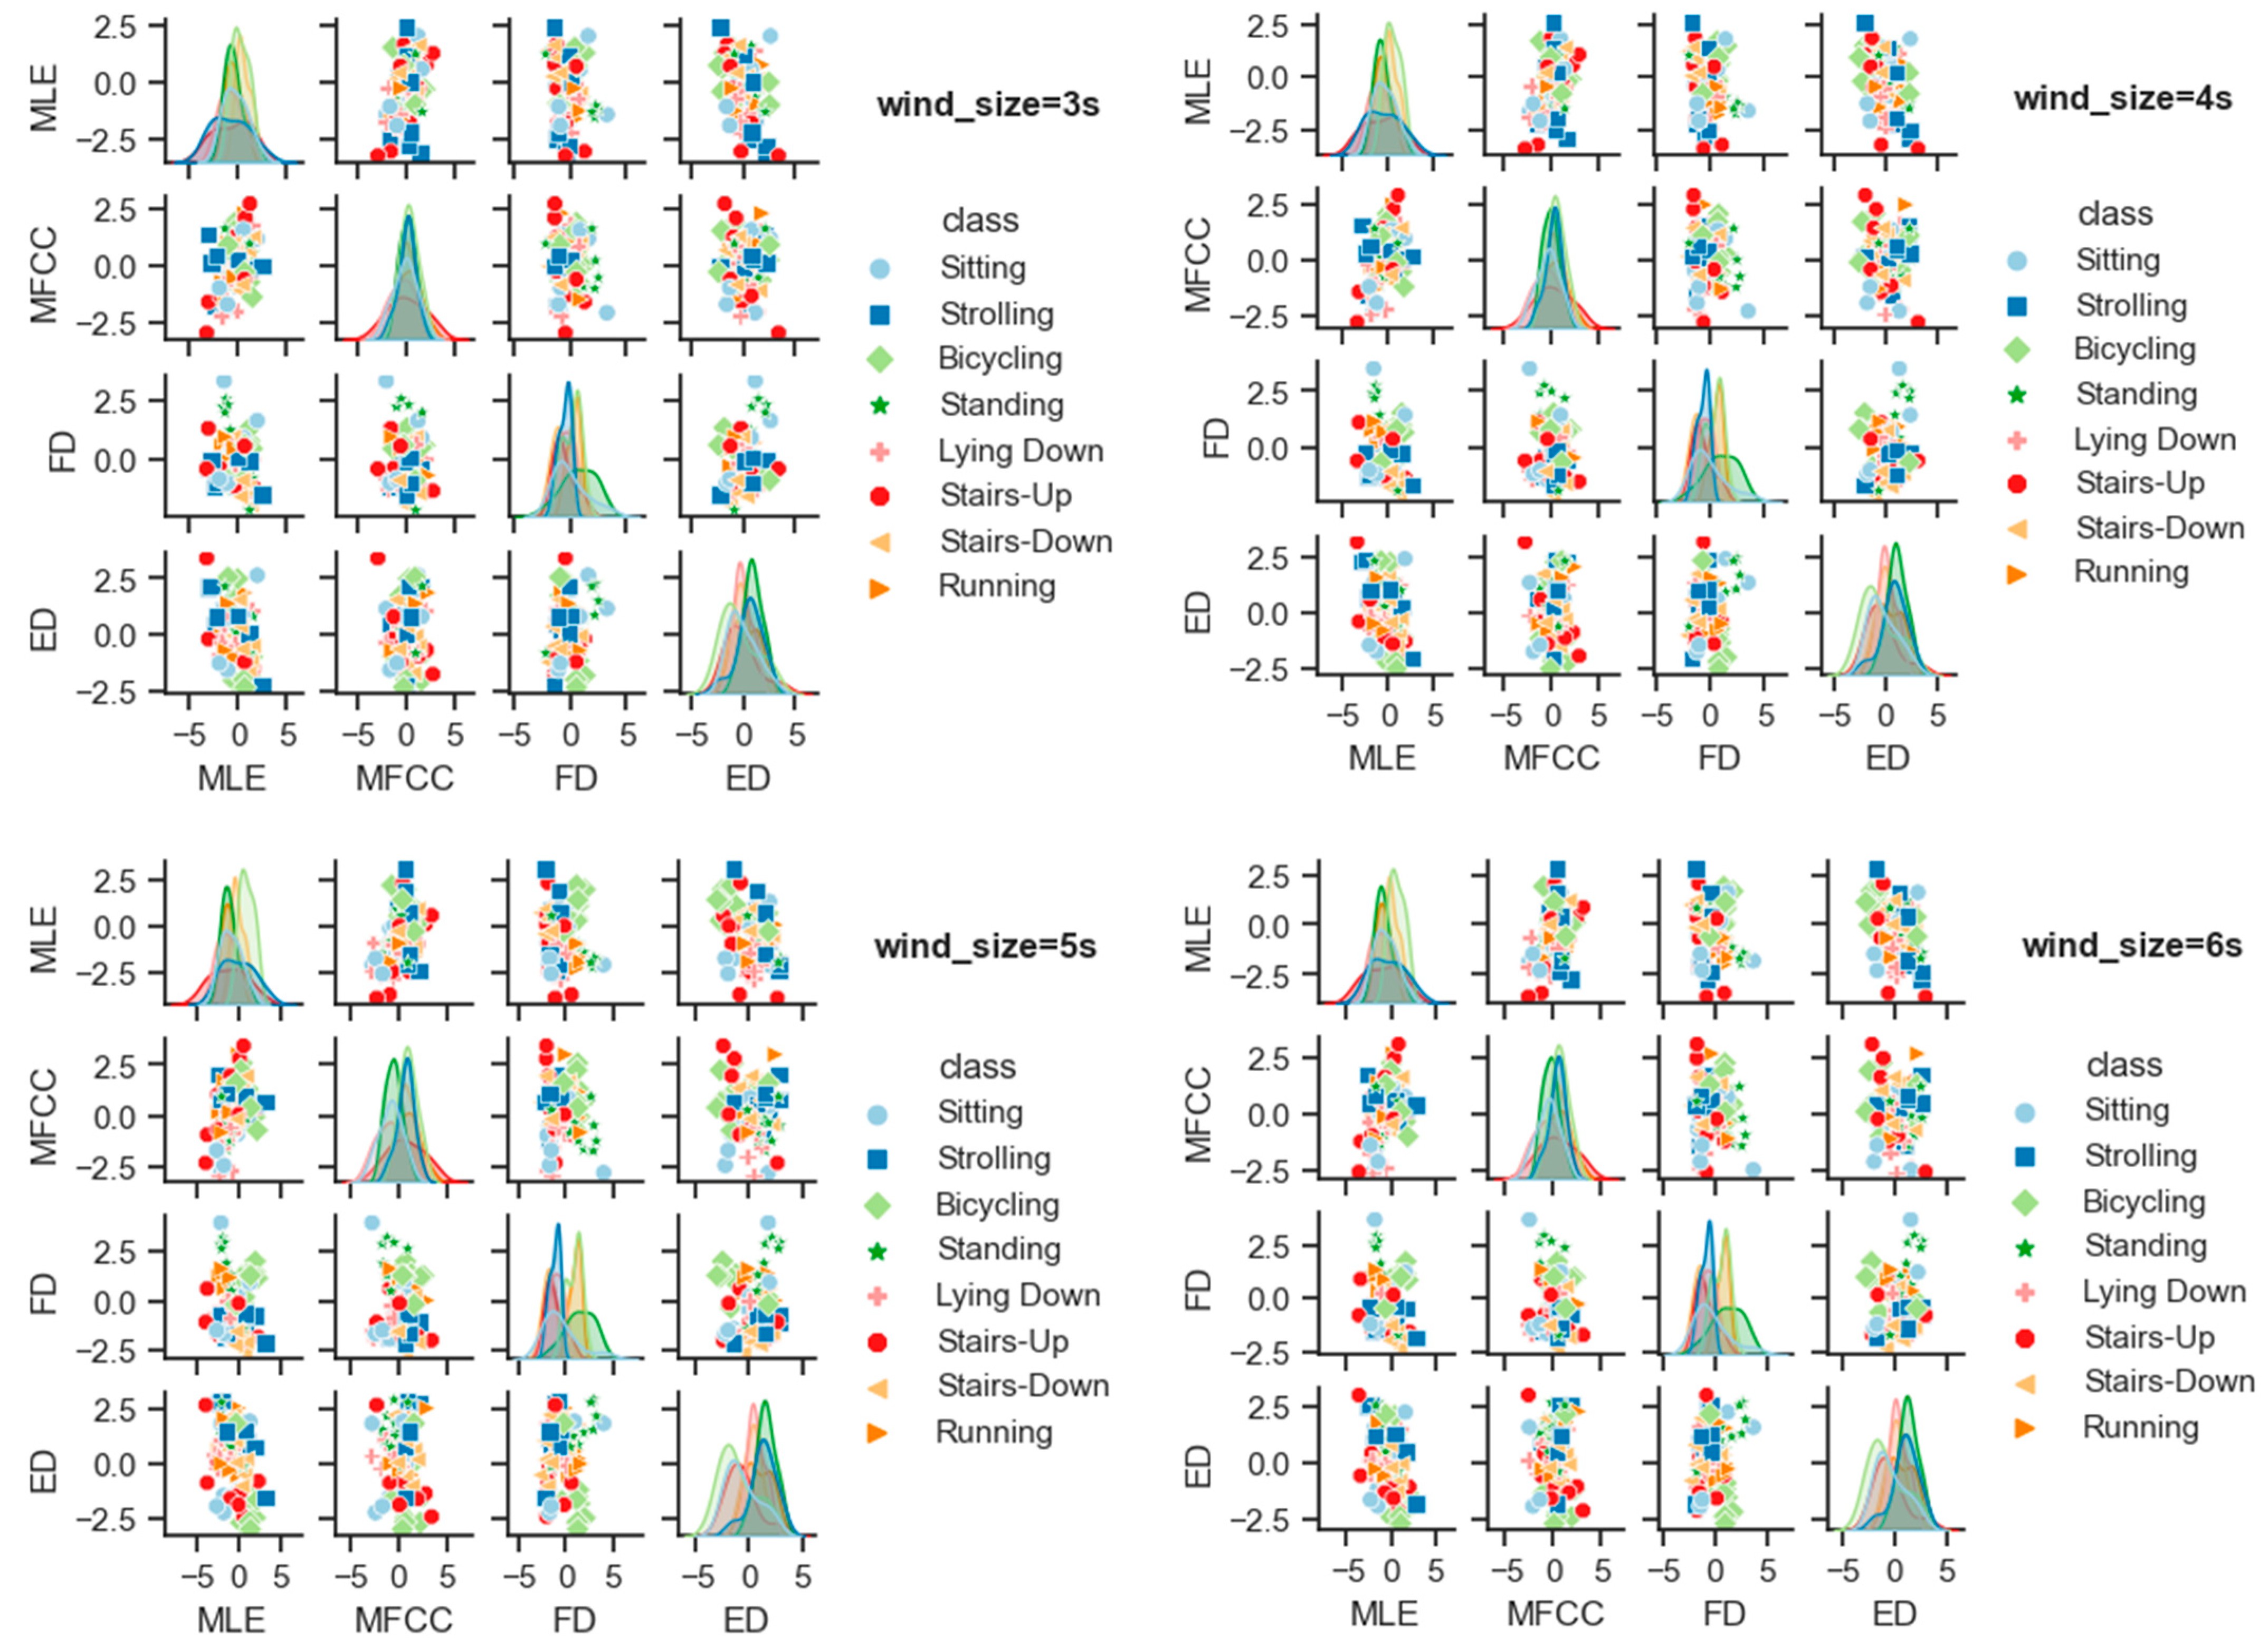
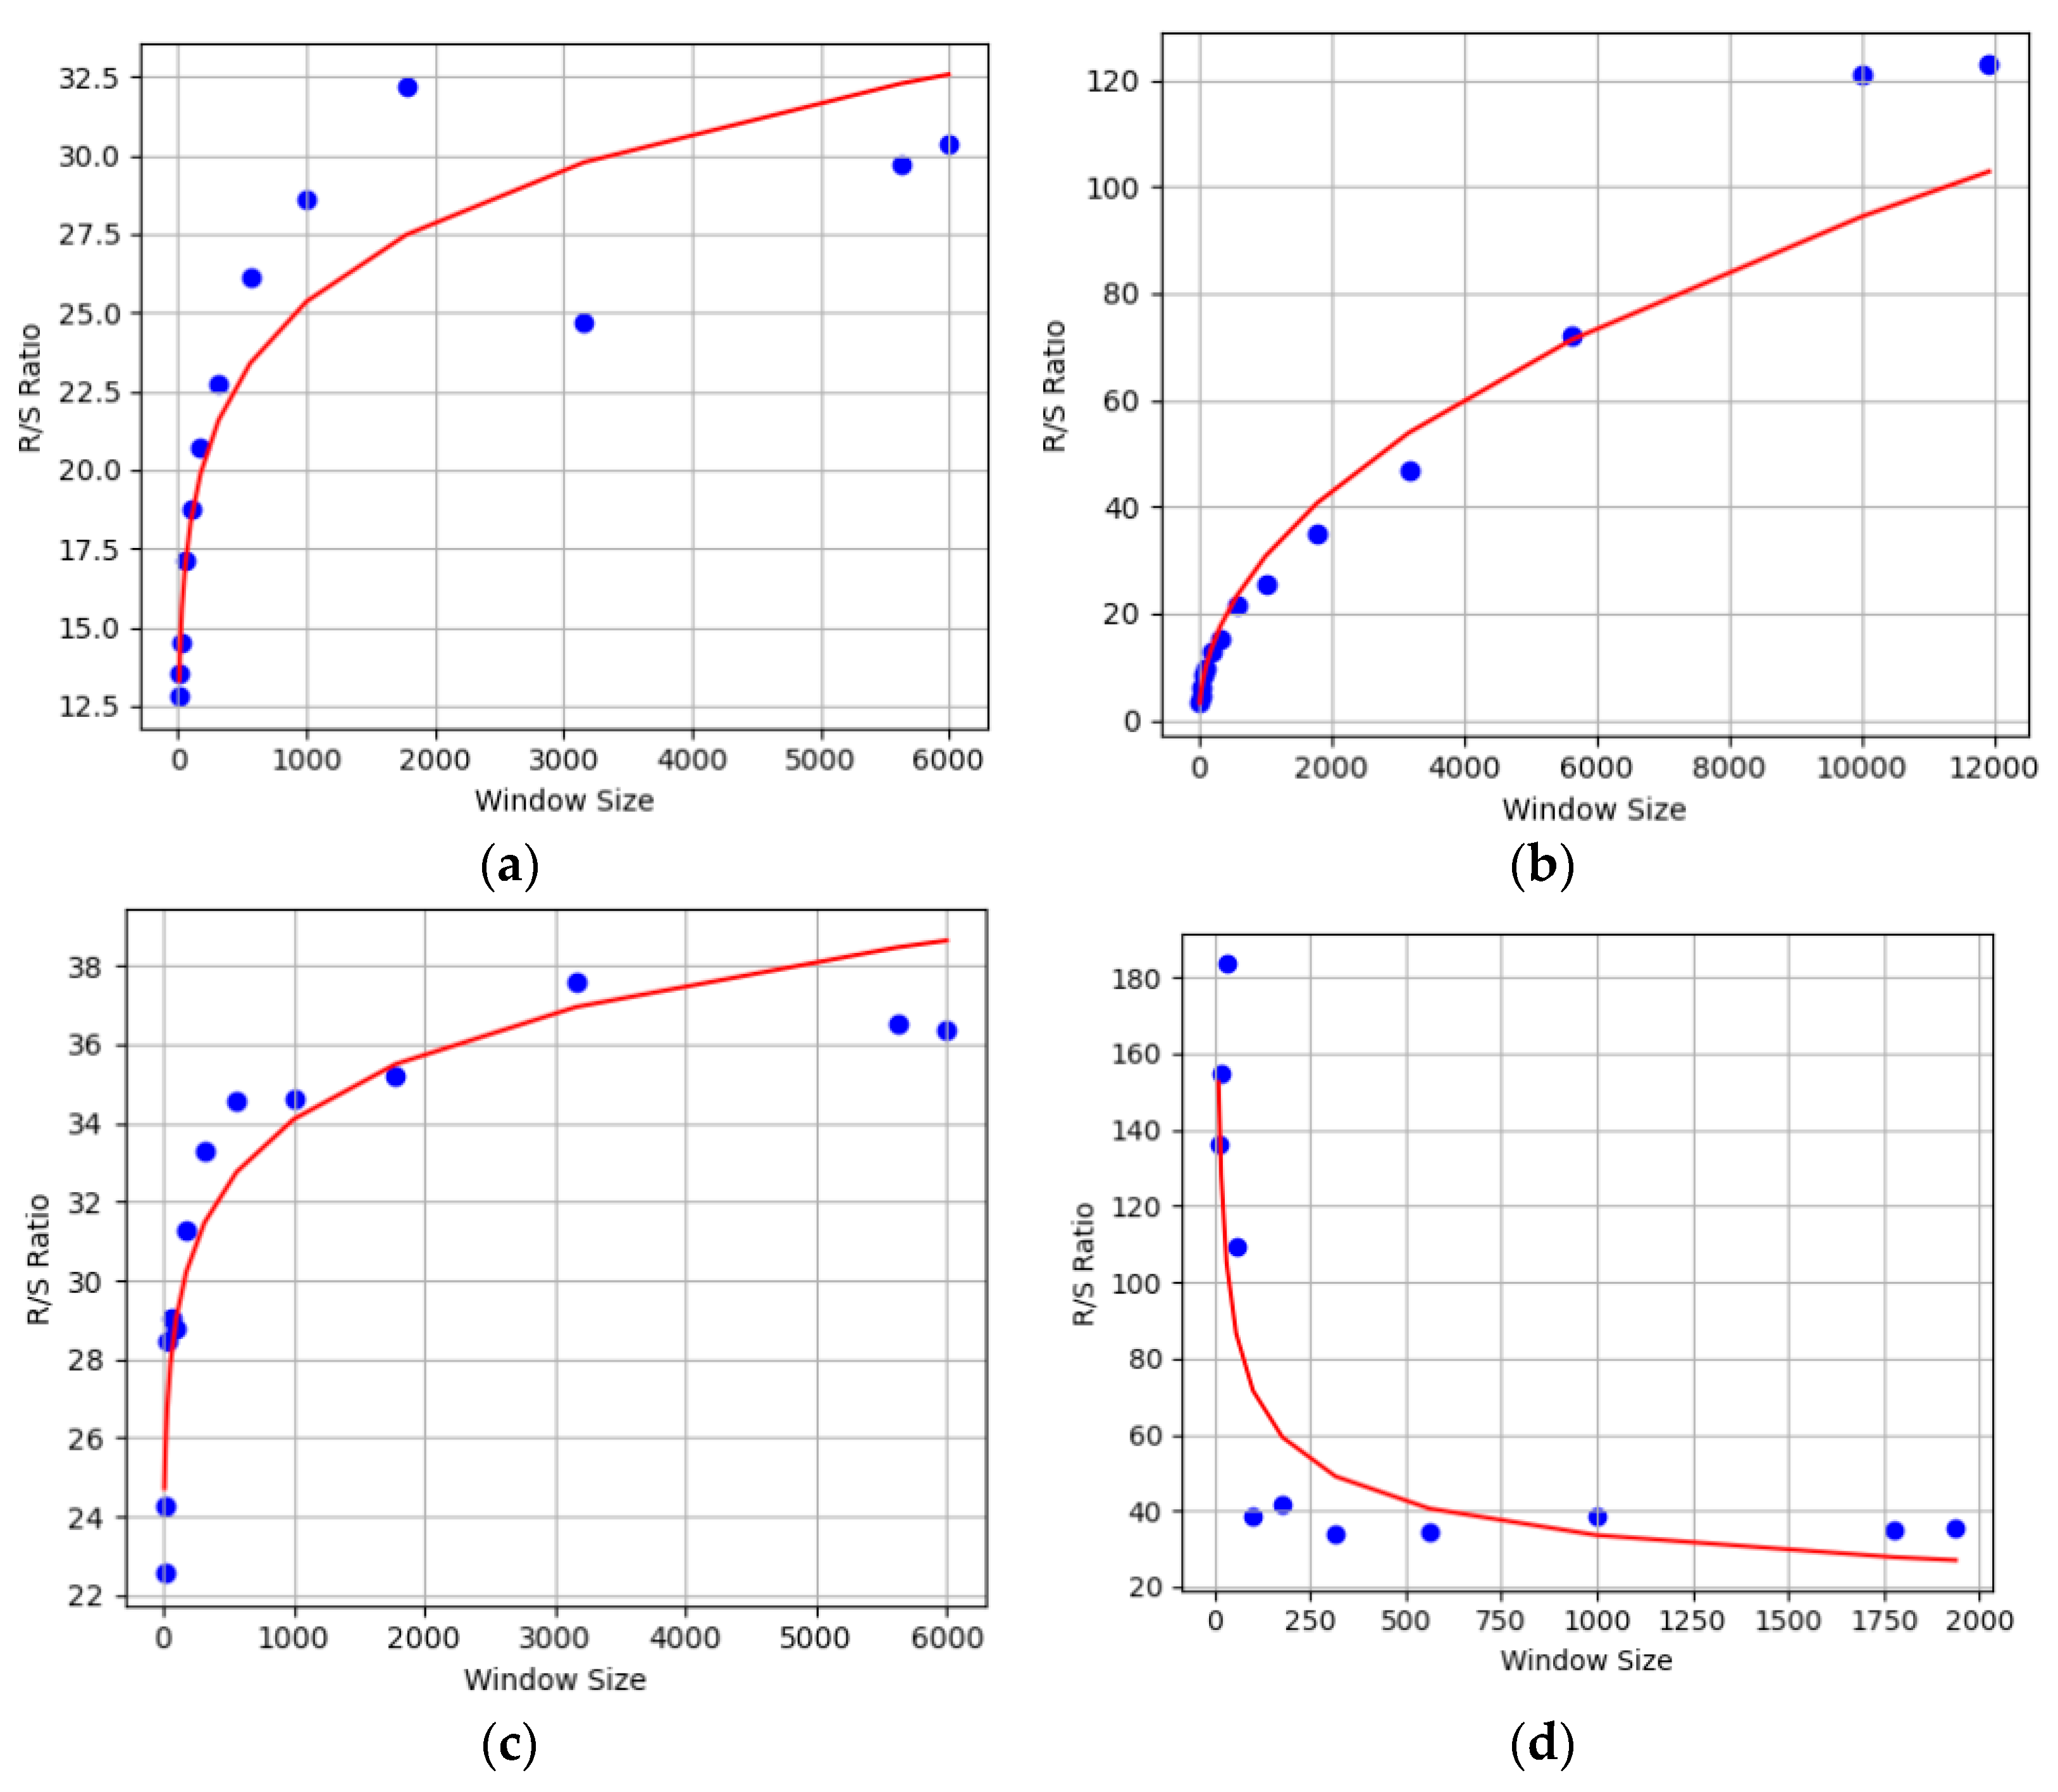
3.3. Windowing
3.4. Feature Extraction—Human Activity Recognition
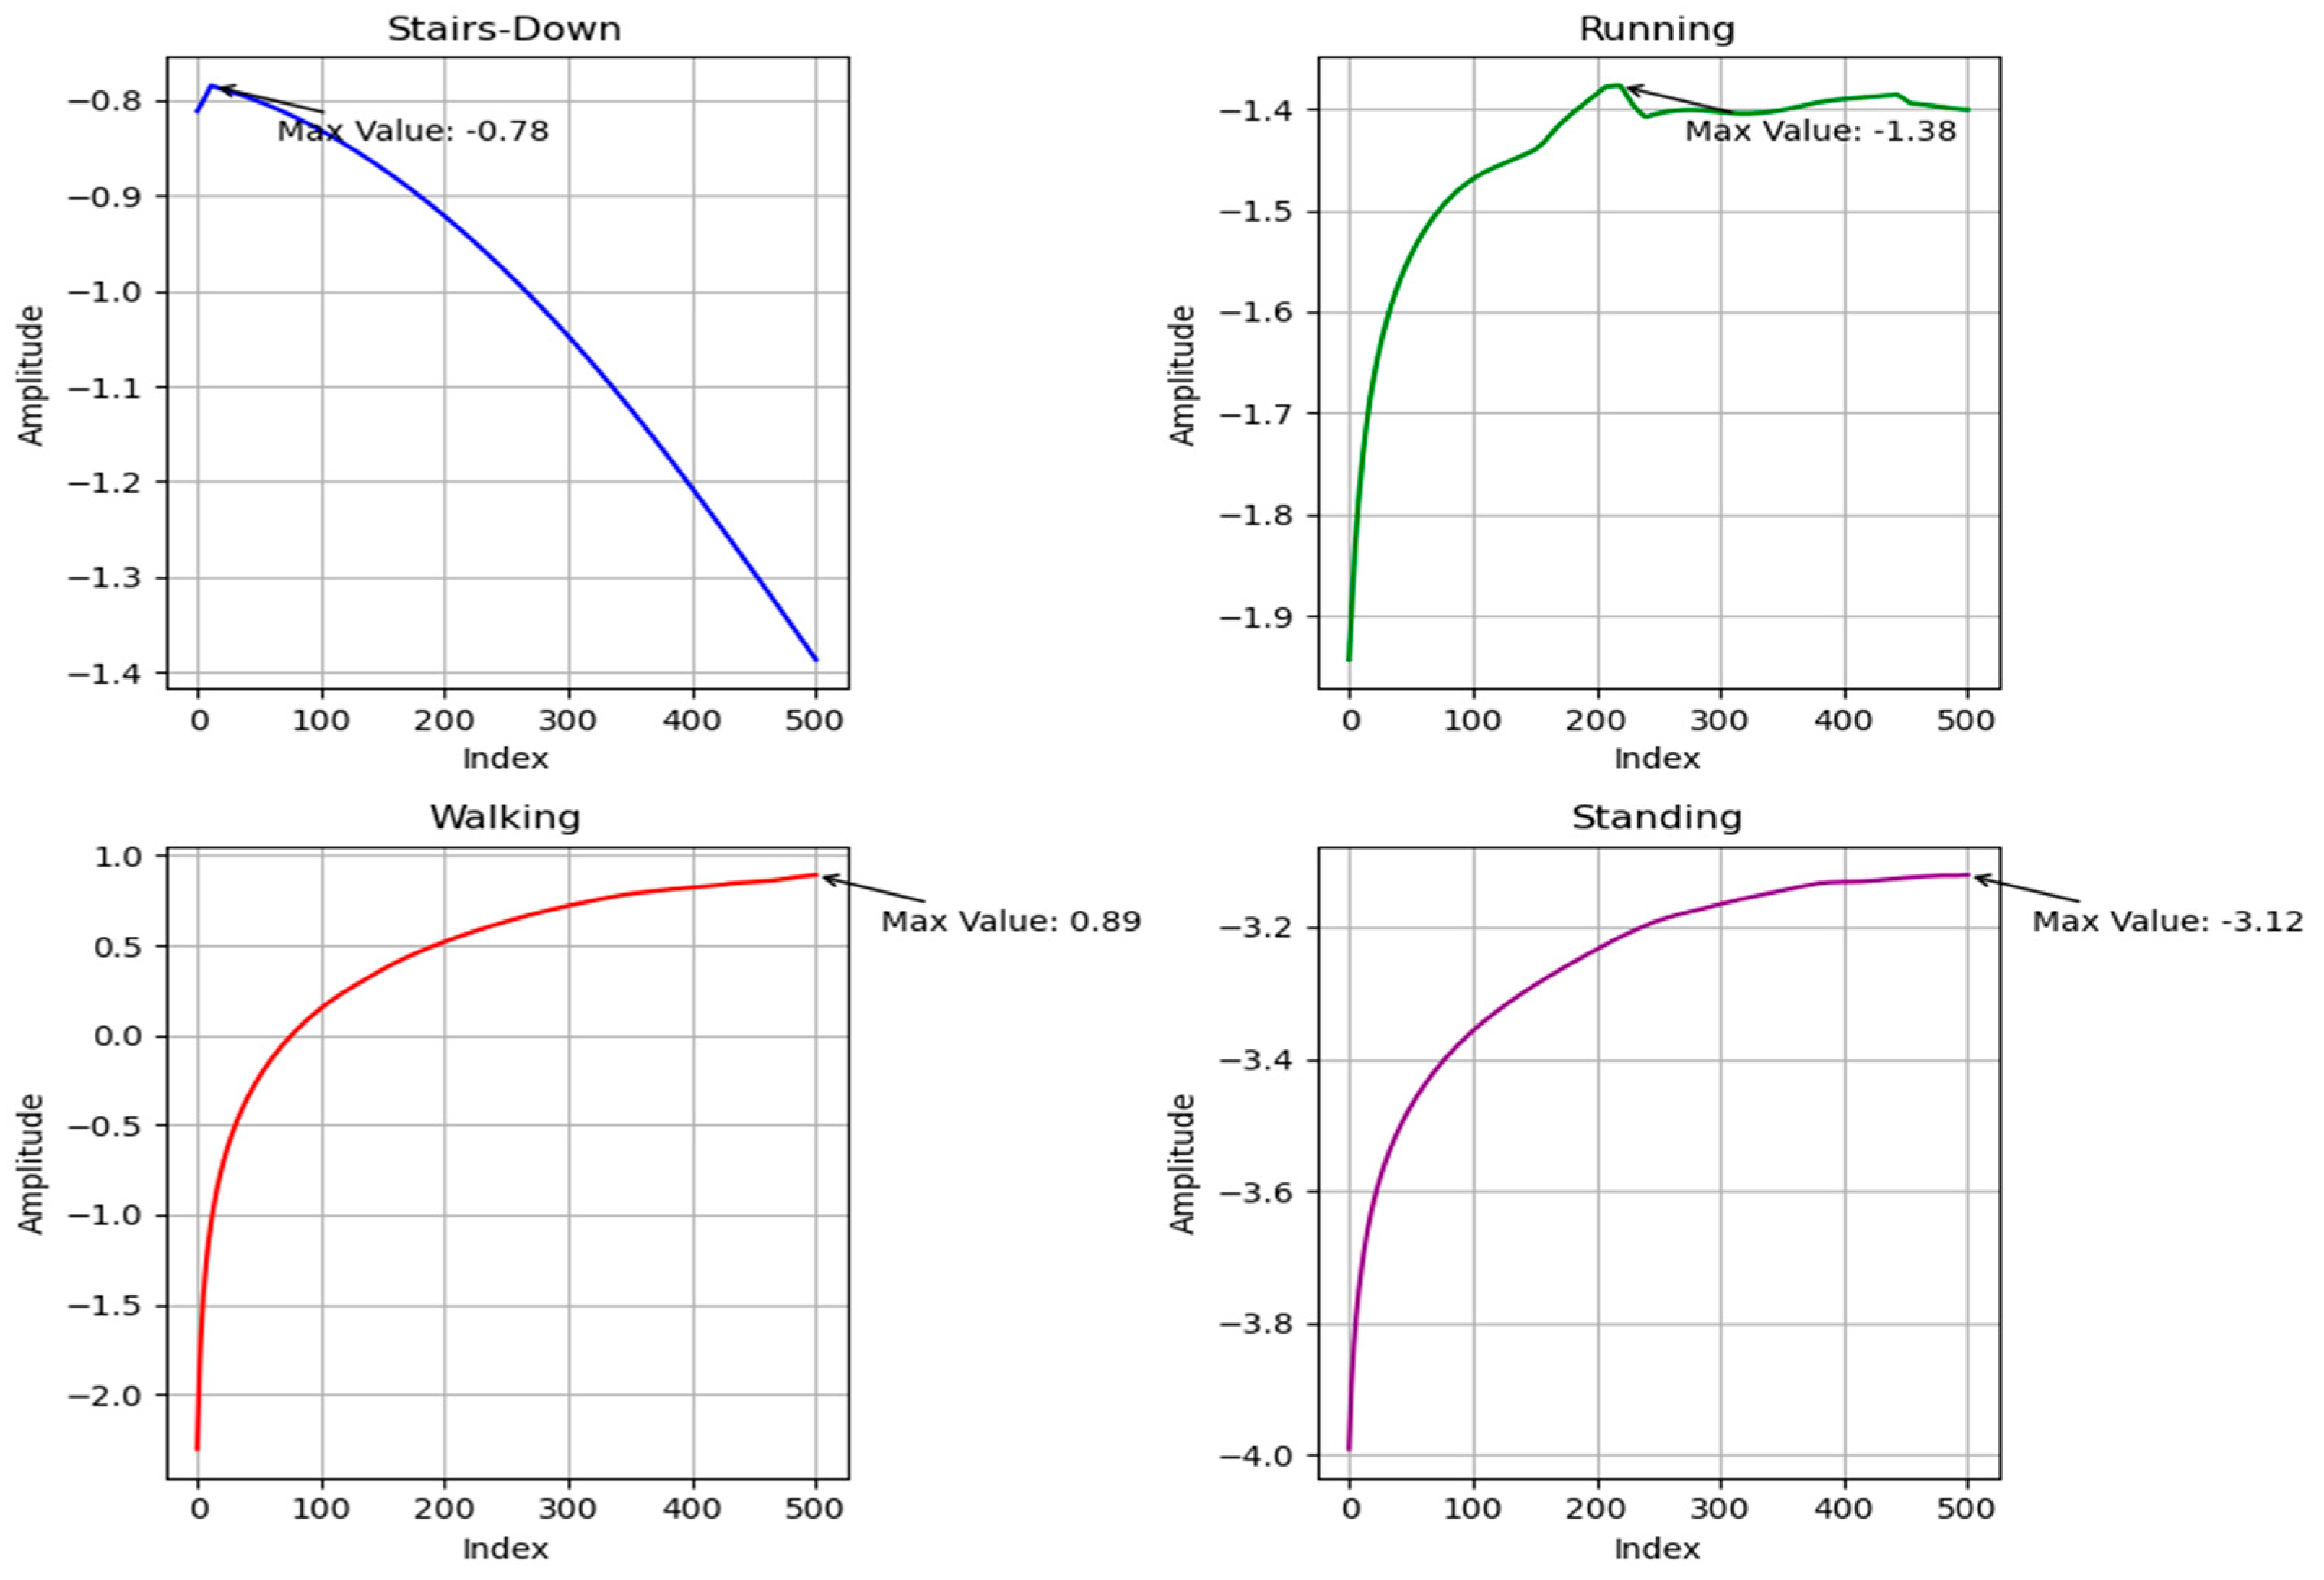
3.4.1. Maximum Lyapunov Exponent
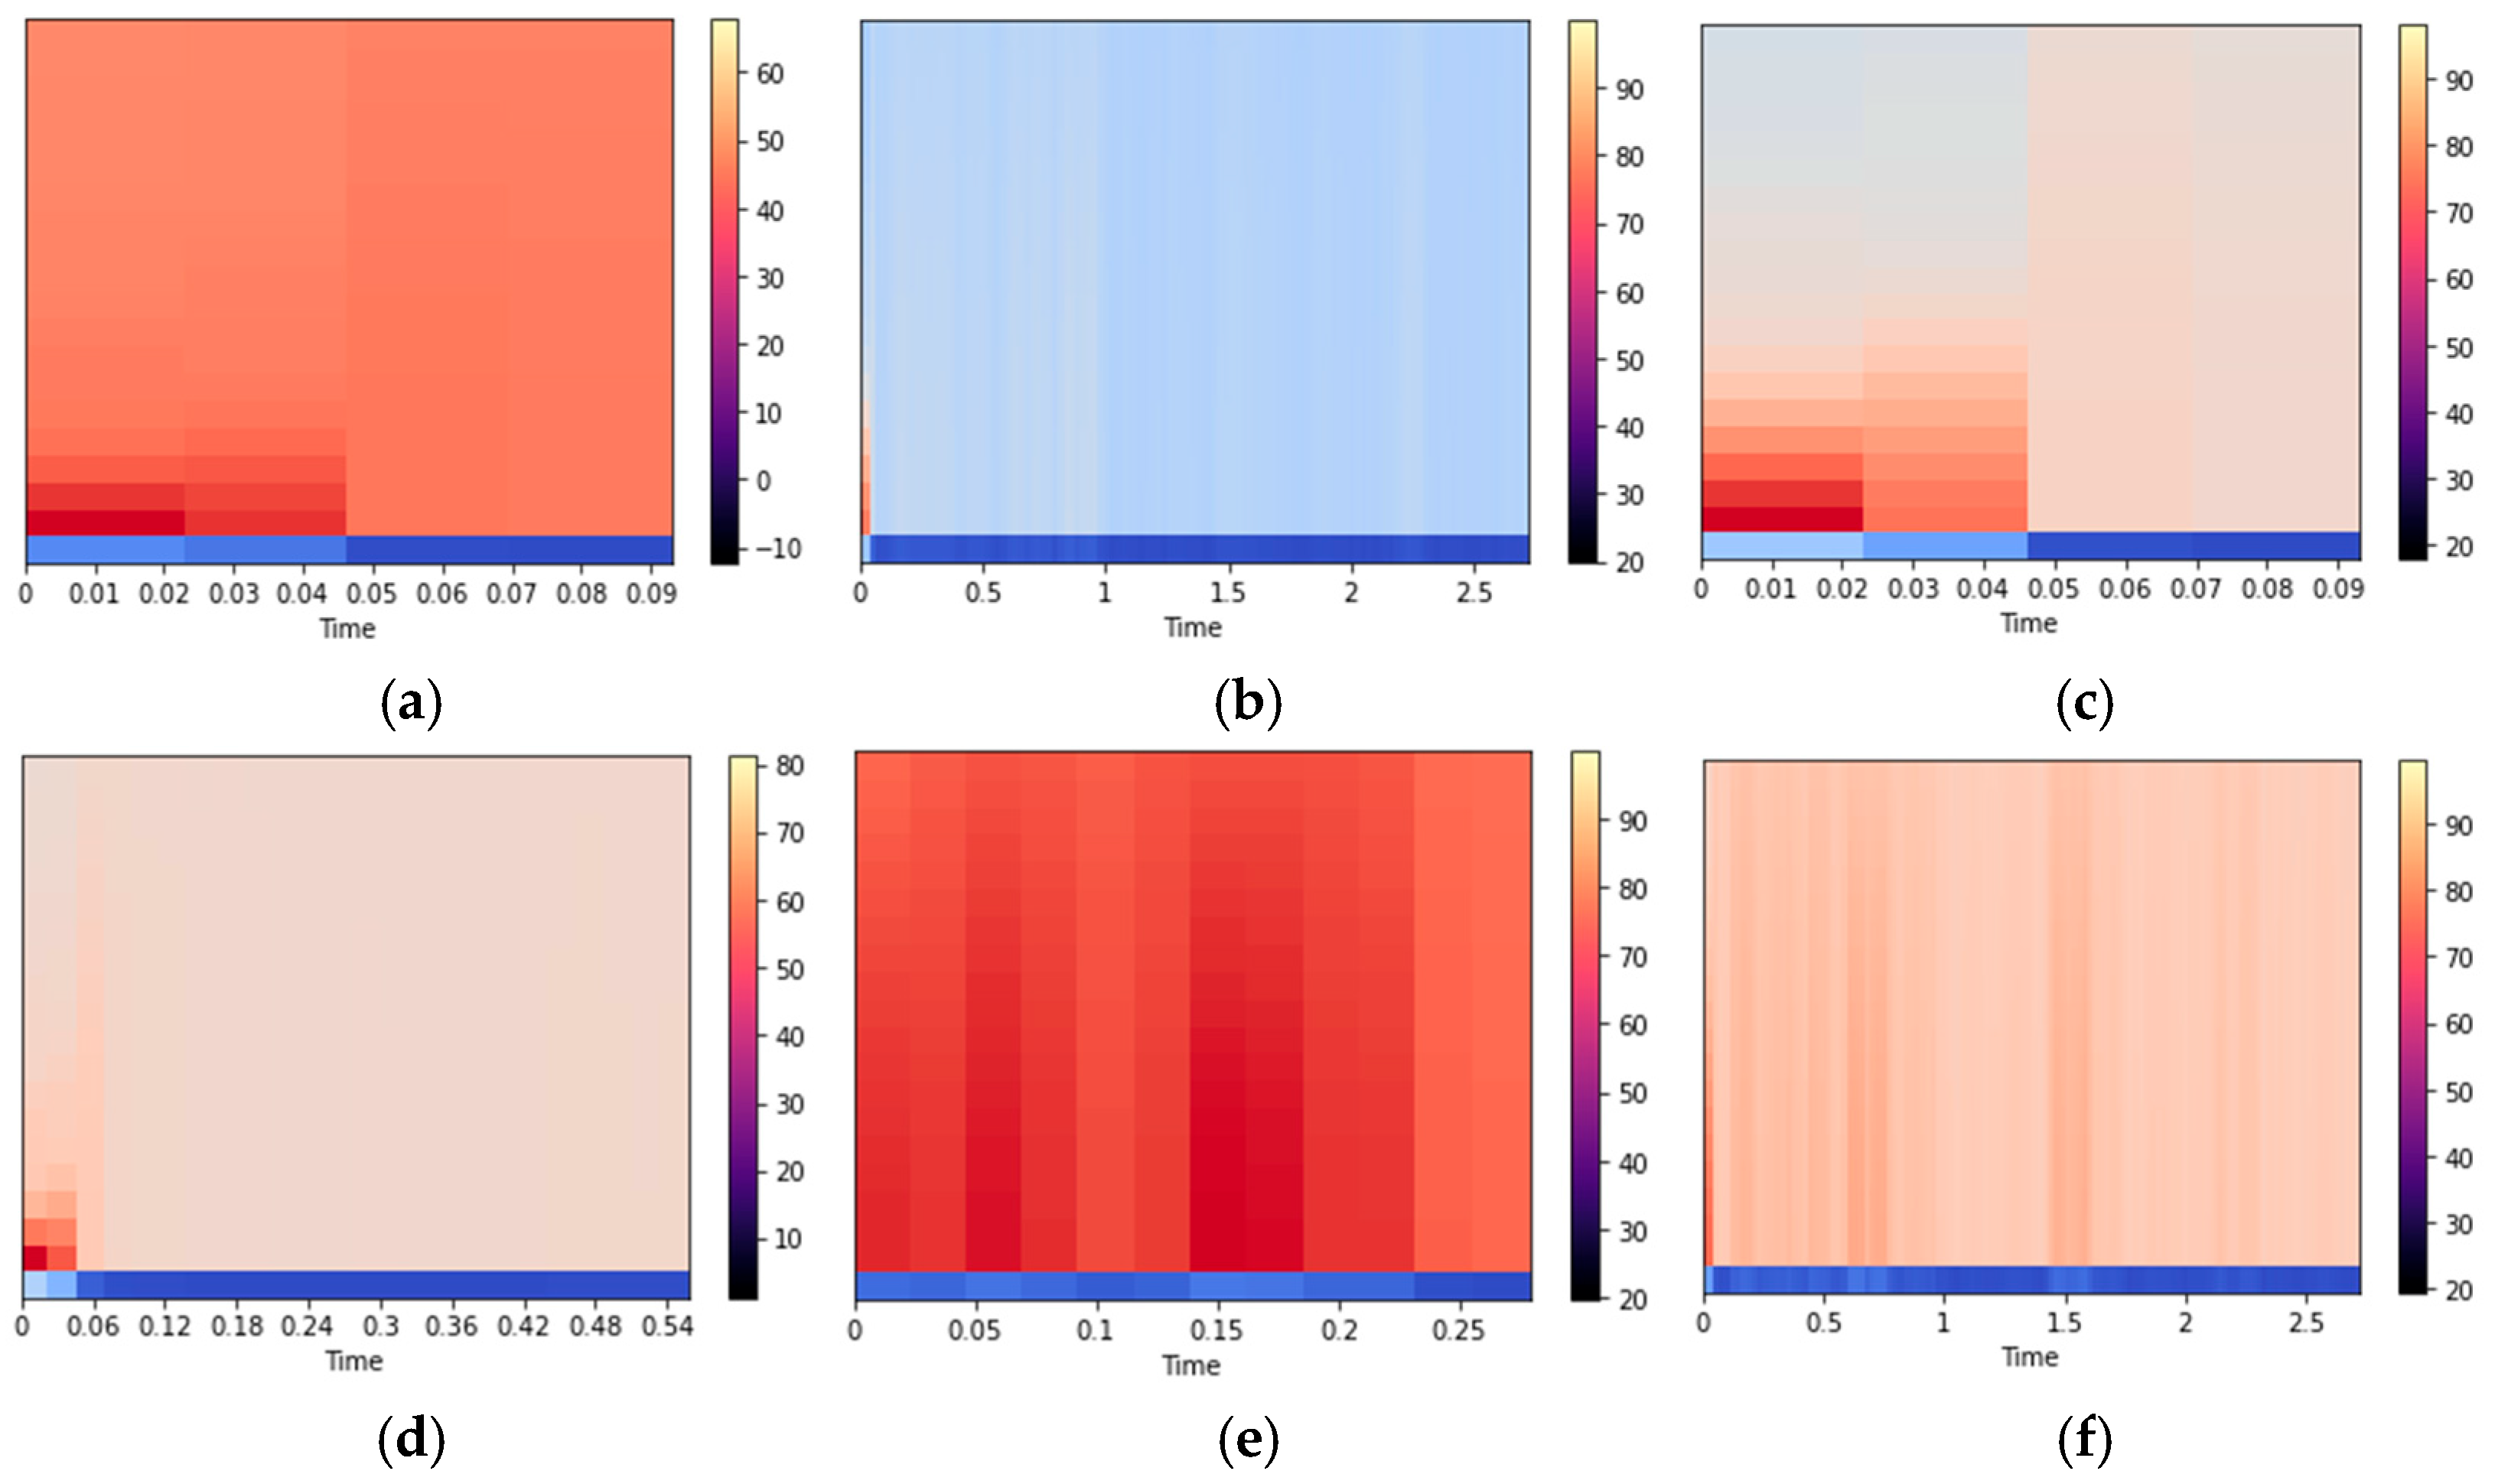
3.4.2. Mel-Frequency Cepstral Coefficients
3.4.3. Fractal Dimension
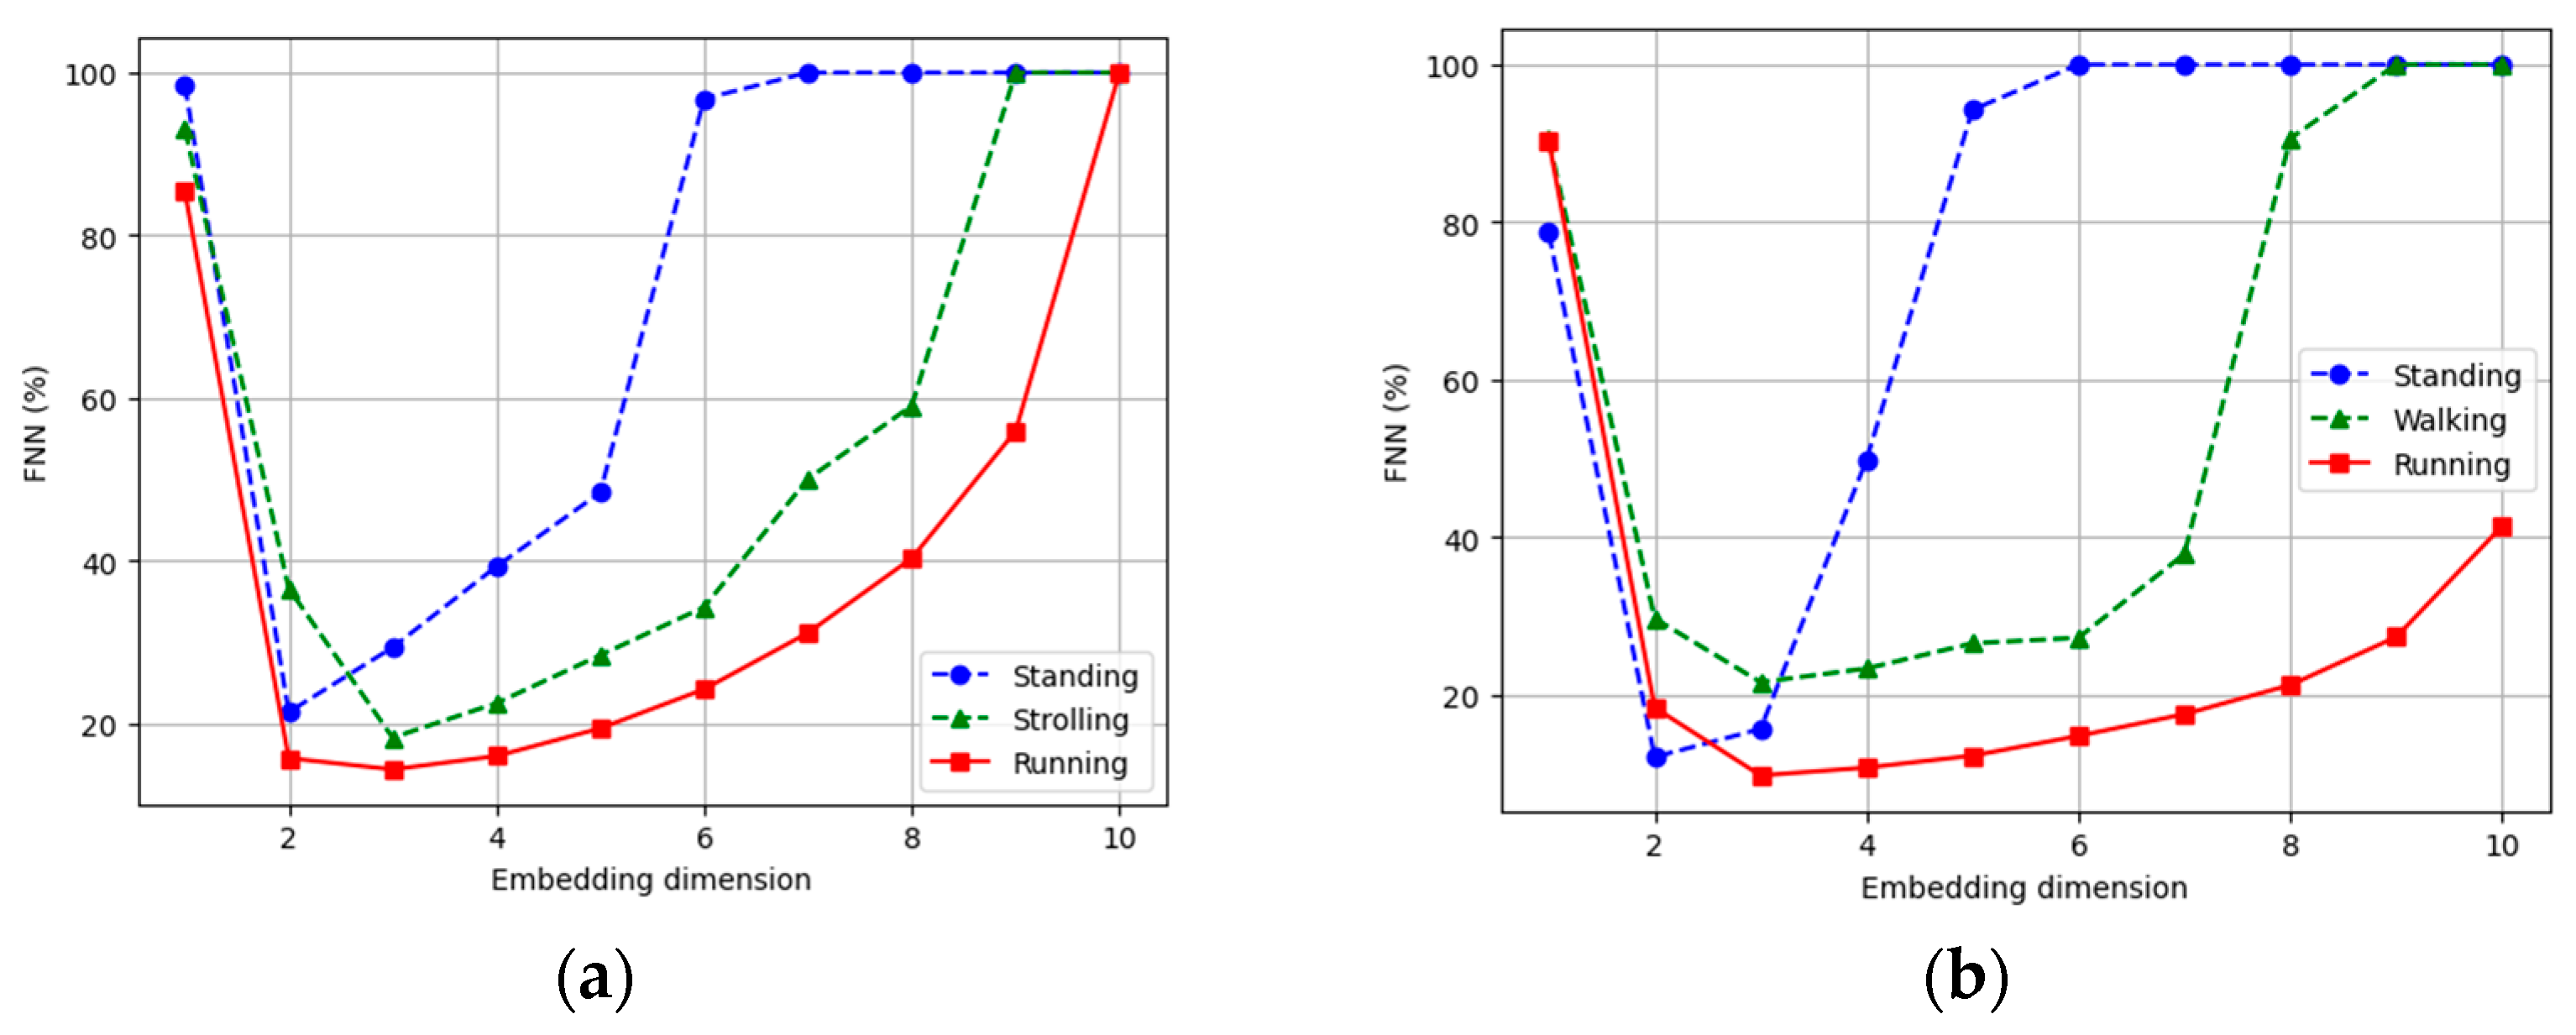
3.4.4. Embedding Dimension
3.5. Feature Extraction—Human Localization
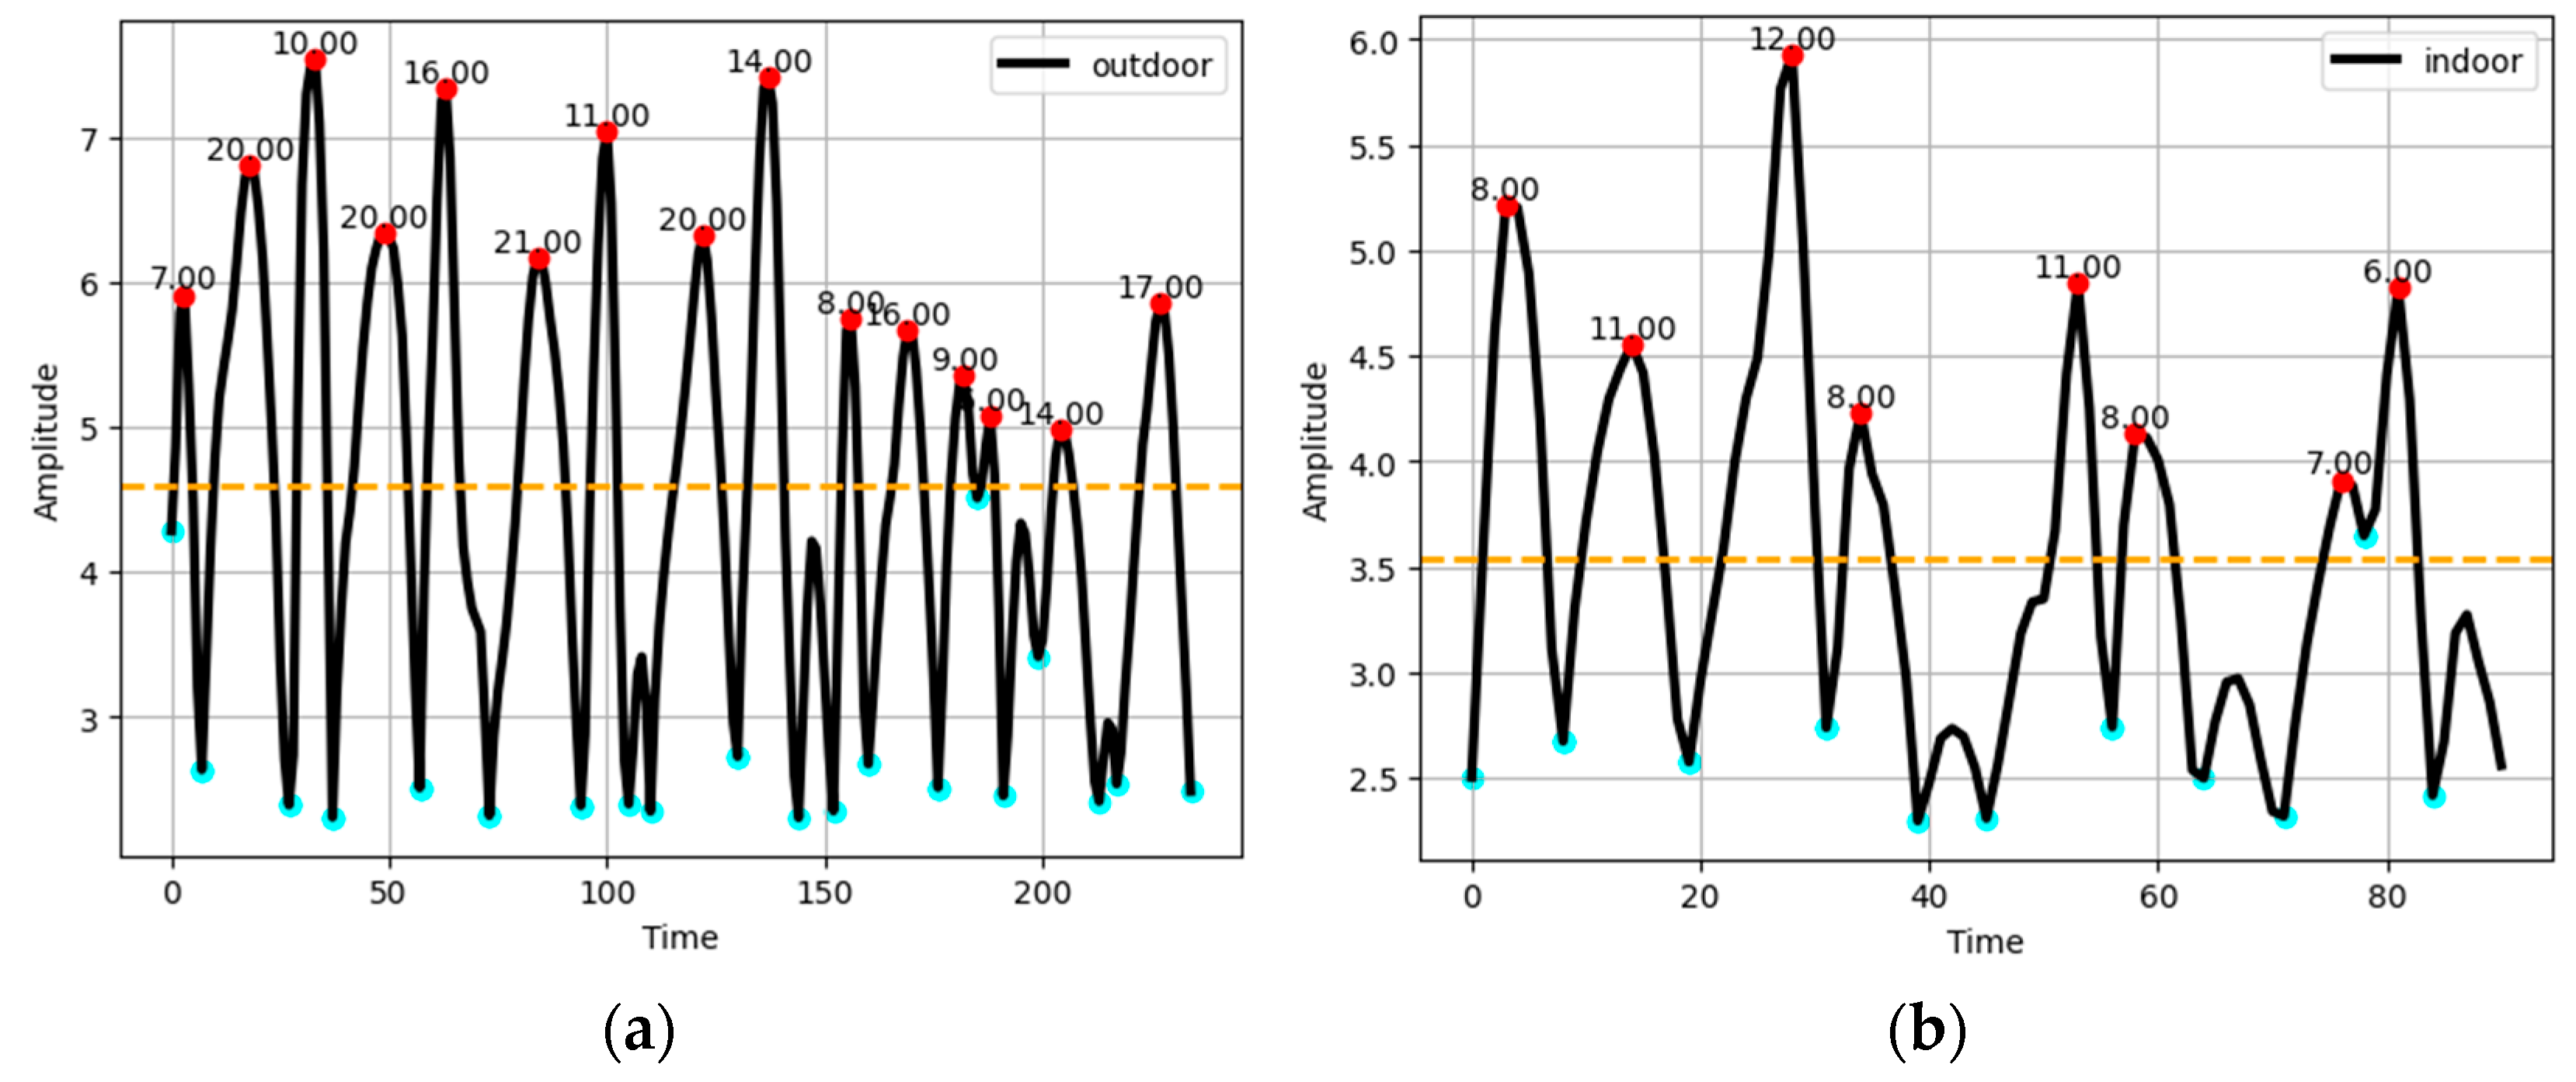
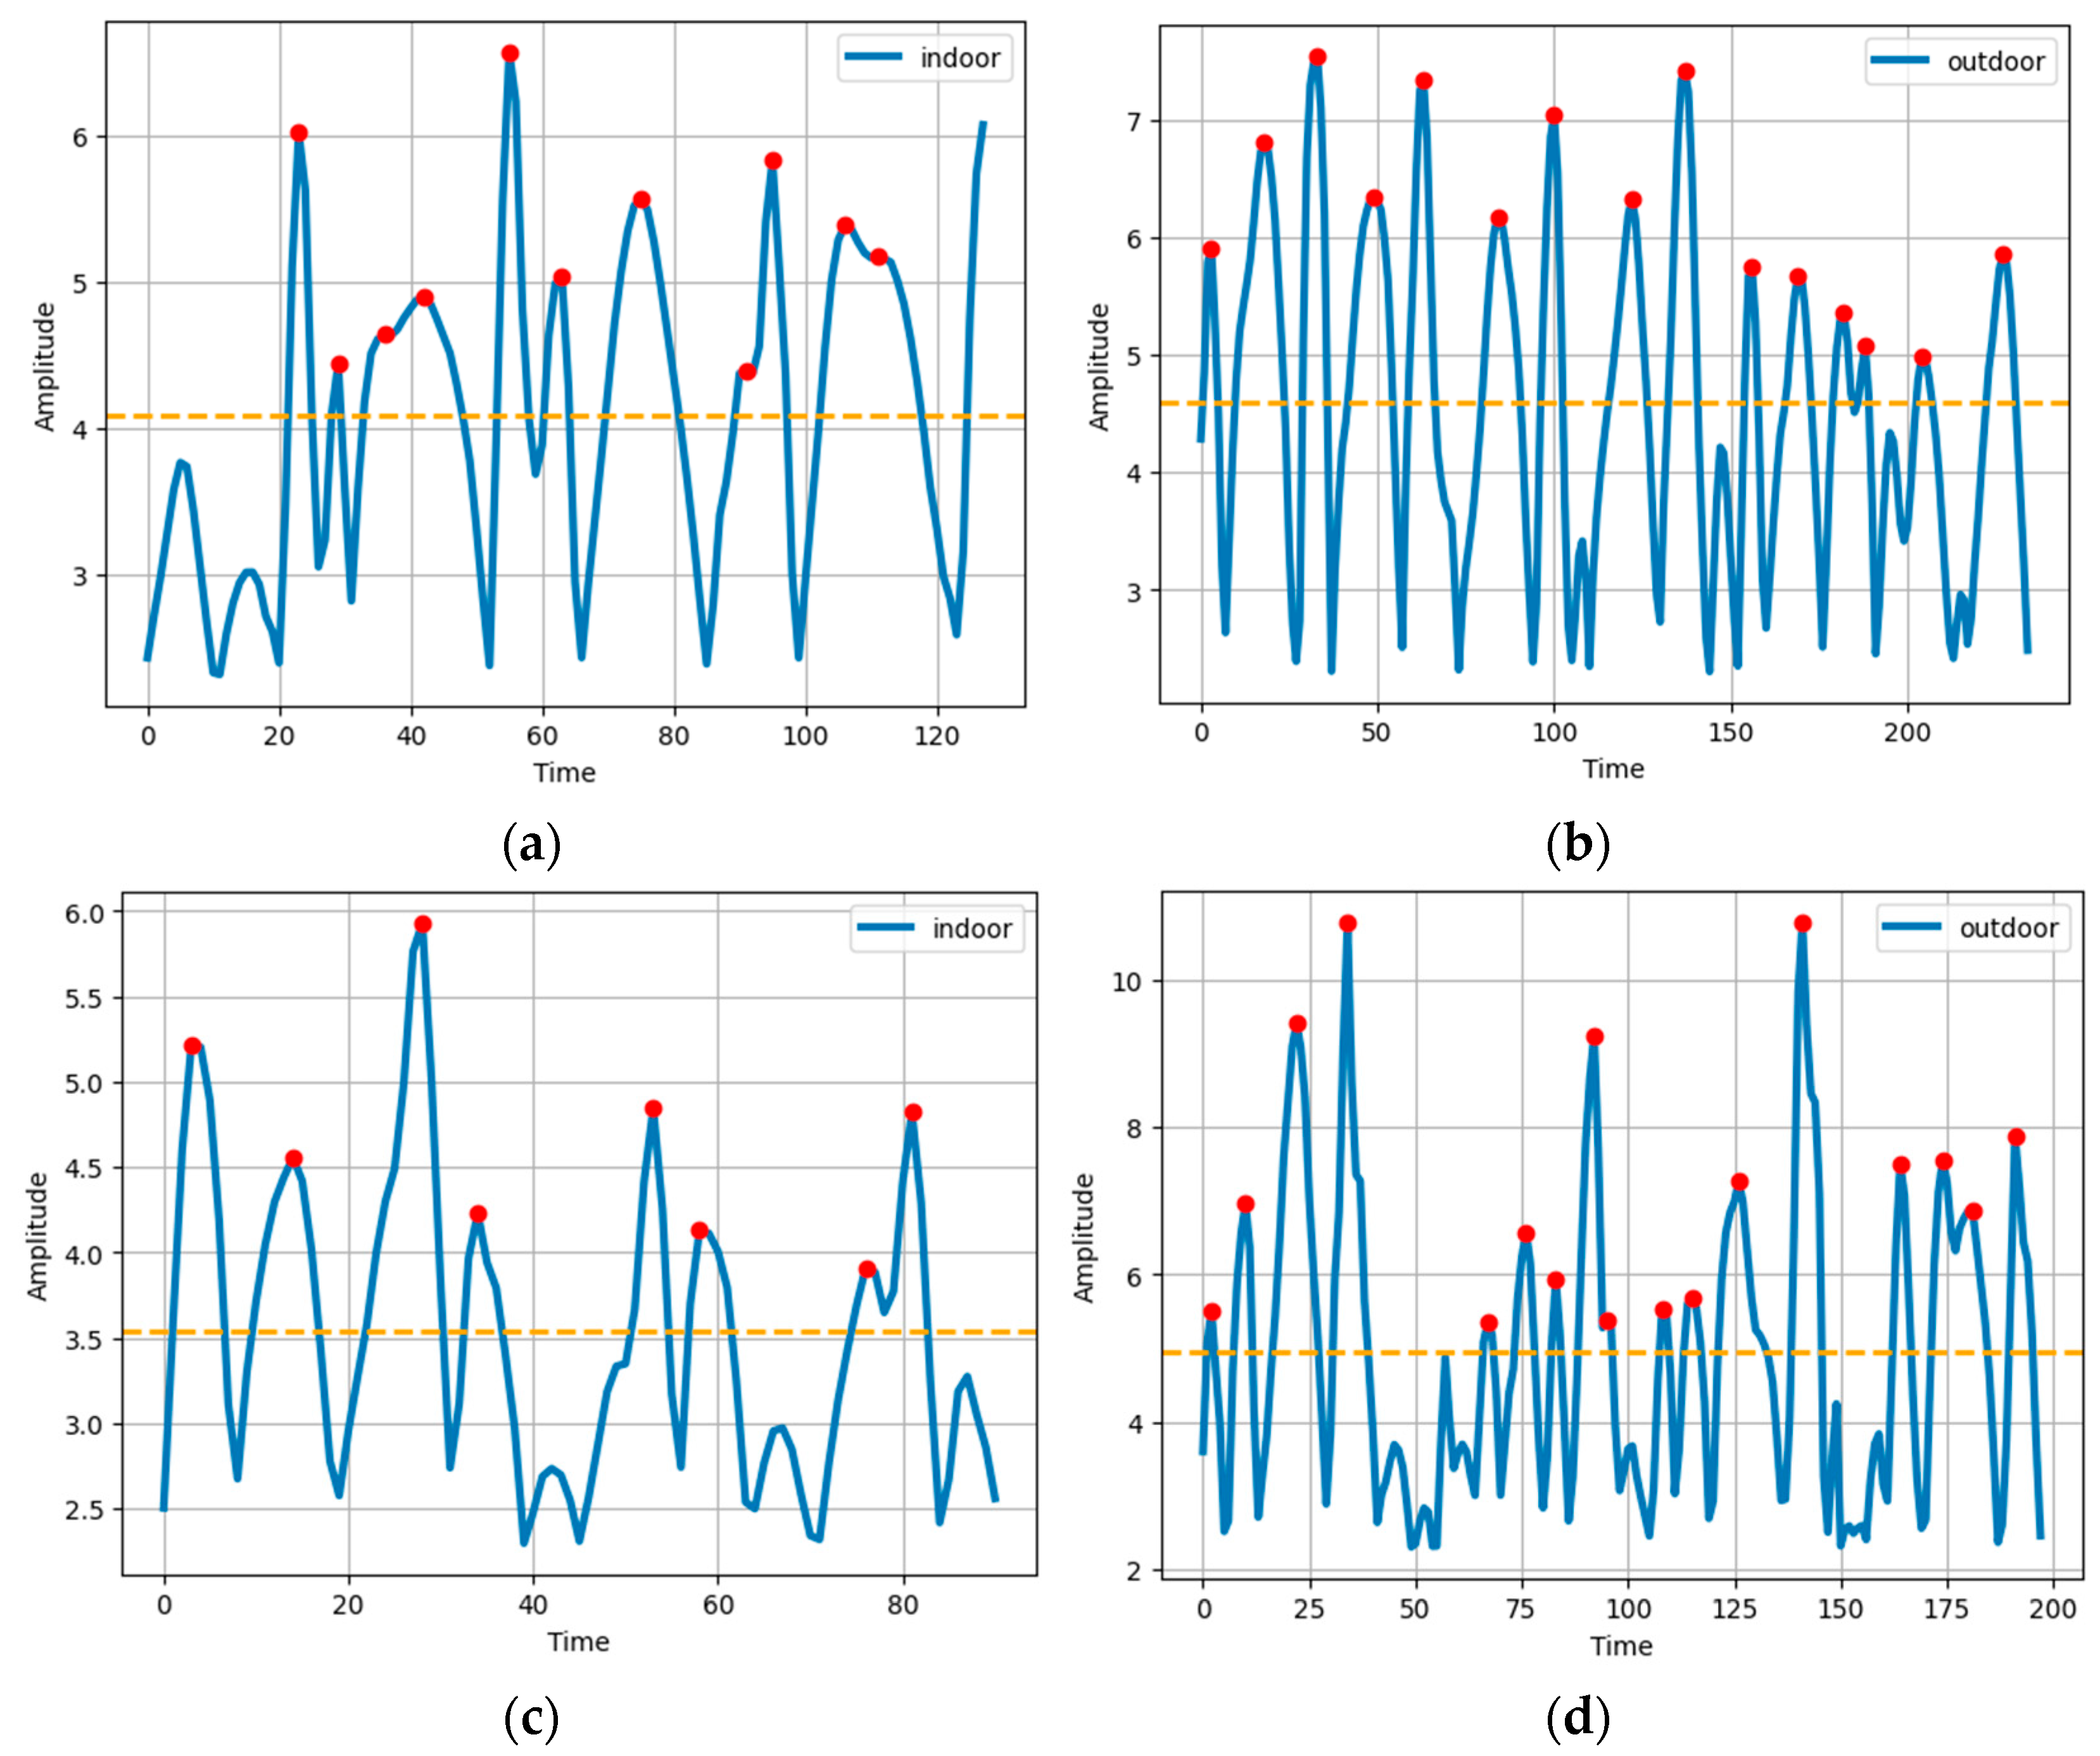
3.5.1. Step Detection
3.5.2. Dynamic Step-Length Estimation

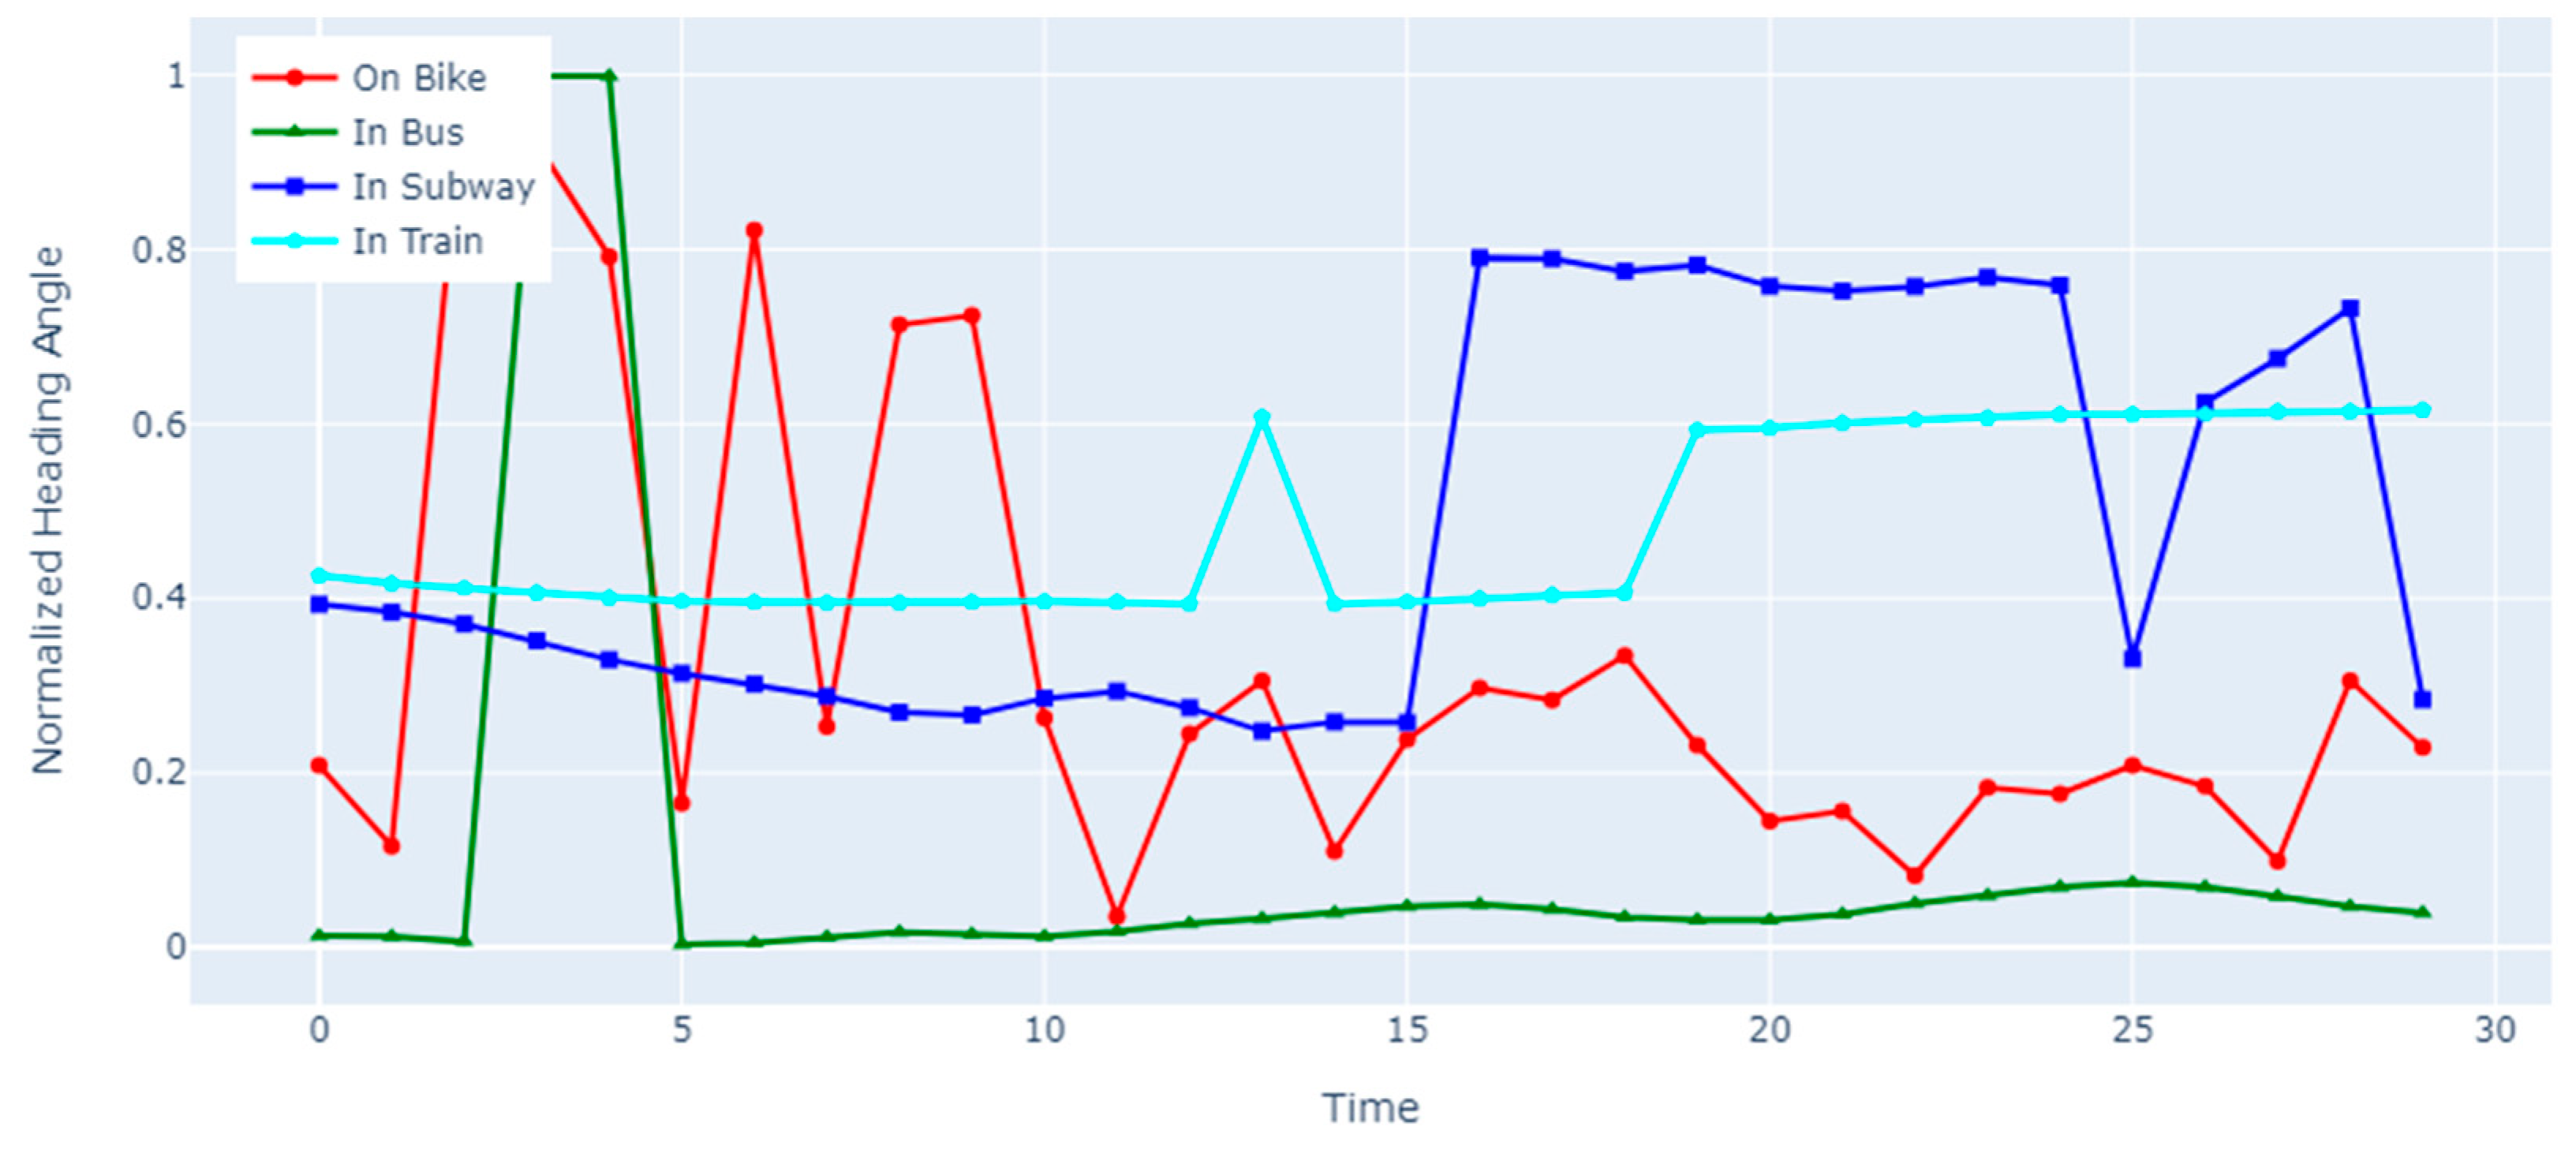
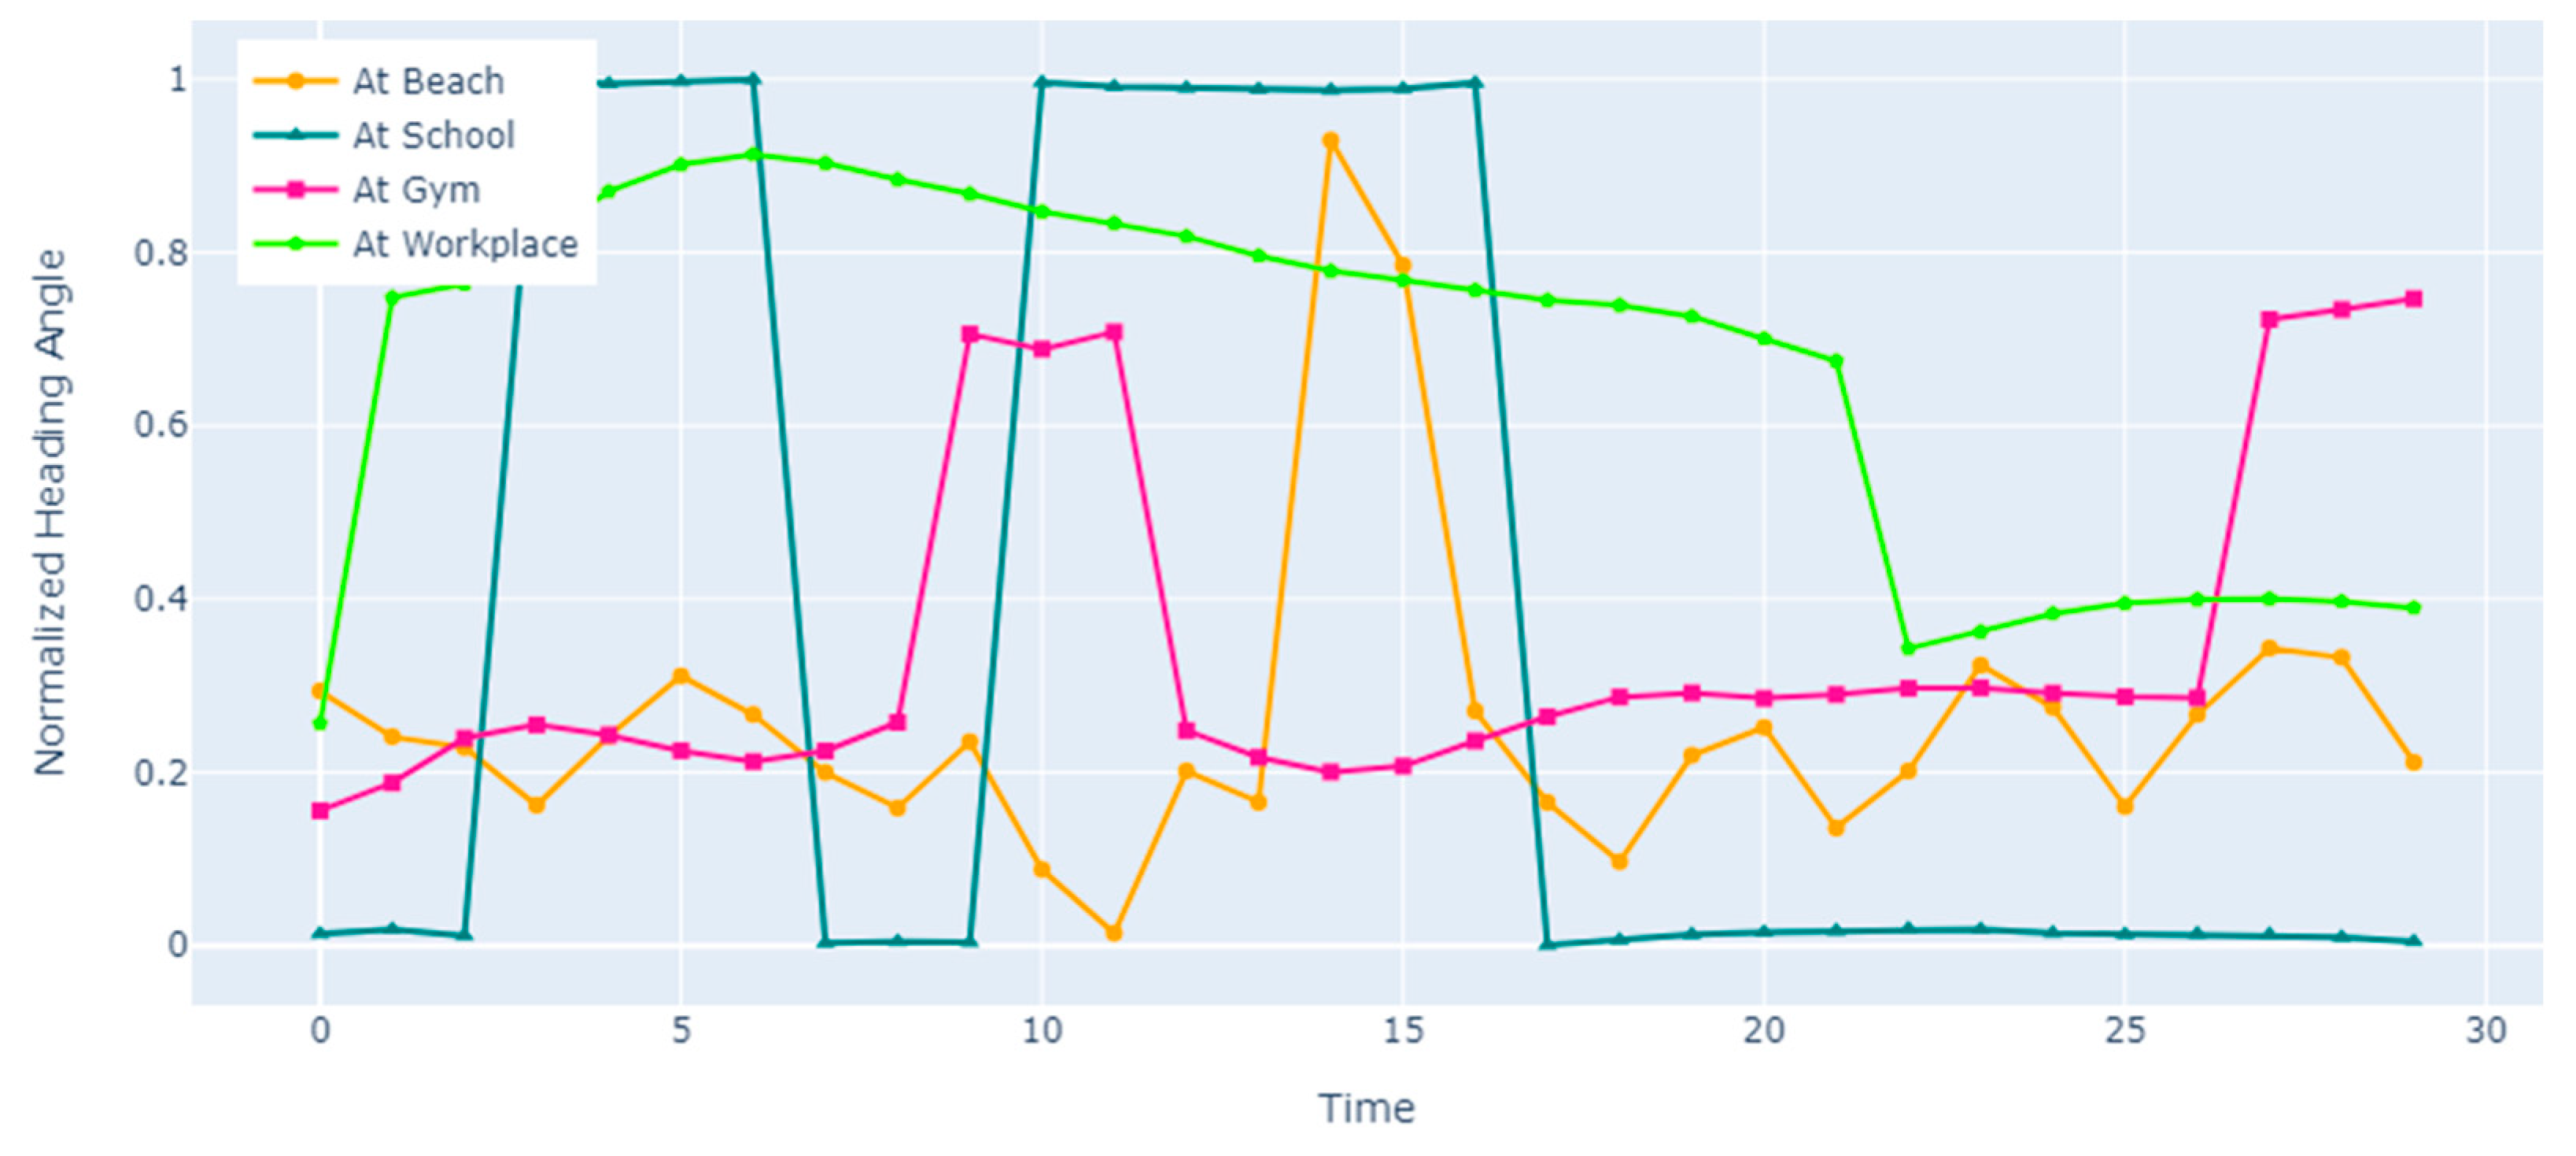
3.5.3. Heading Direction Estimation
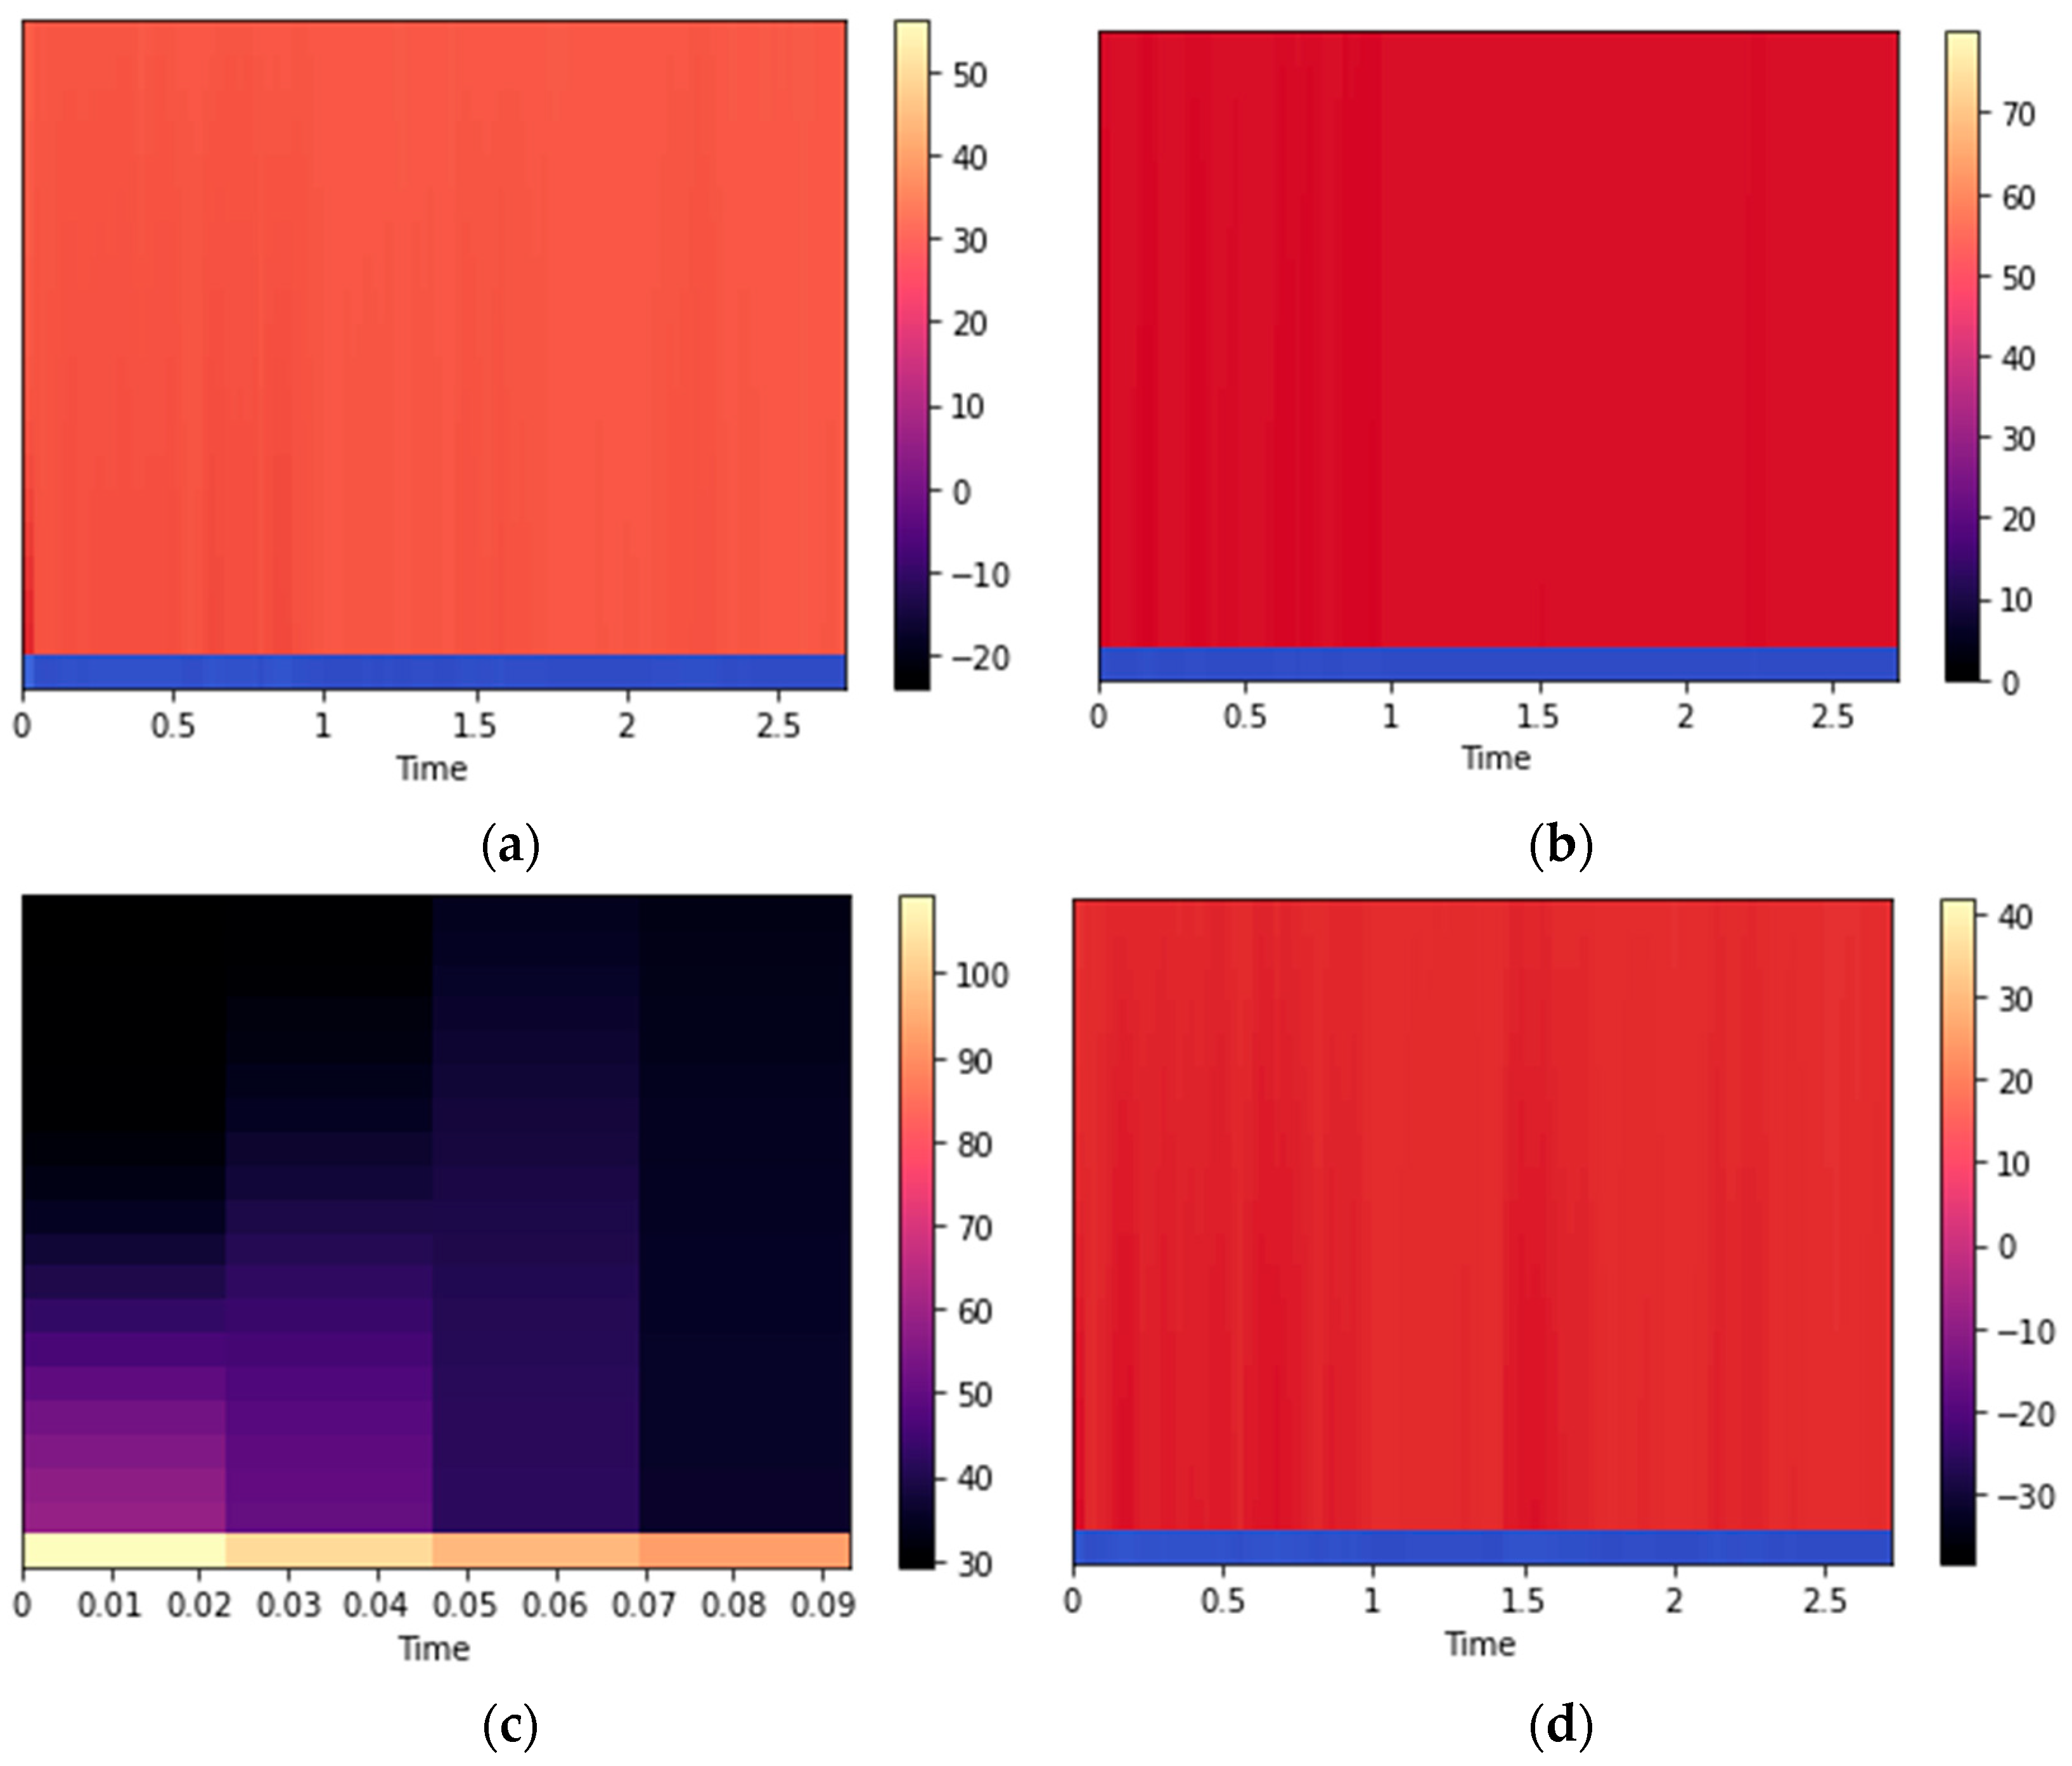
3.5.4. Mel-Frequency Cepstral Coefficients for Localization
3.6. Recursive Feature Elimination

3.7. Data Augmentation
3.8. Classification

4. Experimental Setup and Evaluation
4.1. Dataset Descriptions
4.1.1. ExtraSensory Dataset
4.1.2. Sussex-Huawei Locomotion Dataset
4.2. Experimental Results
4.2.1. Experiment 1: Different Window Sizes on the ExtraSensory Dataset
4.2.2. Experiment 2: Using the ExtraSensory Dataset
4.2.3. Experiment 3: Using SHL Dataset
4.2.4. Experiment 4: Evaluation Using Other Conventional Systems

| SIT | LYD | STN | BIC | RUN | STL | STU | STD | |
|---|---|---|---|---|---|---|---|---|
| SIT | 0.89 | 0 | 0.01 | 0 | 0.02 | 0.02 | 0.04 | 0.02 |
| LYD | 0.06 | 0.91 | 0.03 | 0 | 0 | 0 | 0 | 0 |
| STN | 0.02 | 0.02 | 0.89 | 0 | 0.03 | 0 | 0.03 | 0.01 |
| BIC | 0 | 0 | 0 | 0.86 | 0 | 0 | 0.09 | 0.05 |
| RUN | 0 | 0 | 0 | 0.04 | 0.88 | 0.06 | 0.02 | 0 |
| STL | 0 | 0.02 | 0 | 0 | 0.04 | 0.88 | 0.03 | 0.03 |
| STU | 0 | 0 | 0 | 0 | 0.02 | 0 | 0.87 | 0.11 |
| STD | 0 | 0 | 0 | 0 | 0.03 | 0 | 0.09 | 0.88 |
| Classes | Precision | Recall | F1 Score |
|---|---|---|---|
| Sitting | 0.89 | 0.89 | 0.88 |
| Lying Down | 0.90 | 0.90 | 0.88 |
| Standing | 0.90 | 0.89 | 0.89 |
| Bicycling | 0.86 | 0.86 | 0.86 |
| Running | 0.90 | 0.89 | 0.88 |
| Strolling | 0.89 | 0.88 | 0.88 |
| Stairs-Up | 0.89 | 0.89 | 0.86 |
| Stairs-Down | 0.88 | 0.88 | 0.88 |
| Mean | 0.89 | 0.89 | 0.88 |
| IND | HOM | SCH | WRK | OUT | CLS | GYM | BCH | |
|---|---|---|---|---|---|---|---|---|
| IND | 0.92 | 0.02 | 0 | 0 | 0 | 0 | 0.04 | 0.02 |
| HOM | 0.03 | 0.91 | 0 | 0.04 | 0 | 0 | 0.02 | 0 |
| SCH | 0.04 | 0 | 0.92 | 0.04 | 0 | 0 | 0 | 0 |
| WRK | 0 | 0 | 0.05 | 0.90 | 0.03 | 0.02 | 0 | 0 |
| OUT | 0 | 0 | 0.01 | 0.04 | 0.89 | 0 | 0 | 0.06 |
| CLS | 0 | 0 | 0.04 | 0.04 | 0.02 | 0.90 | 0 | 0 |
| GYM | 0.05 | 0.04 | 0 | 0 | 0.02 | 0 | 0.89 | 0 |
| BCH | 0 | 0 | 0 | 0.03 | 0.05 | 0 | 0 | 0.92 |
| Classes | Precision | Recall | F1 Score |
|---|---|---|---|
| Indoor | 0.92 | 0.92 | 0.91 |
| At Home | 0.92 | 0.91 | 0.91 |
| At School | 0.93 | 0.91 | 0.90 |
| At Workplace | 0.91 | 0.90 | 0.90 |
| Outdoor | 0.91 | 0.89 | 0.88 |
| In Class | 0.90 | 0.89 | 0.90 |
| At Gym | 0.90 | 0.88 | 0.88 |
| At Beach | 0.92 | 0.91 | 0.90 |
| Mean | 0.91 | 0.90 | 0.90 |
| SIT | WAL | STN | RUN | |
|---|---|---|---|---|
| SIT | 0.95 | 0.01 | 0.04 | 0 |
| WAL | 0 | 0.97 | 0 | 0.03 |
| STN | 0.06 | 0 | 0.94 | 0 |
| RUN | 0 | 0.02 | 0 | 0.98 |
| Classes | Precision | Recall | F1 Score |
|---|---|---|---|
| Sitting | 0.96 | 0.94 | 0.94 |
| Walking | 0.97 | 0.97 | 0.96 |
| Standing | 0.94 | 0.94 | 0.94 |
| Running | 0.98 | 0.98 | 0.96 |
| Mean | 0.96 | 0.96 | 0.95 |
| IND | OUT | BUS | TRN | SWY | CAR | |
|---|---|---|---|---|---|---|
| IND | 0.94 | 0.03 | 0.01 | 0 | 0 | 0.02 |
| OUT | 0.02 | 0.93 | 0.05 | 0 | 0 | 0 |
| BUS | 0.12 | 0.01 | 0.87 | 0 | 0 | 0 |
| TRN | 0 | 0 | 0.02 | 0.86 | 0.11 | 0.01 |
| SWY | 0 | 0 | 0 | 0.13 | 0.87 | 0 |
| CAR | 0.03 | 0 | 0.01 | 0 | 0 | 0.96 |
| Classes | Precision | Recall | F1 Score |
|---|---|---|---|
| Indoor | 0.94 | 0.94 | 0.94 |
| Outdoor | 0.94 | 0.93 | 0.91 |
| In Bus | 0.88 | 0.88 | 0.85 |
| In Train | 0.86 | 0.84 | 0.84 |
| In Subway | 0.87 | 0.87 | 0.87 |
| In Car | 0.96 | 0.95 | 0.93 |
| Mean | 0.91 | 0.90 | 0.89 |
5. Conclusions
Author Contributions
Funding
Conflicts of Interest
References
- Cheng, B.; Zhu, D.; Zhao, S.; Chen, J. Situation-aware IoT service coordination using the event-driven SOA paradigm. IEEE Trans. Netw. Serv. Manag. 2016, 13, 349–361. [Google Scholar] [CrossRef]
- Cheng, B.; Wang, M.; Zhao, S.; Zhai, Z.; Zhu, D.; Chen, J. Situation-aware dynamic service coordination in an IoT environment. IEEE/ACM Trans. Netw. 2017, 25, 2082–2095. [Google Scholar] [CrossRef]
- Zhang, J.; Tang, Y.; Wang, H.; Xu, K. ASRO-DIO: Active subspace random optimization based depth inertial odometry. IEEE Trans. Robot. 2022, 39, 1496–1508. [Google Scholar] [CrossRef]
- Javeed, M.; Shorfuzzaman, M.; Alsufyani, N.; Chelloug, S.A.; Jalal, A.; Park, J. Physical human locomotion prediction using manifold regularization. Peer J Comput. Sci. 2022, 8, 1105. [Google Scholar] [CrossRef] [PubMed]
- Jalal, A.; Kim, J.T.; Kim, T.-S. Development of a life logging system via depth imaging-based human activity recognition for smart homes. In Proceedings of the International Symposium on Sustainable Healthy Buildings, Brisbane, Australia, 8–12 July 2012; pp. 91–95. [Google Scholar]
- Javeed, M.; Mudawi, N.; Alabduallah, B.; Jalal, A.; Kim, W. A multimodal IoT-based locomotion classification system using features engineering and Recursive neural network. Sensors 2023, 23, 4716. [Google Scholar] [CrossRef] [PubMed]
- Azmat, U.; Jalal, A.; Javeed, M. Multi-sensors fused IoT-based home surveillance via Bag of visual and motion features. In 2023 International Conference on Communication, Computing and Digital Systems (C-CODE); IEEE: Islamabad, Pakistan, 2023. [Google Scholar]
- Xie, L.; Tian, J.; Ding, G.; Zhao, Q. Human activity recognition method based on inertial sensor and barometer. In Proceedings of the 2018 IEEE International Symposium on Inertial Sensors and Systems (INERTIAL), Moltrasio, Italy, 26–29 March 2018; pp. 1–4. [Google Scholar]
- Jalal, A.; Quaid, M.A.K.; Hasan, A.S. Wearable Sensor-Based Human Behavior Understanding and Recognition in Daily Life for Smart Environments. In Proceedings of the IEEE Conference on International Conference on Frontiers of Information Technology, Islamabad, Pakistan, 17–19 December 2018. [Google Scholar]
- Lv, Z.; Song, H. Mobile internet of things under data physical fusion technology. IEEE Internet Things J. 2019, 7, 4616–4624. [Google Scholar] [CrossRef]
- Liu, H.; Yuan, H.; Hou, J.; Hamzaoui, R.; Gao, W. Pufa-gan: A frequency-aware generative adversarial network for 3d point cloud upsampling. IEEE Trans. Image Process. 2022, 31, 7389–7402. [Google Scholar] [CrossRef] [PubMed]
- Batool, M.; Jalal, A.; Kim, K. Telemonitoring of daily activity using Accelerometer and Gyroscope in smart home environments. J. Electr. Eng. Technol. 2020, 15, 2801–2809. [Google Scholar] [CrossRef]
- Javeed, M.; Jalal, A.; Kim, K. Wearable sensors based exertion recognition using statistical features and random forest for physical healthcare monitoring. In Proceedings of the IEEE International Conference on Applied Sciences and Technology, Online, 1–3 April 2021. [Google Scholar]
- Jalal, A.; Batool, M.; Kim, K. Stochastic recognition of physical activity and healthcare using tri-axial inertial wearable sensors. Appl. Sci. 2020, 10, 7122. [Google Scholar] [CrossRef]
- Javeed, M.; Gochoo, M.; Jalal, A.; Kim, K. HF-SPHR: Hybrid features for sustainable physical healthcare pattern recognition using deep belief networks. Sustainability 2021, 13, 1699. [Google Scholar] [CrossRef]
- Lv, Z.; Kumar, N. Software defined solutions for sensors in 6G/IoE. Comput. Commun. 2020, 153, 42–47. [Google Scholar] [CrossRef]
- Mekruksavanich, S.; Jantawong, P.; Jitpattanakul, A. Deep Learning-based Action Recognition for Pedestrian Indoor Localization using Smartphone Inertial Sensors. In 2022 Joint International Conference on Digital Arts; IEEE: New York, NY, USA, 2022; pp. 346–349. [Google Scholar]
- Vesa, A.V.; Vlad, S.; Rus, R.; Antal, M.; Pop, C.; Anghel, I.; Cioara, T.; Salomie, I. Human Activity Recognition using Smartphone Sensors and Beacon-based Indoor Localization for Ambient Assisted Living Systems. In Proceedings of the 2020 IEEE 16th International Conference on Intelligent Computer Communication and Processing (ICCP), Cluj-Napoca, Romania, 3–5 September 2020; pp. 205–212. [Google Scholar]
- Ahmed, A.; Jalal, A.; Kim, K. A novel statistical method for scene classification based on multi-object categorization and logistic regression. Sensors 2020, 20, 3871. [Google Scholar] [CrossRef] [PubMed]
- Zhang, L.; Huang, L.; Yi, Q.; Wang, X.; Zhang, D.; Zhang, G. Positioning Method of Pedestrian Dead Reckoning Based on Human Activity Recognition Assistance. In Proceedings of the 2022 IEEE 12th International Conference on Indoor Positioning and Indoor Navigation (IPIN), Beijing, China, 5–7 September 2022; pp. 1–8. [Google Scholar]
- Yi, S.; Mirowski, P.; Ho, T.K.; Pavlovic, V. Pose Invariant Activity Classification for Multi-floor Indoor Localization. In Proceedings of the 2014 22nd International Conference on Pattern Recognition, Stockholm, Sweden, 24–28 August 2014; pp. 3505–3510. [Google Scholar]
- Jalal, A.; Khalid, N.; Kim, K. Automatic recognition of human interaction via hybrid descriptors and maximum entropy markov model using depth sensors. Entropy 2020, 22, 817. [Google Scholar] [CrossRef] [PubMed]
- Xue, T.; Liu, H. Hidden Markov Model and its application in human activity recognition and fall detection: A review. In International Conference in Communications; Springer: Singapore, 2021; pp. 863–869. [Google Scholar]
- Jalal, A.; Quaid, M.; Kim, K. A Wrist Worn Acceleration Based Human Motion Analysis and Classification for Ambient Smart Home System. J. Electr. Eng. Technol. 2019, 14, 1733–1739. [Google Scholar] [CrossRef]
- Rodrigues, J.; Liu, H.; Folgado, D.B.D.; Schultz, T.; Gamboa, H. Feature-based information retrieval of multimodal biosignals with a self-similarity matrix: Focus on automatic segmentation. Biosensors 2022, 12, 1182. [Google Scholar] [CrossRef] [PubMed]
- Liu, H.; Hartmann, Y.; Schultz, T. Motion Units: Generalized sequence modeling of human activities for sensor-based activity recognition. In 2021 29th European Signal Processing Conference (EUSIPCO); IEEE: New York, NY, USA, 2021; pp. 1506–1510. [Google Scholar]
- Mahmood, M.; Jalal, A.; Kim, K. WHITE STAG Model: Wise Human Interaction Tracking and Estimation (WHITE) using Spatio-temporal and Angular-geometric (STAG) Descriptors. Multimed. Tools Appl. 2020, 79, 6919–6950. [Google Scholar] [CrossRef]
- Liu, H.; Hartmann, Y.; Schultz, T. A Practical Wearable Sensor-based Human Activity Recognition Research Pipeline. In HEALTHINF; Science and Technology Publications, Lda: Setúbal, Portugal, 2022; pp. 847–856. [Google Scholar]
- Hsu, Y.-L.; Yang, S.-C.; Chang, H.-C.; Lai, H.-C. Human Daily and Sport Activity Recognition Using a Wearable Inertial Sensor Network. IEEE Access 2018, 6, 31715–31728. [Google Scholar] [CrossRef]
- Liu, H.; Schultz, T. How Long Are Various Types of Daily Activities? Statistical Analysis of a Multimodal Wearable Sensor-based Human Activity Dataset. In Healthinf; Science and Technology Publications, Lda: Setúbal, Portugal, 2022; pp. 680–688. [Google Scholar]
- Abdel-Basset, M.; Hawash, H.; Chang, V.; Chakrabortty, R.K.; Ryan, M. Deep Learning for Heterogeneous Human Activity Recognition in Complex IoT Applications. IEEE Internet Things J. 2022, 9, 5653–5665. [Google Scholar] [CrossRef]
- Jalal, A.; Kim, Y. Dense Depth Maps-based Human Pose Tracking and Recognition in Dynamic Scenes Using Ridge Data. In Proceedings of the IEEE International Conference on Advanced Video and Signal-Based Surveillance, Seoul, Republic of Korea, 26–29 August 2014; pp. 119–124. [Google Scholar]
- Konak, S.; Turan, F.; Shoaib, M.; Incel, Ö.D. Feature Engineering for Activity Recognition from Wrist-worn Motion Sensors. In Proceedings of the International Conference on Pervasive and Embedded Computing and Communication Systems, Lisbon, Portugal, 25–27 July 2016. [Google Scholar]
- Chetty, G.; White, M.; Akther, F. Smart Phone Based Data Mining for Human Activity Recognition. Procedia Comput. Sci. 2016, 46, 1181–1187. [Google Scholar] [CrossRef]
- Ehatisham-ul-Haq, M.; Azam, M.A. Opportunistic sensing for inferring in-the-wild human contexts based on activity pattern recognition using smart computing. Future Gener. Comput. Syst. 2020, 106, 374–392. [Google Scholar] [CrossRef]
- Cao, L.; Wang, Y.; Zhang, B.; Jin, Q.; Vasilakos, A.V. GCHAR: An efficient Group-based Context—Aware human activity recognition on smartphone. J. Parallel Distrib. Comput. 2018, 118, 67–80. [Google Scholar] [CrossRef]
- Gao, Z.; Liu, D.; Huang, K.; Huang, Y. Context-Aware Human Activity and Smartphone Position-Mining with Motion Sensors. Remote Sens. 2019, 11, 2531. [Google Scholar] [CrossRef]
- Fan, L.; Haghighi, D.P.; Zhang, Y.; Forkan, A.R.M.; Jayaraman, P.P. Context-Aware Human Activity Recognition (CA-HAR) Using Smartphone Built-In Sensors. In International Conference on Advances in Mobile Computing and Multimedia Intelligence; Springer: Berlin/Heidelberg, Germany, 2022; p. 13634. [Google Scholar]
- Parvez, M.; Jalal, A. Artificial neural network for human object interaction system over Aerial images. In IEEE ICACS; IEEE: New York, NY, USA, 2023. [Google Scholar]
- Azmat, U.; Jalal, A. Smartphone Inertial Sensors for Human Locomotion Activity Recognition based on Template Matching and Codebook Generation. In Proceedings of the 2021 International Conference on Communication Technologies (ComTech), Rawalpindi, Pakistan, 21–22 September 2021; pp. 109–114. [Google Scholar]
- Zhang, X.; Huang, D.; Li, H.; Zhang, Y.; Xia, Y.; Liu, J. Self-training maximum classifier discrepancy for EEG emotion recognition. In CAAI Transactions on Intelligence Technology; IEEE: Islamabad, Pakistan, 2023; pp. 1–12. [Google Scholar]
- Liu, H.; Xue, T.; Schultz, T. On a Real Real-Time Wearable Human Activity Recognition System. In Proceedings of the 16th International Joint Conference on Biomedical Engineering Systems and Technologies, Lisbon, Portugal, 16–18 February 2023; pp. 16–18. [Google Scholar]
- Hartmann, Y.; Liu, H.; Schultz, T. Interactive and Interpretable Online Human Activity Recognition. In Proceedings of the 2022 IEEE International Conference on Pervasive Computing and Communications Workshops and other Affiliated Events, Pisa, Italy, 21–25 March 2022; pp. 109–111. [Google Scholar]
- Hartmann, Y.; Liu, H.; Schultz, T. Feature Space Reduction for Multimodal Human Activity Recognition. In BIOSIGNALS; Science and Technology Publications, Lda: Setúbal, Portugal, 2020; pp. 135–140. [Google Scholar]
- Hartmann, Y.; Liu, H.; Schultz, T. Feature Space Reduction for Human Activity Recognition based on Multi-channel Biosignals, In BIOSIGNALS; Science and Technology Publications, Lda: Setúbal, Portugal, 2021; pp. 215–222. [Google Scholar]
- Podder, P.; Khan, T.Z.; Khan, M.H.; Rahman, M.M. Comparative performance analysis of hamming, hanning and blackman window. Int. J. Comput. Appl. 2014, 96, 1–7. [Google Scholar] [CrossRef]
- Liu, H.; Schultz, T. Biosignal Processing and Activity Modeling for Multimodal Human Activity Recognition. Ph.D. Thesis, Universität Bremen, Bremen, Germany, 2021. [Google Scholar]
- Zhang, J.; Zhu, C.; Zheng, L.; Xu, K. ROSEFusion: Random optimization for online dense reconstruction under fast camera motion. ACM Trans. Graph. (TOG) 2021, 40, 1–17. [Google Scholar]
- Amir, N.; Jalal, A.; Kim, K. Automatic human posture estimation for sport activity recognition with robust body parts detection and entropy markov model. Multimed. Tools Appl. 2021, 80, 21465–21498. [Google Scholar]
- Bao, N.; Zhang, T.; Huang, R.; Biswal, S.; Su, J.; Wang, Y. A deep transfer learning network for structural condition identification with limited real-world training data. Struct. Control. Health Monit. 2023, 2023, 8899806. [Google Scholar] [CrossRef]
- Bruijn, S.M.; Bregman, D.J.; Meijer, O.G.; Beek, P.J.; Dieën, V.J.H. Maximum Lyapunov exponents as predictors of global gait stability: A modelling approach. Med. Eng. Phys. 2012, 34, 428–436. [Google Scholar] [CrossRef]
- Jalal, A.; Nadeem, A.; Bobasu, S. Human body parts estimation and detection for physical sports movements. In Proceedings of the IEEE International Conference on Communication, Changchun, China, 11–13 August 2019. [Google Scholar]
- Han, W.; Chan, C.F.; Choy, C.S.; Pun, K.P. An efficient MFCC extraction method in speech recognition. In 2006 IEEE International Symposium on Circuits and Systems (ISCAS); IEEE: New York, NY, USA, 2006; p. 4. [Google Scholar]
- Batool, M.; Alotaibi, S.S.; Alatiyyah, M.H.; Alnowaiser, K.; Aljuaid, H.; Jalal, A.; Park, J. Depth sensors-based action recognition using a modified K-ary entropy classifier. IEEE Access 2023, 11, 58578–58595. [Google Scholar] [CrossRef]
- Jalal, A.; Mahmood, M. Students’ Behavior Mining in E-learning Environment Using Cognitive Processes with Information Technologies. Educ. Inf. Technol. 2019, 24, 2797–2821. [Google Scholar] [CrossRef]
- Banerjee, S.; Easwaramoorthy, D.; Gowrisankar, A. Fractal Functions, Dimensions and Signal Analysis; Springer: Berlin/Heidelberg, Germany, 2021. [Google Scholar]
- Guo, L.H.; Cheng, S.; Liu, J.; Wang, Y.; Cai, Y.; Hong, X.C. Does social perception data express the spatio-temporal pattern of perceived urban noise? A case study based on 3137 noise complaints in Fuzhou, China. Appl. Acoust. 2022, 201, 109129. [Google Scholar] [CrossRef]
- Abadleh, A.; Al-Mahadeen, B.M.; AlNaimat, R.M.; Lasassmeh, O. Noise segmentation for step detection and distance estimation using smartphone sensor data. Wirel. Netw. 2021, 27, 2337–2346. [Google Scholar] [CrossRef]
- Poulose, A.; Eyobu, O.S.; Han, D.S. An indoor position-estimation algorithm using smartphone IMU sensor data. IEEE Access 2019, 7, 11165–11177. [Google Scholar] [CrossRef]
- Manos, A.; Klein, I.; Hazan, T. Gravity-based methods for heading computation in pedestrian dead reckoning. Sensors 2019, 19, 1170. [Google Scholar] [CrossRef]
- Jalal, A.; Quaid, M.A.K.; Sidduqi, M.A. A Triaxial acceleration-based human motion detection for ambient smart home system. In Proceedings of the IEEE International Conference on Applied Sciences and Technology, Queretaro, Mexico, 27–28 November 2019. [Google Scholar]
- Jalal, A.; Batool, M.; Kim, K. Sustainable Wearable System: Human Behavior Modeling for Life-logging Activities Using K-Ary Tree Hashing Classifier. Sustainability 2020, 12, 10324. [Google Scholar] [CrossRef]
- Cruciani, F.; Vafeiadis, A.; Nugent, C.; Cleland, I.; McCullagh, P.; Votis, K.; Giakoumis, D.; Tzovaras, D.; Chen, L.; Hamzaoui, R. Feature learning for human activity recognition using convolutional neural networks: A case study for inertial measurement unit and audio data. CCF Trans. Pervasive Comput. Interact. 2020, 2, 18–32. [Google Scholar] [CrossRef]
- Saranya, S.S.; Fatima, N.S. IoT-Based Patient Health Data Using Improved Context-Aware Data Fusion and Enhanced Recursive Feature Elimination Model. IEEE Access 2022, 10, 128318–128335. [Google Scholar] [CrossRef]
- Javeed, M.; Jalal, A. Deep activity recognition based on patterns discovery for healthcare monitoring. In IEEE Conference on Advancements in Computational Sciences; IEEE: New York, NY, USA, 2023. [Google Scholar]
- Jalal, A.; Mahmood, M.; Sidduqi, M.A. Robust spatio-temporal features for human interaction recognition via artificial neural network. In IEEE Conference on International Conference on Frontiers of Information Technology; IEEE: New York, NY, USA, 2018. [Google Scholar]
- Qian, L.; Zheng, Y.; Li, L.; Ma, Y.; Zhou, C.; Zhang, D. A new method of inland water ship trajectory prediction based on long short-term memory network optimized by genetic algorithm. Appl. Sci. 2022, 12, 4073. [Google Scholar] [CrossRef]
- Quaid, M.A.K.; Jalal, A. Wearable Sensors based Human Behavioral Pattern Recognition using Statistical Features and Reweighted Genetic Algorithm. Multimed. Tools Appl. 2019, 79, 6061–6083. [Google Scholar] [CrossRef]
- Nadeem, A.; Jalal, A.; Kim, K. Human actions tracking and recognition based on body parts detection via Artificial neural network. In IEEE International Conference on Advancements in Computational Sciences; IEEE: New York, NY, USA, 2020. [Google Scholar]
- Bisma, R.; Ahmad, J. Object detection and segmentation for scene understanding via multi-features and random forest. In IEEE Conference on Advancements in Computational Sciences; IEEE: New York, NY, USA, 2023. [Google Scholar]
- Vaizman, Y.; Ellis, K.; Lanckriet, G. Recognizing detailed human context in the wild from smartphones and smartwatches. IEEE Pervasive Comput. 2017, 16, 62–74. [Google Scholar] [CrossRef]
- Wang, L.; Gjoreski, H.; Ciliberto, M.; Mekki, S.; Valentin, S.; Roggen, D. Enabling reproducible research in sensor-based transportation mode recognition with the Sussex-Huawei dataset. IEEE Access 2019, 7, 10870–10891. [Google Scholar] [CrossRef]
- Vaizman, Y.; Weibel, N.; Lanckriet, G. Context Recognition In-the-Wild: Unified Model for Multi-Modal Sensors and Multi-Label Classification. Proc. ACM Interact. Mob. Wearable Ubiquitous Technol. 2018, 1, 168. [Google Scholar] [CrossRef]
- Asim, Y.; Azam, M.A.; Ehatisham-ul-Haq, M.; Naeem, U.; Khalid, A. Context-Aware Human Activity Recognition (CAHAR) in-the-Wild Using Smartphone Accelerometer. IEEE Sens. J. 2020, 20, 4361–4371. [Google Scholar] [CrossRef]
- Abduallah, M.; Lejarza, F.; Cahail, S.; Claudel, C.; Thomaz, E. HAR-GCNN: Deep Graph CNNs for Human Activity Recognition From Highly Unlabeled Mobile Sensor Data. In 2022 IEEE International Conference on Pervasive Computing and Communications Workshops and Other Affiliated Events; IEEE: New York, NY, USA, 2022; pp. 335–340. [Google Scholar]
- Brimacombe, O.; Gonzalez, L.C.; Wahlstrom, J. Smartphone-Based CO2e Emission Estimation Using Transportation Mode Classification. IEEE Access 2023, 11, 54782–54794. [Google Scholar] [CrossRef]
- Akbari, A.; Jafari, R. Transition-Aware Detection of Modes of Locomotion and Transportation through Hierarchical Segmentation. IEEE Sens. J. 2020, 21, 3301–3313. [Google Scholar] [CrossRef]
- Sharma, A.; Singh, S.K.; Udmale, S.S.; Singh, A.K.; Singh, R. Early transportation mode detection using smartphone sensing data. IEEE Sens. J. 2020, 21, 15651–15659. [Google Scholar] [CrossRef]
- Liu, H.; Schultz, T. A Wearable Real-time Human Activity Recognition System using Biosensors Integrated into a Knee Bandage. In BIODEVICES; Science and Technology Publications, Lda: Setúbal, Portugal, 2019; pp. 47–55. [Google Scholar]


| Method | Algorithm | High Points | Limitations | Proposed Solution |
|---|---|---|---|---|
| Hsu et al. [31] | The sensors measured the accelerations and angular velocities of the human body and transmitted them wirelessly to a computer. The computer then applied a series of steps to process the signals and classified them into different activities using a nonparametric weighted feature extraction algorithm and a principal component analysis method. |
| System used only two sensors, which might not capture the full range of human motions and postures. It also requires a wireless connection between the sensors and the computer, which may be unreliable or unavailable in some environments. | More sensors are used to cover different parts of the human body, such as the torso, the backpack, the hand, and the pocket [32]. This allows us to capture more information and the diversity of human motions and postures. Moreover, smartphone embedded sensors have been used so as to recognize the human’s activities and locations, without relying on a wireless connection. |
| A-Basset et al. [33] | The system is based on heterogeneous human activity recognition (HHAR) and interprets the HHAR as an image classification problem. Their System encodes sensory data into a three-channel (RGB) picture representation and passes it through the system for the activity classification. |
| The system was trained on small datasets that makes the generalizability of the system uncertain. Moreover, the computational and space complexity of the system is unclear that makes the scalability of the system uncertain. | Diverse and large datasets were utilized in training of the system that enhances the generalizability of the proposed system. As the system is trained on large datasets, it can handle bigger datasets while maintaining its computational complexity [34]. |
| Konak et al. [35] | The system evaluates the performance of several sets of features taken from accelerometer readings and divides them into three classes: features related to motion, features related to orientation, and features related to rotation. Motion, orientation, and rotational information are used individually and in combination by the system to assess recognition performance. The analysis employs a number of categorization techniques, including decision trees, naive Bayes, and random forests. |
| Dataset used in the system was collected with the contribution of 10 subjects only that makes the generalizability of the system unceratin. Secondly, They used common machine learning classifiers for the activity reocgnition while advanced models may improve the performance of the system. | The proposed model uses the Extrasensory dataset for training that provides the data of 60 subjects. System achieves state-of-the-art performance over it and proves its ability to be more generalizable. Moreover, system uses a DNDF for the classification that ia an advanced classifier that possess the properties of both machine learning and deep learning classifiers. |
| Chetty et al. [36] | An innovative data analytic method for intelligent human activity recognition using smartphone inertial sensors was provided. The system used machine learning classifiers such as random forests, ensemble learning, and lazy learning and was based on an information theory-based feature ranking algorithm for the best feature selection. |
| Common machine learning algorithms including lazzy learning, random forest, and ensemble learning were trained on a single dataset. Single dataset might not cover all of the scenarios and can cause system to decay its performance while working in realtime scenarios. | The proposed system is trained on two benchmark datasets that cover a diverse range of activities. Specially, the Extrasensory dataset was collected in wild scenarios when there was not restrictions on the subjects contributing to the data collection. This makes the proposed system more dependable as compared to their system. |
| Ehatisham-ul-Haq et al. [37] | The framework introduced a novel activity-aware human context recognition method that predicted user contexts based on physical activity recognition (PAR) and learnt human activity patterns in various behavioral circumstances. The method linked fourteen various behavioral situations, including phone positions, with five daily living activities (lying, sitting, standing, walking, and running). Random Forest and other machine learning classifiers were employed in the evaluation of the suggested strategy. |
| The system mainly depended upon the accelerometer data for the predcition of activities, locations, and secondary activites. While for the location estimation, GPS and microphone data can be a very good addition. Moreover, the system uses a simple random forest for the classification task that can misclassify the complex activites. | The proposed system uses smartphone acclerometer, smartphone magnetometer, smartphone gyroscope, smartwatch accelerometer, smartwatch compas, smartphone GPS, and smartphone’s microphone. By encorporating diverse sensors, the system increases its robustness for the activity recognition and localization. Moreover, DNDF is more advanced than a simple random forest and more reliable in terms of its predictions. |
| Cao et al. [38] | The system presented an effective Group-based Context-aware classification approach GCHAR, for smartphone human activity recognition. In order to increase classification efficiency and decrease classification errors through context awareness, the system used a hierarchical group-based scheme. GCHAR used context awareness and a two-level hierarchical classification structure (inter-group and inner-group) to identify activity group transitions. |
| Their system used tri-axial accelerometer and tri-axial gyroscope to extract the data and process it for the activity classification as well as context awareness. Addition of more sensors can make the performance of the system better. | The proposed system utilizes diverse sensors for the activity recognition and localization. This property makes the proposed system more reliable as compared to their system. |
| Gao et al. [39] | The research presented a system for jointly recognizing smartphone location and human activity using motion sensors and the multi-task learning (MTL) technique. To combat the detrimental impacts of smartphone orientation change on recognition, the system used a novel data preprocessing technique that included a coordinate modification based on quaternions. The joint recognition model was created to produce results for multiple tasks using a single global model, thereby lowering processing requirements and enhancing recognition efficiency. |
| Their framework used only the motion sensors that could be a drawback especially when classifying the locations of the smartphone. | The proposed system uses GPS and microphone data along with the motion sensors to make the location classification more accurate and reliable. |
| Fan et al. [40] | In the paper, a Context-Aware Human Activity Recognition (CA-HAR) method was proposed with the goal of identifying human behaviours even while the smartphone was not on the user’s body. The system combined several sensor inputs from the smartphone and used ripple-down rules (RDR) and deep learning to identify activities. In order to solve the on-body location issue, RDR rules were developed using a context-activity model that took into account additional contextual data. |
| Real-time recognition performance may be impacted by the increased computational overhead caused by building and maintaining the context-activity model for RDR rules. | The proposed framework possesses the ability to accurately and robustly predict the human activities and the locations without the need of RDR rules. The extracts such features that generate distinctive representations of the activity examples and then trains a strong classifier such as DNDF for the activity and location classification. All these aspects, make the proposed system work better in challenging scenarios. |
Disclaimer/Publisher’s Note: The statements, opinions and data contained in all publications are solely those of the individual author(s) and contributor(s) and not of MDPI and/or the editor(s). MDPI and/or the editor(s) disclaim responsibility for any injury to people or property resulting from any ideas, methods, instructions or products referred to in the content. |
© 2023 by the authors. Licensee MDPI, Basel, Switzerland. This article is an open access article distributed under the terms and conditions of the Creative Commons Attribution (CC BY) license (https://creativecommons.org/licenses/by/4.0/).
Share and Cite
Alazeb, A.; Azmat, U.; Al Mudawi, N.; Alshahrani, A.; Alotaibi, S.S.; Almujally, N.A.; Jalal, A. Intelligent Localization and Deep Human Activity Recognition through IoT Devices. Sensors 2023, 23, 7363. https://doi.org/10.3390/s23177363
Alazeb A, Azmat U, Al Mudawi N, Alshahrani A, Alotaibi SS, Almujally NA, Jalal A. Intelligent Localization and Deep Human Activity Recognition through IoT Devices. Sensors. 2023; 23(17):7363. https://doi.org/10.3390/s23177363
Chicago/Turabian StyleAlazeb, Abdulwahab, Usman Azmat, Naif Al Mudawi, Abdullah Alshahrani, Saud S. Alotaibi, Nouf Abdullah Almujally, and Ahmad Jalal. 2023. "Intelligent Localization and Deep Human Activity Recognition through IoT Devices" Sensors 23, no. 17: 7363. https://doi.org/10.3390/s23177363
APA StyleAlazeb, A., Azmat, U., Al Mudawi, N., Alshahrani, A., Alotaibi, S. S., Almujally, N. A., & Jalal, A. (2023). Intelligent Localization and Deep Human Activity Recognition through IoT Devices. Sensors, 23(17), 7363. https://doi.org/10.3390/s23177363