1. Introduction
Spatiotemporal gait parameters refer to the measurements obtained from the analysis of the walking pattern, which includes the gait stride length parameter. Gait analysis is crucial in clinical applications such as physical medicine and rehabilitation. Usually, it provides information about movements (kinematics); the forces involved in moving (kinetics), gait parameters related to the size and timing of the gait pattern (spatiotemporal parameters); and sometimes the muscle activity (electromyography). It provides a comprehensive understanding of an individual’s walking ability, including their gait pattern, speed, and balance. In addition, it allows for the identification of abnormalities or deviations from typical gait patterns, which can aid in diagnosing and treating various conditions, including neurological disorders, musculoskeletal injuries, and developmental disorders. Gait analysis can also help to monitor the effectiveness of treatment interventions, providing valuable information for optimizing therapy and rehabilitation programs [
1].
Today, there are different systems available for instrumented gait analysis. However, these systems are expensive laboratory setups which mainly rely on multiple cameras. Therefore, these systems cannot be used outside of the laboratory. For spatiotemporal gait parameters, more specifically, solutions do exist for gait assessment outside of the laboratory. Such a solution is often a wearable device that comprises a sensor, an inertial measurement unit (IMU), and a processing unit (microcontroller, MCU). For example, the wearable Gait Up Physilog
® sensor [
2] combined with the GaitUP LAB software can perform gait assessment. The Xsens DOT [
3] is a wearable IMU sensor platform used to develop mobile motion analysis applications.
However, these existing wearable sensor devices are resource-constrained. They contain processing units with limited processing and memory capabilities. Furthermore, they are battery-powered and have low battery capacity; therefore, continuous sending of raw sensor data for an extended period will result in fast battery depletion. The solution which we propose is to perform data analytics and data processing locally on the wearable device. However, designing these data processing and efficient energy algorithms is a significant challenge for gait analysis [
4]. Our proposed solution includes embedded or tiny machine learning (tinyML) [
5,
6].
Spatiotemporal parameters can be estimated by a machine or deep learning model [
7,
8,
9,
10,
11]. Although the memory footprint of a deep learning model during inference is smaller than that while training the model, it can still lie outside of a processor’s available memory. Therefore, today’s challenge is the development of accurate machine and deep learning models for deployment on resource-constrained embedded devices. The design of these models requires a different design approach; namely, creating embedded machine learning or deep learning models is a trade-off between memory, latency, energy requirements, and model accuracy. These requirements must be considered at the initial phase of the design process. This article aims to design a machine learning model for gait stride length estimation which is deployable on a microcontroller.
A multilayer 1D convolutional neural network model is presented herein for gait stride length estimation using IMU sensor data in combination with a microcontroller as the processor. The proposed model can be deployed on a microcontroller, i.e., a Cortex-M4F 64 MHz with 1 MB Flash and 256 kB RAM. The model, the data and machine learning pipeline, and the state-of-the-art software tools (libraries and frameworks) which were utilized are explained in detail. In this article, a proof of concept is provided which indicates that accurate models for deployment on resource-constrained embedded devices are feasible. The results are directly relevant to the development of new wearables in gait analysis.
2. Related Work
This study uses the convolution neural network (CNN) topology as the model architecture with which to design a machine learning model to achieve gait stride length estimation for the purpose of gait analysis. A deployable model on a microcontroller, using relevant clinical gait data from an IMU sensor, was utilized.
Hannink et al. [
9] described two CNN models which were used to extract eight spatiotemporal gait parameters. In the study, they obtained measurements from 99 geriatric inpatients using a free walking test at a comfortable speed. The IMU sensors were attached laterally below the ankle joint on both the left and right feet, and the data were captured at a sample rate of 102.4 Hz. The data split was performed depending on the patient identifier. The data pre-processing consisted of extracting the annotated stride (from heel strike to heel strike), sensor calibration, and coordinate system transformation. Before feeding the data into the neural network, the signals were normalized to the respective sensor range and zero padding to a fixed length of 256 samples were performed. Two deep-learning models were built. Model A estimated the complete set of output variables with a combined model, and Model B comprised an ensemble of smaller networks. The model architecture for model A consisted of three convolutional layers with max-pooling, followed by three densely connected layers and a readout layer. Model B consisted of two convolutional layers with max-pooling, one dense layer, and a readout layer. The study demonstrated that, according to the unseen test data, that the mean accuracy and precision for the stride length was −0.34 ± 8.10 cm for model A and −0.15 ± 6.09 cm for model B. The model performance evaluation for the two models was based on a 10-fold cross-validation scheme, and as a reference, the GAITRite was used. During the design of both models, no hyperparameter tuning was performed.
Hannink et al. [
10] described a deep convolution neural network (DCNN) for stride length estimation in their geriatric analysis. The dataset was the same as that described in [
9]; however, data from 101 patients were taken for the neural network design. The data split was performed depending on the patient identifier, and the same pre-processing steps were performed as those described in [
9]. The trained network consisted of two convolutional layers and one dense layer. The study showed a mean accuracy and precision of 0.27 ± 5.43 cm for the stride length; the evaluation was based on a 10-fold cross-validation scheme; and the GAITRite was used as a reference. In the study, no hyperparameter tuning was performed.
Zrenner et al. [
11] described a DCNN. This model was trained on 27 (amateur) runners. The subjects were asked to run at different velocities. As IMU, an in-house developed sensor was used, and the IMU data were captured at a sample rate of 200 Hz. The sensors were located in the midsoles of the running shoe. Gait segmentation was performed before the data were fed to the deep learning network; no extra signal processing was performed. The deep learning model was a modified version described in [
8]. It consisted of two convolutional layers, two max pool layers, one flatting layer, one dense layer, and a readout layer. The authors also noted that they increased the number of epochs and modified the batch size. However, this did not improve the model performance nor its generalization. Apart from increasing the number of epochs and changing the batch size, no further hyperparameter tuning was performed. The mean accuracy and precision of the stride length was 1.3 ± 19.4 cm, and the evaluation was based on leave-one-subject-out cross-validation. This study used a motion capture system (Vicon Motion Systems Inc, Oxford, UK) as a gold standard for gait stride length.
Hannink et al. and Zrenner et al. showed that a CNN model combined with IMU data was able to estimate the gait stride length. However, embedded machine learning was not applied in any of the three studies.
3. Materials and Methods
3.1. Solution for an Intelligent Gait Monitoring System
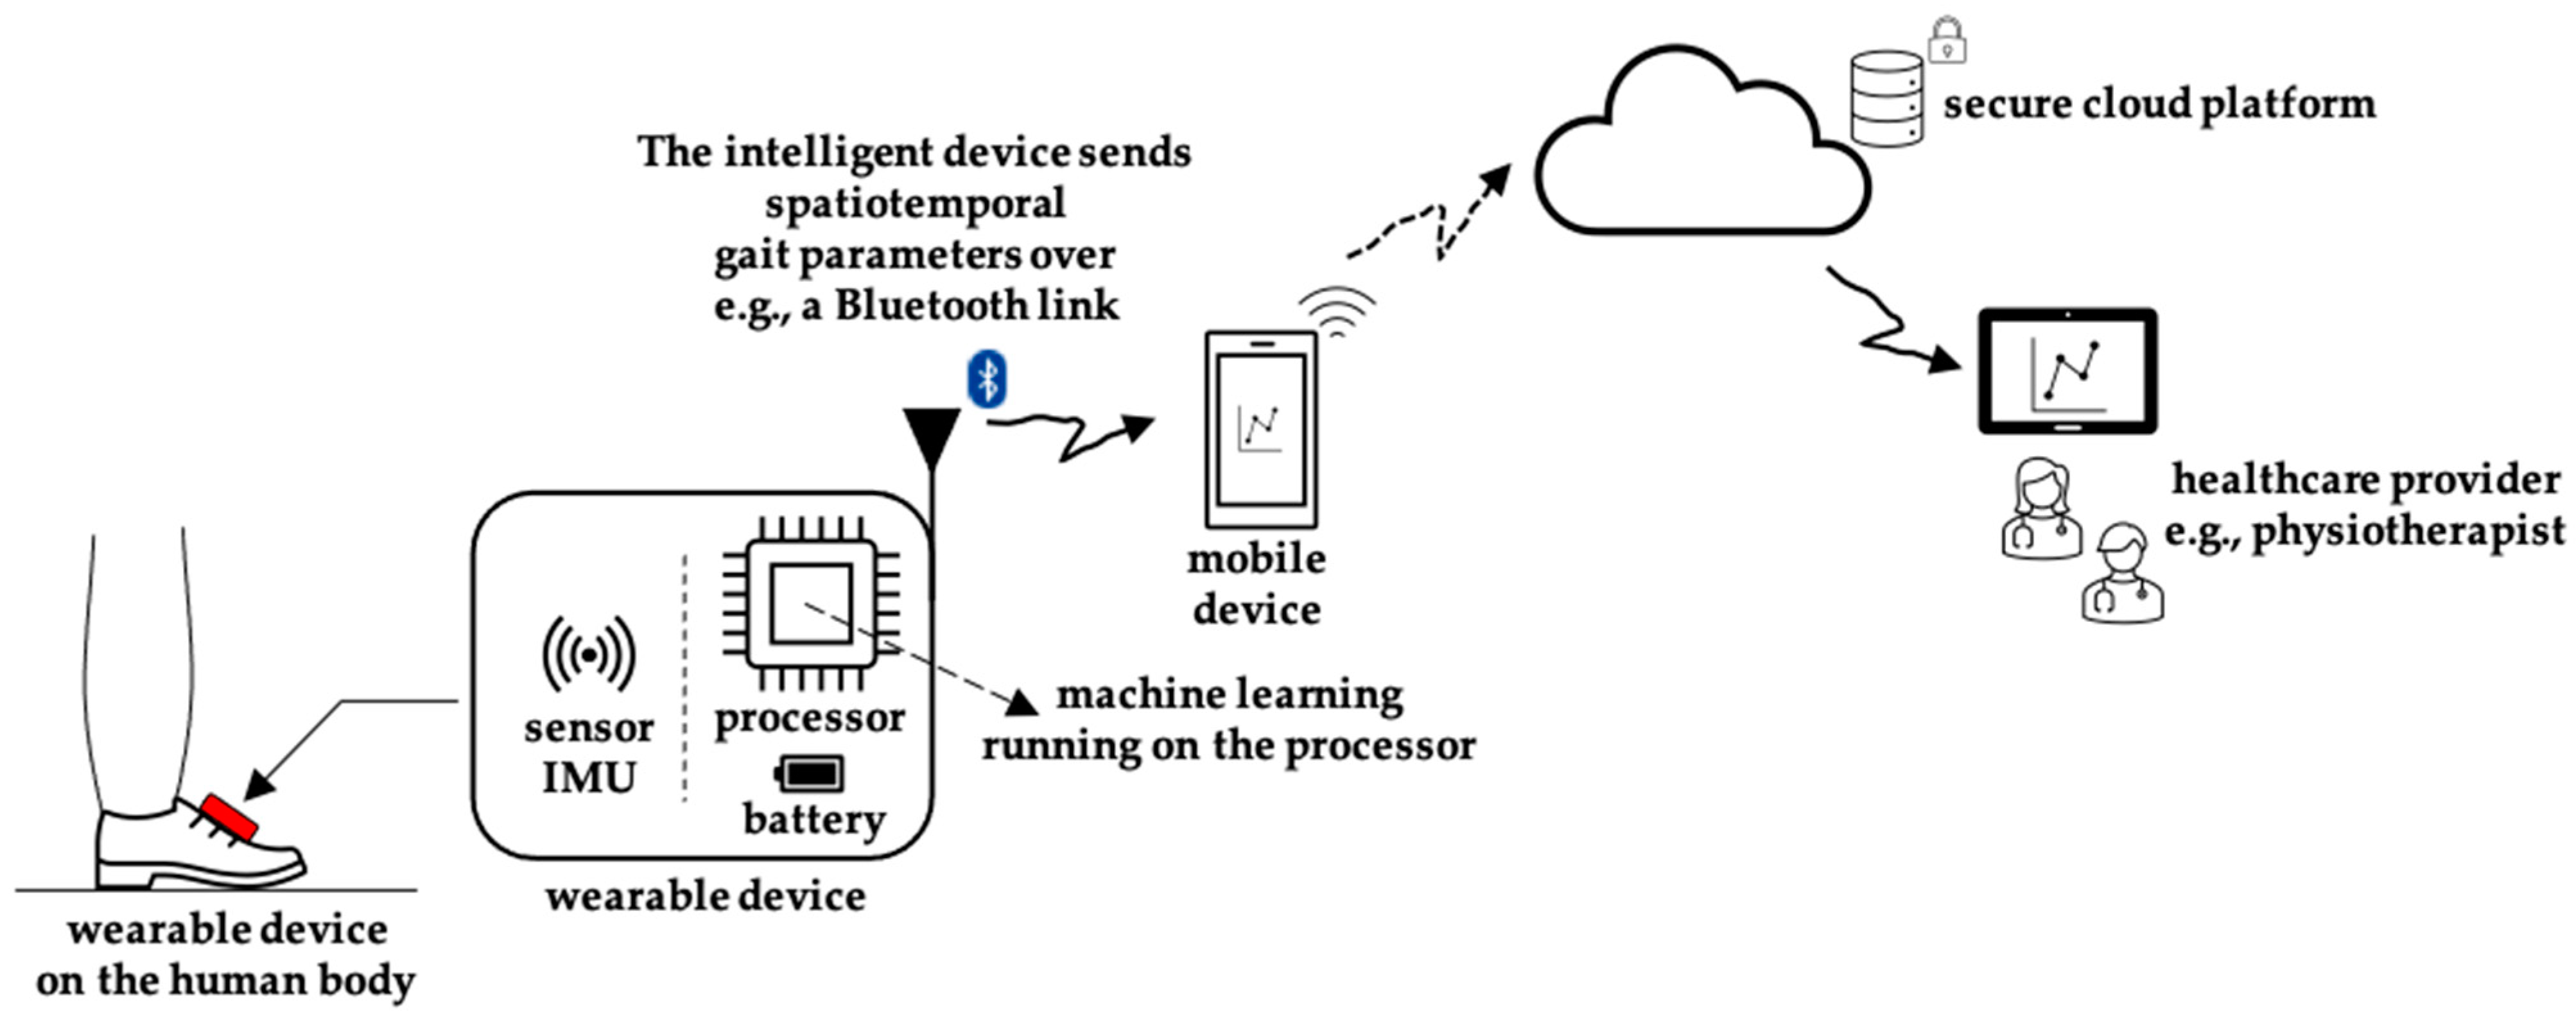
Figure 1 illustrates our proposed solution for an intelligent gait monitoring system for gait analysis outside the lab environment using embedded machine learning. A wearable device attached to the human body would estimate the spatiotemporal parameters locally on the device, and then send these parameters to, e.g., a mobile device. Optional spatiotemporal parameters would be sent to a secure Cloud platform and shared with the healthcare provider. This article focuses on the design of the embedded machine-learning model for gait stride length estimation, deployable on a microcontroller processor located inside a wearable device.
3.2. Dataset
The study presented in this article used the data from the TRIPOD—
Treadmill,
IMU,
Pedobarographic and Ph
otoelectric
Dataset [
12] study, available upon request for scientific research purposes. The measurements were obtained from 15 young and healthy participants (8 males, 7 females) who walked on a treadmill for two minutes at three different speeds (
Table 1). After two minutes, the treadmill slowed down until it stopped. The dataset also included data from seven IMU sensors (Physilog
® 5 IMUSs from Gait Up, Lausanne, Switzerland). The sensors were located on the left and right instep, left and right heel, left and right shank, and one at the sacrum. The data were acquired at a sample rate of 128 Hz. The IMU data for the three different walking speeds are provided in a CSV file (RF.csv).
Additionally, one file (SyncInfo.csv) contains the timestamp of the initial contact. The ground truth was measured by a pressure-sensitive Zebris (zebris Medical GmbH, Isny, Germany) and photoelectric OptoGait (Microgate, Bolzano, Italy) system. In the multilayer 1D convolutional neural network design, only data from the IMU sensor attached to the right foot, instep position, were used. As ground truth, we used the stride length from the OptoGait system, which is provided in a CSV file (optogait.csv).
3.3. Data Pre-Processing and Machine Learning Workflow
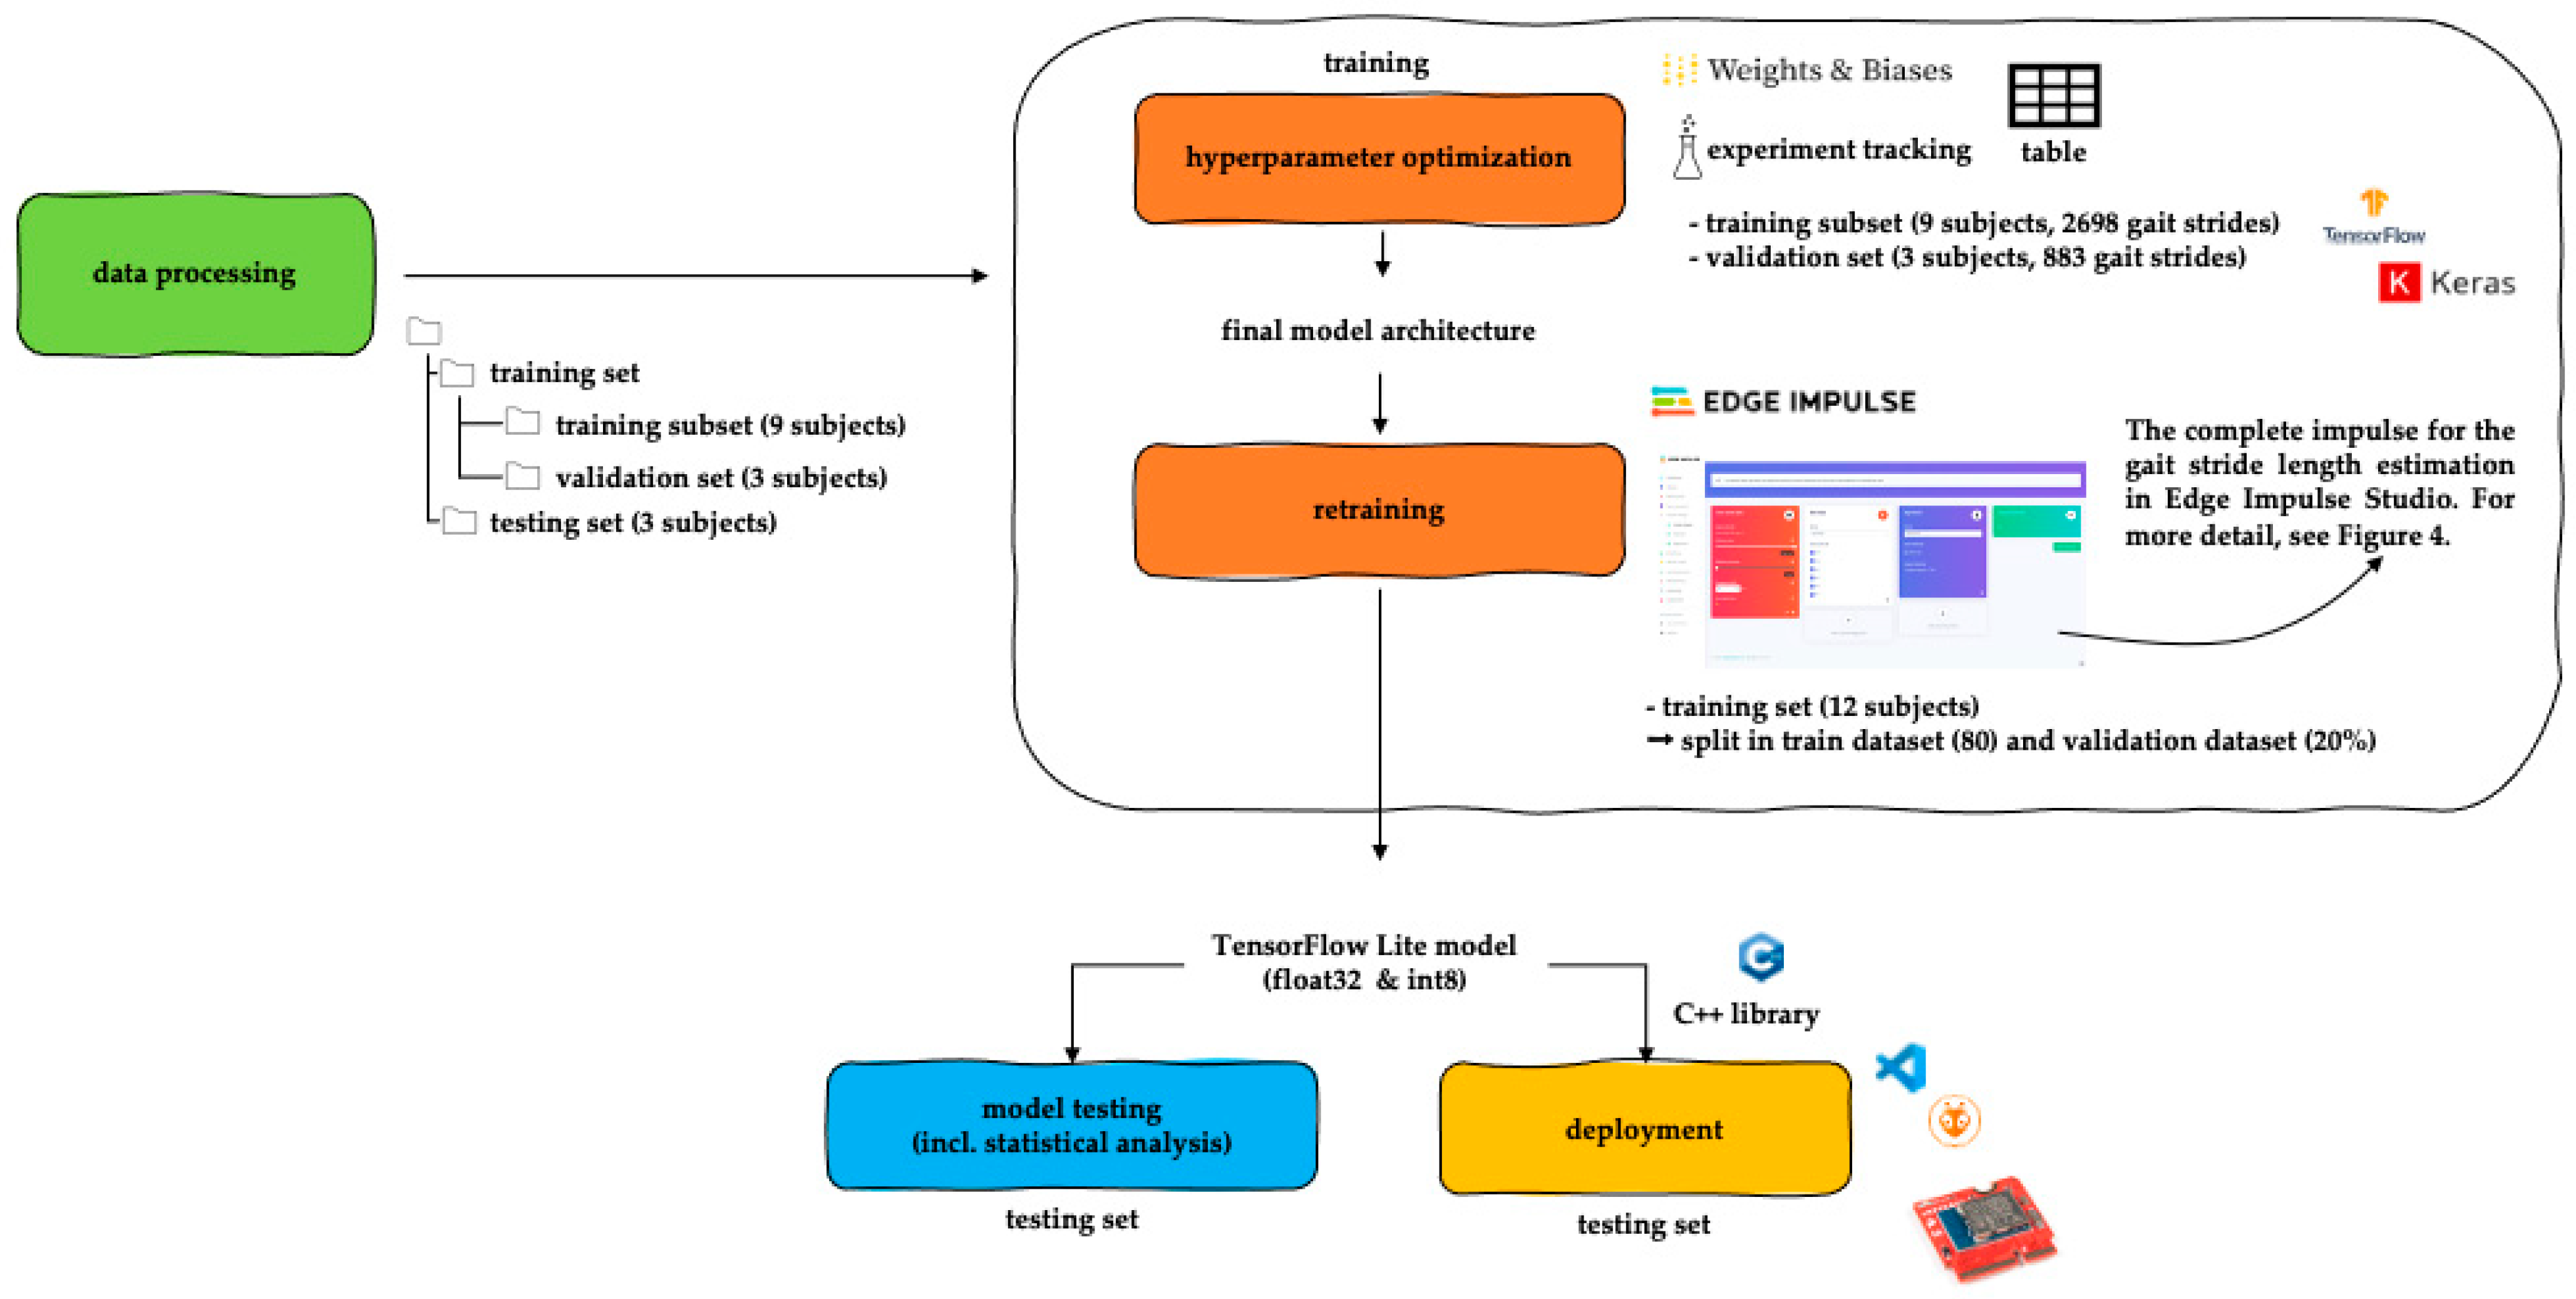
The model development workflow (
Figure 2) consists mainly of 4 parts: data processing, model training, model testing (including statistical analysis), and deployment.
3.3.1. Data Processing
While constructing the labeled dataset, we only used the first two minutes of the IMU data, starting from the first estimated initial contact. Different pre-processing steps were performed before the labeled sensor data was applied to the multilayer convolutional neural network. The data pre-processing was written in Python 3.10 [
13] and SciPy v.1.9.3 [
14]. The following pre-processing steps were performed:
The pre-processing of the data resulted in a dataset of 4467 gait strides. The dataset was divided, depending on the participants’ identifier (SUB <xx>), into a training set (12 subjects, 3581 gait strides) and a testing set (3 subjects, 886 gait strides).
3.3.2. Training
The model training consisted of two phases. First, hyperparameter optimization was performed. We used the machine learning operation (MLOps) platform Weights & Biases, wandb version 0.12.20 [
17], for experiment tracking. The training was performed on a 64-bit Intel
® Core™ i9-10900K CPU (20 cores), 3.70 GHz, 128 GB RAM, and an NVIDIA GeForce RTX3080 GPU type. The OS which we utilized was Ubuntu 20.04.5 LTS. The TensorFlow (version 2.10.0) deep learning framework, using the Keras high-level API [
18], was used in this study.
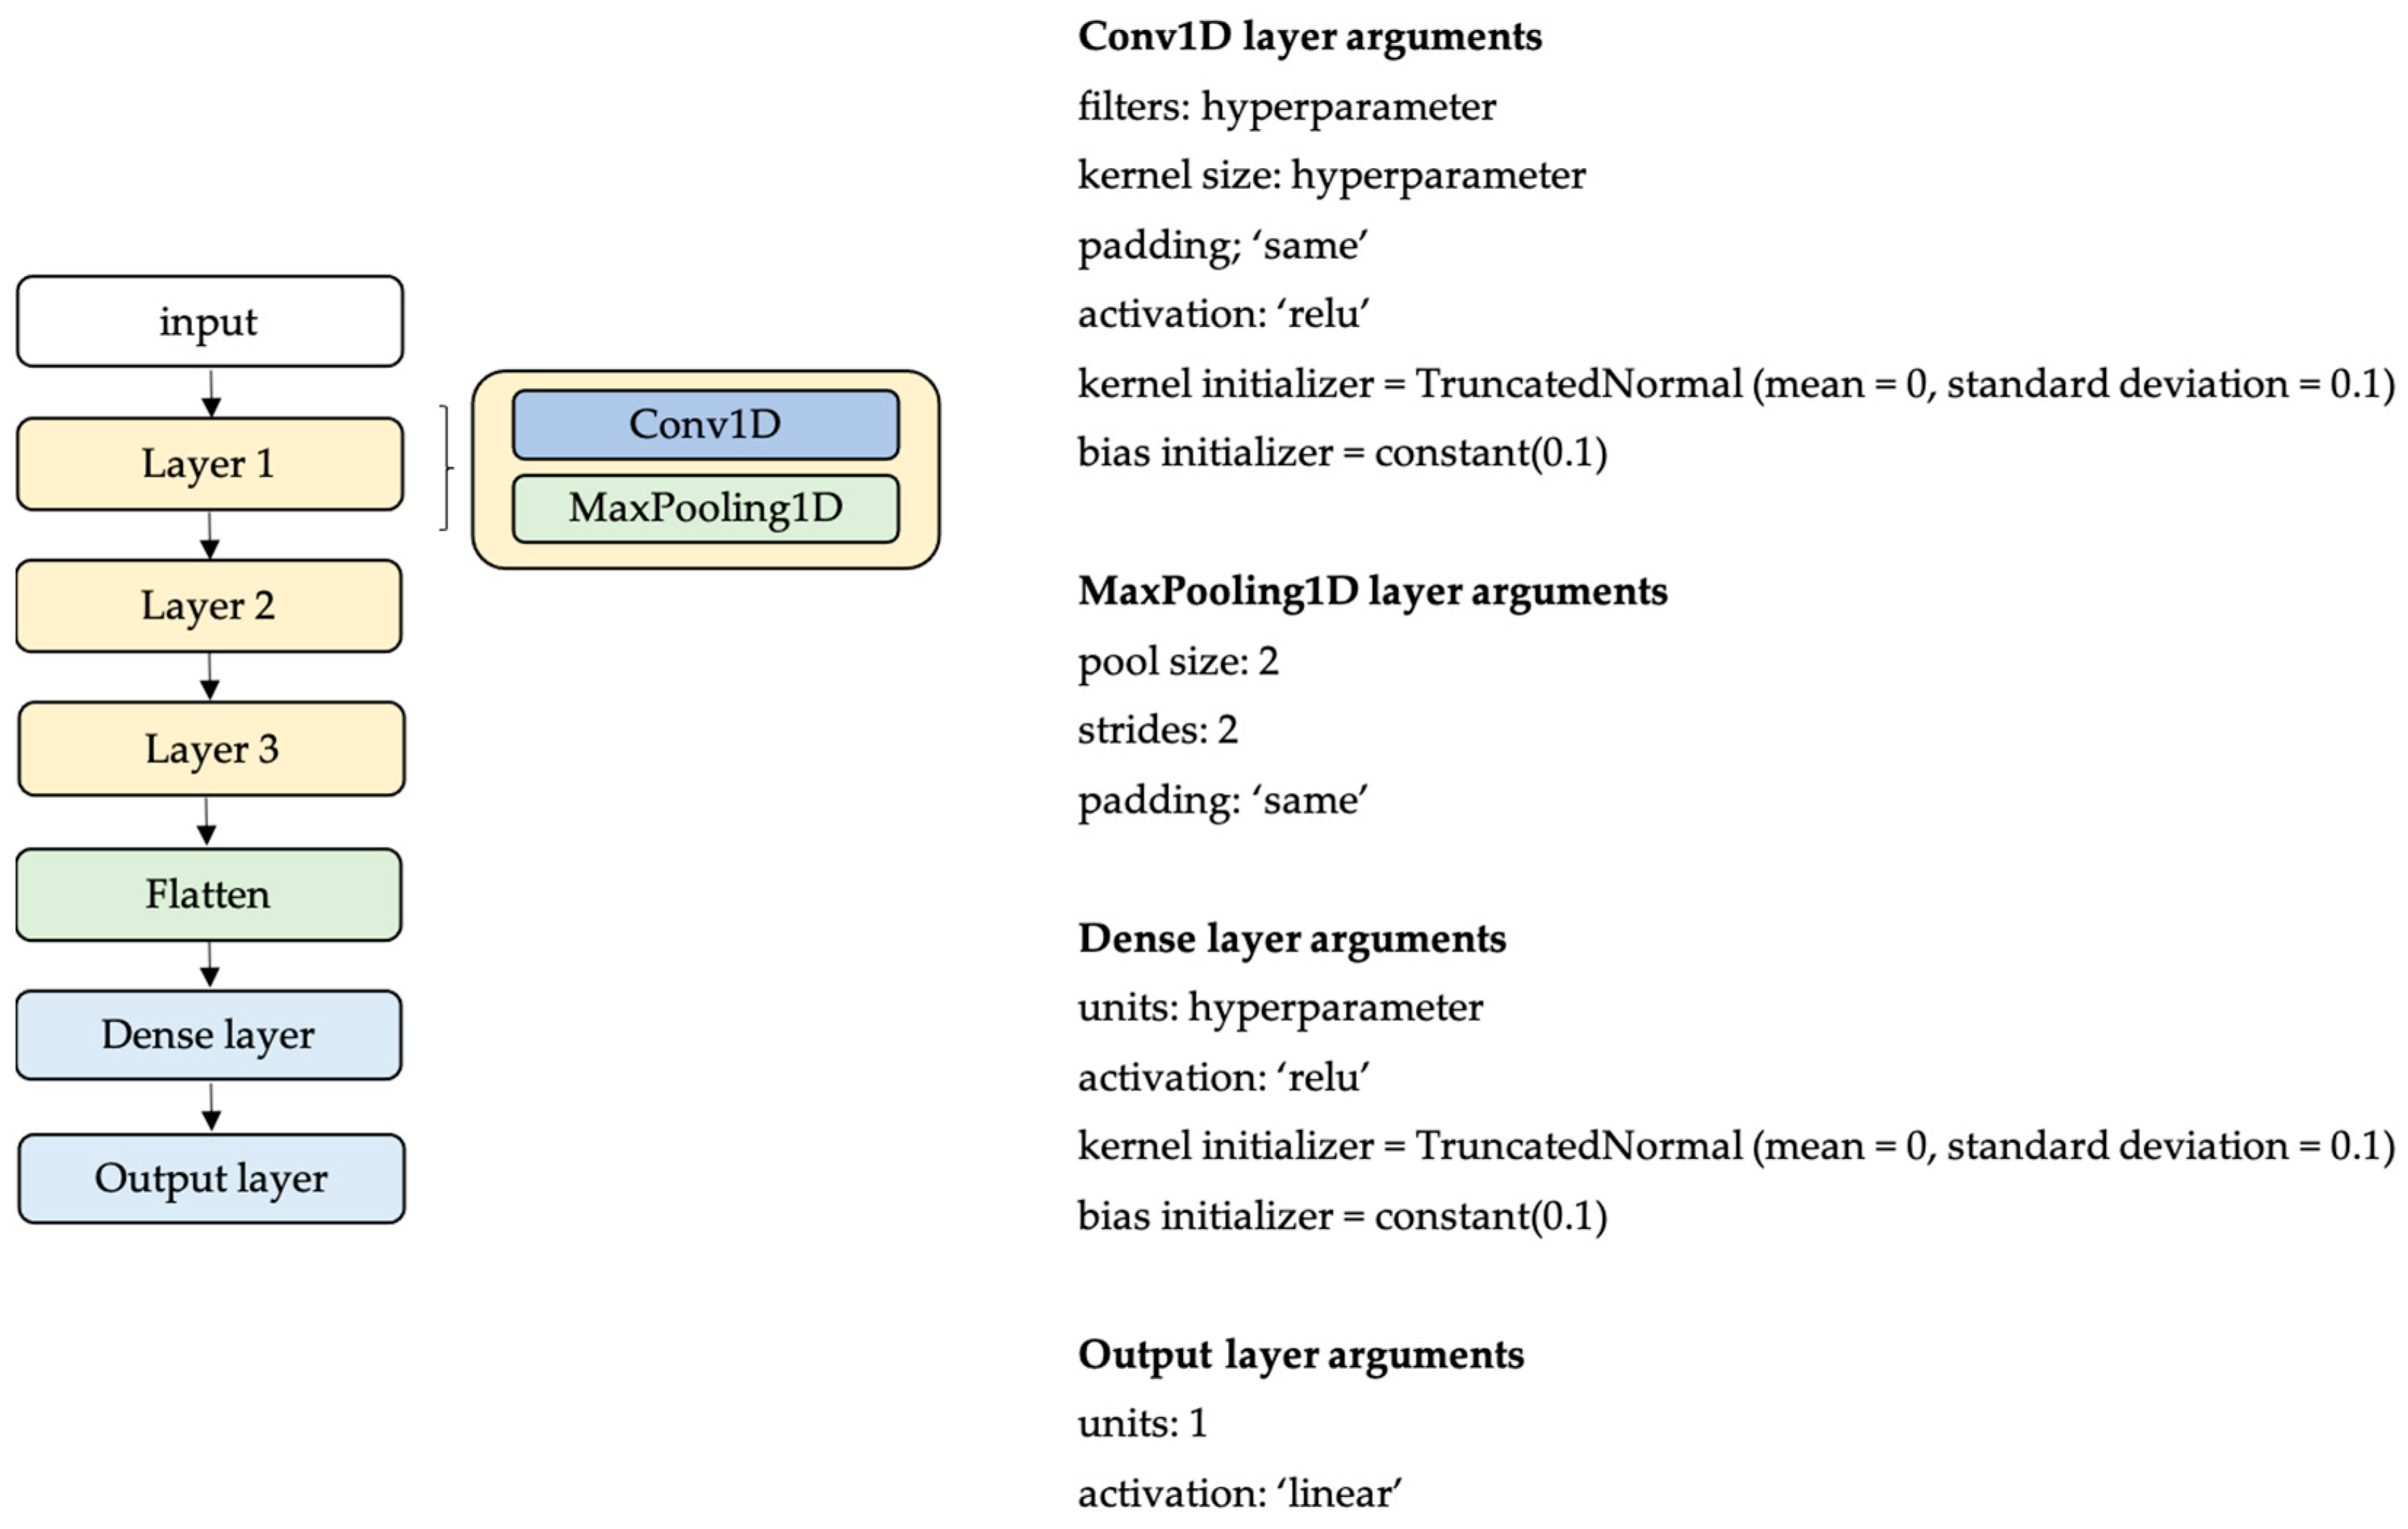
The model architecture,
Figure 3, consists of three 1D convolutional (Conv1D) and max-pooling layers, followed by a fully connected layer (Dense Layer) and an output layer. For optimization, the Adam optimizer was used (β
1 = 0.9, β
2 = 0.999 and ε = 1e
−8). The number of epochs was set to 1500. Kernel initialization (truncated normal, mean = 0, stdev = 0.1) and bias (constant = 0.1) initialization were applied to the Conv1D layer and the dense layer, respectively. The Conv1D filters and kernel size, the number of units for the dense layer, and the learning rate and batch size were the hyperparameters in the model design (
Table 2). As a search strategy, the grid search method was applied. The training and validation mean squared error as well as the model parameters, filters, kernel sizes, units, learning rates, and batch sizes were logged and summarized in a table on weights and biases.
Hold-out cross-validation was used during hyperparameter tuning. Therefore, the training set (12 subjects, 3581 gait strides) obtained during the data processing step was further divided depending on the participants’ identifiers (SUB <xx>), into a training subset (9 subjects, 2698 gait strides) and a validation set (3 subjects, 883 gait strides). Before the data were fed into the neural network, zero padding was applied, fixing the signal length for each sensor axis to 108 samples.
After ending the hyperparameter tuning, the model was retrained using the cloud-based MLOps platform Edge Impulse Studio [
19] (
Figure 4) (Edge Impulse, San Jose, CA, USA). The projects in Edge Impulse studio were divided into a series of blocks representing the data flow. The different blocks combined resulted in an impulse.
Figure 4 shows the workflow, in Edge Impulse Studio, with the various blocks. The left block, “Time series data”, represents the labeled data. The window size was set to 1.8 sec, and zero padding was applied. The zero padding fixed the length for each axis to the same signal length (108 samples) used during the hyperparameter tuning phase. The middle block was the processing block. The raw data processing block was selected in this study. The scale axis in the processing block was set to one because normalization was already applied during the data pre-processing step. The output of the raw data processing block provided data without pre-processing or signal processing being applied. The learning block followed the raw data processing; a regression learning block was selected. The training settings and neural network architecture were defined in the learning block.
During the retraining phase in Edge Impulse Studio, the training set (12 subjects, 3581 gait strides) obtained during the data processing step was divided into a ‘train dataset’ (80%) and a ‘validation dataset’ (20%). No further model optimizations, i.e., hyperparameter tuning, were performed. The retraining in Edge Impulse Studio resulted in a TensorFlow Lite model transformed into a float32 and a quantized int8 model. The int8 model required a representative dataset for its quantization [
20]. In this study, the validation dataset was used as the representative dataset.
3.3.3. Model Testing and Statistical Analysis
Given the testing set (from the three subjects, 886 gait strides) obtained during the data processing step, the stride length was predicted using the float32 and the int8 models. This testing set was never used during hyperparameter optimization nor the retraining phase in Edge Impulse Studio. The Band–Altman plot [
21] assessed the float32, the int8 model prediction, and the ground truth agreement. The bias (mean error), the upper and lower limits of agreement (LoA), and the minimal detectable change (MDC) were calculated [
22]. Additionally, the mean square error (MSE) and R-squared (R
2) were provided.
3.3.4. Deployment
Edge Impulse Studio provides optimized source code libraries. This source code library can be further customized and integrated into an application. In this study, we selected the Arduino library and used PlatformIO [
23] (Core 6.1.6, Home 3.4.3) to build the firmware. The embedded platform which we selected and used for evaluation was the SparkFun MicroMod with an nRF52840 Processor Board (v1.0) [
24] mounted on a SparkFun MicroMod Data Logging Carrier Board (v1.2) [
25] (SparkFun, Colorado, USA). The nRF52840 was an Arm
® Cortex
®-M4F 64 MHz processor from Nordic Semiconductor, with 1 MB internal flash and 256 kB internal RAM.
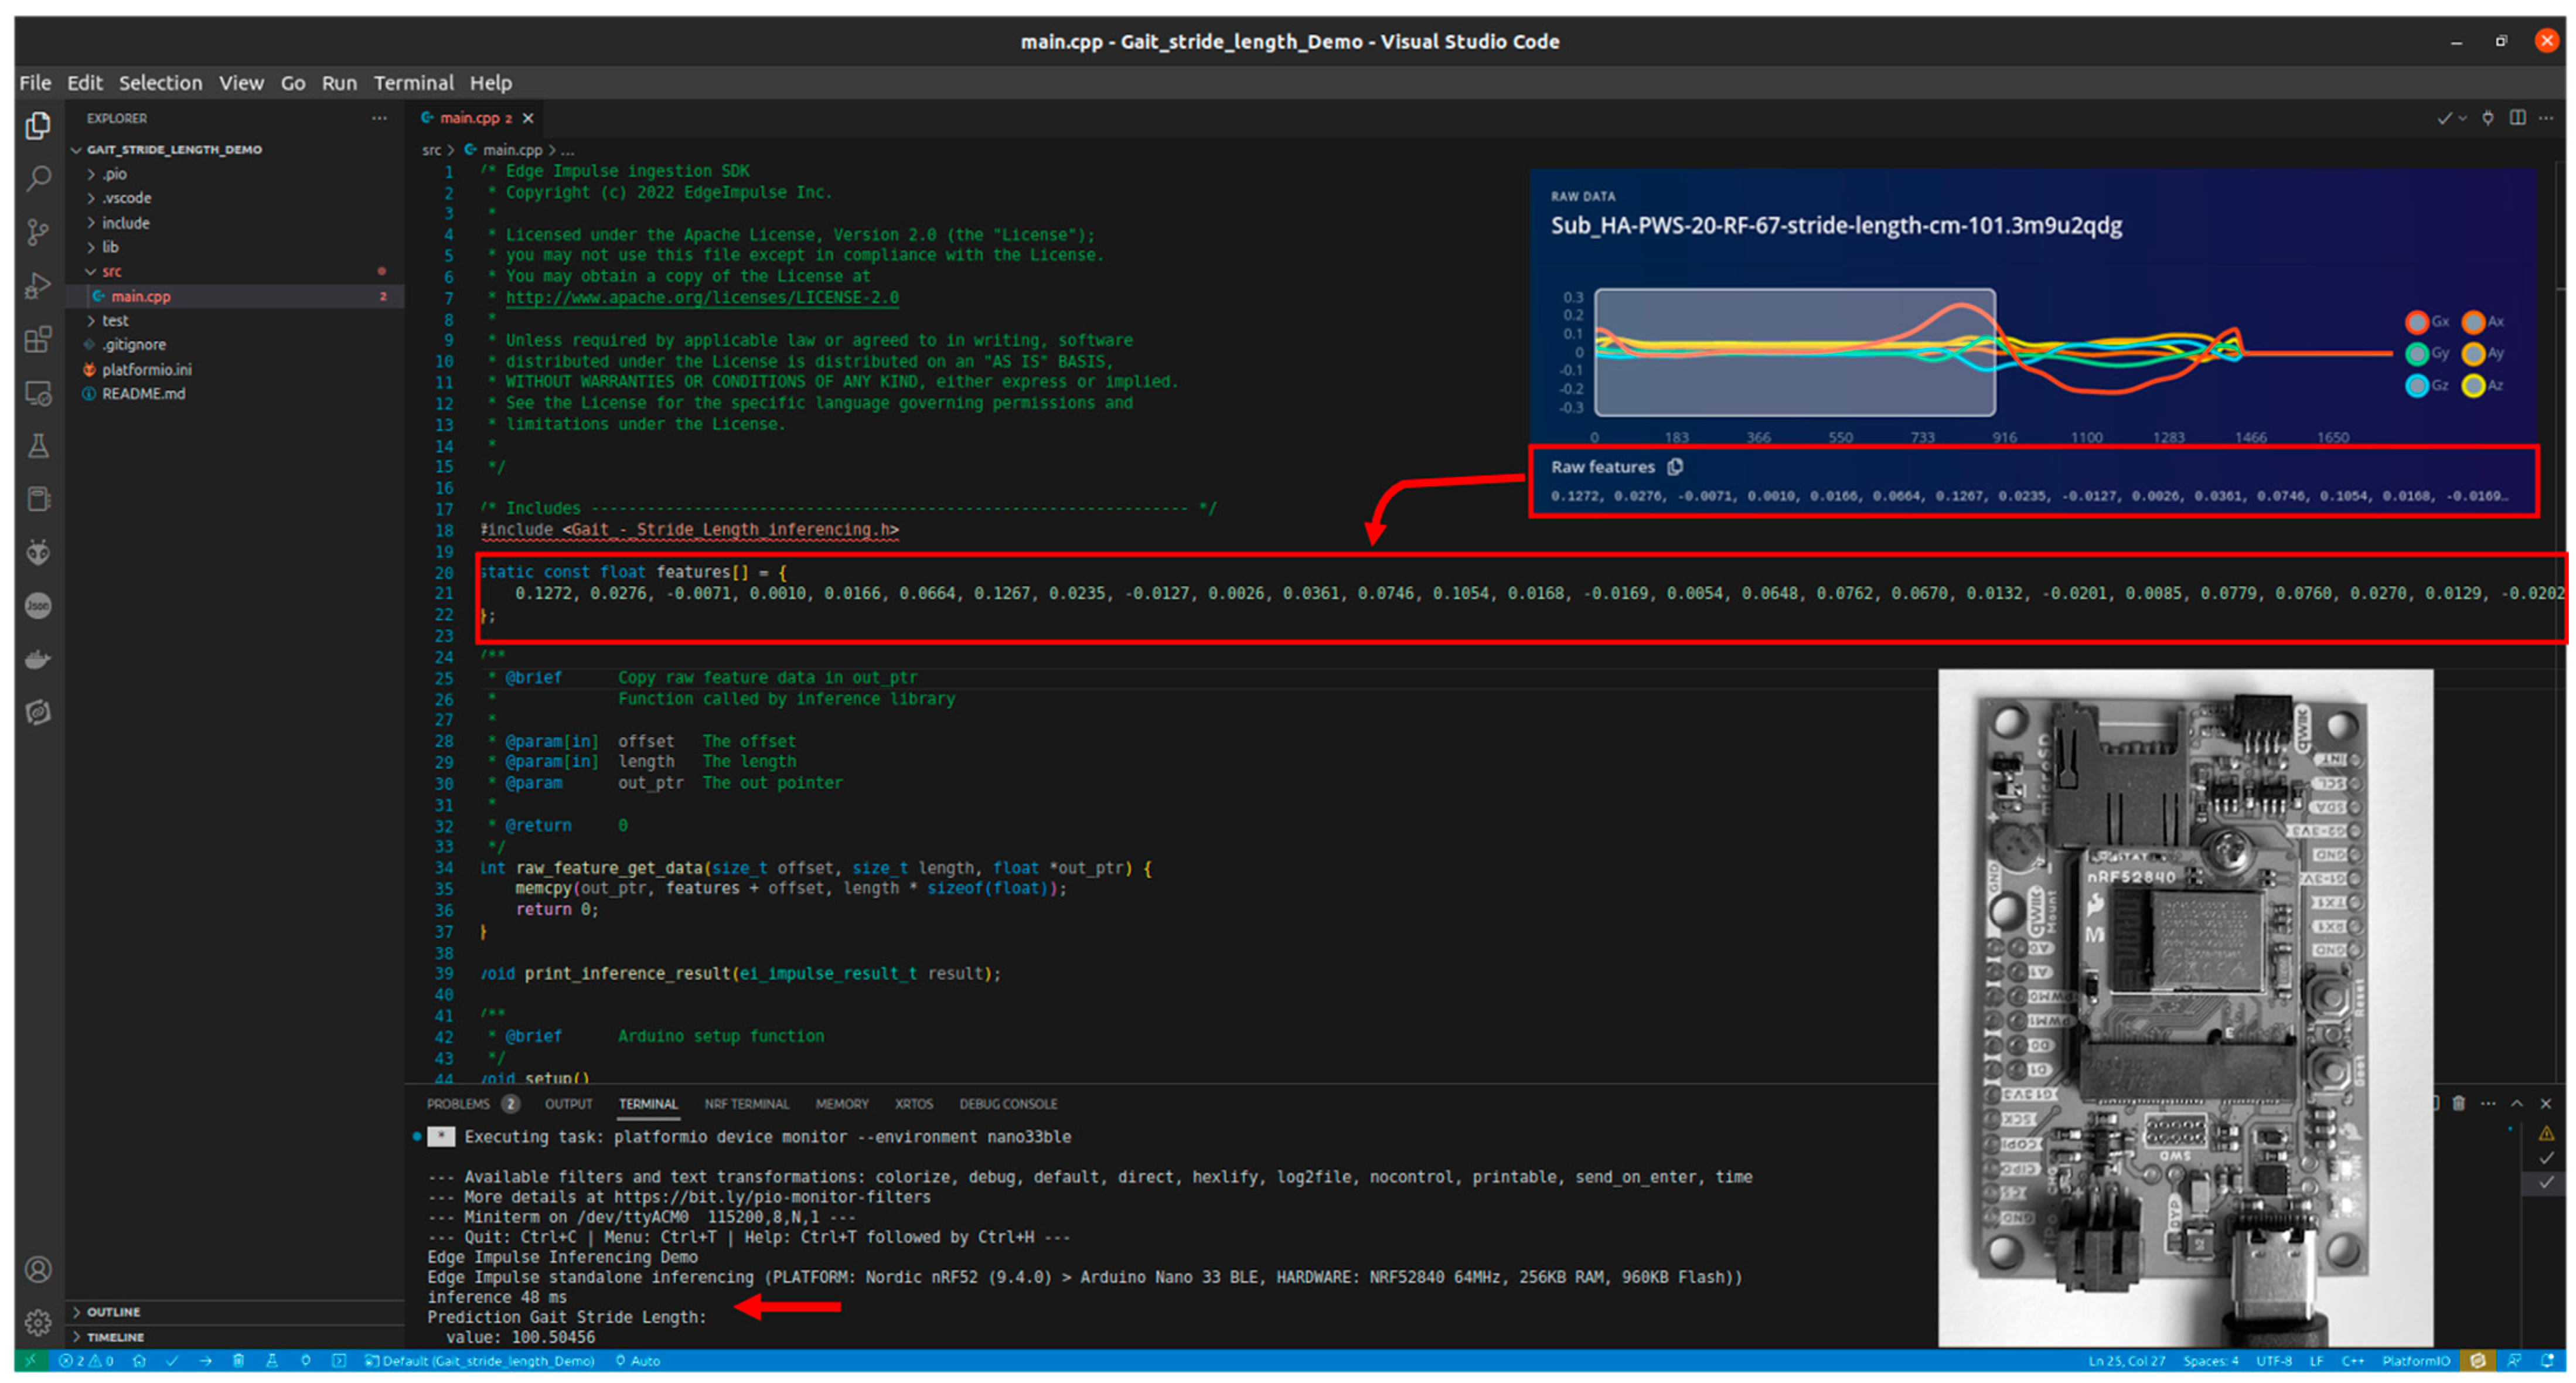
We used the static buffer implementation example from Edge Impulse (
Figure 5) to test the model on the device. In this implementation, the raw features from one gait cycle were copied into a static buffer. These features were fed to the input neural network. This implementation allowed us to test the model inference without connecting a microcontroller to an actual IMU sensor. Using Edge Impulse Studio, an estimation of memory usage (RAM and flash) and latency was performed. Afterwards, the PlatformIO tool was used to estimate the RAM and Flash memory of the deployed model on the nRF52840 processor.
4. Results
4.1. Training—Hyperparameter Tuning
The hyperparameter tuning resulted in an optimal model for the given TRIPOD dataset. The outcome of the hyperparameter tuning showed a batch size of 64 and a learning rate of 0.0001; the obtained filter and kernel size for the three Conv1D layers and the units for the dense layer are shown in
Table 3.
4.2. Retraining Using Edge Impulse Studio and Deployment
The model architecture (
Figure 3), using the model parameters shown in
Table 3, was retrained and tested using Edge Impulse Studio. For model evaluation, we used a testing set of 3 subjects (886 gait strides). The testing set was never used during hyperparameter optimization nor the retraining phase in Edge Impulse Studio.
Table 4 shows the calculated MSE, limits of agreement, mean error, and R
2.
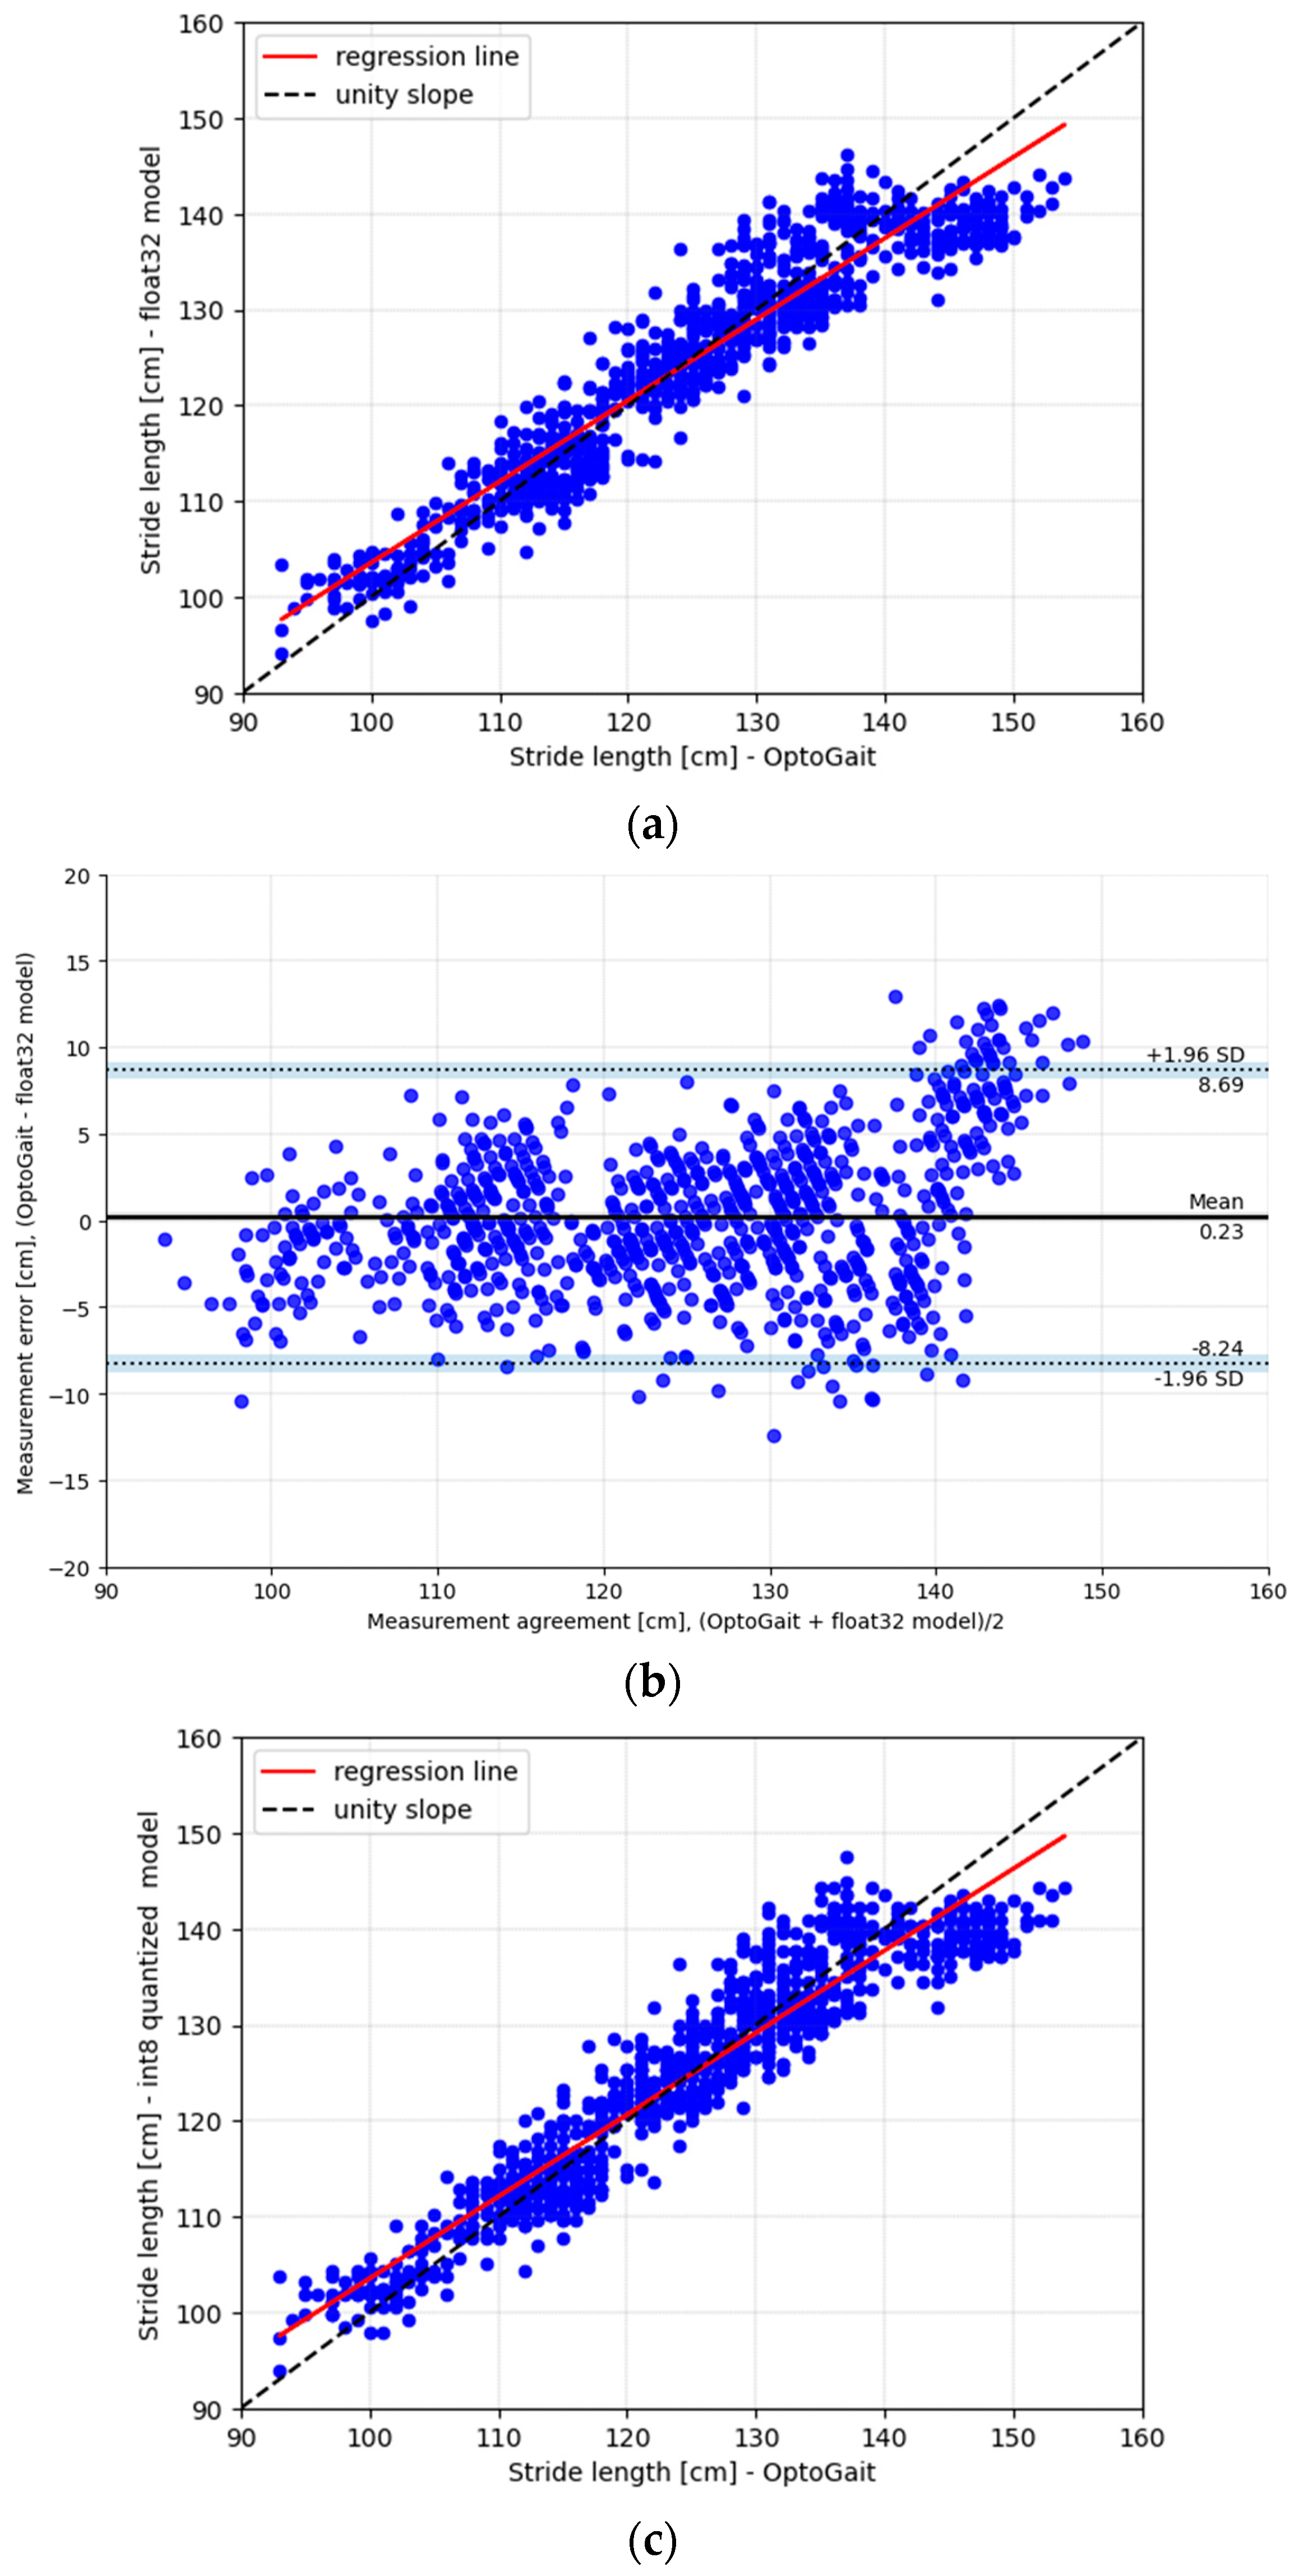
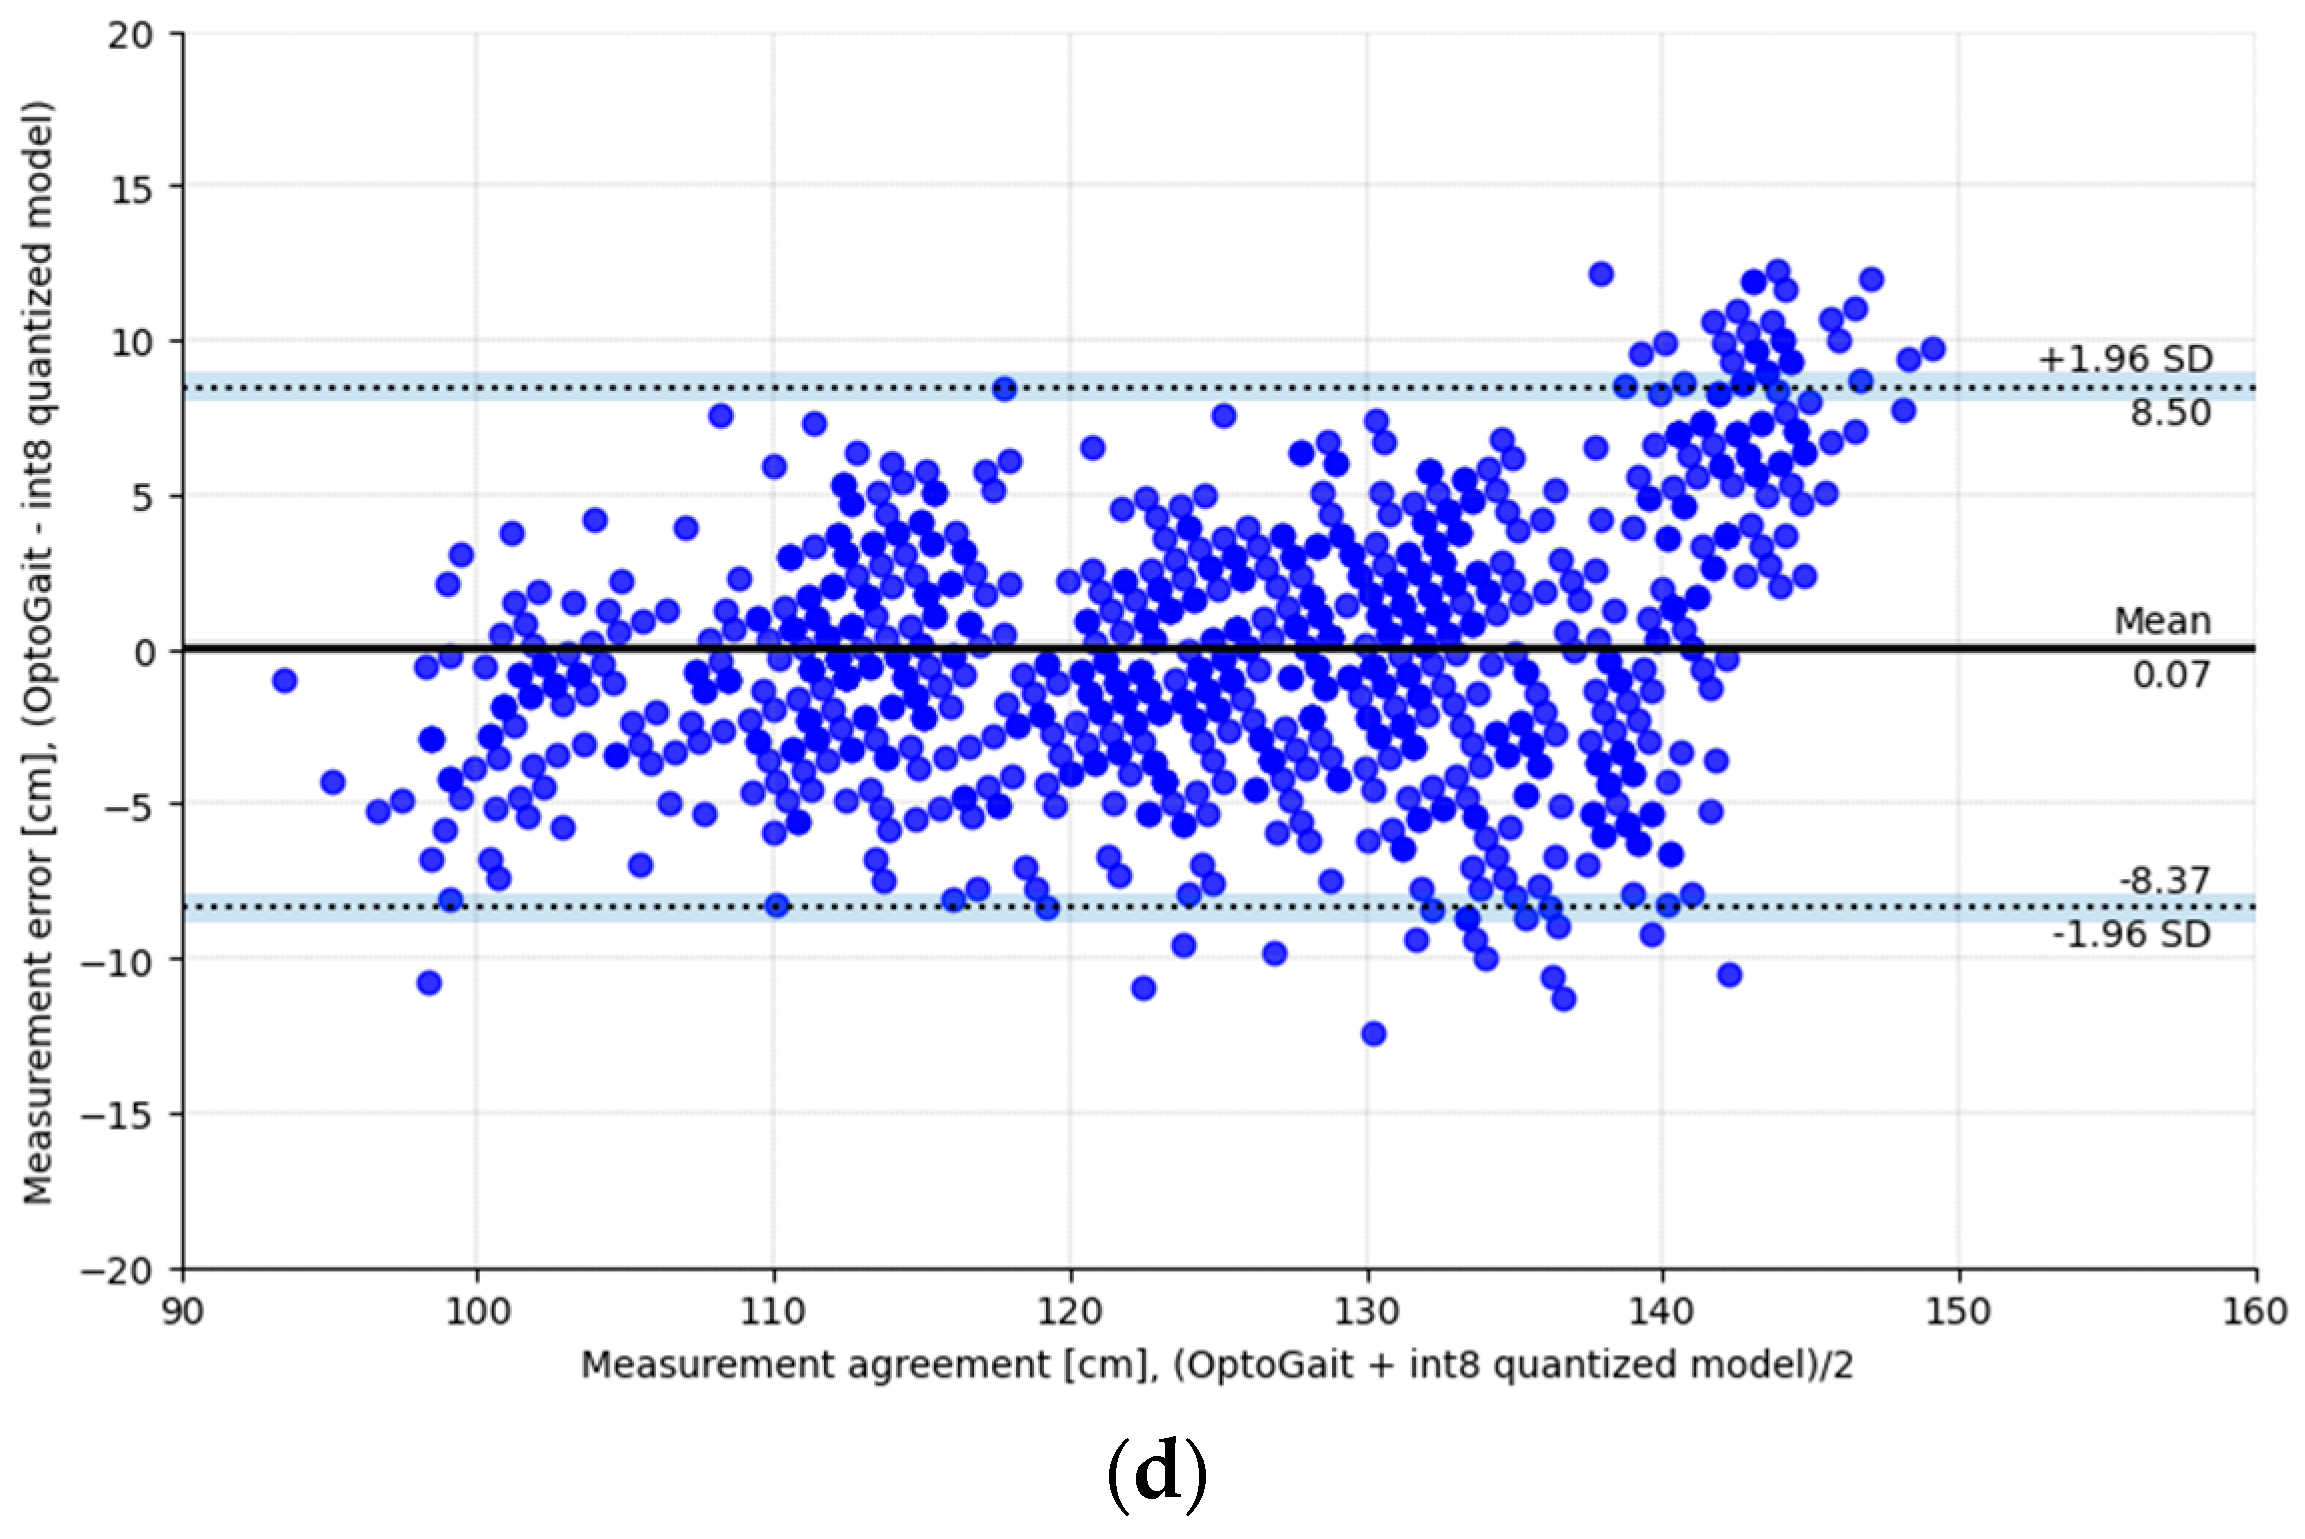
Figure 6 compares the estimated and the measured stride length. Additionally, the Bland–Altman plot for the stride length estimated for float32 and the int8 is provided.
Table 5 shows the memory estimate by Edge Impulse Studio for float32 and the int8 model,
Table 6 shows the model performance using leave-one-out cross-validation, and
Table 7 shows the memory estimation by the PlatformIO tool.
5. Discussion
This study aimed to create a model design for gait stride length estimation that could be deployed on a microcontroller. The final model architecture consisted of three 1D convolutional (Conv1D) and max-pooling layers, followed by a fully connected layer (dense layer) and an output layer (
Figure 3). The outcome of the hyperparameter tuning resulted in a model architecture with model parameters as presented in
Table 3.
In this study, leave-one-out cross-validation was used to evaluate the model’s performance,
Table 8. Compared to Zrenner et al. [
11], this led to an improvement in standard deviation: 8.35 cm vs. 19.4 cm (
Table 8). It must be noted, however, that the dataset used in the study of Zrenner et al. comprised data from runners running overground, and no hyperparameter tuning was performed. Compared to Hannink et al. [
9,
10], the multilayer 1D convolutional model presented in this study still had a slight bias of 1.7 cm and a higher standard deviation. However, making a fair comparison was difficult due to differences in the dataset (geriatric inpatients vs. healthy subjects) and in the model performance evaluation (10-fold cross-validation vs. leave-one-out cross-validation). For future research, a more standardized model performance comparison for embedded machine learning will be needed in order to make a fairer comparison.
It should be emphasized that unlike the studies of Zrenner et al. and Hannink et al., the model presented herein needed to be deployed on a resource-constrained device. Therefore, during the model’s optimization and the selection of the final model, not only does MSE need to be taken into consideration, but the memory and latency requirements must also be examined.
The model’s architecture (
Figure 3), with its parameters provided in
Table 3, was retrained in Edge Impulse Studio, resulting in a float32 and int8 quantized model. Quantization to an int8 model results in a smaller model size, occupying less memory and decreasing inference time. Quantization can potentially reduce the accuracy of the model. However, in the present study, as shown in
Table 4, for the given model architecture, model parameters, and dataset, no MSE decrease was observed between the float32 and the quantized int8 model. The float32 model had a mean error of 0.23 ± 4.3 cm, a memory usage of 284.5 kB flash and 31.9 kB RAM, and an inference time of 769 ms. The int8 model had a mean error of 0.07 ± 4.3 cm, a memory usage of 91.6 kB flash and 13.6 kB RAM, and an inference time of 80 ms. Various pre-processing steps were required before the data were fed to the multilayer convolutional neural network. In this study, the pre-processing block, consisting of filtering, initial contact detection, and gait segmentation, was not implemented on the embedded devices and, therefore, was not included in the latency or memory calculations.
Both models were able to be deployed on the nRF52840, an Arm
® Cortex
®-M4F 64 MHz processor from Nordic Semiconductor, with 1 MB internal flash and 256 kB internal RAM. The memory consumption estimated by PlatformIO (
Table 7) was higher than the values shown in
Table 5. This difference was caused by the necessary code dependencies.
6. Study Limitations
The study’s main limitation was the limited available data. The TRIPOD dataset consisted of only 15 young (average age of 26.4 ± 3.7 years) healthy participants (8 males, 7 females) walking on a treadmill. The pre-processing of the data resulted in a dataset of 4467 gait strides which was divided into a training set (12 subjects, 3581 gait strides) and a testing set (3 subjects, 886 gait strides). In order to estimate the performance, only a limited portion of the dataset was used for testing; it consisted of a limited number of gait strides (886) from only three subjects. Moreover, we did not investigate the generalization of the model to a different clinical population.
7. Conclusions
In this study, we aimed to create an embedded machine-learning model for gait stride length estimation that could be deployed on a microcontroller. A float32 and int8 multilayer 1D convolutional neural network is presented. The float32 model developed herein demonstrated a mean accuracy and precision of 0.23 ± 4.3 cm, and the int8 model showed a mean accuracy and precision of 0.07 ± 4.3 cm. For the given model’s architecture, parameters, and dataset, no MSE decrease was observed between the float32 and the quantized int8 model. The memory usage for the float32 model was 284.5 kB flash and 31.9 kB RAM. The int8 model memory usage was 91.6 kB flash and 13.6 kB RAM. Both models were able to be deployed on a microcontroller. In this study, the nRF52840, an Arm® Cortex®-M4F 64 MHz processor from Nordic Semiconductor with 1 MB internal flash and 256 kB internal RAM, was selected as the processor for evaluation.
The study’s outcome shows that a gait stride length estimation directly on a resource-constrained embedded device is feasible and demonstrates the potential of embedded machine learning in designing wearable devices for gait analysis. However, to unlock the full potential of embedded machine learning for gait analysis, we need more standardized clinical datasets from different populations which are measured by various IMU sensors and at different on-body locations. Additionally, a more standardized method of comparing the performances of embedded machine learning techniques is required in order to make a fairer comparison of models, given their training datasets.
Author Contributions
Conceptualization, J.R.V.; methodology, J.R.V.; software, J.R.V.; validation, J.R.V.; formal analysis, J.R.V.; investigation, J.R.V.; resources, J.R.V.; data curation, J.R.V., writing—original draft preparation, J.R.V.; writing—review and editing, B.B., S.T., W.S., P.V.d.W. and P.M.; visualization, J.R.V.; supervision, S.T., P.V.d.W. and P.M.; project administration, J.R.V.; funding acquisition, J.R.V. All authors have read and agreed to the published version of the manuscript.
Funding
This research was supported by the Karel de Grote University of Applied Sciences and Arts through funding by the Flemish government specifically allocated to practice-based research at universities of applied sciences.
Institutional Review Board Statement
Not applicable.
Informed Consent Statement
Not applicable.
Data Availability Statement
Not applicable.
Conflicts of Interest
The authors declare no conflict of interest.
References
- Tishya, A.L.; Wren, C.A.; Tucker, S.A.; Rethlefsen, G.E.G., III; Ounpuu, S. Clinical Efficacy of instrument gait analysis: Systematic review 2020 update. Gait Posture 2020, 80, 274–279. [Google Scholar]
- Physilog Digital Motion Analytics Platform. Available online: https://www.gaitup.com/ (accessed on 10 April 2023).
- Alcala, E.R.D.; Voerman, J.A.; Konrath, J.M.; Vydhyanathan, A. Xsens DOT Wearable Sensor Platform White Paper. Available online: https://www.movella.com/hubfs/Downloads/Whitepapers/Xsens%20DOT%20WhitePaper.pdf (accessed on 10 April 2023).
- Saboor, A.; Kask, T.; Kuusik, A.; Alam, M.M.; Le Moullec, Y.; Niazi, I.K.; Zoha, A.; Ahmad, R. Latest Research Trends in Gait Analysis Using Wearable Sensors and Machine Learning: A Systematic Review. IEEE Access 2020, 8, 167830–167864. [Google Scholar] [CrossRef]
- tinyML Foundation. Available online: https://www.tinyml.org (accessed on 6 February 2023).
- Diab, M.S.; Rodriguez-Villegas, E. Embedded Machine Learning Using Microcontrollers in Wearable and Ambulatory Systems for Health and Care Applications: A Review. IEEE Access 2022, 10, 98450–98474. [Google Scholar] [CrossRef]
- McGinnes, R.S.; Mahadevan, N.; Moon, Y.; Seagers, K.; Sheth, N.; Wright, J.A.; DiCristofaro, S.; Silva, I.; Jortberg, E.; Ceruolo, M.; et al. A machine learning approach for gait estimation using skin-mounted wearable sensors: From healthy controls to individuals with multiple sclerosis. PLoS ONE 2017, 12, e0178366. [Google Scholar] [CrossRef] [PubMed]
- Sui, J.; Chang, T.-S. IMU Based Deep Stride Length Estimation with Self-Suppervised Learning. IEEE Sens. J. 2021, 21, 7380–7387. [Google Scholar] [CrossRef]
- Hannink, J.; Kautz, T.; Pasluosta, C.F.; Gaßmann, K.-G.; Klucken, J.; Eskofier, B.M. Sensor-Based Gait Parameter Extraction with Deep Convolutional Neural Networks. IEEE J. Biomed. Health Inf. 2017, 21, 85–93. [Google Scholar] [CrossRef] [PubMed]
- Hannink, J.; Kautz, T.; Pasluosta, C.F.; Barth, J.; Schülein, S.; Gaßmann, K.-G.; Klucken, J.; Eskofier, B.M.; Eskofier, B. Mobile Stride Length Estimation with Deep Convolutional Neural Networks. IEEE J. Biomed. Health Inf. 2018, 22, 354–362. [Google Scholar] [CrossRef] [PubMed]
- Zrenner, M.; Gradl, S.; Jensen, U.; Ulrich, M.; Eskofier, B.M. Comparison of Different Algorithms for Calculating Velocity and Stride Length in Running Using Inertial Measurement Units. Sensors 2018, 18, 4194. [Google Scholar] [CrossRef] [PubMed]
- Trautmann, J.; Zhou, L.; Brahms, C.M.; Tunca, C.; Ersoy, C.; Granacher, U.; Arnrich, B. TRIPOD—A treadmill Walking Dataset with IMU, Pressure-Distribution and Photoelectric Data for Gait Analysis. Data 2021, 6, 95. [Google Scholar] [CrossRef]
- Python. Available online: https://www.python.org (accessed on 6 February 2023).
- SciPy. Available online: https://docs.scipy.org/doc/scipy-1.9.3/ (accessed on 6 February 2023).
- Maqbool, H.; Husman, M.A.B.; Awad, M.I.; Abouhossein, A.; Iqbal, N.; Dehghani-Sanji, A.A. A Real-time Gait Event Detection for Lower Limb Prosthesis Control and Evaluation. IEEE Trans. Neural Syst. Rehabil. Eng. 2017, 25, 1500–1509. [Google Scholar] [CrossRef]
- Edge Impulse Data Acquisition Format. Available online: https://docs.edgeimpulse.com/reference/data-ingestion/data-acquisition-format (accessed on 6 February 2023).
- Biewald, L. Experiment Tracking with Weights and Biases, Weights & Biases. Available online: http://wandb.com/ (accessed on 6 February 2023).
- Keras. Available online: https://keras.io/ (accessed on 6 February 2023).
- Hymel, S.; Banbury, C.; Situnayake, D.; Elium, A.; Ward, C.; Kelcey, M.; Baaijens, M.; Majchrzycki, M.; Plunkett, J.; Tishler, D.; et al. Edge Impulse: An MLOps Platform for Tiny Machine Learning. arXiv 2022, arXiv:2212.03332. Available online: https://arxiv.org/abs/2212.03332 (accessed on 6 February 2023).
- Post-Training Quantisation. Available online: https://www.tensorflow.org/lite/performance/post_training_quantization (accessed on 6 February 2023).
- Bland, J.M.; Douglas, G.A. Statistical methods for assessing agreement between two methods of clinical measurements. Int. J. Nurs. Stud. 2010, 47, 931–936. [Google Scholar] [CrossRef]
- Haghayegh, S.; Kang, H.-A.; Khoshnevis, S.; Smolensky, M.H.; Diller, K.R. A comprehensive guideline for Bland-Altman and intra class correlation calculations to properly compare two methods of measurements and interpret findings. Physiol. Meas. 2020, 41, 055012. [Google Scholar] [CrossRef] [PubMed]
- PlatformIO. Available online: https://platformio.org (accessed on 6 February 2023).
- SparkFun MicroMod nRF52840 Processor Board. Available online: https://www.sparkfun.com/products/16984 (accessed on 6 February 2023).
- SparkFun MicroMod Data Logging Carrier Board. Available online: https://www.sparkfun.com/products/16829 (accessed on 6 February 2023).
| Disclaimer/Publisher’s Note: The statements, opinions and data contained in all publications are solely those of the individual author(s) and contributor(s) and not of MDPI and/or the editor(s). MDPI and/or the editor(s) disclaim responsibility for any injury to people or property resulting from any ideas, methods, instructions or products referred to in the content. |
© 2023 by the authors. Licensee MDPI, Basel, Switzerland. This article is an open access article distributed under the terms and conditions of the Creative Commons Attribution (CC BY) license (https://creativecommons.org/licenses/by/4.0/).


 ,
, 


