
Computer-Aided Bleeding Detection Algorithms for Capsule Endoscopy: A Systematic Review


Abstract
1. Introduction
- A taxonomy for computer-aided bleeding detection algorithms for capsule endoscopy is identified.
- Various color space and feature extraction techniques are used to boost the bleeding detection performance, which is discussed in depth.
- From the observation of the existing literature, direction for the computer-aided bleeding detection research community is provided.
2. Review Methodology
2.1. Identifying Research Question
2.2. Database
2.3. Search Strategy
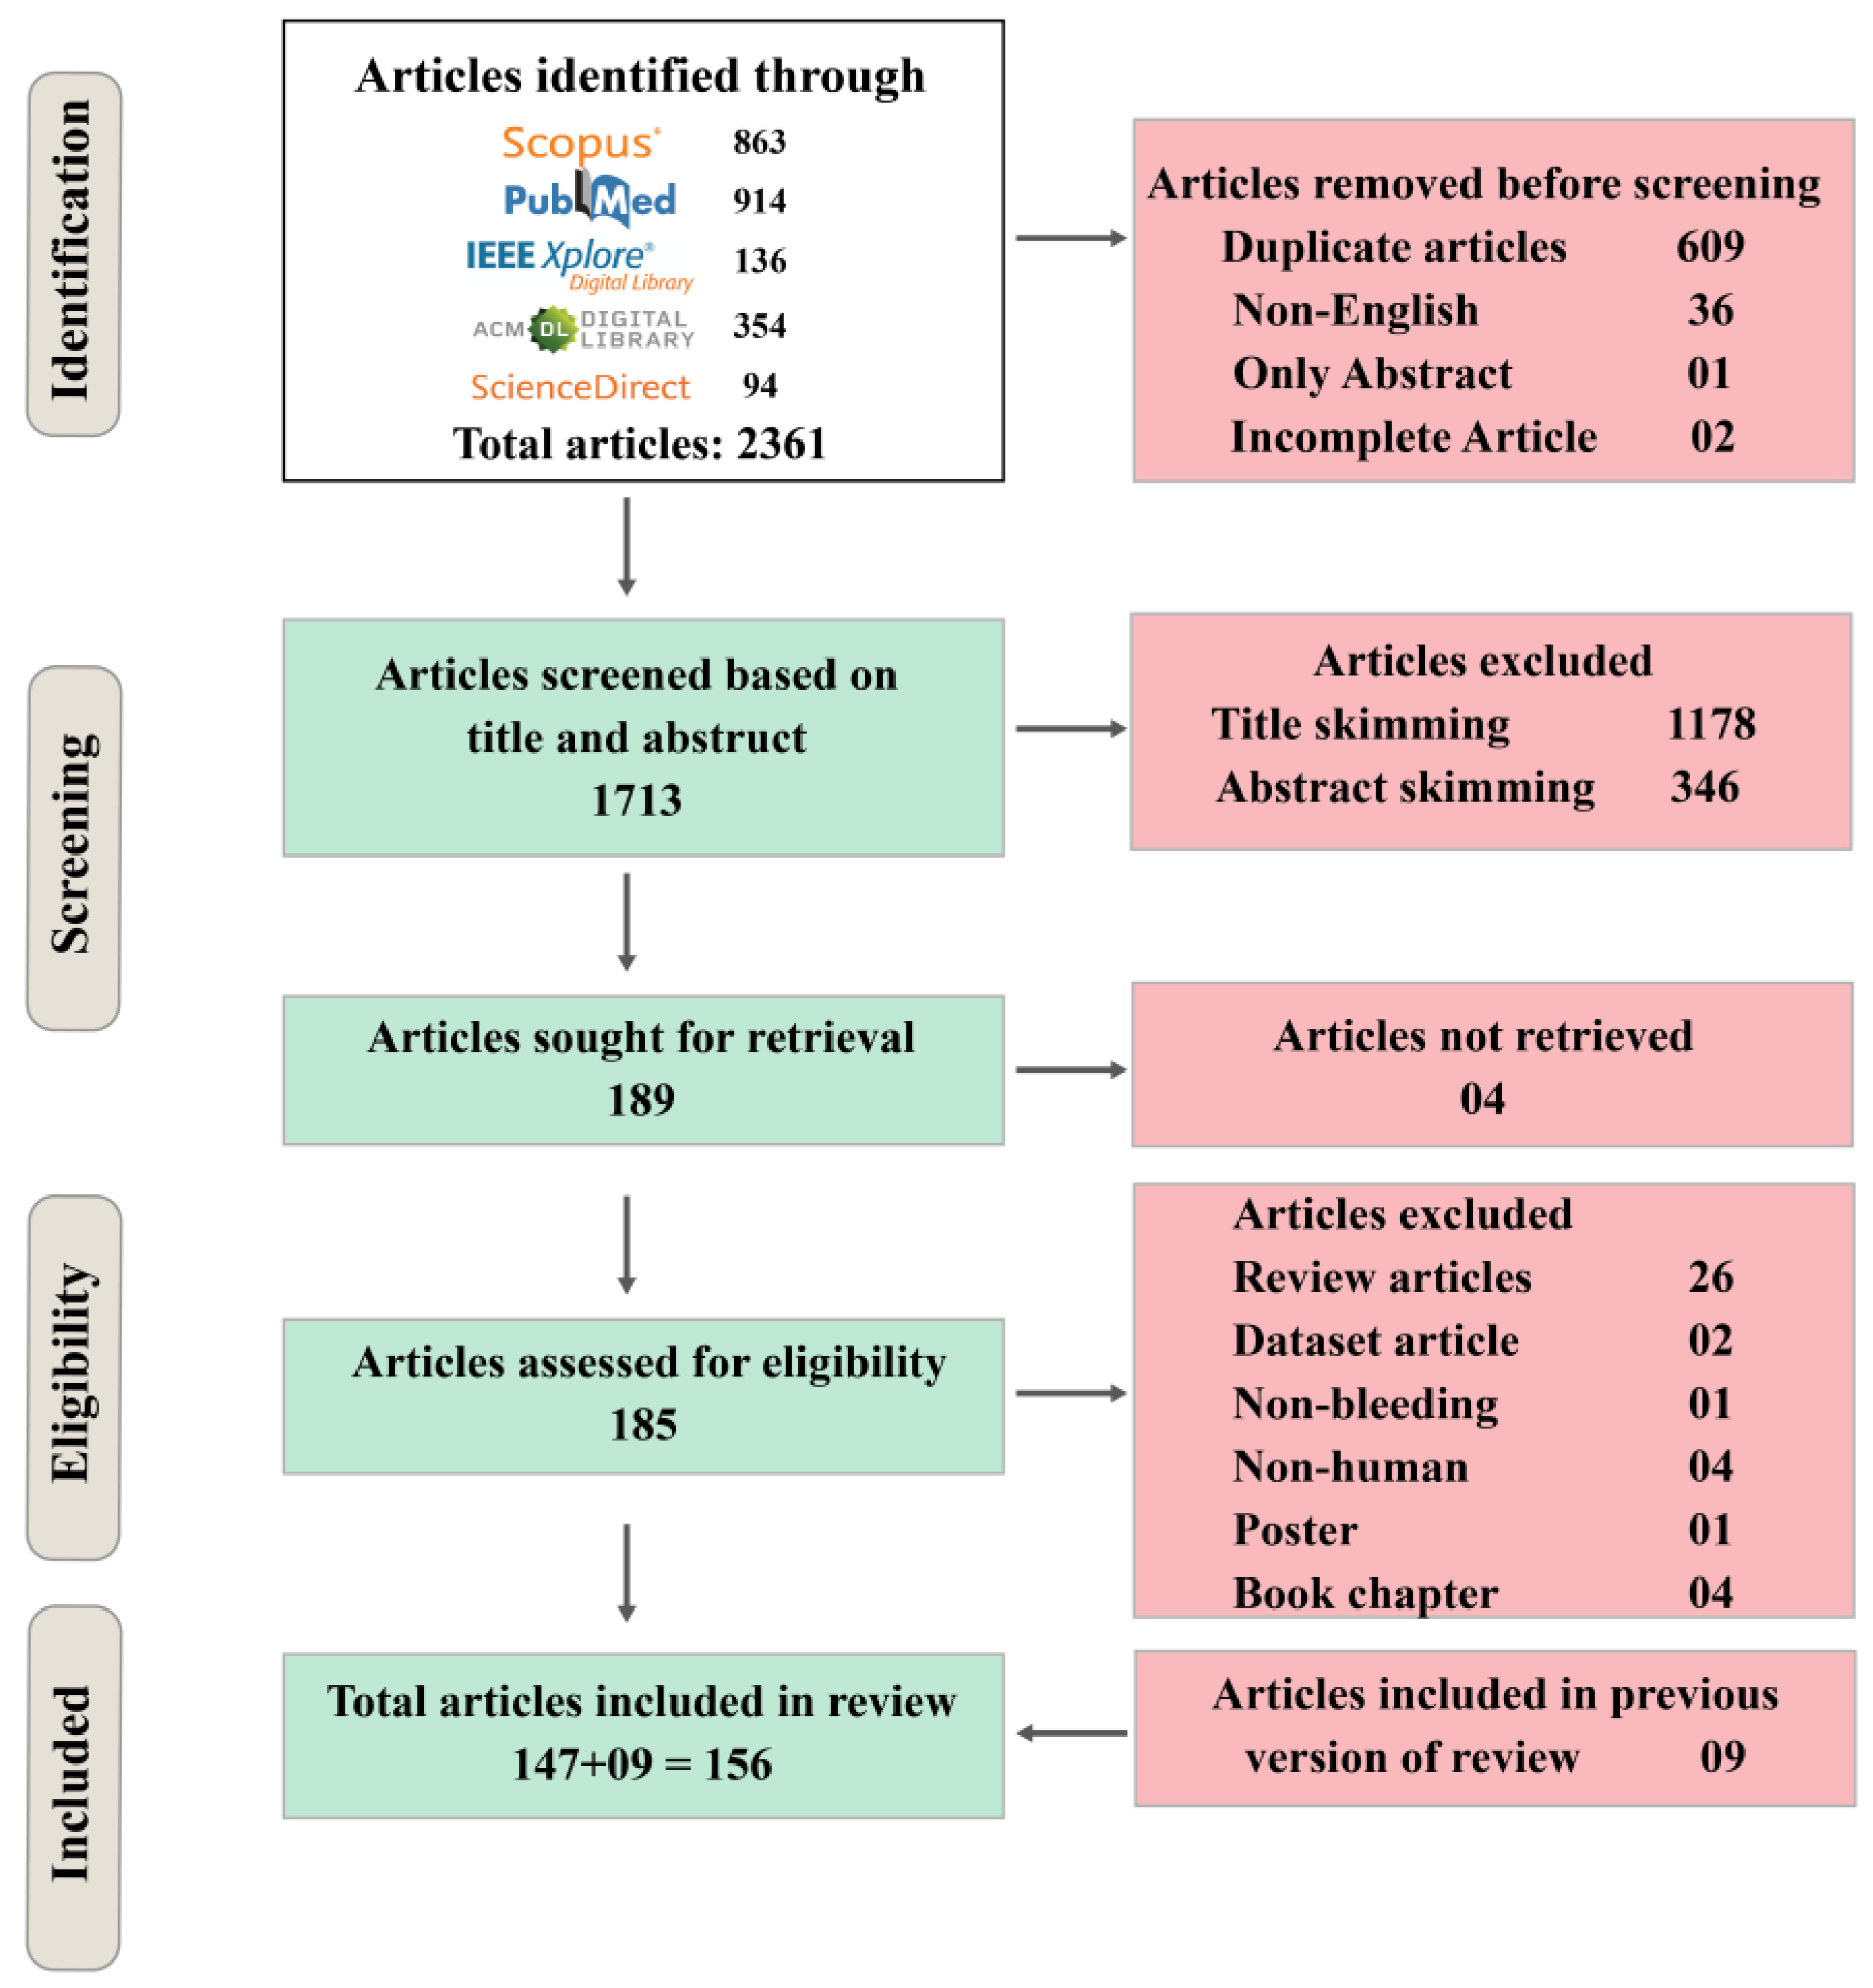
2.4. Results
3. Review Findings
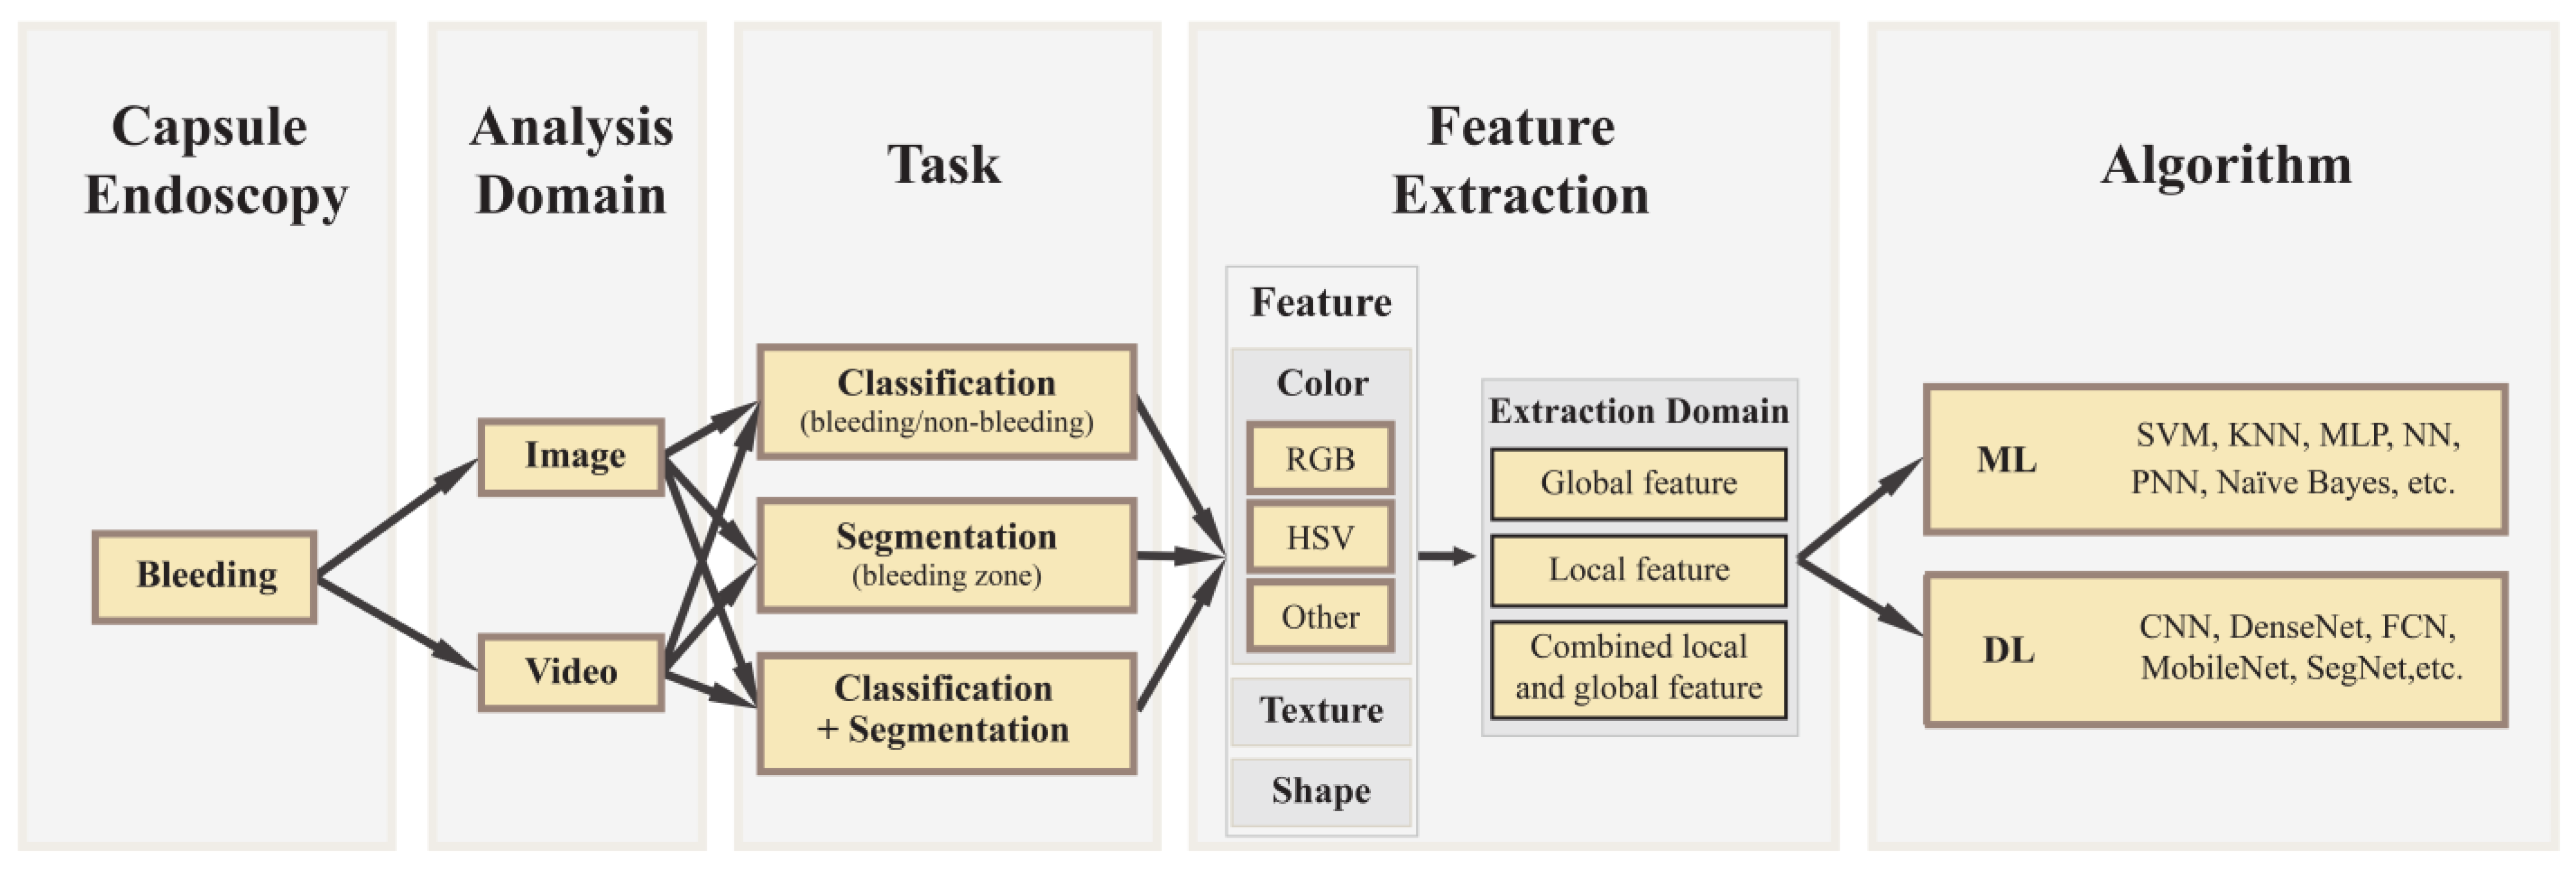
3.1. Taxonomy
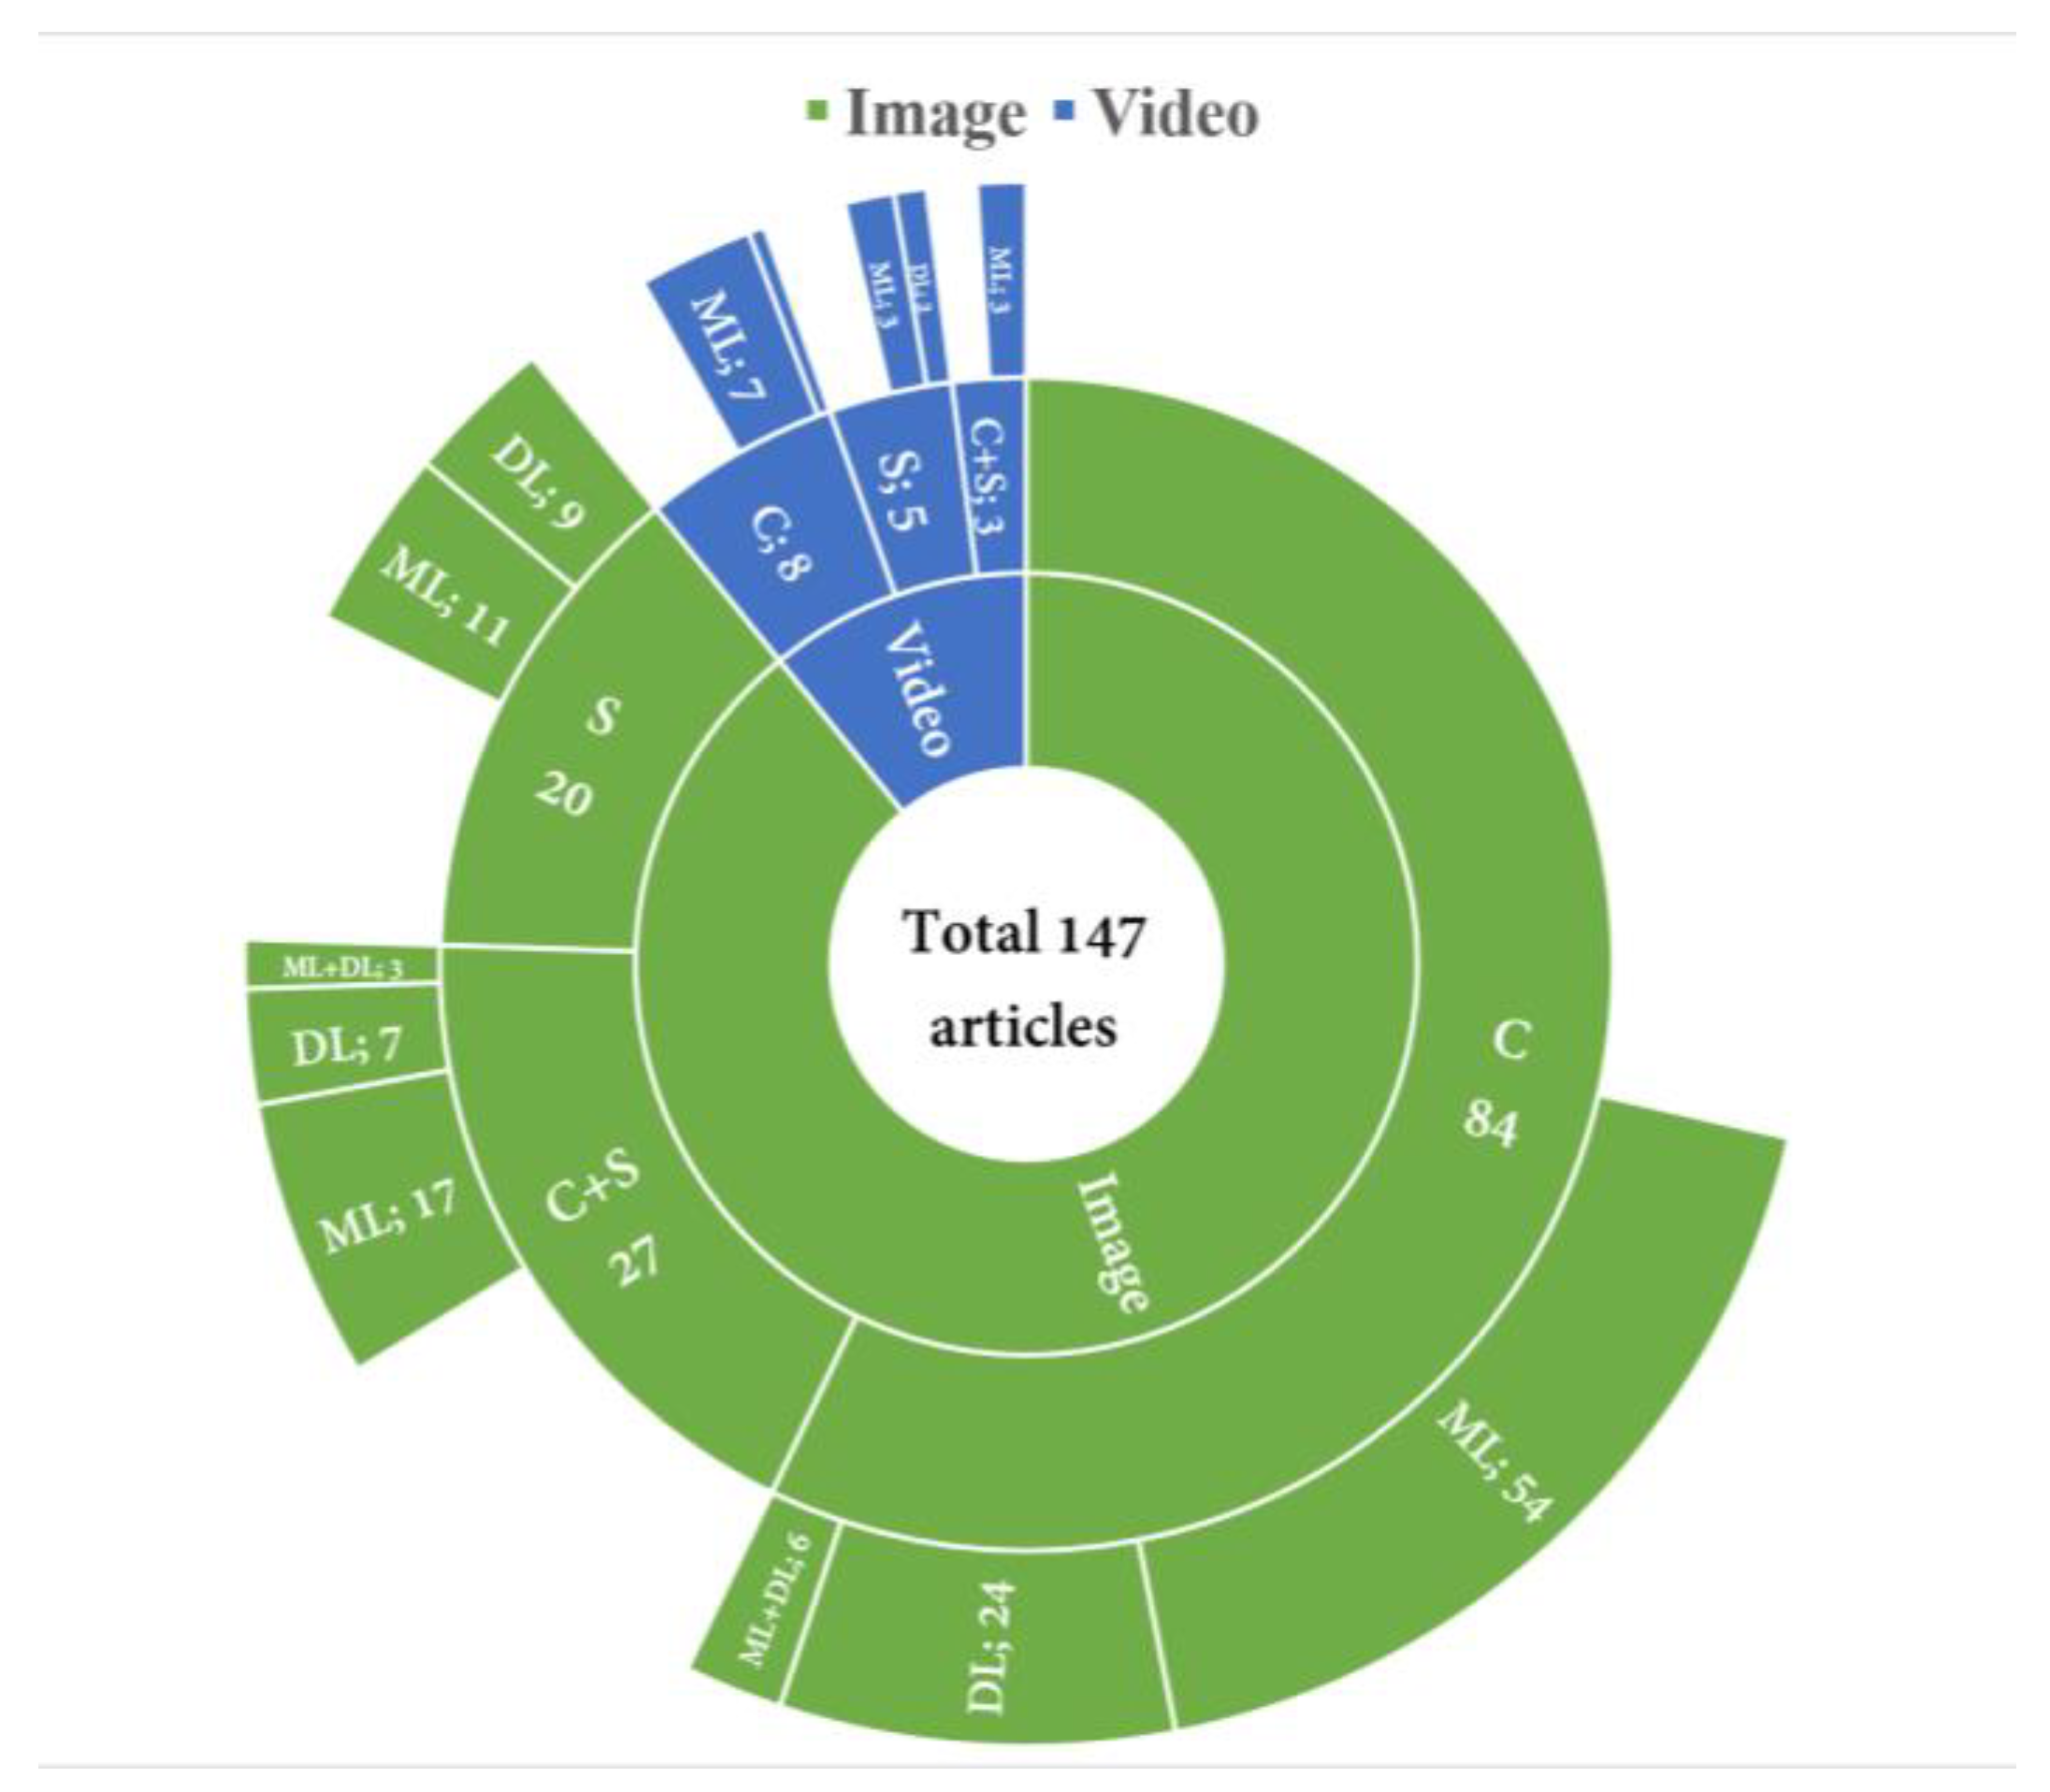
3.2. Analysis Domain
3.2.1. Image
3.2.2. Video
3.2.3. Task
Classification
Segmentation
Classification + Segmentation
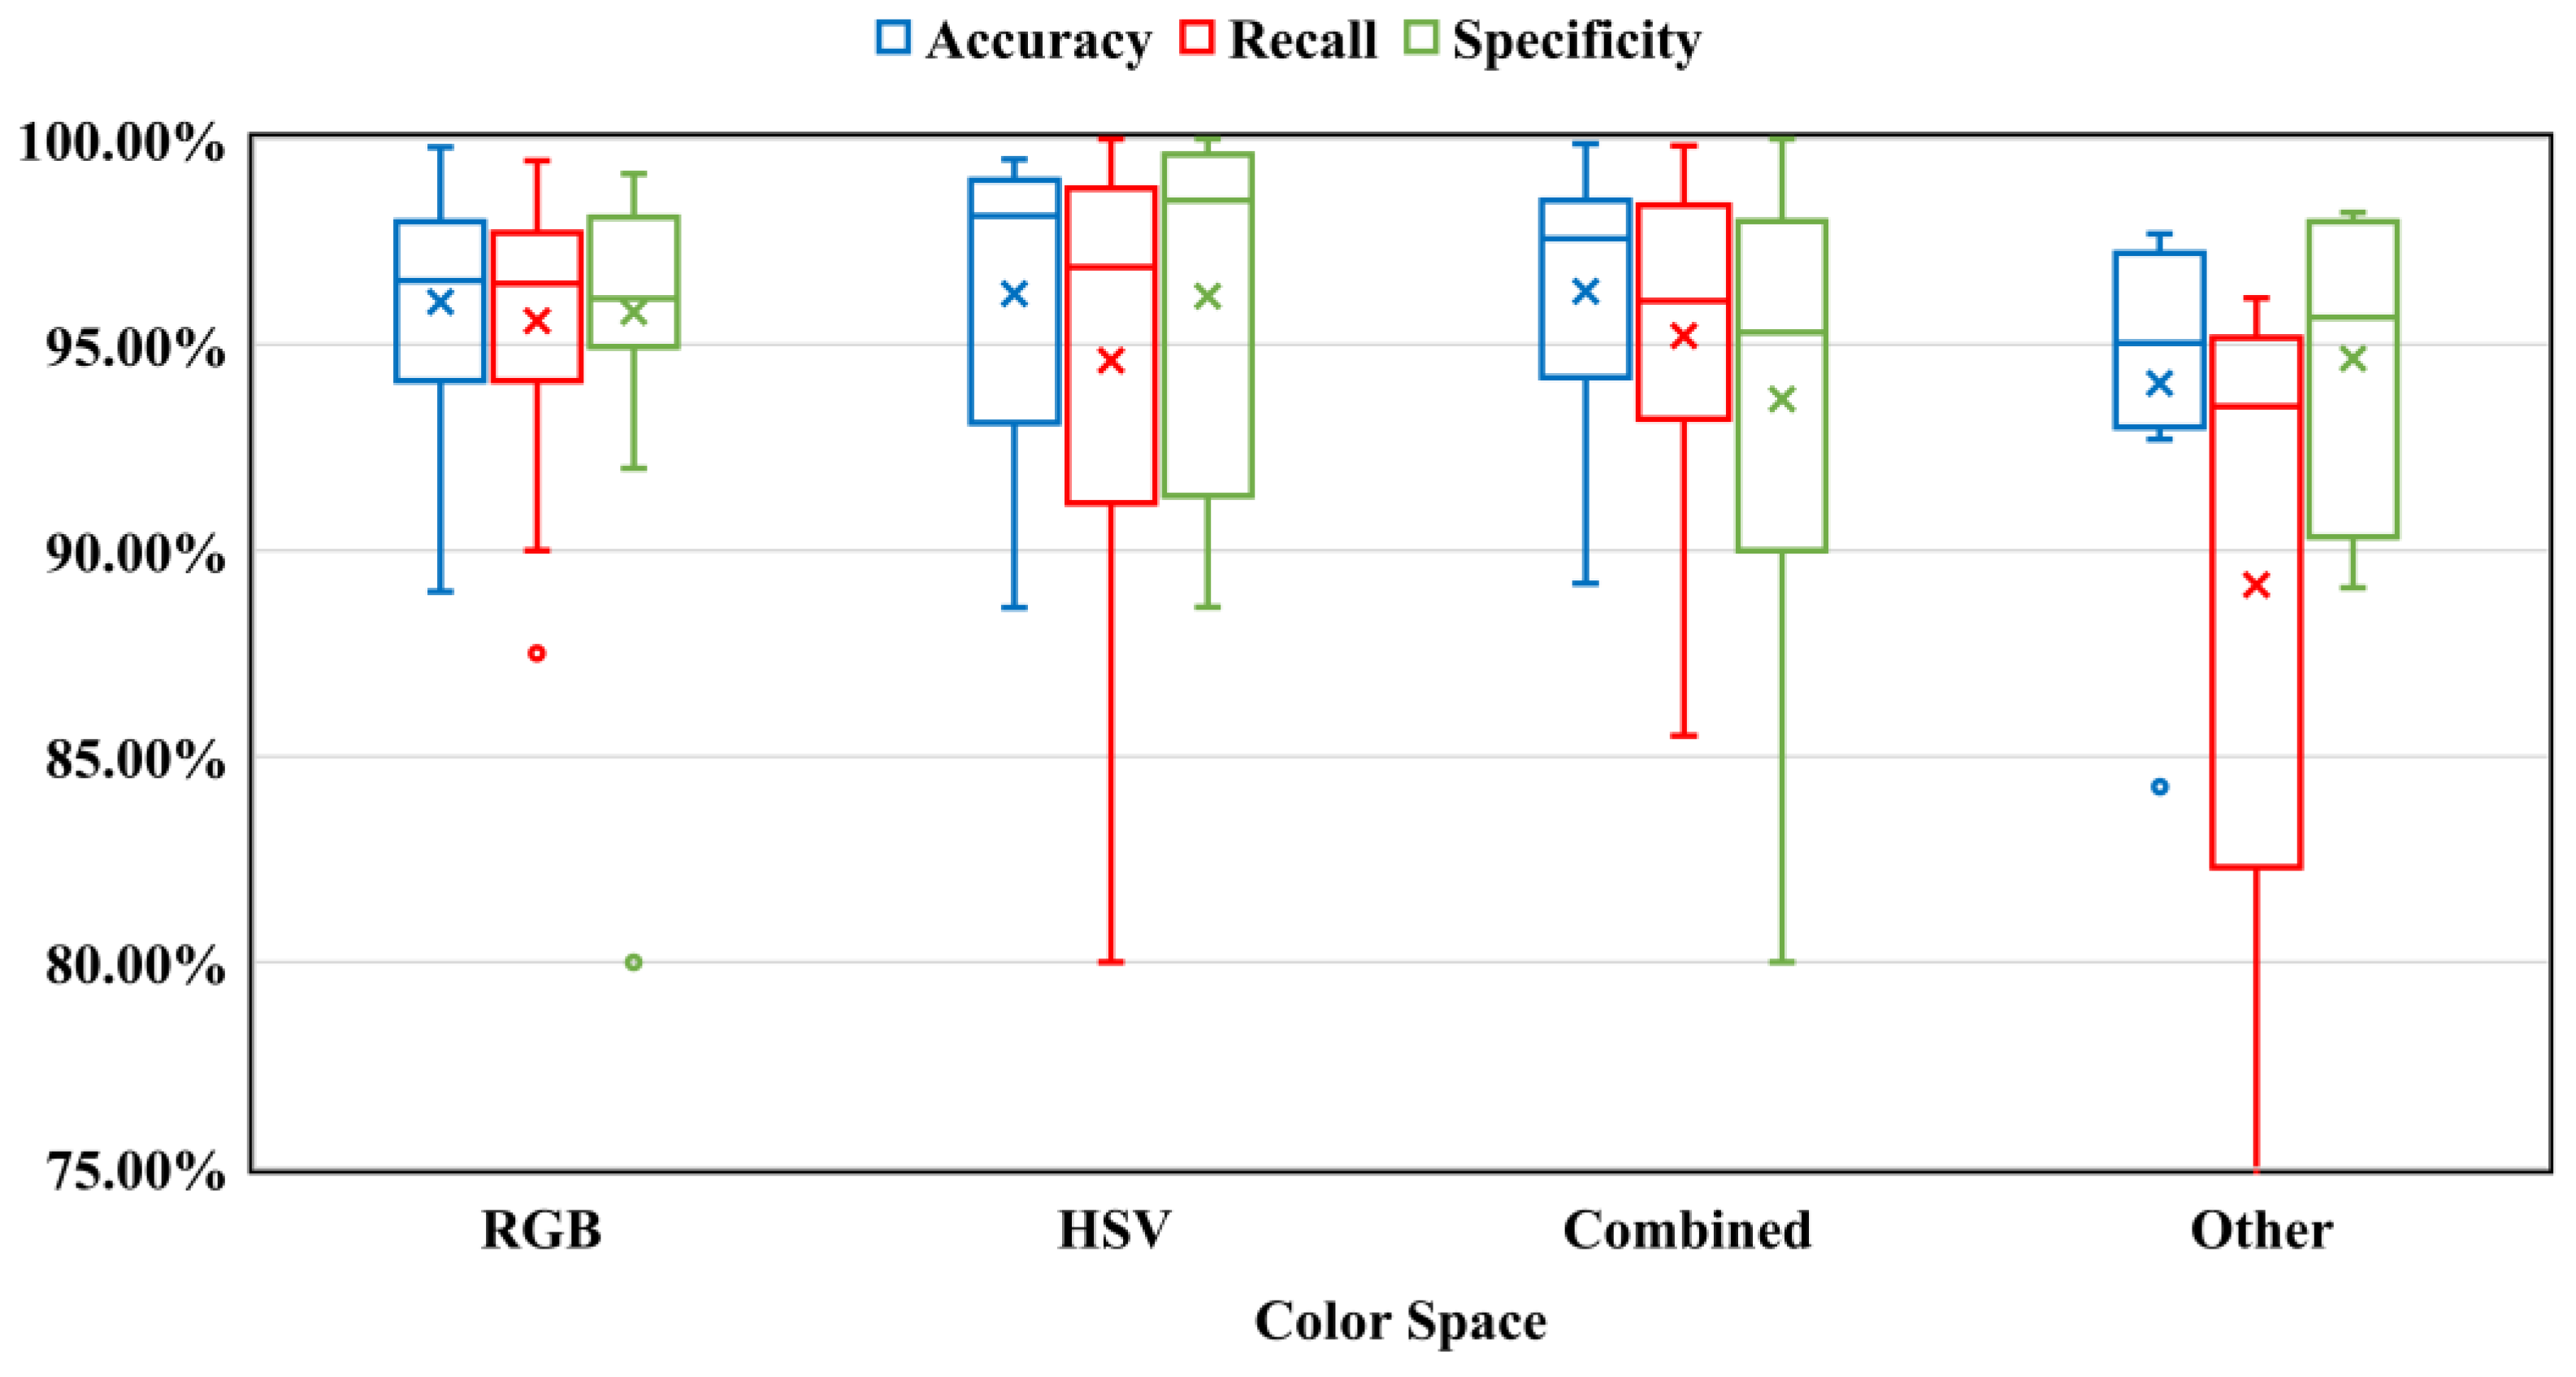
4. Feature Extraction
5. Algorithm
6. Discussion
7. Limitations
8. Future Direction
9. Conclusions
Author Contributions
Funding
Institutional Review Board Statement
Informed Consent Statement
Data Availability Statement
Conflicts of Interest
Appendix A

| Refs. | Domain | Methodology/Technique | Feature Extraction | CS | DS | Results | |||
|---|---|---|---|---|---|---|---|---|---|
| Task | ML/DL | Algorithm | Color Space | Extraction Domain | |||||
| 2006 [65] | Image | C | ML | Expectation Maximization | RGB | Combined | - | 201 images | R: 92%, S: 98% |
| 2008 [35] | Video | C | ML | SVC | HSV | Local | 10-fold | 84 videos | A: ~97% |
| 2008 [48] | Image | C | ML | SVM | RGB | Local | - | 640 images | A: ~99% |
| 2008 [66] | Video | C | ML | SVM | HSV | Global | - | 5 videos | R: 80% |
| 2008 [104] | Image | S | ML | Threshold | Combined | Global | - | 2000 images | R: 92.86%, S: 89.49% |
| 2008 [98] | Image | C + S | ML | Threshold | Other | Combined | - | - | - |
| 2008 [75] | Image | C | ML | MLP | HSV | Local | 3600 images | A: 90.84% | |
| 2009 [83] | Image | C | ML | MLP | HSV | Local | 4-fold | 100 images | R: 87.81% ± 1.36, S: 88.62% ± 0.44 |
| 2009 [82] | Image | C | ML | MLP | HSV | Local | - | 200 images | Detection rate: 90%. |
| 2009 [70] | Image | C | ML | SVM, NN | HSV | Local | 10-fold | 300 images | A: 99.41% (SVM), A: 98.97% (NN) |
| 2009 [52] | Image | S | ML | Threshold | RGB | Global | - | 4800 images | R: 94.87%, S: 96.12% |
| 2009 [106] | Image | C | ML | NN | Combined | Combined | - | 14,630 images | R: 93.03%, S: 95.86% |
| 2010 [107] | Image | C | ML | PNN | Combined | Combined | - | 14,630 images | R: 93.1%, S: 85.6% |
| 2010 [74] | Image | C | ML | SVC | HSV | Global | - | 6416 images | A: ~97% |
| 2010 [38] | Video | S | ML | K-Means Clustering | RGB | Local | - | 10 videos | - |
| 2010 [76] | Image | C | ML | NN | HSV | Local | - | 200 images | A: 93.1% |
| 2011 [25] | Image | C | ML | ANN | RGB | Local | - | 2000 images | A: 94%, R: 94%, S: 95% |
| 2011 [105] | Image | C | ML | SVM | Combined | Combined | 5-fold | 560 images | A: 97.9%, R: 97.8%, S: 98.0% |
| 2011 [7] | Image | C | ML | Threshold | Combined | Local | - | 42 images | R: 87%, S: 90% |
| 2012 [69] | Image | C | ML | Threshold | HSV | Local | - | 72 images | In 3 images, the algorithm did not detect bleeding |
| 2012 [49] | Image | C | ML | SVM | RGB | Local | - | 52 images | - |
| 2012 [72] | Image | C | ML | SVM | HSV | Local | 5-fold | 350 images | A: 98.13% |
| 2012 [51] | Image | C | ML | Threshold | RGB | Local | - | 14,630 images | R: 90%, S: 97% |
| 2012 [99] | Image | C | ML | Threshold | Other | Global | - | 100 images | R: 82.3%, S: 89.10% |
| 2012 [114] | Image | C + S | ML | Vector Supported Convex Hull | Combined | Local | - | 50 videos | R/S: >98% |
| 2013 [111] | Image | C + S | ML | SVM | Combined | Local | - | 10 videos | FPR: 4.03% |
| 2013 [55] | Image | C | ML | SVM | RGB | Local | - | - | R rises to 0.8997 |
| 2013 [50] | Image | C | ML | ANN | RGB | Global | - | 90 images | A: 89% |
| 2013 [93] | Image | S | ML | Threshold | Other | Global | - | 700 images | A: 92.7%, R: 92.9% |
| 2014 [53] | Image | C | ML | SVM | RGB | Local | - | 2250 images | A: 94.50%, R: 93.00%, S: 94.88% |
| 2014 [58] | Image | C | ML | SVM | RGB | Local | - | 200 images | A: 95.80%, R: 96.50%, S: 95.63% |
| 2014 [59] | Image | C + S | ML | SVM | RGB | Combined | 10-fold | 5000 images | A: 94%, R: 97%, S: 92% |
| 2014 [56] | Image | C | ML | KNN | RGB | Local | 1-fold | 200 images | A: 98.5%, R: 98.0%, S: 99.0% |
| 2014 [73] | Image | C | ML | SVM | HSV | Global | 5-fold | 1413 images | A: 95.33%, R: 96.88%, S: 89.35% |
| 2014 [71] | Image | C | ML | KNN | HSV | Global | 1-fold | 200 images | A: 99.0%, R: 100.0%, S: 98.0% |
| 2014 [101] | Image | C | ML | SVM | Combined | Local | 1-fold | 1000 images | A: 93.40%, R: 95.50%, S: 92.87% |
| 2014 [32] | Video | C + S | ML | MLP | RGB | Global | - | 428 images | A: 93.7%, R: 94.5%, S: 80.0% |
| 2015 [78] | Image | C | ML | Random Tree | HSV | Global | 10-fold | 200 images | A: 99%, R: 98%, S: 99% |
| 2015 [118] | Image | C | ML | SVM | RGB | Combined | - | 1200 images | A: 99.19%, R: 99.41%, S: 98.95% |
| 2015 [63] | Image | C | ML | SVM | RGB | Local | - | 800 images | A: 95.89%, R: 98.77%, S: 93.45% |
| 2015 [61] | Image | S | ML | Threshold | RGB | Global | - | 690 images | A: 89.56% |
| 2015 [57] | Image | C | ML | KNN | RGB | Combined | 1-fold | 1000 images | A: 96.10%, R: 96.48%, S: 96.01% |
| 2015 [89] | Image | C | ML | SVM | Other | Local | 1-fold | 15 videos | A: 93.90%, R: 93.50%, S: 94% |
| 2015 [90] | Image | C | ML | KNN | Other | Local | 10-fold | 2300 images | A: 97.50%, R: 94.33%, S: 98.21% |
| 2015 [97] | Image | C | ML | KNN | Other | Local | 10-fold | 332 images | A: 96.38%, R: 95.17%, S: 97.32% |
| 2015 [92] | Image | C | ML | SVM | Other | Local | 10-fold | 2400 images | A: 95.75%, AUC: 0.9771 |
| 2015 [109] | Image | C | ML | SVM | Combined | Global | 10-fold | 252 images | AUC: 94%, R: 96%, S: 91% |
| 2015 [26] | Image | S | ML | SVM | Combined | Local | - | 3596 images | A: 94.10%, R: 91.69%, S: 94.59% |
| 2016 [91] | Image | S | ML | PCA | Other | Local | 10-fold | 1330 images | A: 94.34% ± 0.0235, AUC: 0.9532 ± 0.0172 |
| 2016 [31] | Video | S | ML | Threshold | RGB | Local | - | 15 videos | - |
| 2016 [62] | Video | C + S | ML | KNN | RGB | Local | 10-fold | 2300 images | A: 98.12%, R: 94.98%, S: 98.55% |
| 2016 [64] | Image | C + S | ML | SVM | RGB | Local | - | 10,000 images | R: 96.88%, P: 99.23%, F1: 98.04% |
| 2016 [40] | Video | S | ML | SVM | RGB | Local | 8-fold | 8 videos | A: 97%, R: 95.83%, S: 98.08% |
| 2016 [87] | Image | C | ML | SVM | HSV | Local | 5-fold | 1650 images | A: 88.61% |
| 2016 [79] | Image | C | ML | Random Tree, Random Forest | HSV | Global | 10-fold | 200 images | A: 99.5%, R: 99%, S: 100% |
| 2016 [108] | Image | C | ML | SVM | Combined | Local | 10-fold | 400 images | A: 89.2%, R: 93.5%, S: 80% |
| 2016 [102] | Image | C + S | ML | SVM | Combined | Local | 5-fold | 300 images | A: 98.82%, R: 99.66%, S: 98.01% |
| 2016 [157] | Image | C | DL+ ML | (CNN); SVM | - | - | - | 10,000 images | R: 99.20%, P: 99.90%, F1: 99.55% |
| 2016 [125] | Image | C | ML | SVM | - | Global | 4-fold | 912 images | A: 95.06% |
| 2017 [80] | Image | C + S | ML | MLP | HSV | Local | - | 223 images | A: 97.47% |
| 2017 [29] | Video | C | ML | SVC | HSV | Local | 10-fold | 30 videos | A: 92%, R: 94%, S: 91% |
| 2017 [47] | Image | C | ML | SVM | RGB | Local | - | 1200 images | A: 97.67%, R: 97.57%, S: 95.46% |
| 2017 [36] | Video | C + S | ML | SVM | RGB | Local | 10-fold | 400 images | A: 97.96%, R: 97.75%, S: 97.99%, T: 0.280 sec |
| 2017 [21] | Image | C | ML | SVM | RGB | Local | - | 400 images | A: 98%, R: 97%, S: 98% |
| 2017 [88] | Image | C + S | ML | SVM | HSV | Local | 3-fold | 970 images | A: 94.4% |
| 2017 [43] | Image | S | ML | SVM | HSV | Local | - | 50 BL images | - |
| 2017 [68] | Image | S | ML | Threshold | HSV | Local | - | 401 images | R: 88.3%, |
| 2017 [33] | Video | C | ML | SVM | Combined | Local | 5-fold | 8872 images | A: 95%, R: 94% S: 95.3% |
| 2017 [127] | Image | C | DL | LeNet, AlexNet, VGG-Net, GoogLeNet | Other | - | - | 12,090 images | F1: 98.87% |
| 2017 [27] | Image | C + S | DL | FCN | - | - | 300 images | IoU: 0.7750 | |
| 2017 [164] | Image | C | DL | CNN | RGB | - | - | 1500 images | R: 91%, P: 94.79%, F1: 92.85% |
| 2018 [128] | Image | C | DL | FCN | RGB | - | 10-fold | 10,000 images | A: 97.84%, AUC: 99.72% |
| 2018 [85] | Image | S | DL | SegNet | HSV | - | - | 335 images | A: 94.42%, IoU: 90.69% |
| 2018 [165] | Image | C | DL | CNN | Other | - | - | - | AUC: 0.90 |
| 2018 [41] | Video | S | DL | CNN | - | - | - | 6360 images | R: 100%, S: 96% |
| 2018 [28] | Video | S | DL | U-Net | - | - | - | 3295 images | ACC: 95.88%, R: 99.56%, S: 93.93% |
| 2018 [116] | Image | S | ML | SVM | Combined | Global | - | 50 BL images | Dice: 0.81, ME: 0.092 |
| 2018 [9] | Image | C + S | ML | SVM | HSV | Global | 10-fold | 412 images | A: 98.49%, T: 17.393 sec |
| 2018 [37] | Video | C | ML | KNN | RGB | Combined | 10-fold | 32 videos | A: 97.85%, R: 99.47%, S: 99.15%, P: 95.75% |
| 2018 [39] | Video | C | ML | SVM | RGB | Combined | 10-fold | 32 videos | P: 97.05%, FPR: 1.1%, FNR: 22.38 |
| 2018 [54] | Image | C + S | ML | Naive Baïes | RGB | Local | - | - | M:0.3478, SD:0.3306 for R channel. |
| 2018 [67] | Image | C | ML | Fuzzy C-Means | HSV | Local | 10-fold | 1275 images | A: 90.92% |
| 2018 [103] | Image | C + S | ML | KNN | Combined | Global | - | 1000 images | A: 99.22%, R: 98.51%, S: 99.53% |
| 2019 [117] | Image | C | ML | SVM | RGB | Local | 5-fold | 3500 images | A: 92.45%, R: 90.76%, S: 94.65% |
| 2019 [4] | Image | C | ML | SVM | RGB | Combined | 10-fold | 1200 images | A: 97.7%, R: 97.6%, S: 95.5%, F1: 97.8%, MCC: 89.8% |
| 2019 [60] | Image | C + S | ML | SVM | RGB | Local | 5-fold | 240 images | A: 95.8%, R: 87.5%, S: 98.1% |
| 2019 [77] | Image | C | ML | Random Forest | HSV | Local | 5-fold | 75 images | R: 95.68%, S: 92.33% |
| 2019 [11] | Image | C | ML | KNN | HSV | Local | 10-fold | 2393 images | A: 98.8%, R: 99%, S: 99%, P: 95%, F1: 97% |
| 2019 [113] | Image | C + S | ML | SVM | Combined | Local | 10-fold | 3895 images | A: 98.2%, FPR: 02.5%, P: 97.5%, R: 98.8%, F: 98.2%, MCC: 96.3%, F1: 98.2% |
| 2019 [110] | Image | C + S | ML | SVM | Combined | Local | 10-fold | 90 images | A: 95%, R: 85%, S: 97% |
| 2019 [112] | Image | C | ML | SVM | Combined | Local | 10-fold | 30 videos | A: 96.77%, R: 97.55%, S: 96.59% |
| 2019 [154] | Image | C | DL | CNN | - | - | - | 2237 images | AUC: 99.8%, R: 98.8%, S: 98.4%, PPV: 75.4%, NPV: 99.9% |
| 2019 [22] | Image | C | ML | MLP | Combined | Local | - | 3895 images | A: 97.58%, R: 96.76%, P: 98.29% |
| 2019 [24] | Image | C | DL | DenseNet | - | Local | - | 1200 images | R: 97.3%, P: 94.7%, F1: 95.9% |
| 2019 [130] | Image | C | DL | ResNet50 | - | - | - | 27,847 images | AUC: 0.9998, A: 99.89%, R: 96.63%, S: 99.96%, |
| 2019 [155] | Image | C + S | DL + ML | (DenseNet); MLP | Combined | - | 10-fold | 12,000 images | A: 99.5%, R: 99.40%, S: 99.20%, |
| 2019 [44] | Image | S | DL | U-Net | - | - | - | 335 images | A: 98.5%, IoU: 86.3% |
| 2019 [84] | Image | S | DL | CNN | HSV | - | 5-fold | 778 images | A: 98.9%, R: 94.8%, S: 99.1%, AUC: 99.7% |
| 2019 [86] | Image | C + S | DL + ML | (CNN); KNN | HSV | Global | 10-fold | 4500 images | A: 99.42%, P: 99.51%, S: 100% |
| 2019 [156] | Image | C + S | DL + ML | (CNN); MLP | Combined | Global | - | 778 images | AUC-ROC: >0.97 |
| 2020 [129] | Image | C | DL | VGGNet | - | - | 10-fold | 7556 images | A: 96.83%, R: 97.61%, S: 96.04% |
| 2020 [166] | Image | C + S | DL | CNN | Combined | - | - | 94 images | A: 97.8%, R: 98.6%, S: 86.3% |
| 2020 [167] | Image | S | DL | CNN | Other | - | - | 3895 images | A: 95% |
| 2020 [115] | Image | C | ML | SVM | Combined | Global | 10-fold | 2588 images | A: 92.23%, R: 86.15%, P: 89.11, F1: 97.60 |
| 2020 [100] | Image | C + S | ML | Naive Baïes | Other | Local | - | 55,000 images | - |
| 2020 [124] | Image | C | ML | SVM | - | Local | 5-fold | 912 images | A: 98.18%, R: 98%, P: 98%, F1: 98% |
| 2021 [46] | Image | C + S | DL | SegNet | HSV | - | - | 2350 images | A: 94.42%, IoU: 90.69% |
| 2021 [30] | Video | C | ML | SVM | Combined | Global | - | 2 videos | - |
| 2021 [23] | Image | C | DL + ML | (VGG19, InceptionV3, ResNet50); SVM | RGB | Global | 10-fold | 56,448 images | A: 97.71% |
| 2021 [1] | Image | C | ML | SVM | HSV | Global | 10-fold | 2393 images | A: 98.2%, R: 98%, S: 98%, P: 93%, F1: 95.4% |
| 2021 [45] | Image | C + S | ML | SVM | Combined | Local | 10-fold | 3294 images | A: 99.88%, R: 99.83%, S: 100% |
| 2021 [42] | Image | C | DL | MobileNet | - | - | 10-fold | 1650 images | A: 99.3%, P: 100%, R: 99.4%, F1: 99.7% |
| 2021 [138] | Image | S | DL | U-Net | RGB | - | - | 3295 images | A: 95.90%, Dice: 91% |
| 2021 [140] | Image | C | DL | CNN | RGB | - | - | 23,720 images | R: 86.6%, S: 95.9% |
| 2021 [141] | Image | C + S | DL | CNN | RGB | - | - | 20,000 images | A: 98.9%, F1: 93.5% |
| 2021 [137] | Image | C + S | DL | RCNN | RGB | - | - | 1302 images | R: 66.67%, P: 85.71%, F1: 75.00% |
| 2021 [135] | Image | C | DL | Inception-Resnet-V2 | RGB | - | - | 400,000 images | A: 98.07%, AUC: 92.2%, |
| 2021 [142] | Image | C | DL | CNN | RGB | - | - | 11,588 images | R: 91.8%, S: 95.9% |
| 2021 [95] | Image | C | DL | AlexNet | Other | - | - | 420 images | A: 94.5%, R: 95.24%, S: 96.72% |
| 2021 [143] | Image | C | DL | CNN | RGB | - | - | 5825 images | R: 99.8%, S: 93.2% |
| 2021 [126] | Image | C | DL + ML | (AlexNet); SVM | RGB | Global | - | 24,000 images | A: 99.8% |
| 2021 [144] | Image | C + S | DL | CNN | RGB | - | 5-fold | 77 images | A: 98%, IoU: 81%, Dice: 56% |
| 2021 [119] | Image | C | ML | SVM | Combined | Local | 10-fold | 3895 images | A: 95.4%, P: 95.6%, R: 95.2% |
| 2021 [145] | Image | C | DL | CNN | RGB | - | - | 53,555 images | A: 99%, R: 88%, S: 99% |
| 2021 [123] | Image | S | ML | Expectation Maximization | Combined | Local | 10-fold | 3895 images | P: 96.5%, R: 95.9%, S: 93.2% |
| 2022 [120] | Image | C | ML | SVM | RGB | Local | - | 3895 images | P: 98.11%, R: 98.55% |
| 2022 [146] | Image | C | DL | CNN | RGB | - | - | 6130 images | A:95.6%, R:90.8%, S: 97.1% |
| 2022 [96] | Image | C | ML | NN | Other | Global | - | 1,722,499 images | A: 97.69%, P: 96.47%, R: 96.13% |
| 2022 [132] | Image | C + S | DL | ResNet-50 | RGB | - | 4-fold | 4900 images | A: 95.1% |
| 2022 [133] | Image | S | DL | Res2Net101 | RGB | Combined | - | 1136 images | IoU: 86.86% |
| 2022 [168] | Image | C | DL + ML | (CNN); PCA, SVM | RGB | Global | - | 912 images | A: 95.62%, P: 95.7%, R: 95.62%, F1: 95.62% |
| 2022 [147] | Image | C | DL | CNN | RGB | - | - | 1200 images | A: 98.5%, R: 98.5%, F1: 98.5%, AUC: 99.49% |
| 2022 [148] | Image | C | DL | CNN | RGB | - | - | 49,180 images | R: 93.4%, S: 97.8% |
| 2022 [149] | Image | C | DL | CNN | RGB | - | - | 21,320 images | A: 97.1%, R: 95.9%, S: 97.1% |
| 2022 [150] | Image | C | DL | CNN | RGB | - | - | 9005 images | R: 99.8%, S: 100.0% |
| 2022 [151] | Image | C | DL | CNN | - | - | - | 5000 images | A: 99.3%, P: 100%, S: 99.4% |
| 2022 [152] | Image | S | DL | CNN | RGB | - | - | 48 images | Dice: 69.91% |
| 2022 [134] | Image | C | DL | Inception-ResNet-V2 | RGB | - | 9-fold | 3895 images | A: 98.5%, R: 98.5%, S: 99.0% |
| 2022 [153] | Image | C | DL | CNN | RGB | - | - | 22,095 images | A: 98.5%, R: 98.6%, S:98.9% |
| 2022 [34] | Video | C | DL | CRNN | RGB | - | - | 240 videos | A: 89%, R: 97% |
| 2023 [136] | Image | S | DL | AttResU-Net | RGB | - | - | 3295 images | A: 99.16%, Dice: 94.91%, IoU: 90.32% |
| 2023 [81] | Image | C | DL + ML | (ResNet18, XcepNet23); Q_SVM | HSV | Combined | 5-fold | 4000 images | A: 98.60%, R: 98.60%, S: 99.80% |
| 2023 [131] | Image | S | DL | Resnet-50 | RGB | - | - | 12,403 images | A: 99%, IoU: 69% |
| 2023 [122] | Image | C + S | ML | SVM; KNN | - | Global | - | - | A: 95.75%, AUC: 97.71% |
| 2023 [94] | Image | S | ML | K-Means Clustering | Other | Global | - | 48 images | A: 84.26%, R:69.84%, Dice: 67.71% |
| 2023 [139] | Image | C | DL | CNN | RGB | - | - | 18,625 images | A: 92.5%, R: 96.8%, S: 96.5% |
| 2023 [121] | Image | C | DL + ML | (ResNet-50); SVM | Combined | Local | - | 5689 images | A: 97.82%, R: 97.8%, F1: 97.8% |
References
- Al Mamun, A.; Em, P.P.; Ghosh, T.; Hossain, M.M.; Hasan, M.G.; Sadeque, M.G. Bleeding recognition technique in wireless capsule endoscopy images using fuzzy logic and principal component analysis. Int. J. Electr. Comput. Eng. 2021, 11, 2689–2696. [Google Scholar] [CrossRef]
- Monteiro, S.; De Castro, F.D.; Carvalho, P.B.; Moreira, M.J.; Rosa, B.; Cotter, J. PillCam® SB3 capsule: Does the increased frame rate eliminate the risk of missing lesions? World J. Gastroenterol. 2016, 22, 3066–3068. [Google Scholar] [CrossRef] [PubMed]
- Fan, S.; Xu, L.; Fan, Y.; Wei, K.; Li, L. Computer-aided detection of small intestinal ulcer and erosion in wireless capsule endoscopy images. Phys. Med. Biol. 2018, 63, 165001. [Google Scholar] [CrossRef] [PubMed]
- Pogorelov, K.; Suman, S.; Azmadi Hussin, F.; Saeed Malik, A.; Ostroukhova, O.; Riegler, M.; Halvorsen, P.; Hooi Ho, S.; Goh, K.-L. Bleeding detection in wireless capsule endoscopy videos—Color versus texture features. J. Appl. Clin. Med. Phys. 2019, 20, 141–154. [Google Scholar] [CrossRef]
- Karargyris, A.; Bourbakis, N. Detection of small bowel polyps and ulcers in wireless capsule endoscopy videos. IEEE Trans. Biomed. Eng. 2011, 58, 2777–2786. [Google Scholar] [CrossRef] [PubMed]
- Zuckerman, G.R.; Prakash, C.; Askin, M.P.; Lewis, B.S. AGA technical review on the evaluation and management of occult and obscure gastrointestinal bleeding. Gastroenterology 2000, 118, 201–221. [Google Scholar] [CrossRef] [PubMed]
- Lee, Y.; Yoon, G.; Architecture, A.O. Bleeding detection algorithm for capsule endoscopy. World Acad. Sci. Eng. Technology 2011, 57, 672–677. [Google Scholar]
- Park, S.C.; Chun, H.J.; Kim, E.S.; Keum, B.; Seo, Y.S.; Kim, Y.S.; Jeen, Y.T.; Lee, H.S.; Um, S.H.; Kim, C.D.; et al. Sensitivity of the suspected blood indicator: An experimental study. World J. Gastroenterol. 2012, 18, 4169–4174. [Google Scholar] [CrossRef]
- Liaqat, A.; Khan, M.A.; Shah, J.H.; Sharif, M.; Yasmin, M.; Fernandes, S.L. Automated ulcer and bleeding classification from wce images using multiple features fusion and selection. J. Mech. Med. Biol. 2018, 18, 1850038. [Google Scholar] [CrossRef]
- Al Mamun, A.; Hossain, M.S.; Em, P.P.; Tahabilder, A.; Sultana, R.; Islam, M.A. Small intestine bleeding detection using color threshold and morphological operation in WCE images. Int. J. Electr. Comput. Eng. 2021, 11, 3040–3048. [Google Scholar] [CrossRef]
- Al Mamun, A.; Hossain, M.S.; Hossain, M.M.; Hasan, M.G. Discretion Way for Bleeding Detection in Wireless Capsule Endoscopy Images. In Proceedings of the 1st International Conference on Advances in Science, Engineering and Robotics Technology 2019, Dhaka, Bangladesh, 3–5 May 2019; Institute of Electrical and Electronics Engineers Inc.: New York, NY, USA, 2019. [Google Scholar] [CrossRef]
- Neumann, H.; Fry, L.C.; Nägel, A.; Neurath, M.F. Wireless capsule endoscopy of the small intestine: A review with future directions. Curr. Opin. Gastroenterol. 2014, 30, 463–471. [Google Scholar] [CrossRef] [PubMed]
- Karargyris, A.; Bourbakis, N. Wireless Capsule Endoscopy and Endoscopic Imaging: A Survey on Various Methodologies Presented. IEEE Eng. Med. Biol. Mag. 2010, 29, 72–83. [Google Scholar] [CrossRef] [PubMed]
- Brito, H.P.; Ribeiro, I.B.; de Moura, D.T.H.; Bernardo, W.M.; Chaves, D.M.; Kuga, R.; Maahs, E.D.; Ishida, R.K.; de Moura, E.T.H.; de Moura, E.G.H. Video capsule endoscopy vs double-balloon enteroscopy in the diagnosis of small bowel bleeding: A systematic review and meta-analysis. World J. Gastrointest. Endosc. 2018, 10, 400–421. [Google Scholar] [CrossRef] [PubMed]
- Koulaouzidis, A.; Rondonotti, E.; Karargyris, A. Small-bowel capsule endoscopy: A ten-point contemporary review. World J. Gastroenterol. 2013, 19, 3726–3746. [Google Scholar] [CrossRef]
- Iakovidis, D.K.; Koulaouzidis, A. Software for enhanced video capsule endoscopy: Challenges for essential progress. Nat. Rev. Gastroenterol. Hepatol. 2015, 12, 172–186. [Google Scholar] [CrossRef]
- Hwang, Y.; Park, J.; Lim, Y.J.; Chun, H.J. Application of artificial intelligence in capsule endoscopy: Where are we now? Clin. Endosc. 2018, 51, 547–551. [Google Scholar] [CrossRef] [PubMed]
- Chen, Y.; Lee, J. A review of machine-vision-based analysis of wireless capsule endoscopy video. Diagn. Ther. Endosc. 2012, 2012, 418037. [Google Scholar] [CrossRef]
- Shah, N.; Chen, C.; Montano, N.; Cave, D.; Siegel, R.; Gentile, N.T.; Limkakeng, A.T.; Kumar, A.B.; Ma, Y.; Meltzer, A.C. Video capsule endoscopy for upper gastrointestinal hemorrhage in the emergency department: A systematic review and meta-analysis. Am. J. Emerg. Med. 2020, 38, 1245–1252. [Google Scholar] [CrossRef]
- Soffer, S.; Klang, E.; Shimon, O.; Nachmias, N.; Eliakim, R.; Ben-Horin, S.; Kopylov, U.; Barash, Y. Deep learning for wireless capsule endoscopy: A systematic review and meta-analysis. Gastrointest. Endosc. 2020, 92, 831–839.e8. [Google Scholar] [CrossRef]
- Suman, S.; Hussin, F.A.B.; Walter, N.; Malik, A.S.; Ho, S.H.; Goh, K.L. Detection and classification of bleeding using statistical color features for wireless capsule endoscopy images. In Proceedings of the 2016 International Conference on Signal and Information Processing, IConSIP 2016, Nanded, India, 6–8 October 2016; Institute of Electrical and Electronics Engineers Inc.: New York, NY, USA, 2017. [Google Scholar] [CrossRef]
- Amiri, Z.; Hassanpour, H.; Beghdadi, A. Feature Selection for Bleeding Detection in Capsule Endoscopy Images using Genetic Algorithm. In Proceedings of the 5th Iranian Conference on Signal Processing and Intelligent Systems, ICSPIS 2019, Shahrood, Iran, 18–19 December 2019; Institute of Electrical and Electronics Engineers Inc.: New York, NY, USA, 2019. [Google Scholar] [CrossRef]
- Caroppo, A.; Leone, A.; Siciliano, P. Deep transfer learning approaches for bleeding detection in endoscopy images. Comput. Med. Imaging Graph. 2021, 88, 101852. [Google Scholar] [CrossRef]
- Xing, X.; Yuan, Y.; Jia, X.; Max, Q.H.M. A saliency-aware hybrid dense network for bleeding detection in wireless capsule endoscopy images. In Proceedings of the 2019 IEEE 16th International Symposium on Biomedical Imaging (ISBI 2019), Venice, Italy, 8–11 April 2019; Volume 2019, pp. 104–107. [Google Scholar] [CrossRef]
- Fu, Y.; Mandal, M.; Guo, G. Bleeding region detection in WCE images based on color features and neural network. In Proceedings of the 2011 IEEE 54th International Midwest Symposium on Circuits and Systems (MWSCAS), Seoul, Republic of Korea, 7–10 August 2011. [Google Scholar] [CrossRef]
- Xiong, Y.; Zhu, Y.; Pang, Z.; Ma, Y.; Chen, D.; Wang, X. Bleeding detection in wireless capsule endoscopy based on MST clustering and SVM. In Proceedings of the IEEE Workshop on Signal Processing Systems, SiPS: Design and Implementation, Hangzhou, China, 14–16 October 2015; Institute of Electrical and Electronics Engineers Inc.: New York, NY, USA, 2015; Volume 2015. [Google Scholar] [CrossRef]
- Jia, X.; Meng, M.Q.-H. A study on automated segmentation of blood regions in Wireless Capsule Endoscopy images using fully convolutional networks. In Proceedings of the International Symposium on Biomedical Imaging, Melbourne, VIC, Australia, 18–21 April 2017; IEEE Computer Society: New York, NY, USA, 2017; pp. 179–182. [Google Scholar] [CrossRef]
- Coelho, P.; Pereira, A.; Leite, A.; Salgado, M.; Cunha, A. A Deep Learning Approach for Red Lesions Detection in Video Capsule Endoscopies. In Lecture Notes in Computer Science; Springer International Publishing: Cham, Switzerland, 2018; Volume 10882, pp. 553–561. [Google Scholar] [CrossRef]
- Usman, M.A.; Satrya, G.B.; Usman, M.R.; Shin, S.Y. Detection of small colon bleeding in wireless capsule endoscopy videos. Comput. Med. Imaging Graph. 2016, 54, 16–26. [Google Scholar] [CrossRef]
- Usman, M.A.; Usman, M.R.; Satrya, G.B.; Khan, M.A.; Politis, C.; Philip, N.; Shin, S.Y. QI-BRiCE: Quality index for bleeding regions in capsule endoscopy videos. Comput. Mater. Contin. 2021, 67, 1697–1712. [Google Scholar] [CrossRef]
- Novozámský, A.; Flusser, J.; Tachecí, I.; Sulík, L.; Bureš, J.; Krejcar, O. Automatic blood detection in capsule endoscopy video. J. Biomed. Opt. 2016, 21, 126007. [Google Scholar] [CrossRef]
- Sainju, S.; Bui, F.M.; Wahid, K.A. Automated bleeding detection in capsule endoscopy videos using statistical features and region growing. J. Med. Syst. 2014, 38, 25. [Google Scholar] [CrossRef] [PubMed]
- Deeba, F.; Islam, M.; Bui, F.M.; Wahid, K.A. Performance assessment of a bleeding detection algorithm for endoscopic video based on classifier fusion method and exhaustive feature selection. Biomed. Signal Process. Control 2018, 40, 415–424. [Google Scholar] [CrossRef]
- Ding, Z.; Shi, H.; Zhang, H.; Zhang, H.; Tian, S.; Zhang, K.; Cai, S.; Ming, F.; Xie, X.; Liu, J.; et al. Artificial intelligence-based diagnosis of abnormalities in small-bowel capsule endoscopy. Endoscopy 2022, 55, 44–51. [Google Scholar] [CrossRef]
- Mackiewicz, M.; Fisher, M.; Jamieson, C. Bleeding detection in wireless capsule endoscopy using adaptive colour histogram model and support vector classification. In Proceedings of the Progress in Biomedical Optics and Imaging—Proceedings of SPIE, San Diego, CA, USA, 16–21 February 2008; Volume 6914. [Google Scholar] [CrossRef]
- Ghosh, T.; Fattah, S.A.; Wahid, K.A. Automatic Computer Aided Bleeding Detection Scheme for Wireless Capsule Endoscopy (WCE) Video Based on Higher and Lower Order Statistical Features in a Composite Color. J. Med. Biol. Eng. 2018, 38, 482–496. [Google Scholar] [CrossRef]
- Ghosh, T.; Fattah, S.A.; Wahid, K.A. CHOBS: Color Histogram of Block Statistics for Automatic Bleeding Detection in Wireless Capsule Endoscopy Video. IEEE J. Transl. Eng. Health Med. 2018, 6, 1800112. [Google Scholar] [CrossRef]
- Zhao, Q.; Meng, M.Q.-H.; Li, B. WCE video clips segmentation based on abnormality. In Proceedings of the 2010 IEEE International Conference on Robotics and Biomimetics, ROBIO 2010, Tianjin, China, 14–18 December 2010; pp. 442–447. [Google Scholar]
- Ghosh, T.; Fattah, S.A.; Wahid, K.A.; Zhu, W.-P.; Ahmad, M.O. Cluster based statistical feature extraction method for automatic bleeding detection in wireless capsule endoscopy video. Comput. Biol. Med. 2018, 94, 41–54. [Google Scholar] [CrossRef]
- Shi, W.; Chen, J.; Chen, H.; Peng, Q.; Gan, T. Bleeding fragment localization using time domain information for WCE videos. In Proceedings of the 2015 8th International Conference on BioMedical Engineering and Informatics, BMEI 2015, Shenyang, China, 14–16 October 2015; Institute of Electrical and Electronics Engineers Inc.: New York, NY, USA, 2016; pp. 73–78. [Google Scholar] [CrossRef]
- Leenhardt, R.; Vasseur, P.; Li, C.; Saurin, J.C.; Rahmi, G.; Cholet, F.; Becq, A.; Marteau, P.; Histace, A.; Dray, X. A neural network algorithm for detection of GI angiectasia during small-bowel capsule endoscopy. Gastrointest. Endosc. 2019, 89, 189–194. [Google Scholar] [CrossRef] [PubMed]
- Rustam, F.; Siddique, M.A.; Siddiqui, H.U.R.; Ullah, S.; Mehmood, A.; Ashraf, I.; Choi, G.S. Wireless Capsule Endoscopy Bleeding Images Classification Using CNN Based Model. IEEE Access 2021, 9, 33675–33688. [Google Scholar] [CrossRef]
- Tuba, E.; Tuba, M.; Jovanovic, R. An algorithm for automated segmentation for bleeding detection in endoscopic images. In Proceedings of the International Joint Conference on Neural Networks, Anchorage, AK, USA, 14–19 May 2017; Volume 2017, pp. 4579–4586. [Google Scholar] [CrossRef]
- Li, S.; Zhang, J.; Ruan, C.; Zhang, Y. Multi-Stage Attention-Unet for Wireless Capsule Endoscopy Image Bleeding Area Segmentation. In Proceedings of the 2019 IEEE International Conference on Bioinformatics and Biomedicine, BIBM 2019, San Diego, CA, USA, 18–21 November 2019; pp. 818–825. [Google Scholar] [CrossRef]
- Rathnamala, S.; Jenicka, S. Automated bleeding detection in wireless capsule endoscopy images based on color feature extraction from Gaussian mixture model superpixels. Med. Biol. Eng. Comput. 2021, 59, 969–987. [Google Scholar] [CrossRef] [PubMed]
- Ghosh, T.; Chakareski, J. Deep Transfer Learning for Automated Intestinal Bleeding Detection in Capsule Endoscopy Imaging. J. Digit. Imaging 2021, 34, 404–417. [Google Scholar] [CrossRef] [PubMed]
- Suman, S.; Hussin, F.A.B.; Malik, A.S.; Pogorelov, K.; Riegler, M.; Ho, S.H.; Hilmi, I.; Goh, K.L. Detection and classification of bleeding region in WCE images using color feature. In Proceedings of the ACM International Conference Proceeding Series, Florence, Italy, 19–21 June 2017; Volume Part F1301. [Google Scholar] [CrossRef]
- Liu, J.; Yuan, X. Obscure bleeding detection in endoscopy images using support vector machines. Optim. Eng. 2009, 10, 289–299. [Google Scholar] [CrossRef]
- Li, J.; Ma, J.; Tillo, T.; Zhang, B.; Lim, E.G. A training based Support Vector Machine technique for blood detection in wireless capsule endoscopy images. In Proceedings of the 2012 IEEE-EMBS Conference on Biomedical Engineering and Sciences, IECBES 2012, Langkawi, Malaysia, 17–19 December 2012; pp. 826–830. [Google Scholar] [CrossRef]
- Sainju, S.; Bui, F.M.; Wahid, K. Bleeding detection in wireless capsule endoscopy based on color features from histogram probability. In Proceedings of the Canadian Conference on Electrical and Computer Engineering, Regina, SK, Canada, 5–8 May 2013. [Google Scholar] [CrossRef]
- Pan, G.; Xu, F.; Chen, J. Bleeding detection in wireless capsule endoscopy using color similarity coefficient. Appl. Mech. Mater. 2012, 195–196, 307–312. [Google Scholar] [CrossRef]
- Yun, S.J.; Young, H.K.; Dong, H.L.; Sang, H.L.; Jeong, J.S.; Jong, H.K. Automatic patient-adaptive bleeding detection in a capsule endoscopy. In Proceedings of the Progress in Biomedical Optics and Imaging—Proceedings of SPIE, Lake Buena Vista (Orlando Area), FL, USA, 7–12 February 2009; Volume 7260. [Google Scholar] [CrossRef]
- Ghosh, T.; Fattah, S.A.; Shahnaz, C.; Wahid, K.A. An automatic bleeding detection scheme in wireless capsule endoscopy based on histogram of an RGB-indexed image. In Proceedings of the 36th Annual International Conference of the IEEE Engineering in Medicine and Biology Society, Chicago, IL, USA, 26–30 August 2014; Volume 2014, pp. 4683–4686. [Google Scholar] [CrossRef]
- Sivakumar, P.; Kumar, B.M. A novel method to detect bleeding frame and region in wireless capsule endoscopy video. Cluster Comput. 2019, 22, 12219–12225. [Google Scholar] [CrossRef]
- Ma, J.; Tillo, T.; Zhang, B.; Wang, Z.; Lim, E.G. Novel training and comparison method for blood detection in wireless capsule endoscopy images. In Proceedings of the International Symposium on Medical Information and Communication Technology, ISMICT, Tokyo, Japan, 6–8 March 2013; pp. 56–60. [Google Scholar] [CrossRef]
- Ghosh, T.; Bashar, S.K.; Alam, M.S.; Wahid, K.; Fattah, S.A. A statistical feature based novel method to detect bleeding in wireless capsule endoscopy images. In Proceedings of the 2014 International Conference on Informatics, Electronics and Vision, ICIEV 2014, Dhaka, Bangladesh, 23–24 May 2014. [Google Scholar] [CrossRef]
- Ghosh, T.; Fattah, S.A.; Shahnaz, C.; Kundu, A.K.; Rizve, M.N. Block based histogram feature extraction method for bleeding detection in wireless capsule endoscopy. In Proceedings of the IEEE Region 10 Annual International Conference, Proceedings/TENCON, Macao, China, 1–4 November 2015; Institute of Electrical and Electronics Engineers Inc.: New York, NY, USA, 2016; Volume 2016. [Google Scholar] [CrossRef]
- Ghosh, T.; Fattah, S.A.; Wahid, K.A. Automatic bleeding detection in wireless capsule endoscopy based on RGB pixel intensity ratio. In Proceedings of the 1st International Conference on Electrical Engineering and Information and Communication Technology, Dhaka, Bangladesh, 10–12 April 2014. [Google Scholar] [CrossRef]
- Fu, Y.; Zhang, W.; Mandal, M.; Meng, M.Q.-H. Computer-aided bleeding detection in WCE video. IEEE J. Biomed. Health Inform. 2014, 18, 636–642. [Google Scholar] [CrossRef]
- Liu, Z.; Hu, C.; Shen, Z. Research on a new feature detection algorithm for wireless capsule endoscope bleeding images based on super-pixel segmentation. In Proceedings of the IEEE International Conference on Robotics and Biomimetics, ROBIO 2019, Dali, China, 6–8 December 2019; pp. 1744–1749. [Google Scholar] [CrossRef]
- Kumar, S.; Figueiredo, I.N.; Graca, C.; Falcao, G. A GPU accelerated algorithm for blood detection inwireless capsule endoscopy images. In Lecture Notes in Computational Vision and Biomechanics; Springer: Berlin/Heidelberg, Germany, 2015; Volume 19, pp. 55–71. [Google Scholar] [CrossRef]
- Kundu, A.K.; Rizve, M.N.; Ghosh, T.; Fattah, S.A. A segmented color plane histogram based feature extraction scheme for automatic bleeding detection in wireless capsule endoscopy. In Proceedings of the 2016 IEEE Students’ Technology Symposium, TechSym 2016, Kharagpur, India, 30 September–2 October 2016; Institute of Electrical and Electronics Engineers Inc.: New York, NY, USA, 2017; pp. 245–249. [Google Scholar] [CrossRef]
- Yuan, Y.; Meng, M.Q.H. Automatic bleeding frame detection in the wireless capsule endoscopy images. In Proceedings of the IEEE International Conference on Robotics and Automation, Seattle, WA, USA, 26–30 May 2015; Volume 2015, pp. 1310–1315. [Google Scholar] [CrossRef]
- Jia, X.; Cai, L.; Liu, J.; Dai, W.; Meng, M.Q.-H. GI bleeding detection in wireless capsule endoscopy images based on pattern recognition and a MapReduce framework. In Proceedings of the 2016 IEEE International Conference on Real-Time Computing and Robotics, RCAR 2016, Angkor Wat, Cambodia, 6–10 June 2016; pp. 266–271. [Google Scholar] [CrossRef]
- Hwang, S.; Oh, J.; Cox, J.; Tang, S.J.; Tibbals, H.F. Blood detection in wireless capsule endoscopy using expectation maximization clustering. In Proceedings of the Progress in Biomedical Optics and Imaging—Proceedings of SPIE, San Diego, CA, USA, 11–16 February 2006; Volume 6144. [Google Scholar] [CrossRef]
- Giritharan, B.; Yuan, X.; Liu, J.; Buckles, B.; Oh, J.; Tang, S.J. Bleeding detection from capsule endoscopy videos. In Proceedings of the 30th Annual International Conference of the IEEE Engineering in Medicine and Biology Society, Vancouver, BC, Canada, 20–25 August 2008; Volume 2008, pp. 4780–4783. [Google Scholar] [CrossRef]
- Bchir, O.; Ben Ismail, M.M.; AlZahrani, N. Multiple bleeding detection in wireless capsule endoscopy. Signal Image Video Process. 2019, 13, 121–126. [Google Scholar] [CrossRef]
- Lau, P.Y.; Correia, P.L. Detection of bleeding patterns in WCE video using multiple features. In Proceedings of the 29th Annual International Conference of the IEEE Engineering in Medicine and Biology Society, Lyon, France, 22–26 August 2007; Volume 2007, pp. 5601–5604. [Google Scholar] [CrossRef]
- Kukushkin, A.; Dmitry, M.; Ivanova, E.; Evgeny, F.; Zhukov, I.U.; Sergey, S.; Anastasia, T.; Rami, M.; Andrey, S. Recognition of hemorrhage in the images of wireless capsule endoscopy. In Proceedings of the Mediterranean Electrotechnical Conference—MELECON, Yasmine Hammamet, Tunisia, 25–28 March 2012; pp. 899–902. [Google Scholar] [CrossRef]
- Poh, C.K.; Zhang, Z.; Liang, Z.Y.; Li, L.; Liu, J. Feature selection and classification for wireless capsule endoscopic frames. In Proceedings of the International Conference on Biomedical and Pharmaceutical Engineering, Singapore, 2–4 December 2009. [Google Scholar] [CrossRef]
- Ghosh, T.; Bashar, S.K.; Fattah, S.A.; Shahnaz, C.; Wahid, K.A. An automatic bleeding detection scheme in wireless capsule endoscopy based on statistical features in hue space. In Proceedings of the 2014 17th International Conference on Computer and Information Technology, ICCIT 2014, Dhaka, Bangladesh, 22–23 December 2014; pp. 354–357. [Google Scholar] [CrossRef]
- Timotius, I.K.; Miaou, S.-G.; Valdeavilla, E.B.; Liu, Y.-H. Abnormality detection for capsule endoscope images based on support vector machines. Biomed. Eng. Appl. Basis Commun. 2012, 24, 71–83. [Google Scholar] [CrossRef]
- Zhou, S.; Song, X.; Siddique, M.A.; Xu, J.; Zhou, P. Bleeding detection in wireless capsule endoscopy images based on binary feature vector. In Proceedings of the 5th International Conference on Intelligent Control and Information Processing, ICICIP 2014, Dalian, China, 18–20 August 2014; Institute of Electrical and Electronics Engineers Inc.: New York, NY, USA, 2015; pp. 29–33. [Google Scholar] [CrossRef]
- Cui, L.; Hu, C.; Zou, Y.; Meng, M.Q.-H. Bleeding detection in wireless capsule endoscopy images by support vector classifier. In Proceedings of the 2010 IEEE International Conference on Information and Automation, ICIA 2010, Harbin, China, 20–23 June 2010; pp. 1746–1751. [Google Scholar] [CrossRef]
- Li, B.; Meng, M.Q.-H. Computer aided detection of bleeding in capsule endoscopy images. In Proceedings of the Canadian Conference on Electrical and Computer Engineering, Niagara Falls, ON, Canada, 4–7 May 2008; pp. 1963–1966. [Google Scholar] [CrossRef]
- Poh, C.K.; Htwe, T.M.; Li, L.; Shen, W.; Liu, J.; Lim, J.H.; Chan, K.L.; Tan, P.C. Multi-level local feature classification for bleeding detection in Wireless Capsule Endoscopy images. In Proceedings of the 2010 IEEE Conference on Cybernetics and Intelligent Systems, CIS 2010, Singapore, 28–30 June 2010; pp. 76–81. [Google Scholar] [CrossRef]
- Pons, P.; Noorda, R.; Nevárez, A.; Colomer, A.; Beltrán, V.P.; Naranjo, V. Design and Development of an Automatic Blood Detection System for Capsule Endoscopy Images. In Lecture Notes in Computer Science; Springer: Berlin/Heidelberg, Germany, 2019; Volume 11872, pp. 105–113. [Google Scholar] [CrossRef]
- Dilna, C.; Gopi, V.P. A novel method for bleeding detection in Wireless Capsule Endoscopic images. In Proceedings of the 2015 International Conference on Computing and Network Communications, CoCoNet 2015, Trivandrum, India, 16–19 December 2015; IEEE: New York, NY, USA, 2016; pp. 854–858. [Google Scholar] [CrossRef]
- Reeha, K.R.; Shailaja, K.; Gopi, V.P. Undecimated Complex Wavelet Transform based bleeding detection for endoscopic images. In Proceedings of the 2016 2nd International Conference on Cognitive Computing and Information Processing, CCIP 2016, Mysuru, India, 12–13 August 2016. [Google Scholar] [CrossRef]
- Maghsoudi, O.H.; Alizadeh, M.; Mirmomen, M. A computer aided method to detect bleeding, tumor, and disease regions in Wireless Capsule Endoscopy. In Proceedings of the 2016 IEEE Signal Processing in Medicine and Biology Symposium, Philadelphia, PA, USA, 3 December 2016; Institute of Electrical and Electronics Engineers Inc.: New York, NY, USA, 2017. [Google Scholar] [CrossRef]
- Naz, J.; Sharif, M.I.; Sharif, M.I.; Kadry, S.; Rauf, H.T.; Ragab, A.E. A Comparative Analysis of Optimization Algorithms for Gastrointestinal Abnormalities Recognition and Classification Based on Ensemble XcepNet23 and ResNet18 Features. Biomedicines 2023, 11, 1723. [Google Scholar] [CrossRef]
- Li, B.; Meng, M.Q.-H. Computer-aided detection of bleeding regions for capsule endoscopy images. IEEE Trans. Biomed. Eng. 2009, 56, 1032–1039. [Google Scholar] [CrossRef] [PubMed]
- Li, B.; Meng, M.Q.-H. Computer-based detection of bleeding and ulcer in wireless capsule endoscopy images by chromaticity moments. Comput. Biol. Med. 2009, 39, 141–147. [Google Scholar] [CrossRef] [PubMed]
- Hajabdollahi, M.; Esfandiarpoor, R.; Najarian, K.; Karimi, N.; Samavi, S.; Reza Soroushmehr, S.M. Low Complexity CNN Structure for Automatic Bleeding Zone Detection in Wireless Capsule Endoscopy Imaging. In Proceedings of the 41st Annual International Conference of the IEEE Engineering in Medicine and Biology Society, Berlin, Germany, 23–27 July 2019; Volume 2019, pp. 7227–7230. [Google Scholar] [CrossRef]
- Ghosh, T.; Li, L.; Chakareski, J. Effective Deep Learning for Semantic Segmentation Based Bleeding Zone Detection in Capsule Endoscopy Images. In Proceedings of the International Conference on Image Processing, ICIP, Athens, Greece, 7–10 October 2018; pp. 3034–3038. [Google Scholar] [CrossRef]
- Sharif, M.; Attique Khan, M.; Rashid, M.; Yasmin, M.; Afza, F.; Tanik, U.J. Deep CNN and geometric features-based gastrointestinal tract diseases detection and classification from wireless capsule endoscopy images. J. Exp. Theor. Artif. Intell. 2019, 33, 577–599. [Google Scholar] [CrossRef]
- Yuan, Y.; Li, B.; Meng, M.Q.-H. WCE abnormality detection based on saliency and adaptive locality-constrained linear coding. IEEE Trans. Autom. Sci. Eng. 2017, 14, 149–159. [Google Scholar] [CrossRef]
- Charfi, S.; El Ansari, M. Gastrointestinal tract bleeding detection from wireless capsule endoscopy videos. In Proceedings of the ACM International Conference Proceeding Series, Cambridge, UK, 22–23 March 2017. [Google Scholar] [CrossRef]
- Ghosh, T.; Fattah, S.A.; Bashar, S.K.; Shahnaz, C.; Wahid, K.A.; Zhu, W.-P.; Ahmad, M.O. An automatic bleeding detection technique in wireless capsule endoscopy from region of interest. In Proceedings of the International Conference on Digital Signal Processing DSP, Singapore, 21–24 July 2015; Volume 2015, pp. 1293–1297. [Google Scholar] [CrossRef]
- Kundu, A.K.; Rizve, M.N.; Ghosh, T.; Fattah, S.A.; Shahnaz, C. A histogram based scheme in YIQ domain for automatic bleeding image detection from wireless capsule endoscopy. In Proceedings of the 2015 IEEE International WIE Conference on Electrical and Computer Engineering, WIECON-ECE 2015, Dhaka, Bangladesh, 19–20 December 2015; Institute of Electrical and Electronics Engineers Inc.: New York, NY, USA, 2016; pp. 455–458. [Google Scholar] [CrossRef]
- Liu, D.-Y.; Gan, T.; Rao, N.-N.; Xing, Y.-W.; Zheng, J.; Li, S.; Luo, C.-S.; Zhou, Z.-J.; Wan, Y.-L. Identification of lesion images from gastrointestinal endoscope based on feature extraction of combinational methods with and without learning process. Med. Image Anal. 2016, 32, 281–294. [Google Scholar] [CrossRef]
- Yuan, Y.; Li, B.; Meng, M.Q.-H. Bleeding Frame and Region Detection in the Wireless Capsule Endoscopy Video. IEEE J. Biomed. Health Inform. 2016, 20, 624–630. [Google Scholar] [CrossRef]
- Figueiredo, I.N.; Kumar, S.; Leal, C.; Figueiredo, P.N. Computer-assisted bleeding detection in wireless capsule endoscopy images. Comput. Methods Biomech. Biomed. Eng. Imaging Vis. 2013, 1, 198–210. [Google Scholar] [CrossRef]
- Seebutda, A.; Sakuncharoenchaiya, S.; Numpacharoen, K.; Wiwatwattana, N.; Charoen, A.; Charoenpong, T. Bleeding Region Segmentation in Wireless Capsule Endoscopy Images by K-Mean Clustering Technique. In Proceedings of the 2023 Third International Symposium on Instrumentation, Control, Artificial Intelligence and Robotics (ICA-SYMP), Bangkok, Thailand, 18–20 January 2023; pp. 69–72. [Google Scholar] [CrossRef]
- Sunitha, S.; Sujatha, S.S. An Improved Bleeding Detection Method for Wireless Capsule Endoscopy (WCE) Images Based on AlexNet. In Proceedings of the 2021 3rd International Conference on Signal Processing and Communication (ICPSC), Coimbatore, India, 13–14 May 2021; pp. 11–15. [Google Scholar] [CrossRef]
- Lu, B. Image Aided Recognition of Wireless Capsule Endoscope Based on the Neural Network. J. Healthc. Eng. 2022, 2022, 3880356. [Google Scholar] [CrossRef]
- Mathew, M.; Gopi, V.P. Transform based bleeding detection technique for endoscopic images. In Proceedings of the 2nd International Conference on Electronics and Communication Systems, ICECS 2015, Coimbatore, India, 26–27 February 2015; pp. 1730–1734. [Google Scholar] [CrossRef]
- Karargyris, A.; Bourbakis, N. A methodology for detecting blood-based abnormalities in wireless capsule endoscopy videos. In Proceedings of the 8th IEEE International Conference on BioInformatics and BioEngineering, Athens, Greece, 8–10 October 2008. [Google Scholar] [CrossRef]
- Liu, X.; Gu, J.; Xie, Y.; Xiong, J.; Qin, W. A new approach to detecting ulcer and bleeding in wireless capsule endoscopy images. In Proceedings of the IEEE-EMBS International Conference on Biomedical and Health Informatics: Global Grand Challenge of Health Informatics, BHI 2012, Hong Kong, China, 5–7 January 2012; pp. 737–740. [Google Scholar] [CrossRef]
- Priyadharshini, B.; Gomathi, T. Navie bayes classifier for wireless capsule endoscopy video to detect bleeding frames. Int. J. Sci. Technol. Res. 2020, 9, 3286–3291. [Google Scholar]
- Ghosh, T.; Bashar, S.K.; Fattah, S.A.; Shahnaz, C.; Wahid, K.A. A feature extraction scheme from region of interest of wireless capsule endoscopy images for automatic bleeding detection. In Proceedings of the 2014 IEEE International Symposium on Signal Processing and Information Technology, ISSPIT 2014, Noida, India, 15–17 December 2014; Institute of Electrical and Electronics Engineers Inc.: New York, NY, USA, 2015. [Google Scholar] [CrossRef]
- Mohammed, S.K.; Deeba, F.; Bui, F.M.; Wahid, K.A. Application of modified ant colony optimization for computer aided bleeding detection system. In Proceedings of the International Joint Conference on Neural Networks, Vancouver, BC, Canada, 24–29 July 201; Volume 2016, pp. 4317–4324. [CrossRef]
- Xing, X.; Jia, X.; Meng, M.-H.Q. Bleeding Detection in Wireless Capsule Endoscopy Image Video Using Superpixel-Color Histogram and a Subspace KNN Classifier. In Proceedings of the 2018 40th Annual International Conference of the IEEE Engineering in Medicine and Biology Society (EMBC), Honolulu, HI, USA, 18–21 July 2018; Volume 2018, pp. 1–4. [Google Scholar] [CrossRef]
- Jung, Y.S.; Kim, Y.H.; Lee, D.H.; Kim, J.H. Active blood detection in a high resolution capsule endoscopy using color spectrum transformation. In Proceedings of the 1st International Conference on BioMedical Engineering and Informatics, BMEI 2008, Sanya, China, 27–30 May 2008; Volume 1, pp. 859–862. [Google Scholar] [CrossRef]
- Lv, G.; Yan, G.; Wang, Z. Bleeding detection in wireless capsule endoscopy images based on color invariants and spatial pyramids using support vector machines. In Proceedings of the 2011 Annual International Conference of the IEEE Engineering in Medicine and Biology Society, Boston, MA, USA, 30 August–3 September 2011; Volume 2011, pp. 6643–6646. [Google Scholar] [CrossRef]
- Pan, G.; Yan, G.; Song, X.; Qiu, X. BP neural network classification for bleeding detection in wireless capsule endoscopy. J. Med. Eng. Technol. 2009, 33, 575–581. [Google Scholar] [CrossRef]
- Pan, G.; Yan, G.; Qiu, X.; Cui, J. Bleeding detection in Wireless Capsule Endoscopy based on Probabilistic Neural Network. J. Med. Syst. 2010, 35, 1477–1484. [Google Scholar] [CrossRef] [PubMed]
- Mohammed, S.K.; Deeba, F.; Bui, F.M.; Wahid, K.A. Feature selection using modified ant colony optimization for wireless capsule endoscopy. In Proceedings of the 2016 IEEE 7th Annual Ubiquitous Computing, Electronics and Mobile Communication Conference, UEMCON 2016, New York, NY, USA, 20–22 October 2016. [Google Scholar] [CrossRef]
- Iakovidis, D.K.; Chatzis, D.; Chrysanthopoulos, P.; Koulaouzidis, A. Blood detection in wireless capsule endoscope images based on salient superpixels. In Proceedings of the 2015 37th Annual International Conference of the IEEE Engineering in Medicine and Biology Society (EMBC), Milan, Italy, 25–29 August 2015; Volume 2015, pp. 731–734. [Google Scholar] [CrossRef]
- Obukhova, N.; Motyko, A.; Timofeev, B.; Pozdeev, A. Method of endoscopic images analysis for automatic bleeding detection and segmentation. In Proceedings of the Conference of Open Innovation Association, FRUCT, Moscow, Russia, 8–12 April 2019; Volume 2019, pp. 285–290. [Google Scholar] [CrossRef]
- Yi, S.; Jiao, H.; Xie, J.; Mui, P.; Leighton, J.A.; Pasha, S.; Rentz, L.; Abedi, M. A clinically viable Capsule Endoscopy video analysis platform for automatic bleeding detection. In Proceedings of the SPIE—The International Society for Optical Engineering, Lake Buena Vista (Orlando Area), FL, USA, 9–14 February 2013; Volume 8670. [Google Scholar] [CrossRef]
- Kundu, A.K.; Fattah, S.A. Probability density function based modeling of spatial feature variation in capsule endoscopy data for automatic bleeding detection. Comput. Biol. Med. 2019, 115, 103478. [Google Scholar] [CrossRef] [PubMed]
- Amiri, Z.; Hassanpour, H.; Beghdadi, A. A Computer- Aided Method to Detect Bleeding Frames in Capsule Endoscopy Images. In Proceedings of the European Workshop on Visual Information Processing, EUVIP, Roma, Italy, 28–31 October 2019; Volume 2019, pp. 217–221. [Google Scholar] [CrossRef]
- Szczypiński, P.; Klepaczko, A.; Pazurek, M.; Daniel, P. Texture and color based image segmentation and pathology detection in capsule endoscopy videos. Comput. Methods Programs Biomed. 2014, 113, 396–411. [Google Scholar] [CrossRef] [PubMed]
- Kundu, A.K.; Fattah, S.A.; Wahid, K.A. Least Square Saliency Transformation of Capsule Endoscopy Images for PDF Model Based Multiple Gastrointestinal Disease Classification. IEEE Access 2020, 8, 58509–58521. [Google Scholar] [CrossRef]
- Tuba, E.; Tomic, S.; Beko, M.; Zivkovic, D.; Tuba, M. Bleeding Detection in Wireless Capsule Endoscopy Images Using Texture and Color Features. In Proceedings of the 2018 26th Telecommunications Forum (TELFOR), Belgrade, Serbia, 20–21 November 2018; pp. 1–4. [Google Scholar] [CrossRef]
- Ponnusamy, R.; Sathiamoorthy, S. An efficient gastrointestinal hemorrhage detection and diagnosis model for wireless capsule endoscopy. Int. J. Recent Technol. Eng. 2019, 8, 7549–7554. [Google Scholar] [CrossRef]
- Hassan, A.R.; Haque, M.A. Computer-aided gastrointestinal hemorrhage detection in wireless capsule endoscopy videos. Comput. Methods Programs Biomed. 2015, 122, 341–353. [Google Scholar] [CrossRef]
- Amiri, Z.; Hassanpour, H.; Beghdadi, A. A Computer-Aided Method for Digestive System Abnormality Detection in WCE Images. J. Healthc. Eng. 2021, 2021, 7863113. [Google Scholar] [CrossRef] [PubMed]
- Goyal, A.; Kaur, J.; Dhatarwal, J.; Handa, P.; Goel, N. Automatic detection of WCE bleeding frames using hybrid features and machine learning algorithms. In Proceedings of the 2022 IEEE India Council International Subsections Conference (INDISCON), Bhubaneswar, India, 15–17 July 2022; pp. 1–7. [Google Scholar] [CrossRef]
- Amiri, Z.; Hassanpour, H.; Beghdadi, A. Combining deep features and hand-crafted features for abnormality detection in WCE images. Multimed. Tools Appl. 2023. [Google Scholar] [CrossRef]
- Vajravelu, A.; Selvan, K.S.T.; Jamil, M.M.B.A.; Jude, A.; Diez, I.D.L.T. Machine learning techniques to detect bleeding frame and area in wireless capsule endoscopy video. J. Intell. Fuzzy Syst. 2023, 44, 353–364. [Google Scholar] [CrossRef]
- Amiri, Z.; Hassanpour, H.; Beghdadi, A. Feature extraction for abnormality detection in capsule endoscopy images. Biomed. Signal Process. Control 2022, 71, 103219. [Google Scholar] [CrossRef]
- Patel, A.; Rani, K.; Kumar, S.; Figueiredo, I.N.; Figueiredo, P.N. Automated bleeding detection in wireless capsule endoscopy images based on sparse coding. Multimed. Tools Appl. 2020, 80, 30353–30366. [Google Scholar] [CrossRef]
- Joshi, I.; Kumar, S.; Figueiredo, I.N. Bag of visual words approach for bleeding detection in wireless capsule endoscopy images. In Lecture Notes in Computer Science; Springer: Berlin/Heidelberg, Germany, 2016; Volume 9730, pp. 575–582. [Google Scholar] [CrossRef]
- Nayyar, Z.; Attique Khan, M.; Alhussein, M.; Nazir, M.; Aurangzeb, K.; Nam, Y.; Kadry, S.; Irtaza Haider, S. Gastric Tract Disease Recognition Using Optimized Deep Learning Features. Comput. Mater. Contin. 2021, 68, 2041–2056. [Google Scholar] [CrossRef]
- Li, P.; Li, Z.; Gao, F.; Wan, L.; Yu, J. Convolutional neural networks for intestinal hemorrhage detection in wireless capsule endoscopy images. In Proceedings of the Proceedings—IEEE International Conference on Multimedia and Expo, Hong Kong, China, 10–14 July 2017; pp. 1518–1523. [Google Scholar] [CrossRef]
- Diamantis, D.E.; Iakovidis, D.K.; Koulaouzidis, A. Look-behind fully convolutional neural network for computer-aided endoscopy. Biomed. Signal Process. Control 2019, 49, 192–201. [Google Scholar] [CrossRef]
- Hwang, Y.; Lee, H.H.; Park, C.; Tama, B.A.; Kim, J.S.; Cheung, D.Y.; Chung, W.C.; Cho, Y.-S.; Lee, K.-M.; Choi, M.-G.; et al. Improved classification and localization approach to small bowel capsule endoscopy using convolutional neural network. Dig. Endosc. 2020, 33, 598–607. [Google Scholar] [CrossRef]
- Aoki, T.; Yamada, A.; Kato, Y.; Saito, H.; Tsuboi, A.; Nakada, A.; Niikura, R.; Fujishiro, M.; Oka, S.; Ishihara, S.; et al. Automatic detection of blood content in capsule endoscopy images based on a deep convolutional neural network. J. Gastroenterol. Hepatol. 2020, 35, 1196–1200. [Google Scholar] [CrossRef]
- Chu, Y.; Huang, F.; Gao, M.; Zou, D.-W.; Zhong, J.; Wu, W.; Wang, Q.; Shen, X.-N.; Gong, T.-T.; Li, Y.-Y.; et al. Convolutional neural network-based segmentation network applied to image recognition of angiodysplasias lesion under capsule endoscopy. World J. Gastroenterol. 2023, 29, 879–889. [Google Scholar] [CrossRef] [PubMed]
- Muruganantham, P.; Balakrishnan, S.M. Attention Aware Deep Learning Model for Wireless Capsule Endoscopy Lesion Classification and Localization. J. Med. Biol. Eng. 2022, 42, 157–168. [Google Scholar] [CrossRef]
- Li, S.; Si, P.; Zhang, Z.; Zhu, J.; He, X.; Zhang, N. DFCA-Net: Dual Feature Context Aggregation Network for Bleeding Areas Segmentation in Wireless Capsule Endoscopy Images. J. Med. Biol. Eng. 2022, 42, 179–188. [Google Scholar] [CrossRef]
- Garbaz, A.; Lafraxo, S.; Charfi, S.; El Ansari, M.; Koutti, L. Bleeding classification in Wireless Capsule Endoscopy Images based on Inception-ResNet-V2 and CNNs. In Proceedings of the 2022 IEEE Conference on Computational Intelligence in Bioinformatics and Computational Biology (CIBCB), Ottawa, ON, Canada, 15–17 August 2022; pp. 1–6. [Google Scholar] [CrossRef]
- Kim, S.H.; Hwang, Y.; Oh, D.J.; Nam, J.H.; Kim, K.B.; Park, J.; Song, H.J.; Lim, Y.J. Efficacy of a comprehensive binary classification model using a deep convolutional neural network for wireless capsule endoscopy. Sci. Rep. 2021, 11, 17479. [Google Scholar] [CrossRef]
- Lafraxo, S.; Souaidi, M.; El Ansari, M.; Koutti, L. Semantic Segmentation of Digestive Abnormalities from WCE Images by Using AttResU-Net Architecture. Life 2023, 13, 719. [Google Scholar] [CrossRef]
- Vieira, P.M.; Freitas, N.R.; Lima, V.B.; Costa, D.; Rolanda, C.; Lima, C.S. Multi-pathology detection and lesion localization in WCE videos by using the instance segmentation approach. Artif. Intell. Med. 2021, 119, 102141. [Google Scholar] [CrossRef] [PubMed]
- Kanakatte, A.; Ghose, A. Precise Bleeding and Red lesions localization from Capsule Endoscopy using Compact U-Net. In Proceedings of the 2021 43rd Annual International Conference of the IEEE Engineering in Medicine & Biology Society (EMBC), Mexico City, Mexico, 1–5 November 2021; pp. 3089–3092. [Google Scholar] [CrossRef]
- Mascarenhas Saraiva, M.; Afonso, J.; Ribeiro, T.; Ferreira, J.; Cardoso, H.; Andrade, P.; Gonçalves, R.; Cardoso, P.; Parente, M.; Jorge, R.; et al. Artificial intelligence and capsule endoscopy: Automatic detection of enteric protruding lesions using a convolutional neural network. Rev. Española Enfermedades Dig. 2023, 115, 75–79. [Google Scholar] [CrossRef]
- Afonso, J.; Saraiva, M.J.M.; Ferreira, J.P.S.; Cardoso, H.; Ribeiro, T.; Andrade, P.; Parente, M.; Jorge, R.N.; Saraiva, M.M.; Macedo, G. Development of a Convolutional Neural Network for Detection of Erosions and Ulcers with Distinct Bleeding Potential in Capsule Endoscopy. Tech. Innov. Gastrointest. Endosc. 2021, 23, 291–296. [Google Scholar] [CrossRef]
- Lu, F.; Li, W.; Lin, S.; Peng, C.; Wang, Z.; Qian, B.; Ranjan, R.; Jin, H.; Zomaya, A.Y. Multi-Scale Features Fusion for the Detection of Tiny Bleeding in Wireless Capsule Endoscopy Images. ACM Trans. Internet Things 2021, 3, 1–19. [Google Scholar] [CrossRef]
- Ribeiro, T. Artificial intelligence and capsule endoscopy: Automatic detection of vascular lesions using a convolutional neural network. Ann. Gastroenterol. 2021, 34, 820–828. [Google Scholar] [CrossRef]
- Mascarenhas Saraiva, M.; Ferreira, J.P.S.; Cardoso, H.; Afonso, J.; Ribeiro, T.; Andrade, P.; Parente, M.P.L.; Jorge, R.N.; Macedo, G. Artificial intelligence and colon capsule endoscopy: Automatic detection of blood in colon capsule endoscopy using a convolutional neural network. Endosc. Int. Open 2021, 09, E1264–E1268. [Google Scholar] [CrossRef]
- Jain, S.; Seal, A.; Ojha, A.; Yazidi, A.; Bures, J.; Tacheci, I.; Krejcar, O. A deep CNN model for anomaly detection and localization in wireless capsule endoscopy images. Comput. Biol. Med. 2021, 137, 104789. [Google Scholar] [CrossRef]
- Mascarenhas Saraiva, M.J.; Afonso, J.; Ribeiro, T.; Ferreira, J.; Cardoso, H.; Andrade, A.P.; Parente, M.; Natal, R.; Mascarenhas Saraiva, M.; Macedo, G. Deep learning and capsule endoscopy: Automatic identification and differentiation of small bowel lesions with distinct haemorrhagic potential using a convolutional neural network. BMJ Open Gastroenterol. 2021, 8, e000753. [Google Scholar] [CrossRef]
- Afonso, J.; Saraiva, M.M.; Ferreira, J.P.S.; Cardoso, H.; Ribeiro, T.; Andrade, P.; Parente, M.; Jorge, R.N.; Macedo, G. Automated detection of ulcers and erosions in capsule endoscopy images using a convolutional neural network. Med. Biol. Eng. Comput. 2022, 60, 719–725. [Google Scholar] [CrossRef] [PubMed]
- Biradher, S.; Aparna, P. Classification of Wireless Capsule Endoscopy Bleeding Images using Deep Neural Network. In Proceedings of the 2022 IEEE Delhi Section Conference (DELCON), New Delhi, India, 11–13 February 2022; pp. 1–4. [Google Scholar] [CrossRef]
- Hosoe, N.; Horie, T.; Tojo, A.; Sakurai, H.; Hayashi, Y.; Limpias Kamiya, K.J.-L.; Sujino, T.; Takabayashi, K.; Ogata, H.; Kanai, T. Development of a Deep-Learning Algorithm for Small Bowel-Lesion Detection and a Study of the Improvement in the False-Positive Rate. J. Clin. Med. 2022, 11, 3682. [Google Scholar] [CrossRef] [PubMed]
- Afonso, J.; Mascarenhas, M.; Ribeiro, T.; Cardoso, H.; Andrade, P.; Ferreira, J.P.S.; Saraiva, M.M.; Macedo, G. Deep Learning for Automatic Identification and Characterization of the Bleeding Potential of Enteric Protruding Lesions in Capsule Endoscopy. Gastro Hep Adv. 2022, 1, 835–843. [Google Scholar] [CrossRef]
- Mascarenhas, M.; Ribeiro, T.; Afonso, J.; Ferreira, J.P.S.; Cardoso, H.; Andrade, P.; Parente, M.P.L.; Jorge, R.N.; Mascarenhas Saraiva, M.; Macedo, G. Deep learning and colon capsule endoscopy: Automatic detection of blood and colonic mucosal lesions using a convolutional neural network. Endosc. Int. Open 2022, 10, E171–E177. [Google Scholar] [CrossRef]
- Goel, S.; Kumar Shah, A. CNN-based Classification over Wireless Capsule Endoscopy Bleeding Images. In Proceedings of the 2022 Second International Conference on Advanced Technologies in Intelligent Control, Environment, Computing & Communication Engineering (ICATIECE), Bangalore, India, 16–17 December 2022; pp. 1–5. [Google Scholar] [CrossRef]
- Duangchai, R.; Toonmana, C.; Numpacharoen, K.; Wiwatwattana, N.; Charoen, A.; Charoenpong, T. Bleeding Region Segmentation in Wireless Capsule Endoscopy Images by a Deep Learning Model: Initial Learning Rate and Epoch Optimization. In Proceedings of the 2022 International Conference on Decision Aid Sciences and Applications (DASA), Chiangrai, Thailand, 23–25 March 2022; pp. 1460–1463. [Google Scholar] [CrossRef]
- Mascarenhas Saraiva, M.; Ribeiro, T.; Afonso, J.; Ferreira, J.P.S.; Cardoso, H.; Andrade, P.; Parente, M.P.L.; Jorge, R.N.; Macedo, G. Artificial Intelligence and Capsule Endoscopy: Automatic Detection of Small Bowel Blood Content Using a Convolutional Neural Network. GE Port. J. Gastroenterol. 2022, 29, 331–338. [Google Scholar] [CrossRef] [PubMed]
- Tsuboi, A.; Oka, S.; Aoyama, K.; Saito, H.; Aoki, T.; Yamada, A.; Matsuda, T.; Fujishiro, M.; Ishihara, S.; Nakahori, M.; et al. Artificial intelligence using a convolutional neural network for automatic detection of small-bowel angioectasia in capsule endoscopy images. Dig. Endosc. 2020, 32, 382–390. [Google Scholar] [CrossRef]
- Khan, M.A.; Sharif, M.; Akram, T.; Yasmin, M.; Nayak, R.S. Stomach Deformities Recognition Using Rank-Based Deep Features Selection. J. Med. Syst. 2019, 43, 329. [Google Scholar] [CrossRef]
- Hajabdollahi, M.; Esfandiarpoor, R.; Khadivi, P.; Soroushmehr, S.M.R.; Karimi, N.; Najarian, K.; Samavi, S. Segmentation of bleeding regions in wireless capsule endoscopy for detection of informative frames. Biomed. Signal Process. Control 2019, 53, 101565. [Google Scholar] [CrossRef]
- Jia, X.; Meng, M.Q.-H. A deep convolutional neural network for bleeding detection in Wireless Capsule Endoscopy images. In Proceedings of the 2016 38th Annual International Conference of the IEEE Engineering in Medicine and Biology Society (EMBC), Orlando, FL, USA, 16–20 August 2016; Volume 2016, pp. 639–642. [Google Scholar] [CrossRef]
- Mori, Y.; Kudo, S.; Berzin, T.M.; Misawa, M.; Takeda, K. Computer-aided diagnosis for colonoscopy. Endoscopy 2017, 49, 813–819. [Google Scholar] [CrossRef]
- Kamitani, Y.; Nonaka, K.; Isomoto, H. Current Status and Future Perspectives of Artificial Intelligence in Colonoscopy. J. Clin. Med. 2022, 11, 2923. [Google Scholar] [CrossRef]
- Zhuang, P.; Schwing, A.G.; Koyejo, O. FMRI data augmentation via synthesis. In Proceedings of the 2019 IEEE 16th International Symposium on Biomedical Imaging (ISBI 2019), Venice, Italy, 8–11 April 2019; Volume 2019, pp. 1783–1787. [Google Scholar] [CrossRef]
- Zhao, H.; Li, H.; Maurer-Stroh, S.; Cheng, L. Synthesizing retinal and neuronal images with generative adversarial nets. Med. Image Anal. 2018, 49, 14–26. [Google Scholar] [CrossRef]
- Zhao, H.; Li, H.; Cheng, L. Synthesizing Filamentary Structured Images with GANs. arXiv 2017. [Google Scholar] [CrossRef]
- Bellemo, V.; Burlina, P.; Yong, L.; Wong, T.Y.; Ting, D.S.W. Generative Adversarial Networks (GANs) for Retinal Fundus Image Synthesis. In Lecture Notes in Computer Science; Springer: Berlin/Heidelberg, Germany, 2019; Volume 11367, pp. 289–302. [Google Scholar] [CrossRef]
- Jia, X.; Meng, M.Q.-H. Gastrointestinal Bleeding Detection in Wireless Capsule Endoscopy Images Using Handcrafted and CNN Features. In Proceedings of the 2017 39th Annual International Conference of the IEEE Engineering in Medicine and Biology Society (EMBC), Jeju, Republic of Korea, 11–15 July 2017; pp. 3154–3157. [Google Scholar] [CrossRef]
- Vasilakakis, M.D.; Diamantis, D.; Spyrou, E.; Koulaouzidis, A.; Iakovidis, D.K. Weakly Supervised Multilabel Classification for Semantic Interpretation of Endoscopy Video Frames. Evol. Syst. 2020, 11, 409–421. [Google Scholar] [CrossRef]
- Hajabdollahi, M.; Esfandiarpoor, R.; Sabeti, E.; Karimi, N.; Soroushmehr, S.M.R.; Samavi, S. Multiple Abnormality Detection for Automatic Medical Image Diagnosis Using Bifurcated Convolutional Neural Network. Biomed. Signal Process. Control 2020, 57, 101792. [Google Scholar] [CrossRef]
- Pannu, H.S.; Ahuja, S.; Dang, N.; Soni, S.; Malhi, A.K. Deep Learning Based Image Classification for Intestinal Hemorrhage. Multimed. Tools Appl. 2020, 79, 21941–21966. [Google Scholar] [CrossRef]
- Rani, K.; Devi, G.; Kumar, S.; Figueiredo, I.N.; Figueiredo, P.N. Classification of Wireless Capsule Endoscopy Images for Bleeding Using Deep Features Fusion. In Proceedings of the 2022 International Conference on Electrical, Computer, Communications and Mechatronics Engineering (ICECCME), Maldives, Maldives, 16–18 November 2022; pp. 1–6. [Google Scholar] [CrossRef]


| Inclusion Criteria | Exclusion Criteria |
|---|---|
| Articles published in peer-reviewed venues. | Articles that do not involve bleeding, lesion, or hemorrhage. |
| Articles published from 1 January 2001 to 24 July 2023. | Articles not written in English. |
| Articles must address a set of keywords: (Bleeding OR Hemorrhage OR blood) AND (Detection OR Segmentation OR Recognition OR Classification) AND (Capsule Endoscopy). | Exclude articles on non-humans. |
| Articles that describe an automatic computer-aided bleeding detection system for capsule endoscopy. | Exclude posters and book chapters. |
Disclaimer/Publisher’s Note: The statements, opinions and data contained in all publications are solely those of the individual author(s) and contributor(s) and not of MDPI and/or the editor(s). MDPI and/or the editor(s) disclaim responsibility for any injury to people or property resulting from any ideas, methods, instructions or products referred to in the content. |
© 2023 by the authors. Licensee MDPI, Basel, Switzerland. This article is an open access article distributed under the terms and conditions of the Creative Commons Attribution (CC BY) license (https://creativecommons.org/licenses/by/4.0/).
Share and Cite
Musha, A.; Hasnat, R.; Mamun, A.A.; Ping, E.P.; Ghosh, T. Computer-Aided Bleeding Detection Algorithms for Capsule Endoscopy: A Systematic Review. Sensors 2023, 23, 7170. https://doi.org/10.3390/s23167170
Musha A, Hasnat R, Mamun AA, Ping EP, Ghosh T. Computer-Aided Bleeding Detection Algorithms for Capsule Endoscopy: A Systematic Review. Sensors. 2023; 23(16):7170. https://doi.org/10.3390/s23167170
Chicago/Turabian StyleMusha, Ahmmad, Rehnuma Hasnat, Abdullah Al Mamun, Em Poh Ping, and Tonmoy Ghosh. 2023. "Computer-Aided Bleeding Detection Algorithms for Capsule Endoscopy: A Systematic Review" Sensors 23, no. 16: 7170. https://doi.org/10.3390/s23167170
APA StyleMusha, A., Hasnat, R., Mamun, A. A., Ping, E. P., & Ghosh, T. (2023). Computer-Aided Bleeding Detection Algorithms for Capsule Endoscopy: A Systematic Review. Sensors, 23(16), 7170. https://doi.org/10.3390/s23167170