
Automated Signal Quality Assessment of Single-Lead ECG Recordings for Early Detection of Silent Atrial Fibrillation

 , ,
, ,  ,
,
Abstract
1. Introduction
2. Analysis of Prerequisites
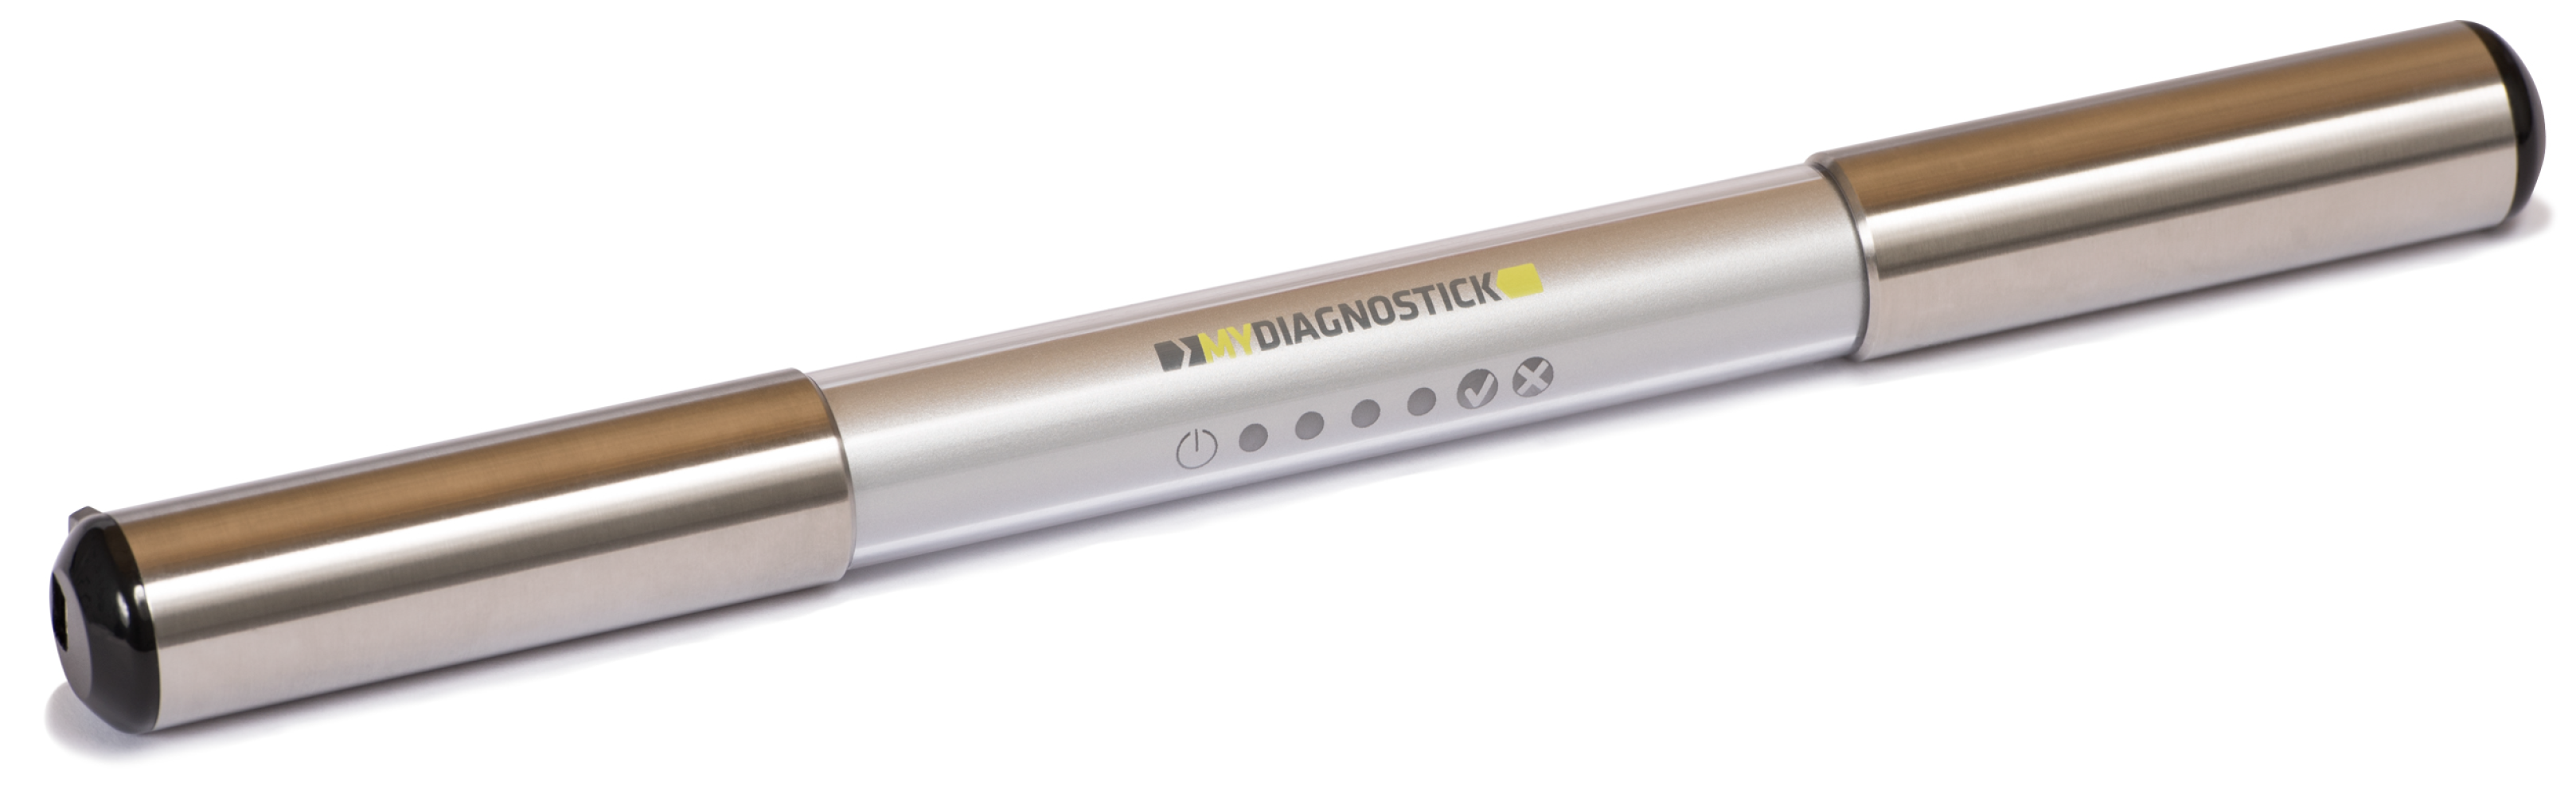
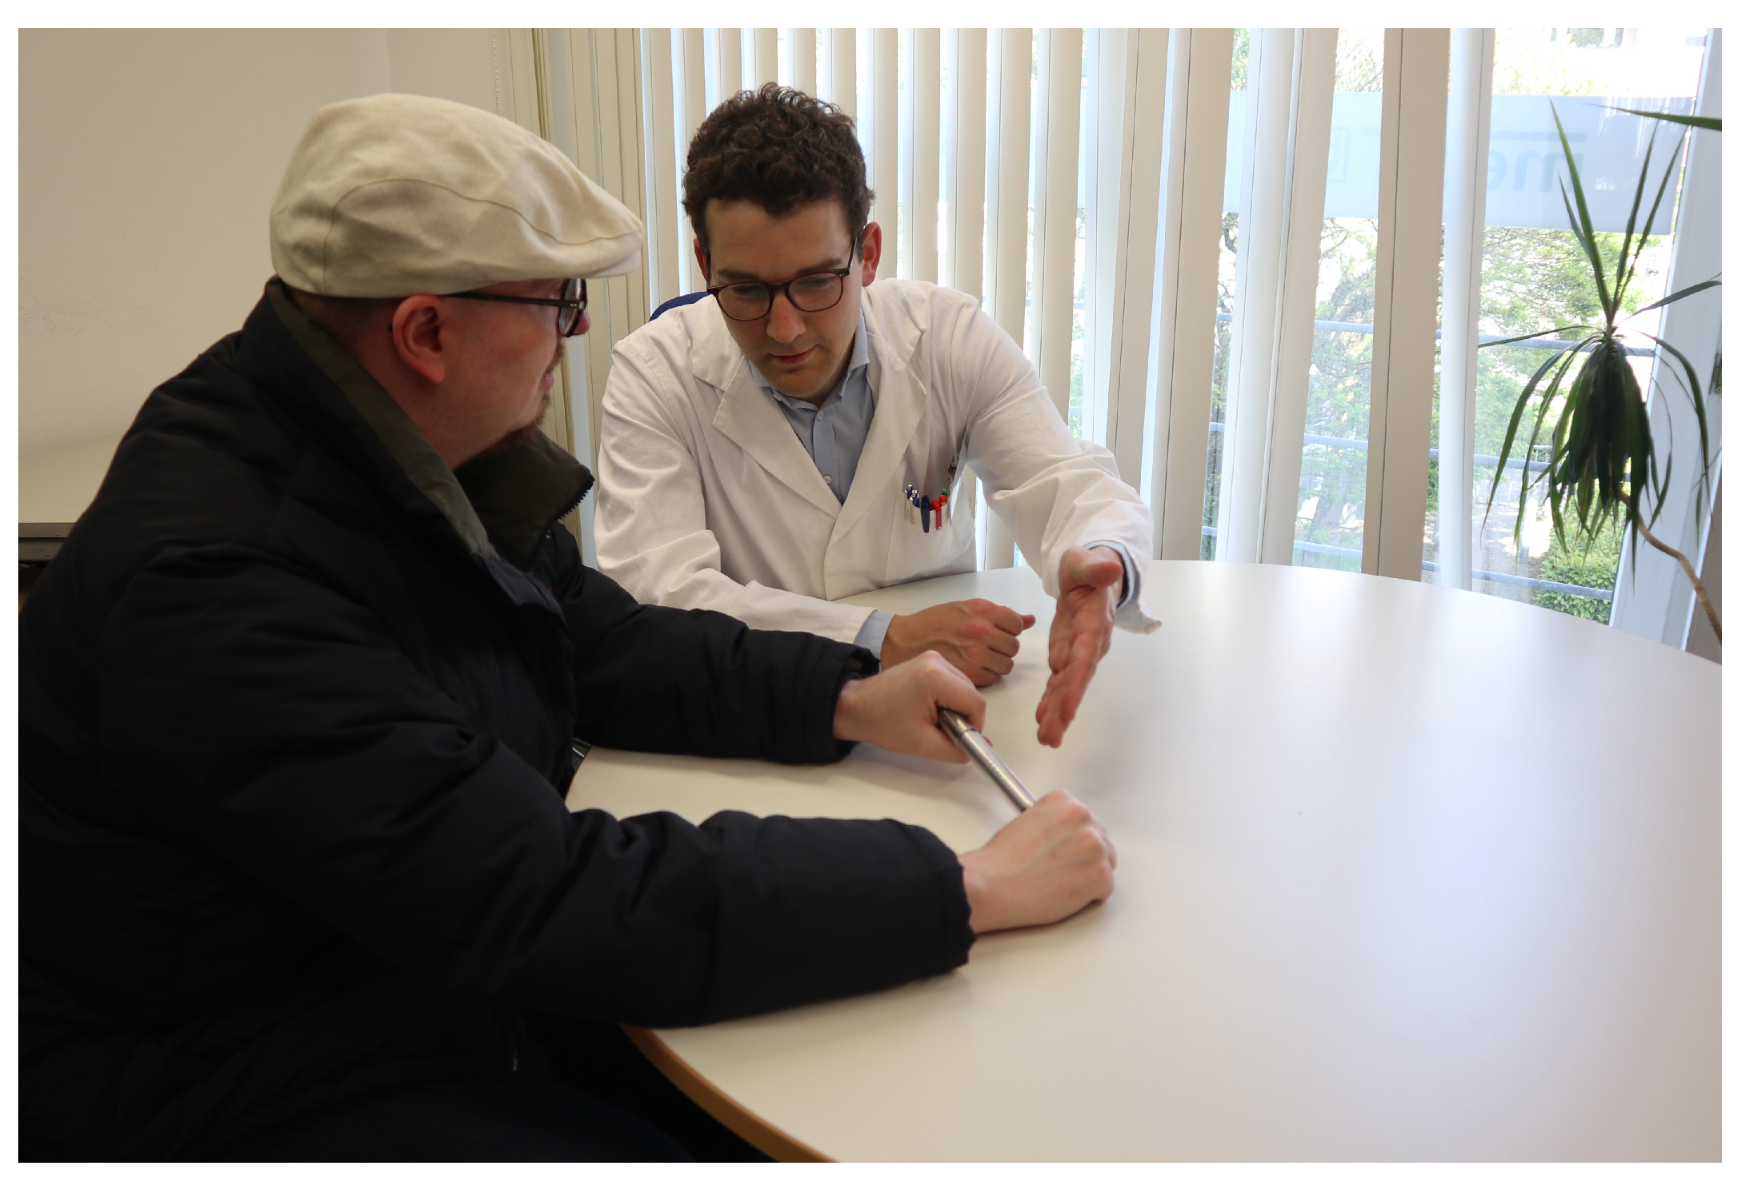
2.1. Single-Lead ECG Device for AF Detection

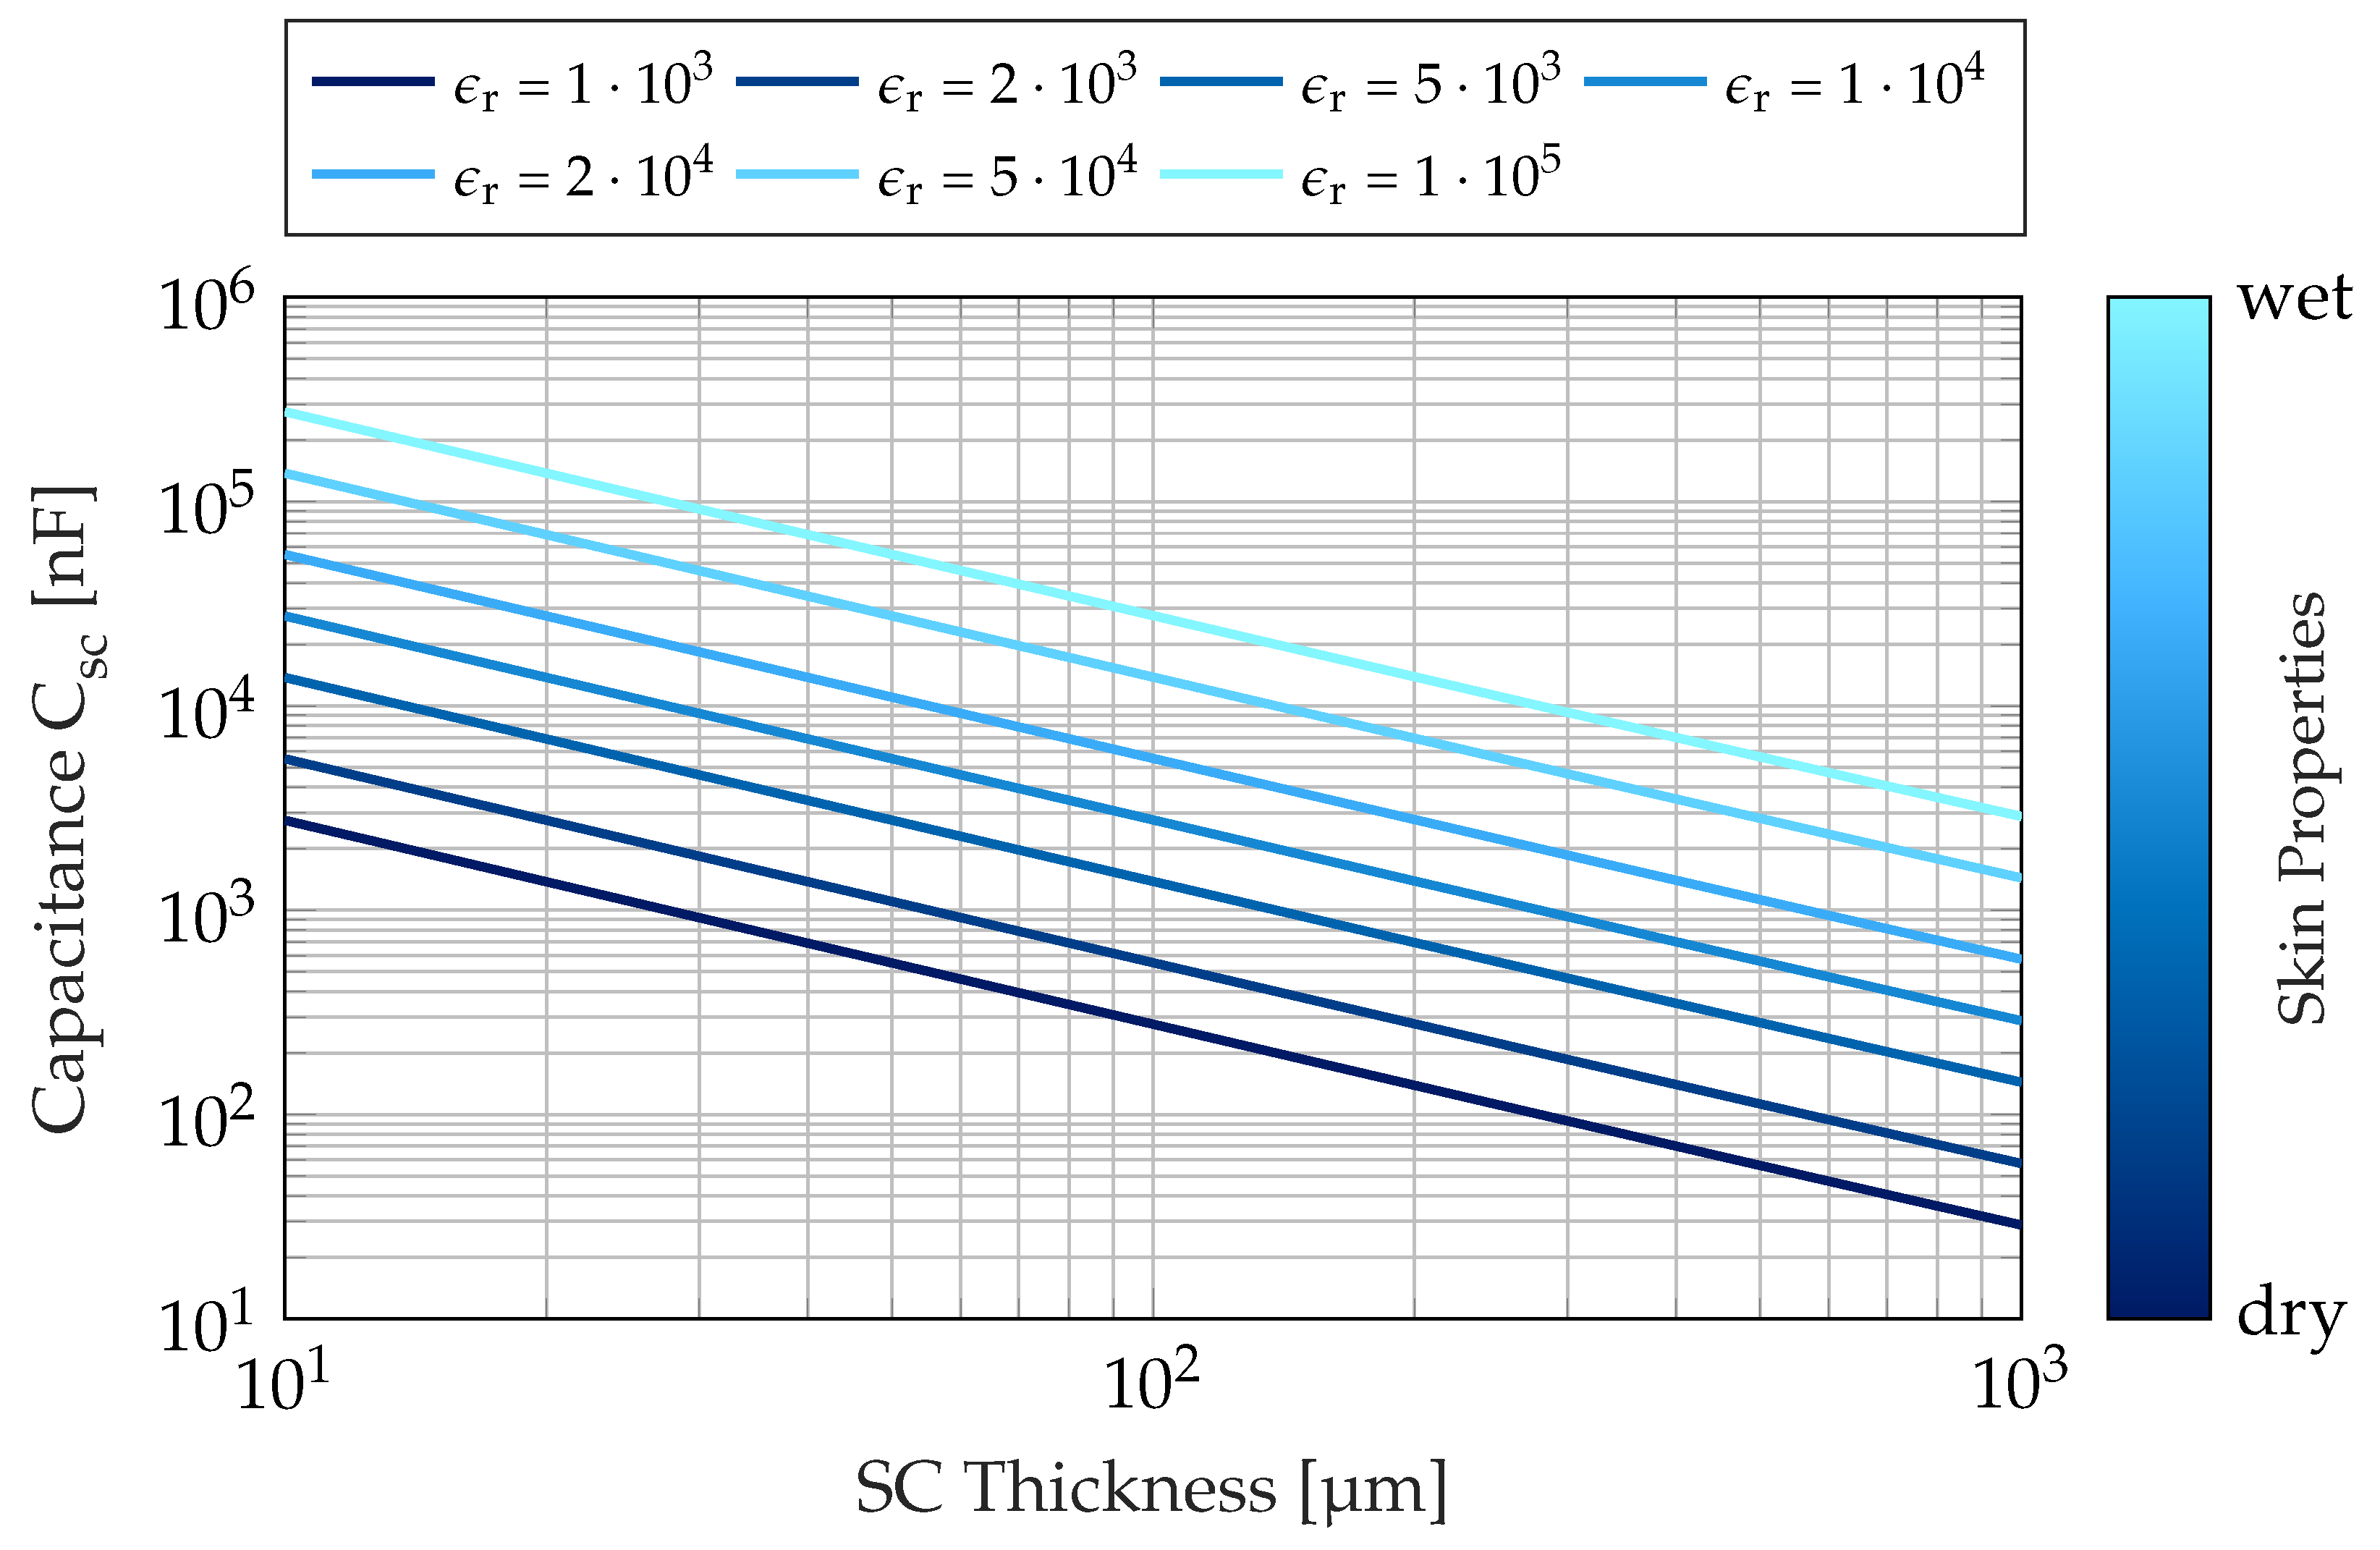
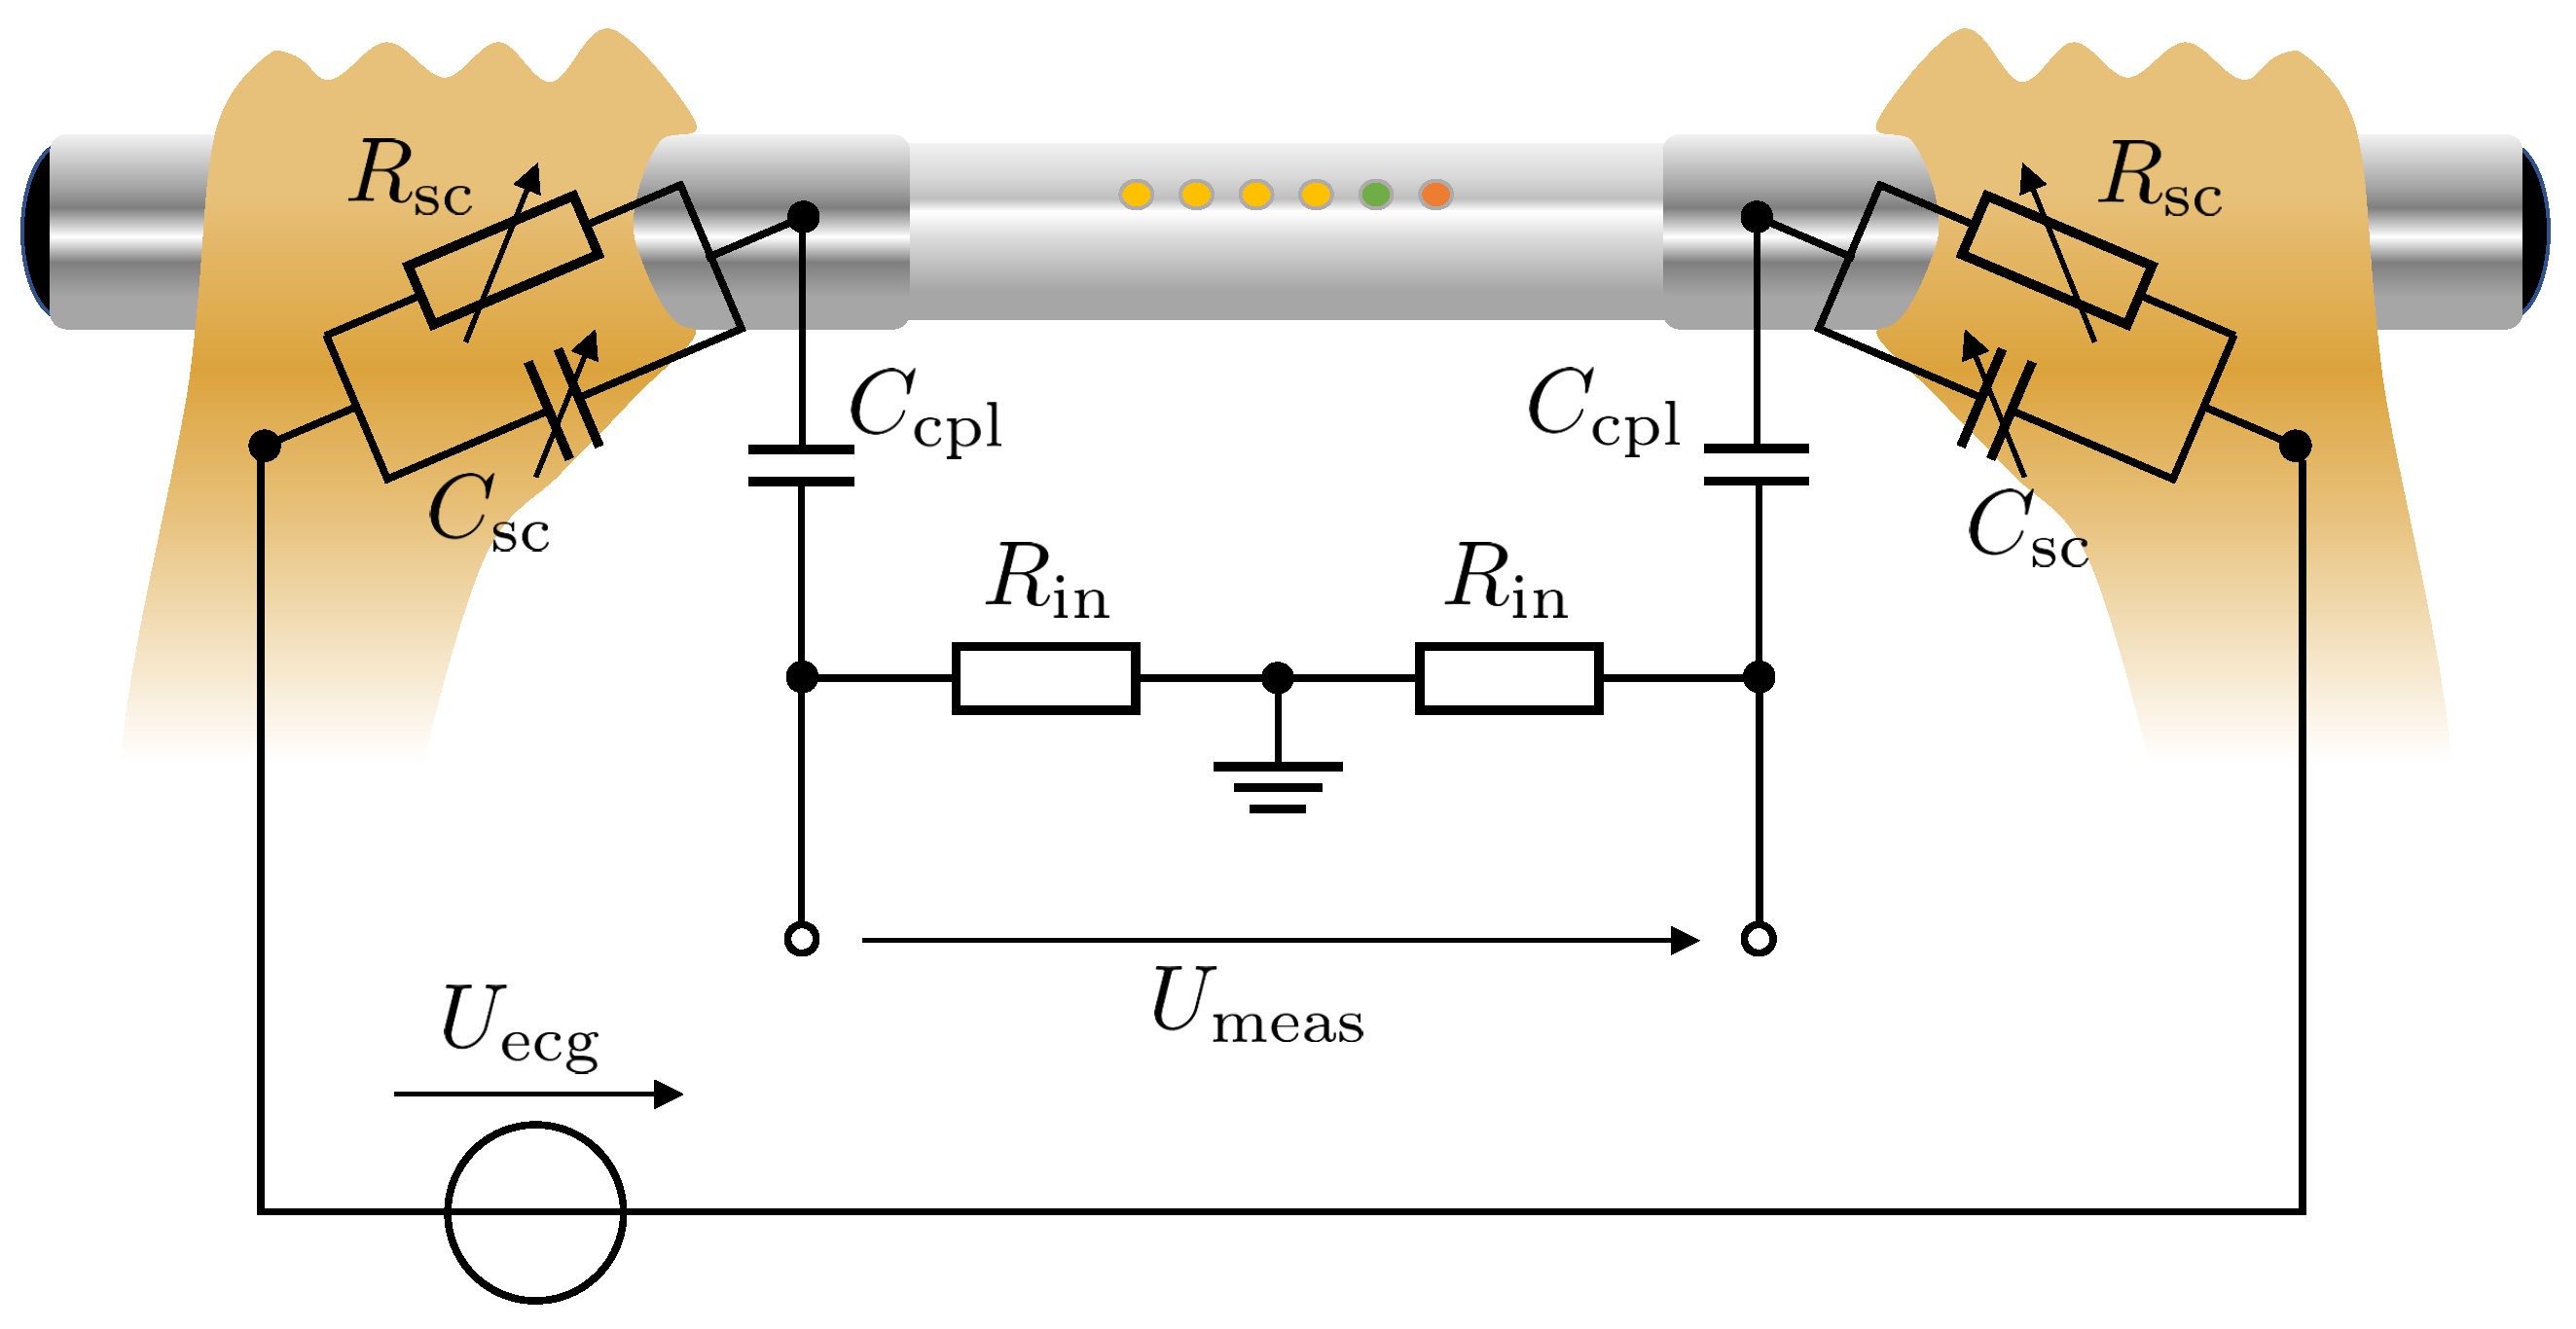
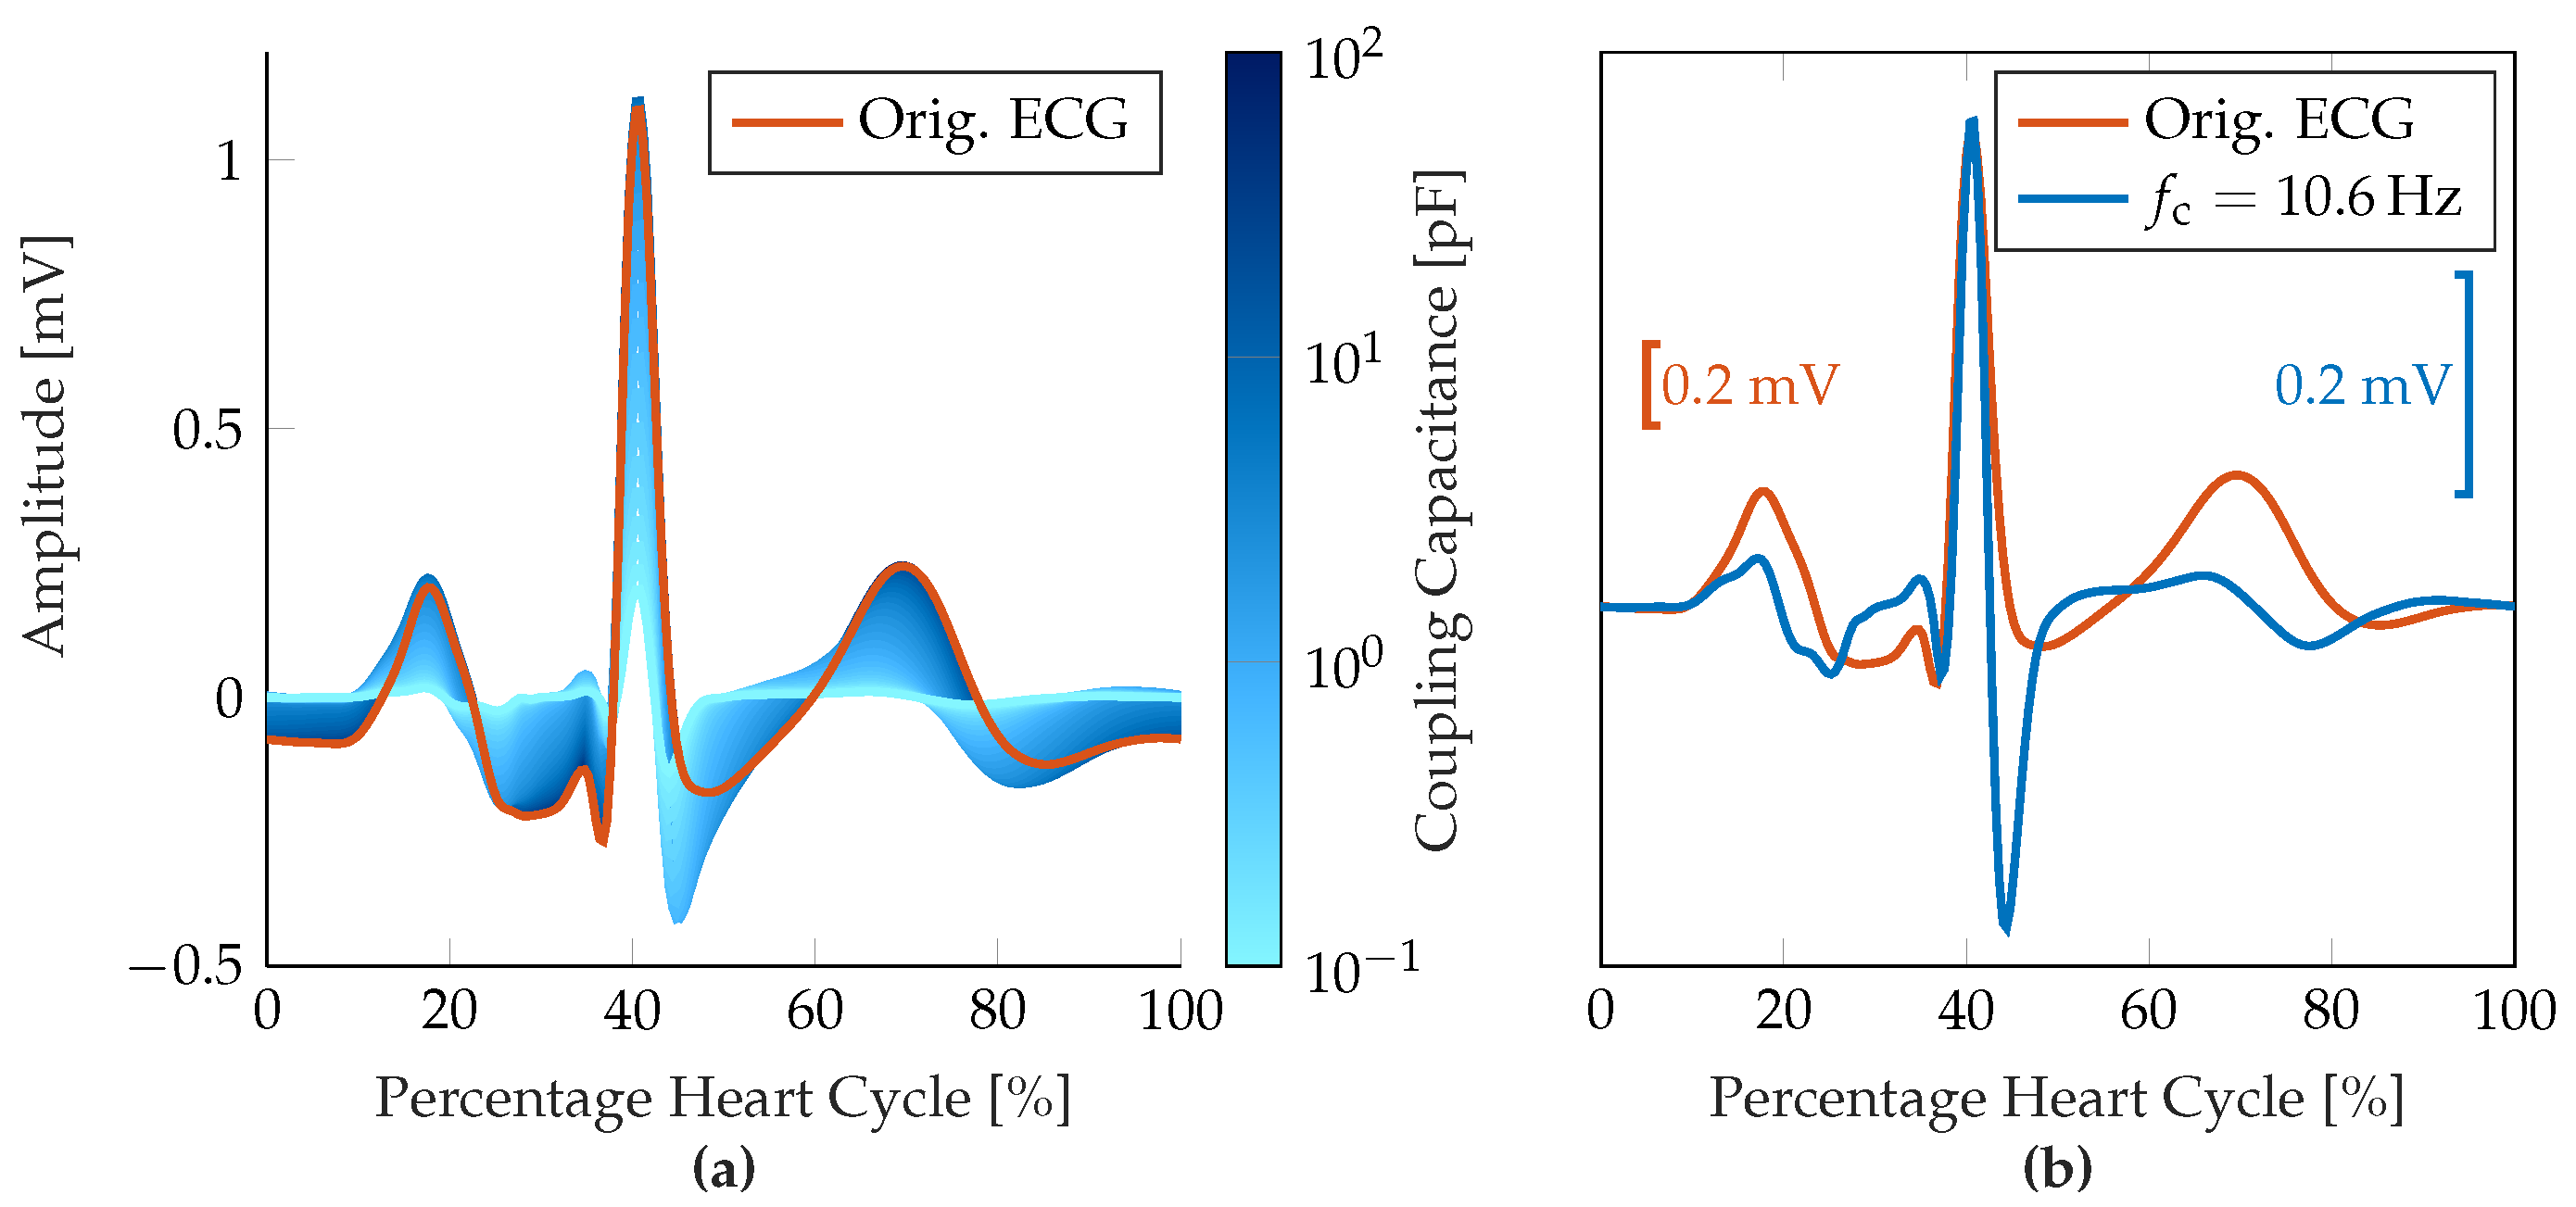
2.2. Characteristics and Simulation of Metal Electrodes and Measurement Device


2.3. Consequences for ECG Signal Evaluation
3. Materials and Methods
3.1. Pharmacy-Based AF Screening Study


| Parameter | Normal ECG | AF Detected | Total |
|---|---|---|---|
| Population [1] | |||
| Age [years] | |||
| Gender [m/f] | |||
| BMI [] |
| Percentage Normal ECG | Percentage AF | Percentage Other | Percentage Data Set | |
|---|---|---|---|---|
| Signal Quality | [%] (n) | [%] (n) | [%] (n) | [%] (n) |
| Excellent | 98.20 (817) | 1.80 (15) | 0 (0) | 11.83 (832) |
| Good | 95.79 (4578) | 4.21 (201) | 0 (0) | 67.97 (4779) |
| Poor | 88.24 (1185) | 11.76 (158) | 0 (0) | 19.10 (1343) |
| Uninterpretable | 0 (0) | 0 (0) | 100 (77) | 1.10 (77) |
| Total | 93.59 (6580) | 5.31 (374) | 1.10 (77) | 100 (7031) |
3.2. ECG Preprocessing

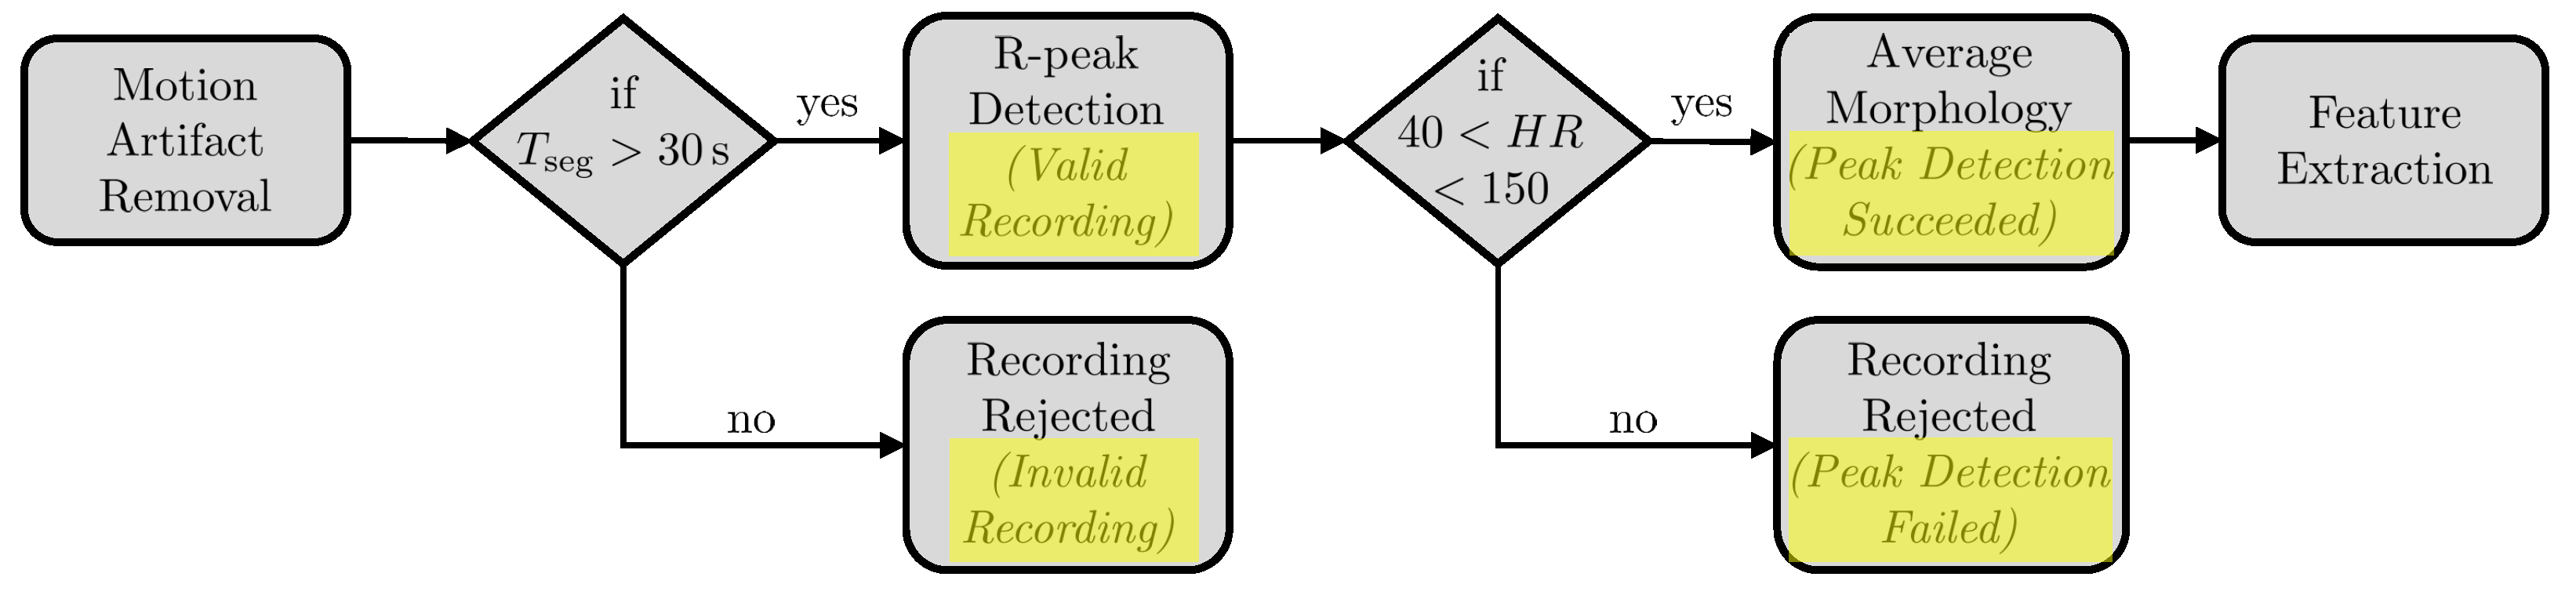
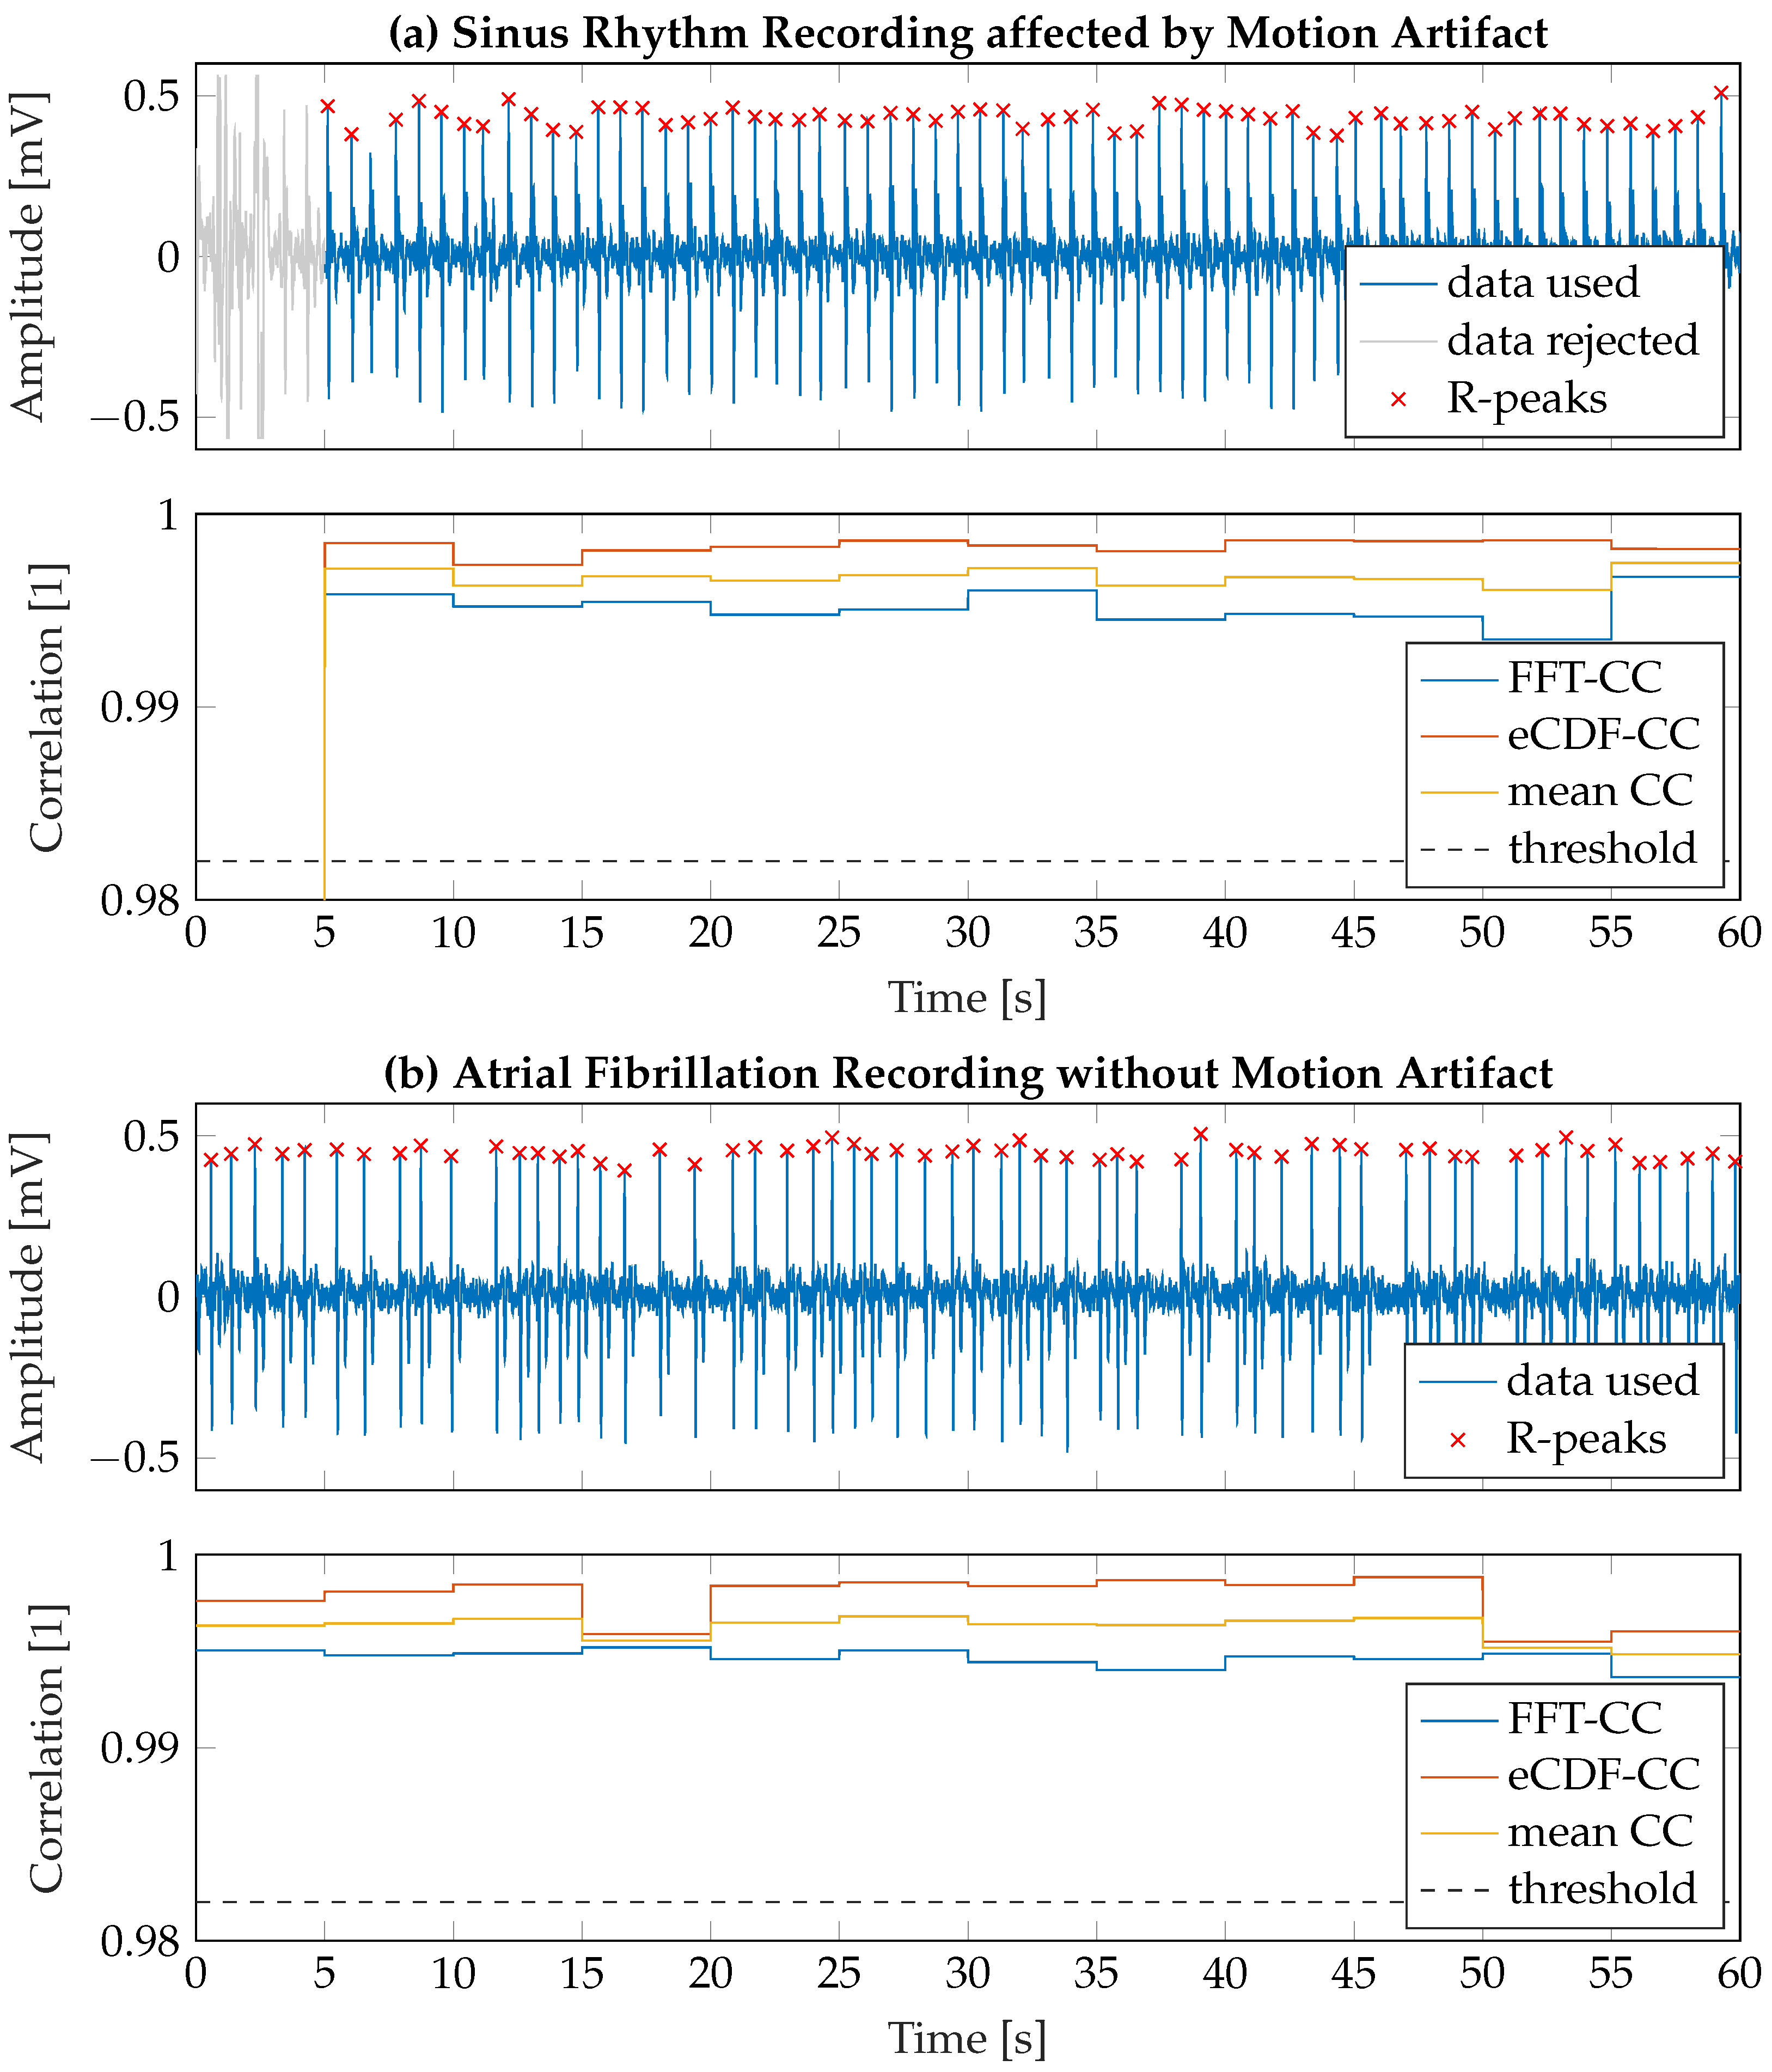
3.2.1. Motion Artifact Removal

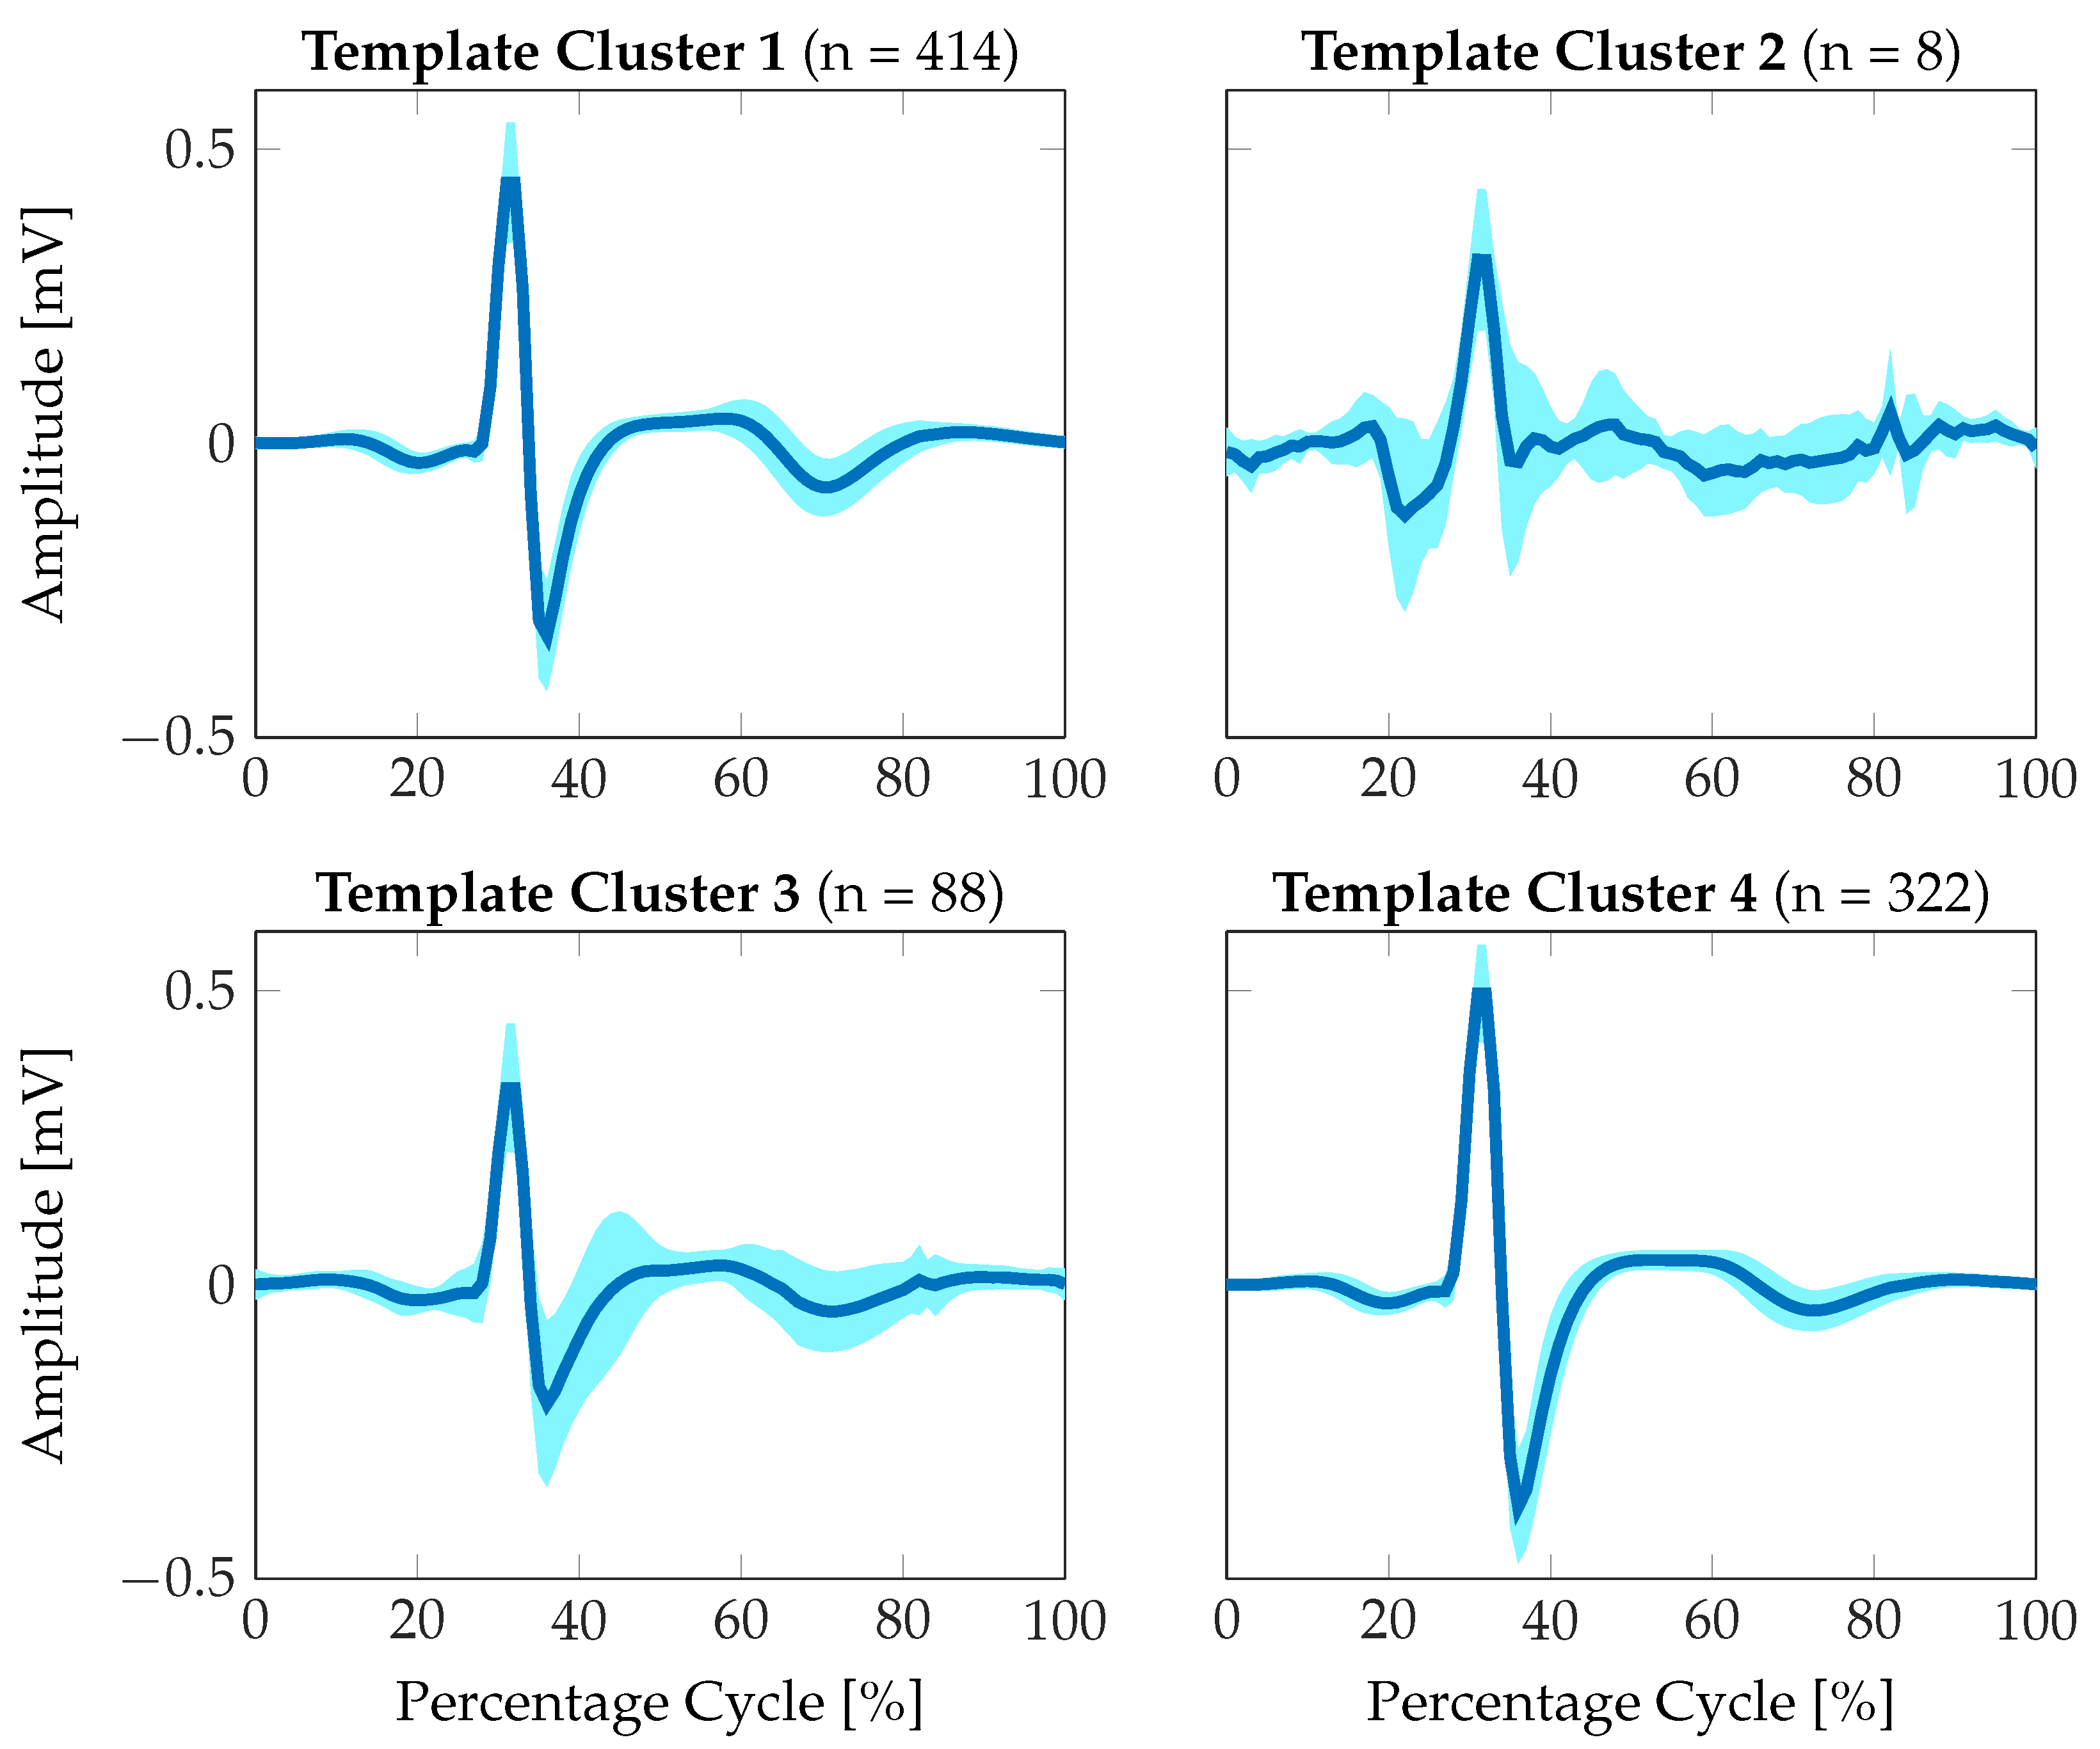
3.2.2. Extraction of Average Signal Morphology
| Signal Quality | Percentage Valid Recording | Percentage Invalid Recording | Percentage Peak Detection Succeeded | Percentage Peak Detection Failed |
|---|---|---|---|---|
| Excellent | 100 (832) | 0 (0) | 99.52 (828) | 0.48 (4) |
| Good | 99.67 (4763) | 0.33 (16) | 99.41 (4751) | 0.59 (28) |
| Poor | 99.03 (1330) | 0.97 (13) | 98.96 (1329) | 1.04 (14) |
| Uninterpretable | 94.81 (73) | 5.19 (4) | 96.10 (74) | 3.90 (3) |
| Total | 99.53 (6998) | 0.47 (33) | 99.30 (6982) | 0.70 (49) |

3.2.3. Feature Extraction for Signal Quality Assessment
| Category | Name | Description |
|---|---|---|
| Statistical Features | mean | 1st central moment over valid ECG signal segment |
| median | Median value over valid ECG signal segment | |
| standard deviation | 2nd central moment over valid ECG signal segment | |
| skewness | 3rd central moment over valid ECG signal segment | |
| kurtosis | 4th central moment over valid ECG signal segment | |
| Time-domain Features | mean HR | Average heart rate calculated from identified RR-intervals |
| SDNN | Standard deviation of RR-intervals over 1-minute recording [35] | |
| coverage | Segment length of valid ECG tracing (cf. Section 3.2.1) | |
| eCDF consistency | Mean value of eCDF correlation coefficient [36] | |
| Signal consistency | DTW Distance between first half and second half of ECG recording [37] | |
| Frequency-domain Features | FFT consistency | Mean value of FFT correlation coefficient |
| basSQI | Signal quality index (SQI) for ECG baseline wander according to [15] | |
| qrsSQI | SQI for QRS complex power according to [15] | |
| pliSQI | SQI for power-line interference according to [38] | |
| SNR | Signal-to-noise ratio according to [38] | |
| mean SQI | Mean SQI: (basSQI + qrsSQI + pliSQI)/3 [38] | |
| Morphology-related Features | mean R-peak amplitude | Average R-peak amplitude from peak detection |
| mean template STD | Average standard deviation from mean morphology | |
| Euclidean distance | Euclidean distance between mean morphology and optimal signal prototype | |
| Cityblock distance | One-norm between mean morphology and optimal signal prototype [39] | |
| DTW distance | DTW distance between mean morphology and optimal signal prototype [37] | |
| Correlation Coefficient | Correlation coefficient between mean morphology and optimal signal prototype |
3.3. Regression Training
4. Results
| Phase | Kernel | RMSE [1] | MAE [1] | Pearson’s [1] | BA [%] |
|---|---|---|---|---|---|
| Training/ Validation | quadratic | 0.45952 | 0.34478 | 0.62269 | 96.37 |
| Matern 5/2 | 0.46884 | 0.34977 | 0.60161 | 95.12 | |
| exponential | 0.39621 | 0.29826 | 0.75242 | 98.01 | |
| Test | quadratic | 0.46909 | 0.35435 | 0.60126 | 94.74 |
| Matern 5/2 | 0.47092 | 0.35226 | 0.59710 | 93.73 | |
| exponential | 0.46800 | 0.35582 | 0.60365 | 94.99 |


| Variable | Pearson’s [1] (p-Value [1]) |
|---|---|
| Expert rating | 0.2717 () |
| AISQA | 0.3664 () |


5. Discussion
6. Conclusions
Author Contributions
Funding
Institutional Review Board Statement
Informed Consent Statement
Data Availability Statement
Acknowledgments
Conflicts of Interest
References
- Alan, S.G.; Hylek, E.M.; Phillips, K.A.; Chang, Y.; Henault, L.E.; Selby, J.V.; Singer, D.E. Prevalence of Diagnosed Atrial Fibrillation in Adults. JAMA 2001, 285, 2370. [Google Scholar] [CrossRef]
- Wilke, T.; Groth, A.; Mueller, S.; Pfannkuche, M.; Verheyen, F.; Linder, R.; Maywald, U.; Bauersachs, R.; Breithardt, G. Incidence and prevalence of atrial fibrillation: An analysis based on 8.3 million patients. Europace 2012, 15, 486–493. [Google Scholar] [CrossRef] [PubMed]
- Heeringa, J.; Kuip, D.A.M.; Hofman, A.; Kors, J.A.; van Herpen, G.; Stricker, B.H.C.; Stijnen, T.; Lip, G.Y.H.; Witteman, J.C.M. Prevalence, incidence and lifetime risk of atrial fibrillation: The Rotterdam study. Eur. Heart J. 2006, 27, 949–953. [Google Scholar] [CrossRef] [PubMed]
- Wolf, P.A.; Dawber, T.R.; Thomas, H.E.; Kannel, W.B. Epidemiologic assessment of chronic atrial fibrillation and risk of stroke: The fiamingham Study. Neurology 1978, 28, 973. [Google Scholar] [CrossRef]
- Krahn, A.D.; Manfreda, J.; Tate, R.B.; Mathewson, F.A.L.; Cuddy, T.E. The natural history of atrial fibrillation: Incidence, risk factors, and prognosis in the manitoba follow-up study. Am. J. Med. 1995, 98, 476–484. [Google Scholar] [CrossRef]
- Kim, D.; Yang, P.; Yu, H.T.; Kim, T.; Jang, E.; Sung, J.; Pak, H.; Lee, M.; Lee, M.; Lip, G.Y.H.; et al. Risk of dementia in stroke-free patients diagnosed with atrial fibrillation: Data from a population-based cohort. Eur. Heart J. 2019, 40, 2313–2323. [Google Scholar] [CrossRef]
- Hindricks, G.; Potpara, T.; Dagres, N.; Arbelo, E.; Bax, J.J.; Blomström-Lundqvist, C.; Boriani, G.; Castella, M.; Dan, G.A.; Dilaveris, P.E.; et al. 2020 ESC Guidelines for the diagnosis and management of atrial fibrillation developed in collaboration with the European Association for Cardio-Thoracic Surgery (EACTS): The Task Force for the diagnosis and management of atrial fibrillation of the European Society of Cardiology (ESC) Developed with the special contribution of the European Heart Rhythm Association (EHRA) of the ESC. Eur. Heart J. 2020, 42, 373–498. [Google Scholar] [CrossRef]
- Turakhia, M.P.; Ullal, A.J.; Hoang, D.D.; Than, C.T.; Miller, J.D.; Friday, K.J.; Perez, M.V.; Freeman, J.V.; Wang, P.J.; Heidenreich, P.A. Feasibility of Extended Ambulatory Electrocardiogram Monitoring to Identify Silent Atrial Fibrillation in High-risk Patients: The Screening Study for Undiagnosed Atrial Fibrillation (STUDY-AF). Clin. Cardiol. 2015, 38, 285–292. [Google Scholar] [CrossRef]
- Benjamin, E.J.; Chen, P.; Bild, D.E.; Mascette, A.M.; Albert, C.M.; Alonso, A.; Calkins, H.; Connolly, S.J.; Curtis, A.B.; Darbar, D.; et al. Prevention of Atrial Fibrillation. Circulation 2009, 119, 606–618. [Google Scholar] [CrossRef]
- Zungsontiporn, N.; Link, M.S. Newer technologies for detection of atrial fibrillation. BMJ Clin. Res. Ed. 2018, 363, k3946. [Google Scholar] [CrossRef]
- Hermans, A.N.L.; Gawalko, M.; Dohmen, L.; van der Velden, R.M.J.; Betz, K.; Duncker, D.; Verhaert, D.V.M.; Heidbuchel, H.; Svennberg, E.; Neubeck, L.; et al. Mobile health solutions for atrial fibrillation detection and management: A systematic review. Clin. Res. Cardiol. Off. J. Ger. Card. Soc. 2022, 111, 479–491. [Google Scholar] [CrossRef]
- Belani, S.; Wahood, W.; Hardigan, P.; Placzek, A.N.; Ely, S. Accuracy of Detecting Atrial Fibrillation: A Systematic Review and Meta-Analysis of Wrist-Worn Wearable Technology. Cureus 2021, 13, e20362. [Google Scholar] [CrossRef]
- Kalarus, Z.; Mairesse, G.H.; Sokal, A.; Boriani, G.; Średniawa, B.; Casado-Arroyo, R.; Wachter, R.; Frommeyer, G.; Traykov, V.; Dagres, N.; et al. Searching for atrial fibrillation: Looking harder, looking longer, and in increasingly sophisticated ways. An EHRA position paper. EP Eur. 2023, 25, 185–198. [Google Scholar] [CrossRef]
- Albulbul, A. Evaluating Major Electrode Types for Idle Biological Signal Measurements for Modern Medical Technology. Bioengineering 2016, 3, 20. [Google Scholar] [CrossRef]
- Clifford, G.D.; Behar, J.; Li, Q.; Rezek, I. Signal quality indices and data fusion for determining clinical acceptability of electrocardiograms. Physiol. Meas. 2012, 33, 1419–1433. [Google Scholar] [CrossRef]
- Antink, C.H.; Schulz, F.; Leonhardt, S.; Walter, M. Motion Artifact Quantification and Sensor Fusion for Unobtrusive Health Monitoring. Sensors 2017, 18, 38. [Google Scholar] [CrossRef]
- Rizwan, A.; Zoha, A.; Mabrouk, I.; Sabbour, H.; Al-Sumaiti, A.; Alomaniy, A.; Imran, M.; Abbasi, Q. A Review on the State of the Art in Atrial Fibrillation Detection Enabled by Machine Learning. IEEE Rev. Biomed. Eng. 2020, 14, 219–239. [Google Scholar] [CrossRef]
- Zink, M.D.; Napp, A.; Gramlich, M. Experience in screening for atrial fibrillation and monitoring arrhythmia using a single-lead ECG stick. Herzschrittmachertherapie Elektrophysiologie 2020, 31, 246–253. [Google Scholar] [CrossRef]
- Hayn, D.; Jammerbund, B.; Schreier, G. QRS detection based ECG quality assessment. Physiol. Meas. 2012, 33, 1449–1461. [Google Scholar] [CrossRef]
- Li, L. A Quality Assessment Method of Single-Lead ECG Signal Based on Spectral Analysis. In Proceedings of the 2016 8th International Conference on Information Technology in Medicine and Education (ITME), Fuzhou, China, 23–25 December 2016; pp. 35–38. [Google Scholar] [CrossRef]
- Zhang, Y.; Zhao, Z. Evaluation of single-lead ECG signal quality with different states of motion. In Proceedings of the 2017 10th International Congress on Image and Signal Processing, BioMedical Engineering and Informatics (CISP-BMEI), Huaqiao, China, 14–16 October 2017; pp. 1–7. [Google Scholar] [CrossRef]
- Prasitlumkum, N.; Cheungpasitporn, W.; Chokesuwattanaskul, A.; Thangjui, S.; Thongprayoon, C.; Bathini, T.; Vallabhajosyula, S.; Kanitsoraphan, C.; Leesutipornchai, T.; Chokesuwattanaskul, R. Diagnostic accuracy of smart gadgets/wearable devices in detecting atrial fibrillation: A systematic review and meta-analysis. Arch. Cardiovasc. Dis. 2021, 114, 4–16. [Google Scholar] [CrossRef]
- Zink, M.D.; Mischke, K.G.; Keszei, A.P.; Rummey, C.; Freedman, B.; Neumann, G.; Tolksdorf, A.; Frank, F.; Wienströer, J.; Kuth, N.; et al. Screen-detected atrial fibrillation predicts mortality in elderly subjects. Europace 2021, 23, 29–38. [Google Scholar] [CrossRef] [PubMed]
- Pereira, T.; Tran, N.; Gadhoumi, K.; Pelter, M.M.; Do, D.H.; Lee, R.J.; Colorado, R.; Meisel, K.; Hu, X. Photoplethysmography based atrial fibrillation detection: A review. npj Digit. Med. 2020, 3, 3. [Google Scholar] [CrossRef] [PubMed]
- Chi, Y.M.; Jung, T.P.; Cauwenberghs, G. Dry-contact and noncontact biopotential electrodes: Methodological review. IEEE Rev. Biomed. Eng. 2010, 3, 106–119. [Google Scholar] [CrossRef] [PubMed]
- Goyal, K.; Borkholder, D.A.; Day, S.W. Dependence of Skin-Electrode Contact Impedance on Material and Skin Hydration. Sensors 2022, 22, 8510. [Google Scholar] [CrossRef] [PubMed]
- Gabriel, S.; Lau, R.W.; Gabriel, C. The dielectric properties of biological tissues: III. Parametric models for the dielectric spectrum of tissues. Phys. Med. Biol. 1996, 41, 2271–2293. [Google Scholar] [CrossRef]
- Yamamoto, T.; Yamamoto, Y. Dielectric constant and resistivity of epidermal stratum corneum. Med. Biol. Eng. 1976, 14, 494–500. [Google Scholar] [CrossRef]
- Li, X.; Johnson, R.; Weinstein, B.; Wilder, E.; Smith, E.; Kasting, G.B. Dynamics of water transport and swelling in human stratum corneum. Chem. Eng. Sci. 2015, 138, 164–172. [Google Scholar] [CrossRef]
- Fruhstorfer, H.; Abel, U.; Garthe, C.D.; Knttel, A. Thickness of the stratum corneum of the volar fingertips. Clin. Anat. 2000, 13, 429–433. [Google Scholar] [CrossRef]
- Hoog Antink, C.; Leonhardt, S.; Walter, M. A synthesizer framework for multimodal cardiorespiratory signals. Biomed. Phys. Eng. Express 2017, 3, 035028. [Google Scholar] [CrossRef]
- Wartzek, T.; Czaplik, M.; Antink, C.H.; Eilebrecht, B.; Walocha, R.; Leonhardt, S. UnoViS: The MedIT public unobtrusive vital signs database. Health Inf. Sci. Syst. 2015, 3, 2. [Google Scholar] [CrossRef]
- Pan, J.; Tompkins, W.J. A real-time QRS detection algorithm. IEEE Trans. Bio-Med. Eng. 1985, 32, 230–236. [Google Scholar] [CrossRef]
- Lueken, M.; ten Kate, W.; Valenti, G.; Batista, J.P.; Bollheimer, C.; Leonhardt, S.; Ngo, C. Estimation of Stride Time Variability in Unobtrusive Long-Term Monitoring Using Inertial Measurement Sensors. IEEE J. Biomed. Health Inform. 2020, 24, 1879–1886. [Google Scholar] [CrossRef]
- Heart rate variability: Standards of measurement, physiological interpretation, and clinical use. Task Force of the European Society of Cardiology and the North American Society of Pacing and Electrophysiology. Eur. Heart J. 1996, 17, 354–381.
- van der Vaart, A.W. Asymptotic Statistics, 8th ed.; Cambridge Series on Statistical and Probabilistic Mathematics; Cambridge University Press: Cambridge, UK; New York, NY, USA, 1998; Volume 3. [Google Scholar] [CrossRef]
- Müller, M. (Ed.) Dynamic Time Warping. In Information Retrieval for Music and Motion; Springer: Berlin/Heidelberg, Germany, 2007; pp. 69–84. [Google Scholar] [CrossRef]
- Uguz, D.U.; Dettori, R.; Napp, A.; Walter, M.; Marx, N.; Leonhardt, S.; Hoog Antink, C. Car Seats with Capacitive ECG Electrodes Can Detect Cardiac Pacemaker Spikes. Sensors 2020, 20, 6288. [Google Scholar] [CrossRef]
- Minkowski, H. Geometrie der Zahlen; Teubner: Leipzig, Germany; Berlin, Germany, 1910. [Google Scholar]
Disclaimer/Publisher’s Note: The statements, opinions and data contained in all publications are solely those of the individual author(s) and contributor(s) and not of MDPI and/or the editor(s). MDPI and/or the editor(s) disclaim responsibility for any injury to people or property resulting from any ideas, methods, instructions or products referred to in the content. |
© 2023 by the authors. Licensee MDPI, Basel, Switzerland. This article is an open access article distributed under the terms and conditions of the Creative Commons Attribution (CC BY) license (https://creativecommons.org/licenses/by/4.0/).
Share and Cite
Lueken, M.; Gramlich, M.; Leonhardt, S.; Marx, N.; Zink, M.D. Automated Signal Quality Assessment of Single-Lead ECG Recordings for Early Detection of Silent Atrial Fibrillation. Sensors 2023, 23, 5618. https://doi.org/10.3390/s23125618
Lueken M, Gramlich M, Leonhardt S, Marx N, Zink MD. Automated Signal Quality Assessment of Single-Lead ECG Recordings for Early Detection of Silent Atrial Fibrillation. Sensors. 2023; 23(12):5618. https://doi.org/10.3390/s23125618
Chicago/Turabian StyleLueken, Markus, Michael Gramlich, Steffen Leonhardt, Nikolaus Marx, and Matthias D. Zink. 2023. "Automated Signal Quality Assessment of Single-Lead ECG Recordings for Early Detection of Silent Atrial Fibrillation" Sensors 23, no. 12: 5618. https://doi.org/10.3390/s23125618
APA StyleLueken, M., Gramlich, M., Leonhardt, S., Marx, N., & Zink, M. D. (2023). Automated Signal Quality Assessment of Single-Lead ECG Recordings for Early Detection of Silent Atrial Fibrillation. Sensors, 23(12), 5618. https://doi.org/10.3390/s23125618