

Deep Learning-Based ADHD and ADHD-RISK Classification Technology through the Recognition of Children’s Abnormal Behaviors during the Robot-Led ADHD Screening Game

 ,
,  ,
,  ,
,  ,
, 

Abstract
:1. Introduction
- In this paper, ADHD, ADHD–RISK, and Normal groups were screened with high accuracy using skeleton data and deep learning obtained through relatively simple measurements through interesting simple games in a child-friendly natural environment without expert intervention.
- Unlike previous studies, the ADHD–RISK class, which is not easy for clinicians to distinguish, was added, and high classification accuracy was obtained.
- ADHD, ADHD–RISK, and Normal groups were classified with high accuracy using only skeleton data, which was previously not used for ADHD classification.
- When classifying ADHD–RISK children through the channel attention layer, it was verified that classification becomes more helpful toward the later part of the game.
2. Materials and Methods
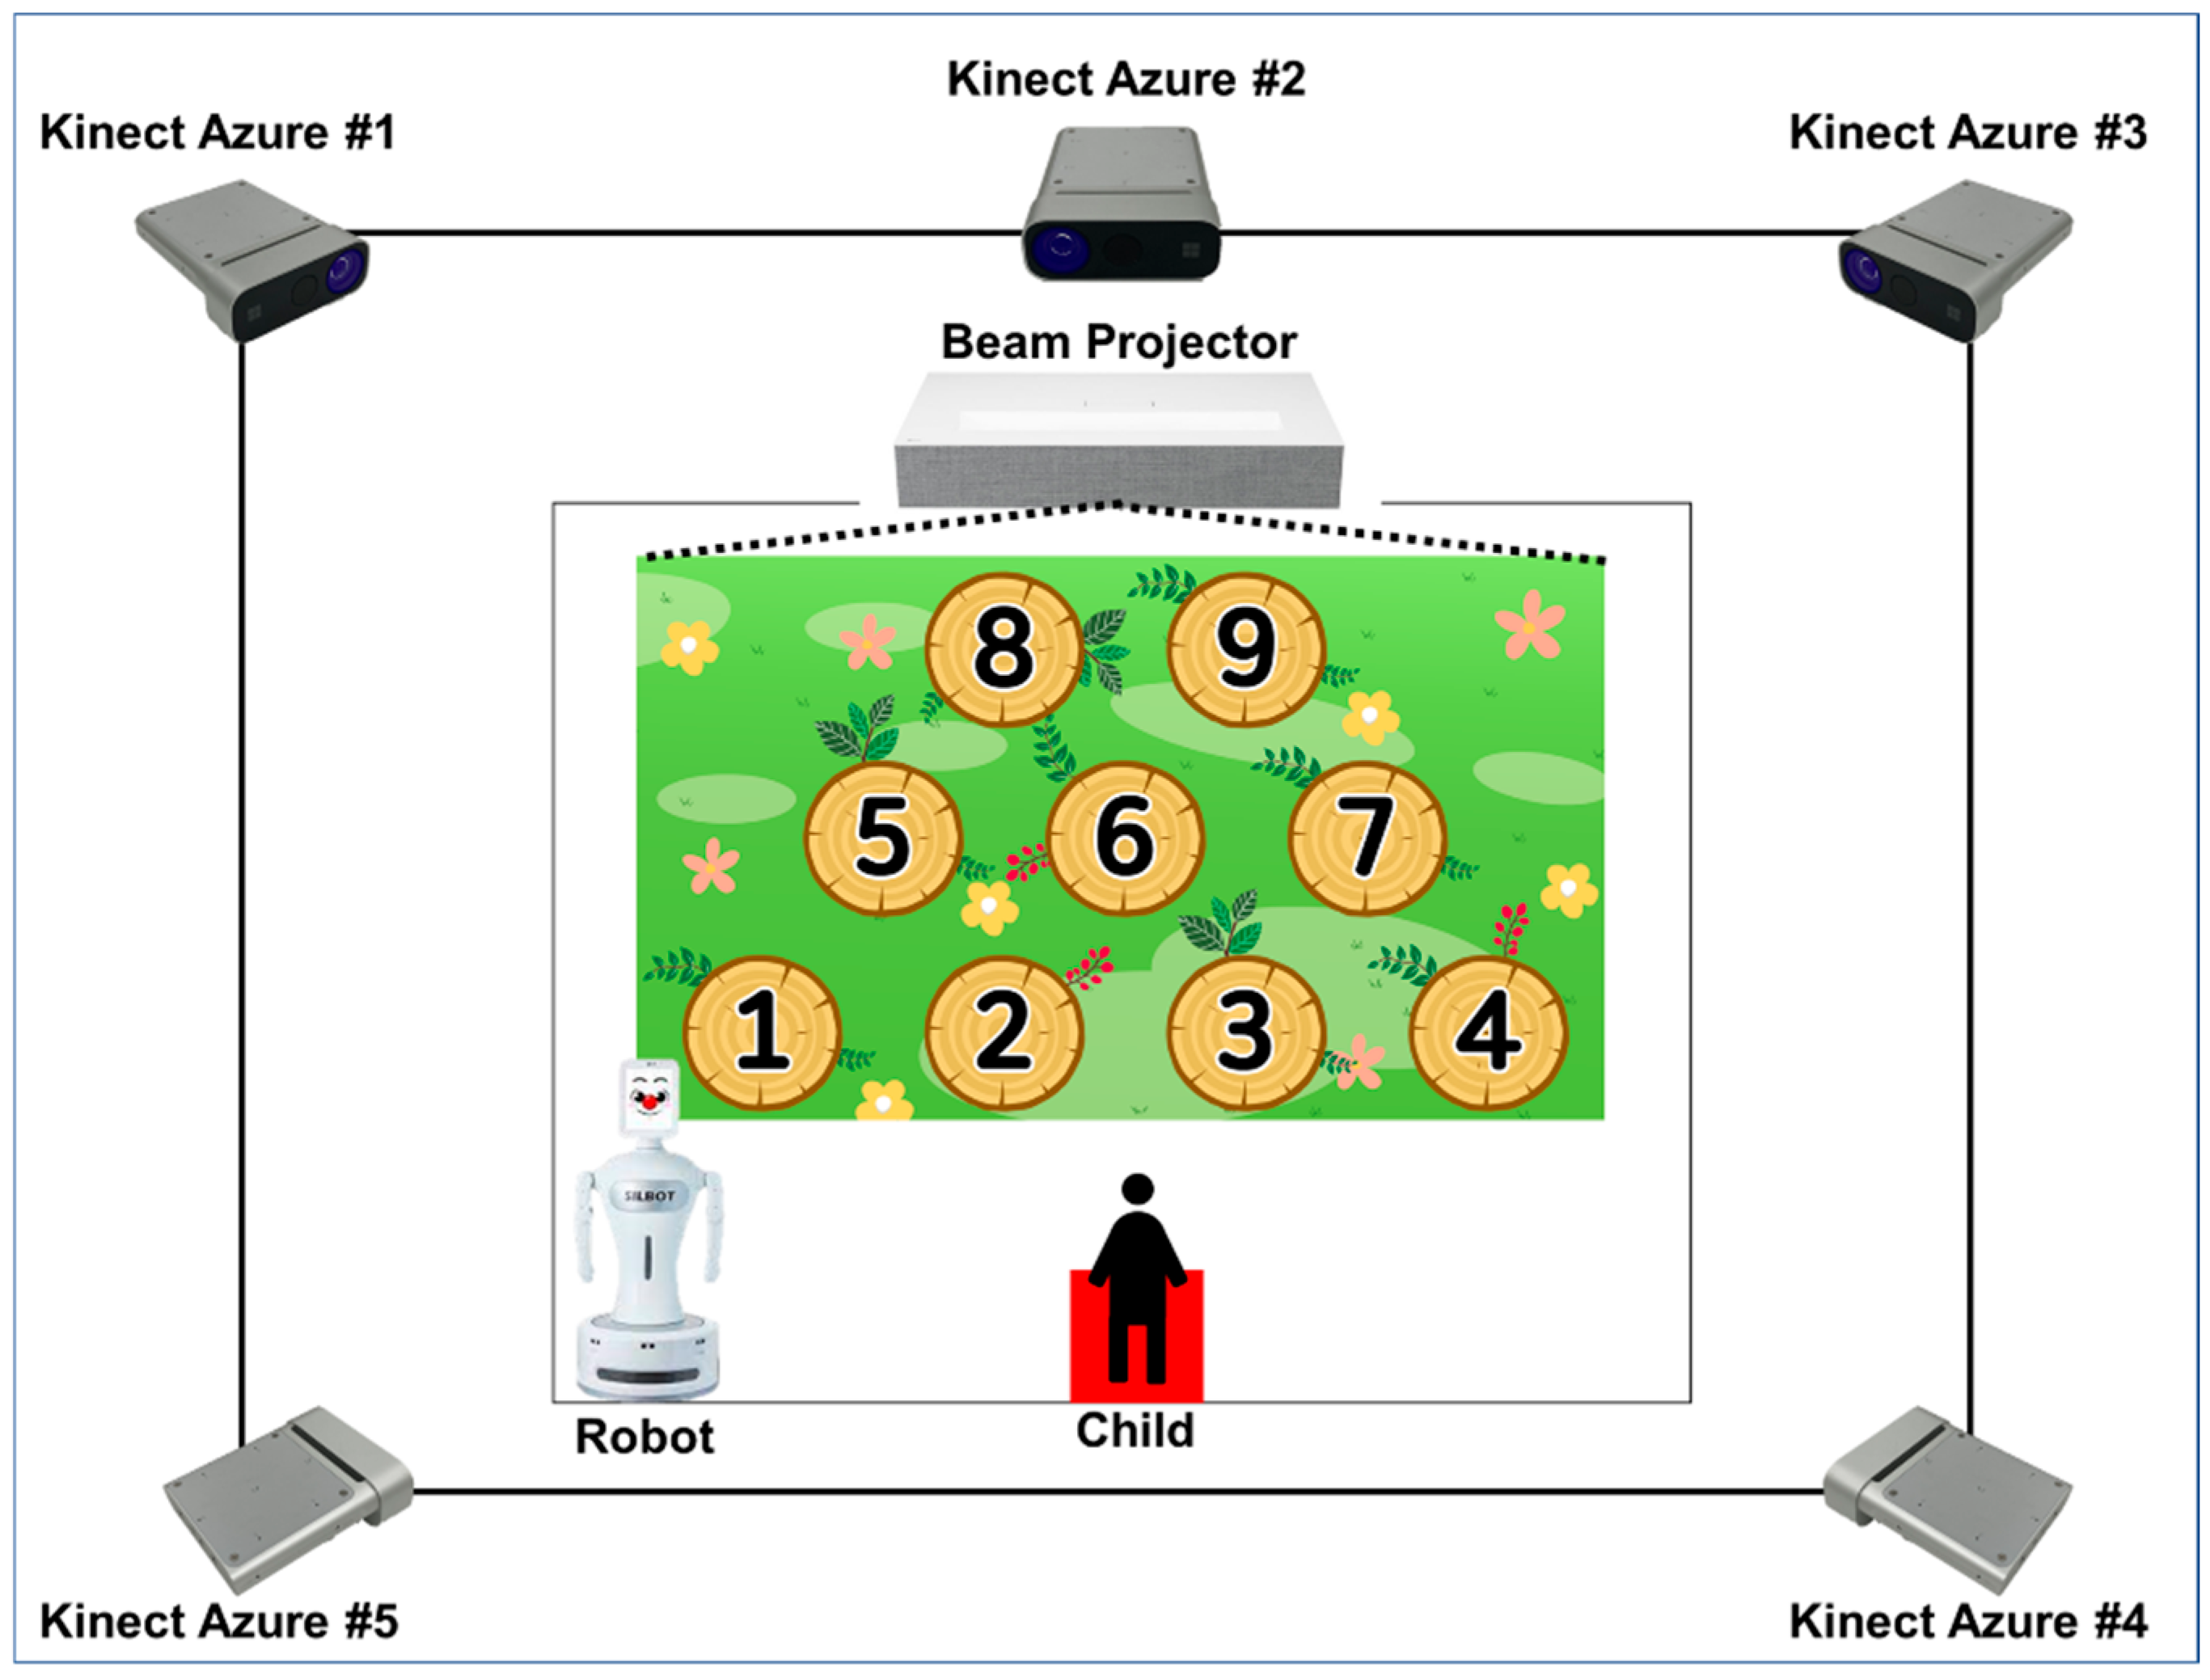
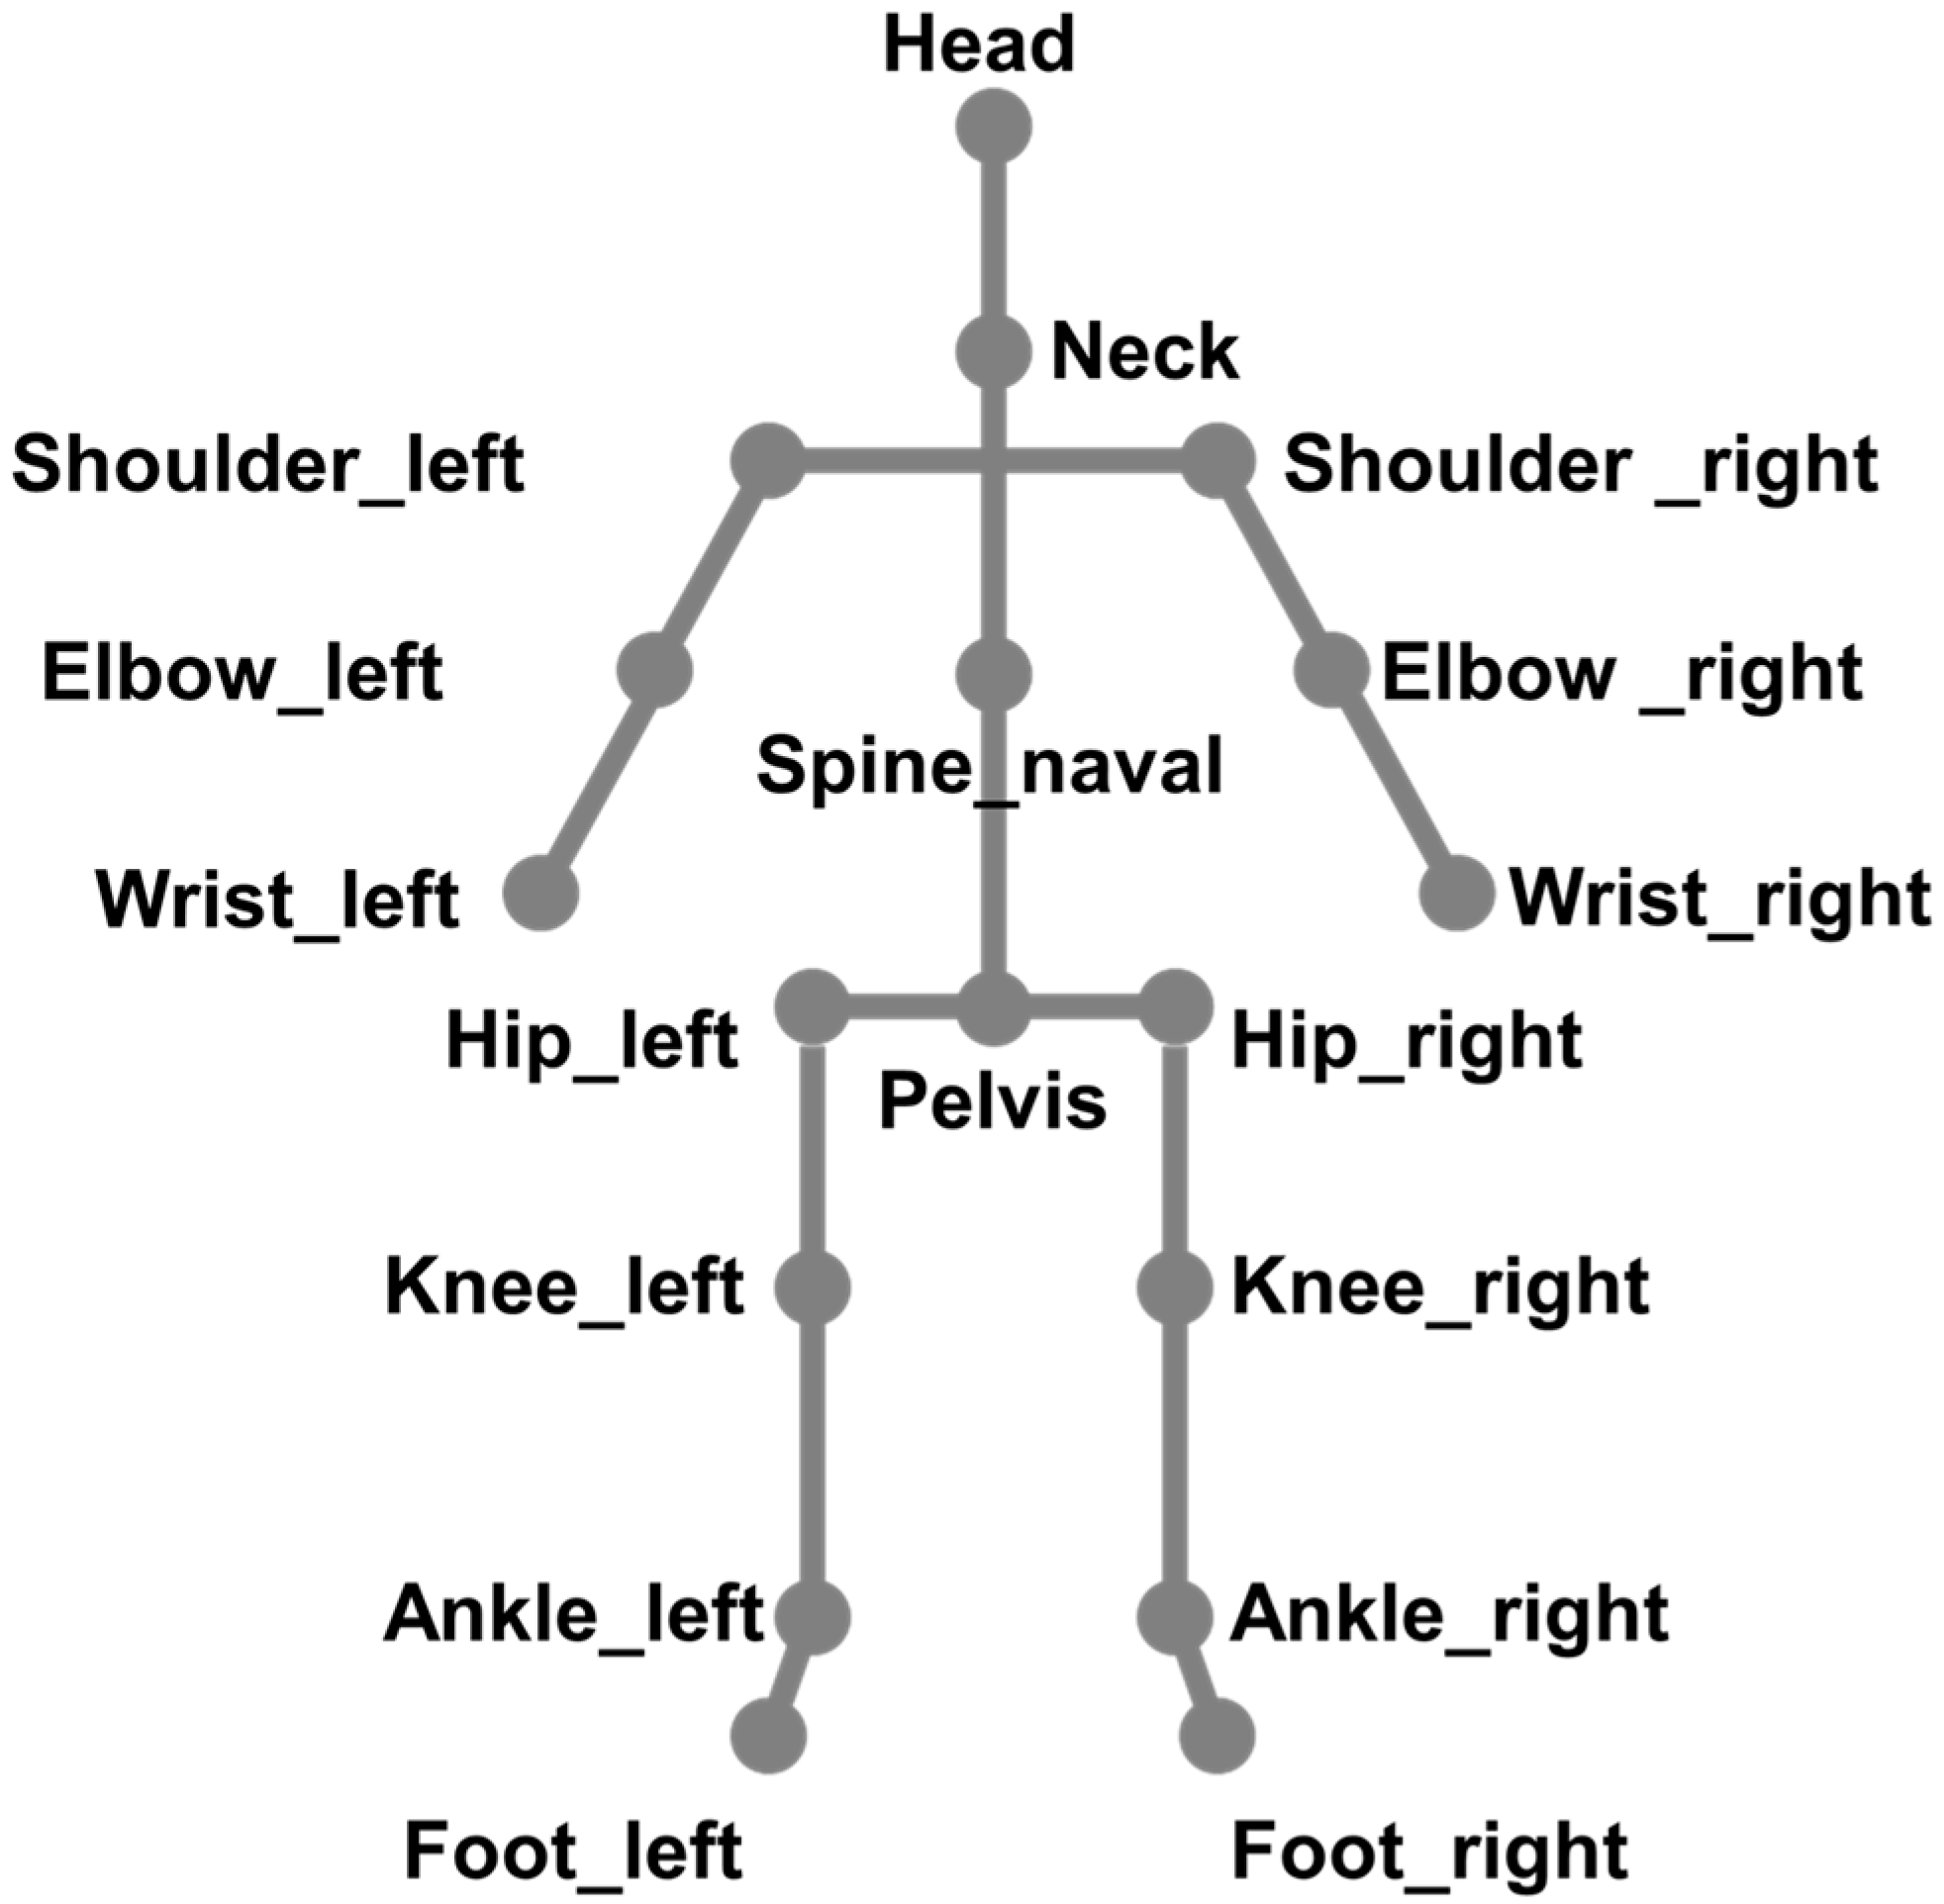
2.1. Skeleton Acquisition System Using Robot and Five Depth Sensors
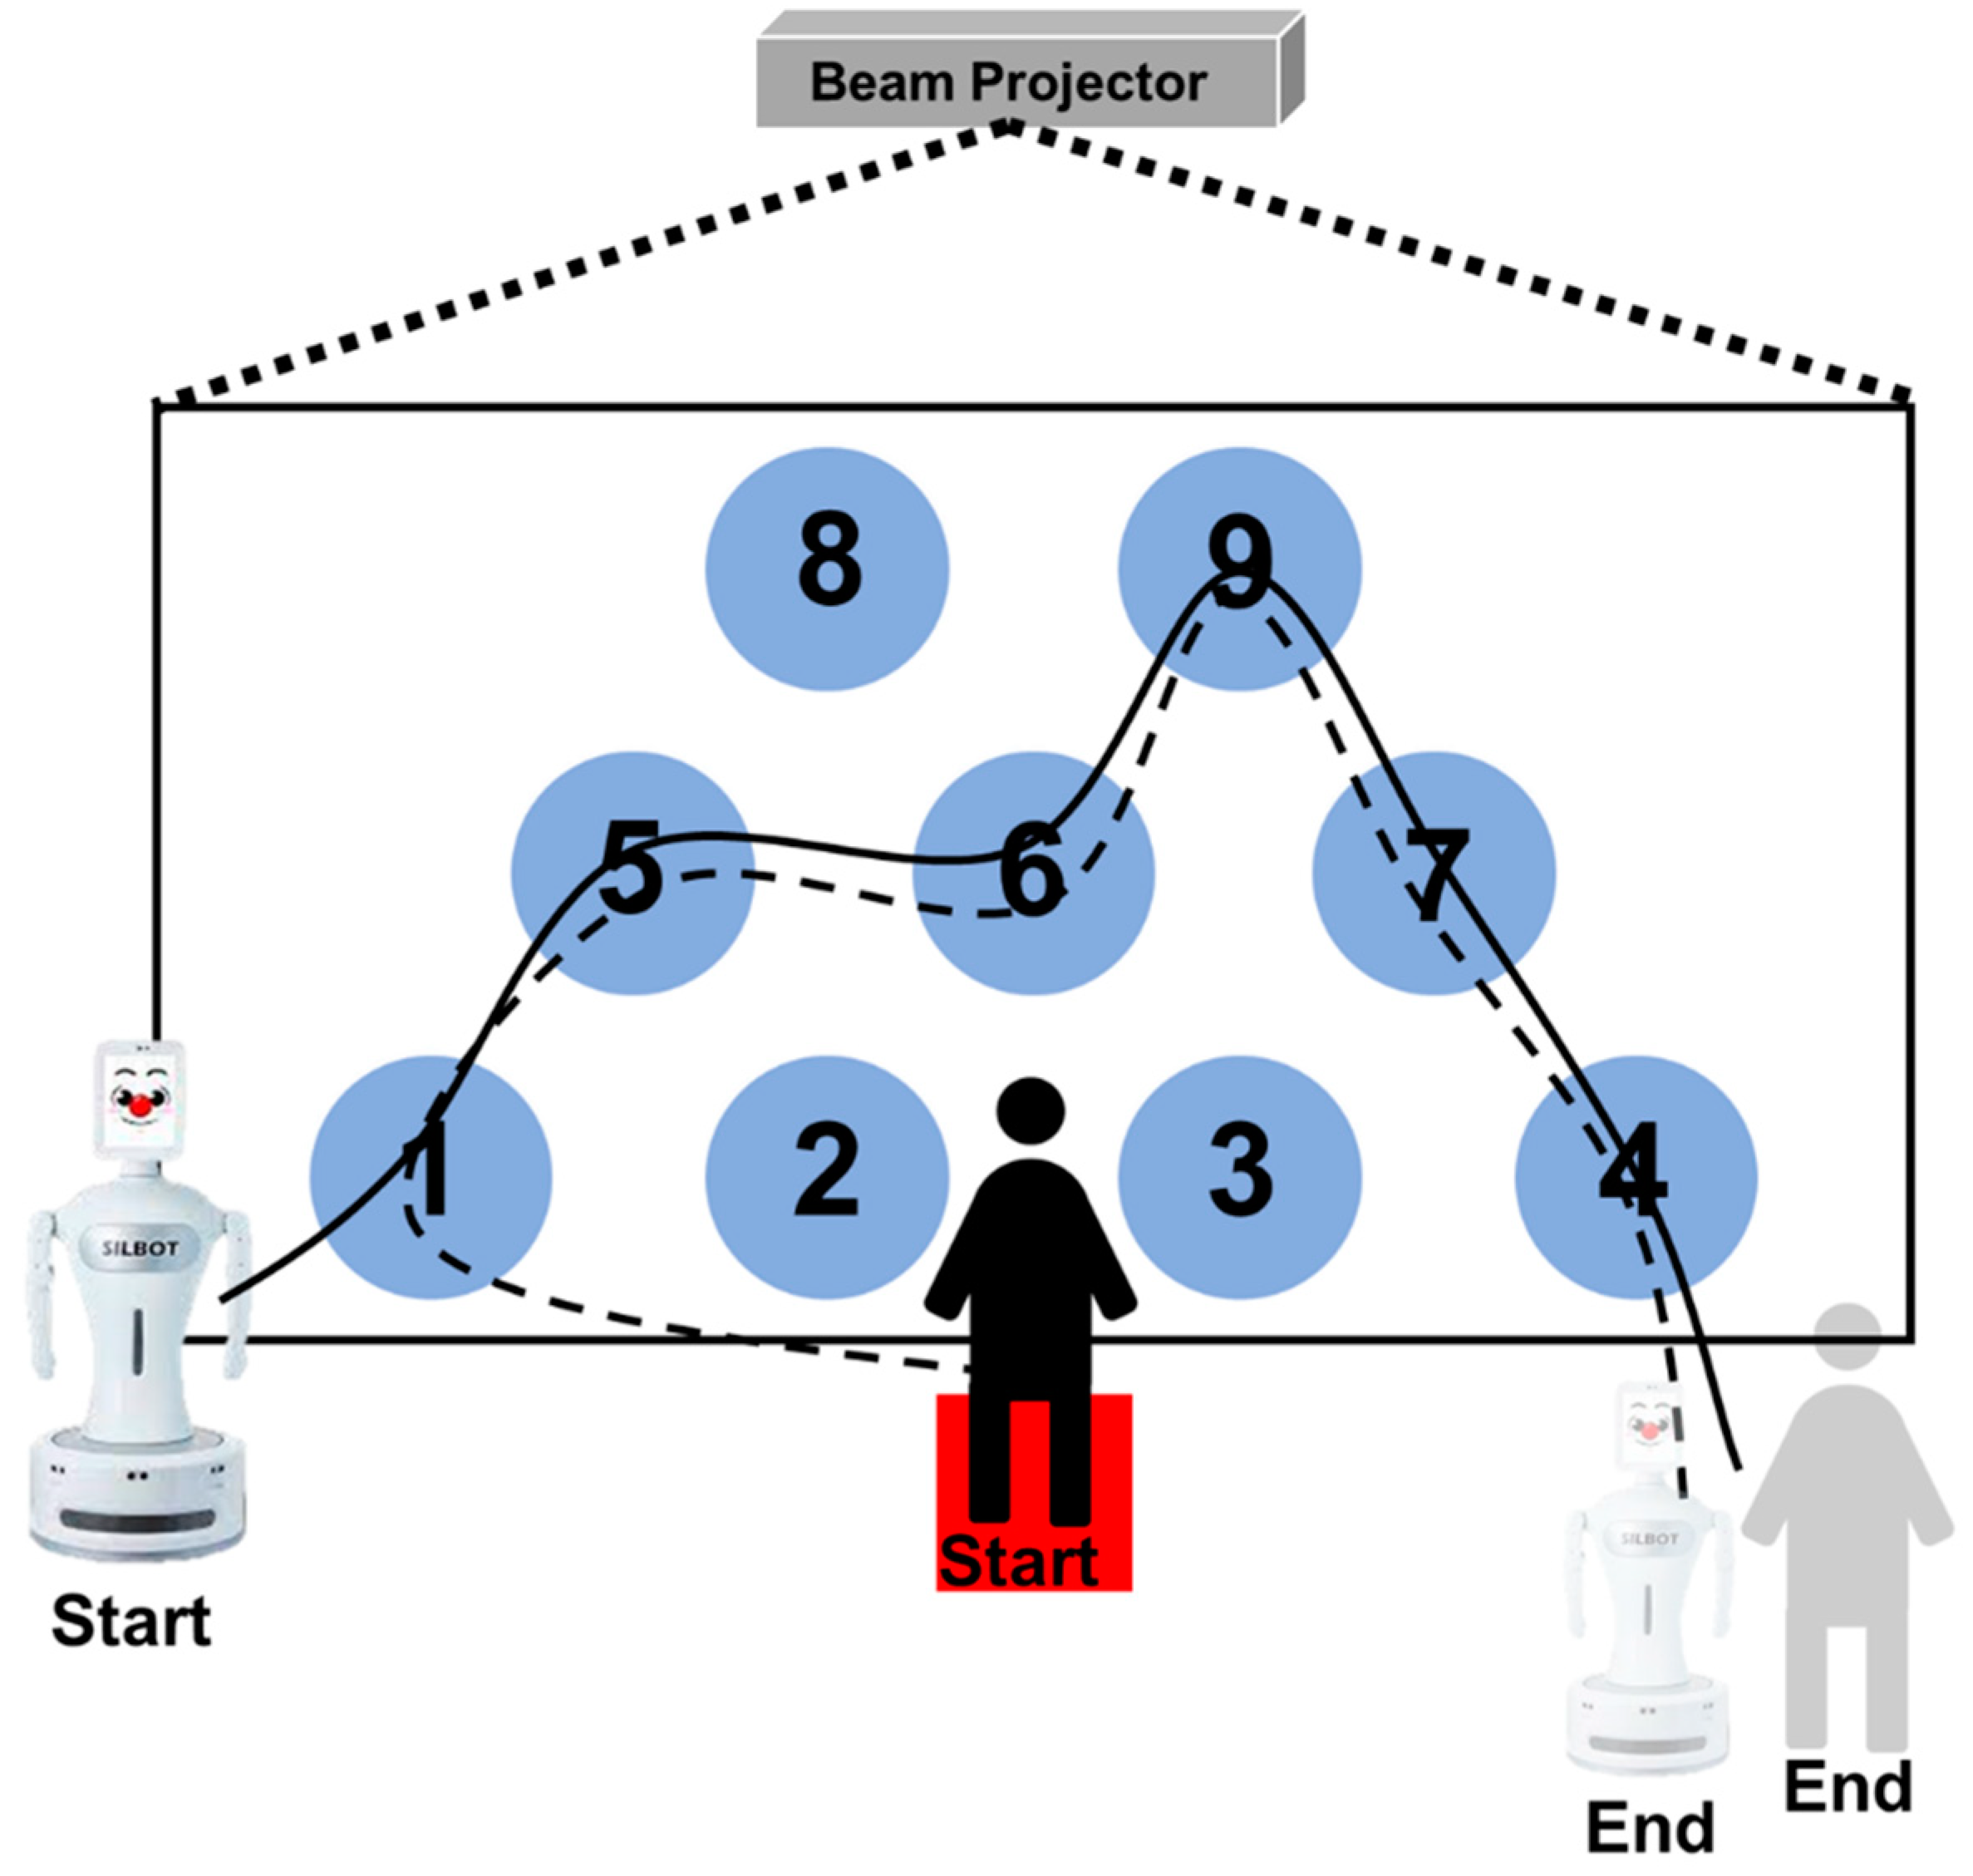
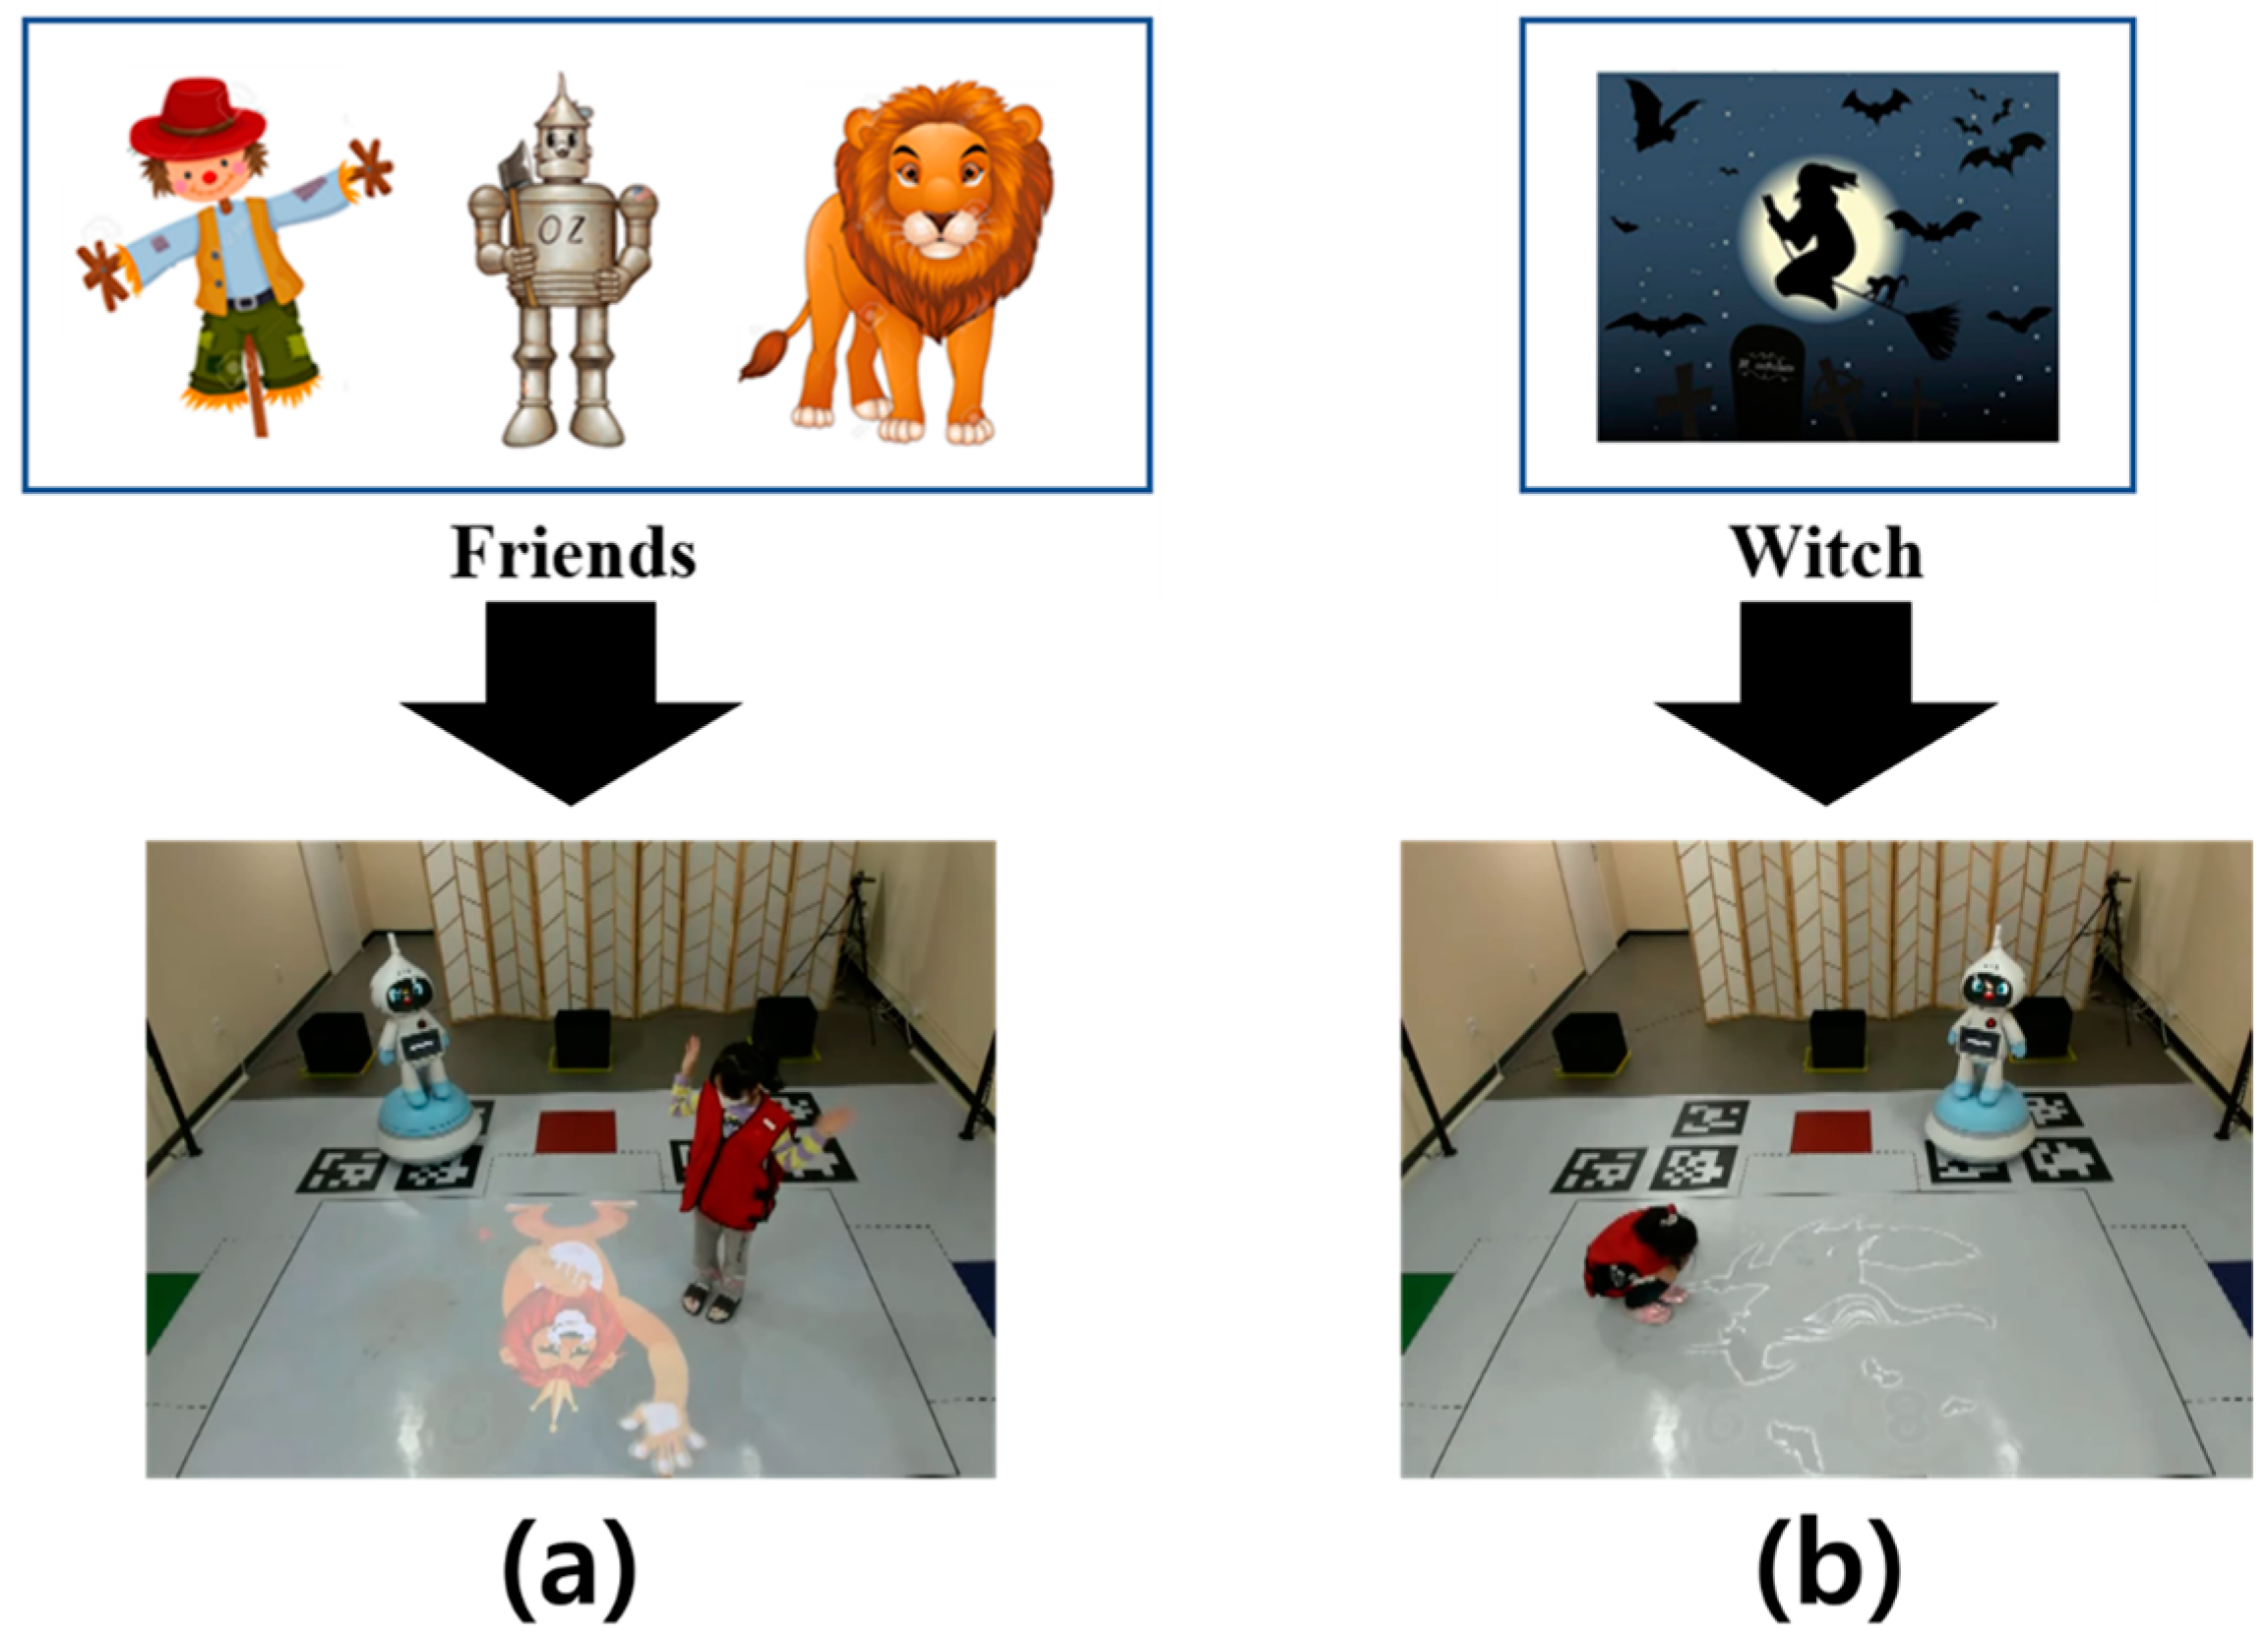
2.2. Robot-Led ADHD Screening Game for Children to Acquire Skeleton Data
2.3. Data Acquisition Participants and Data Acquisition Methods
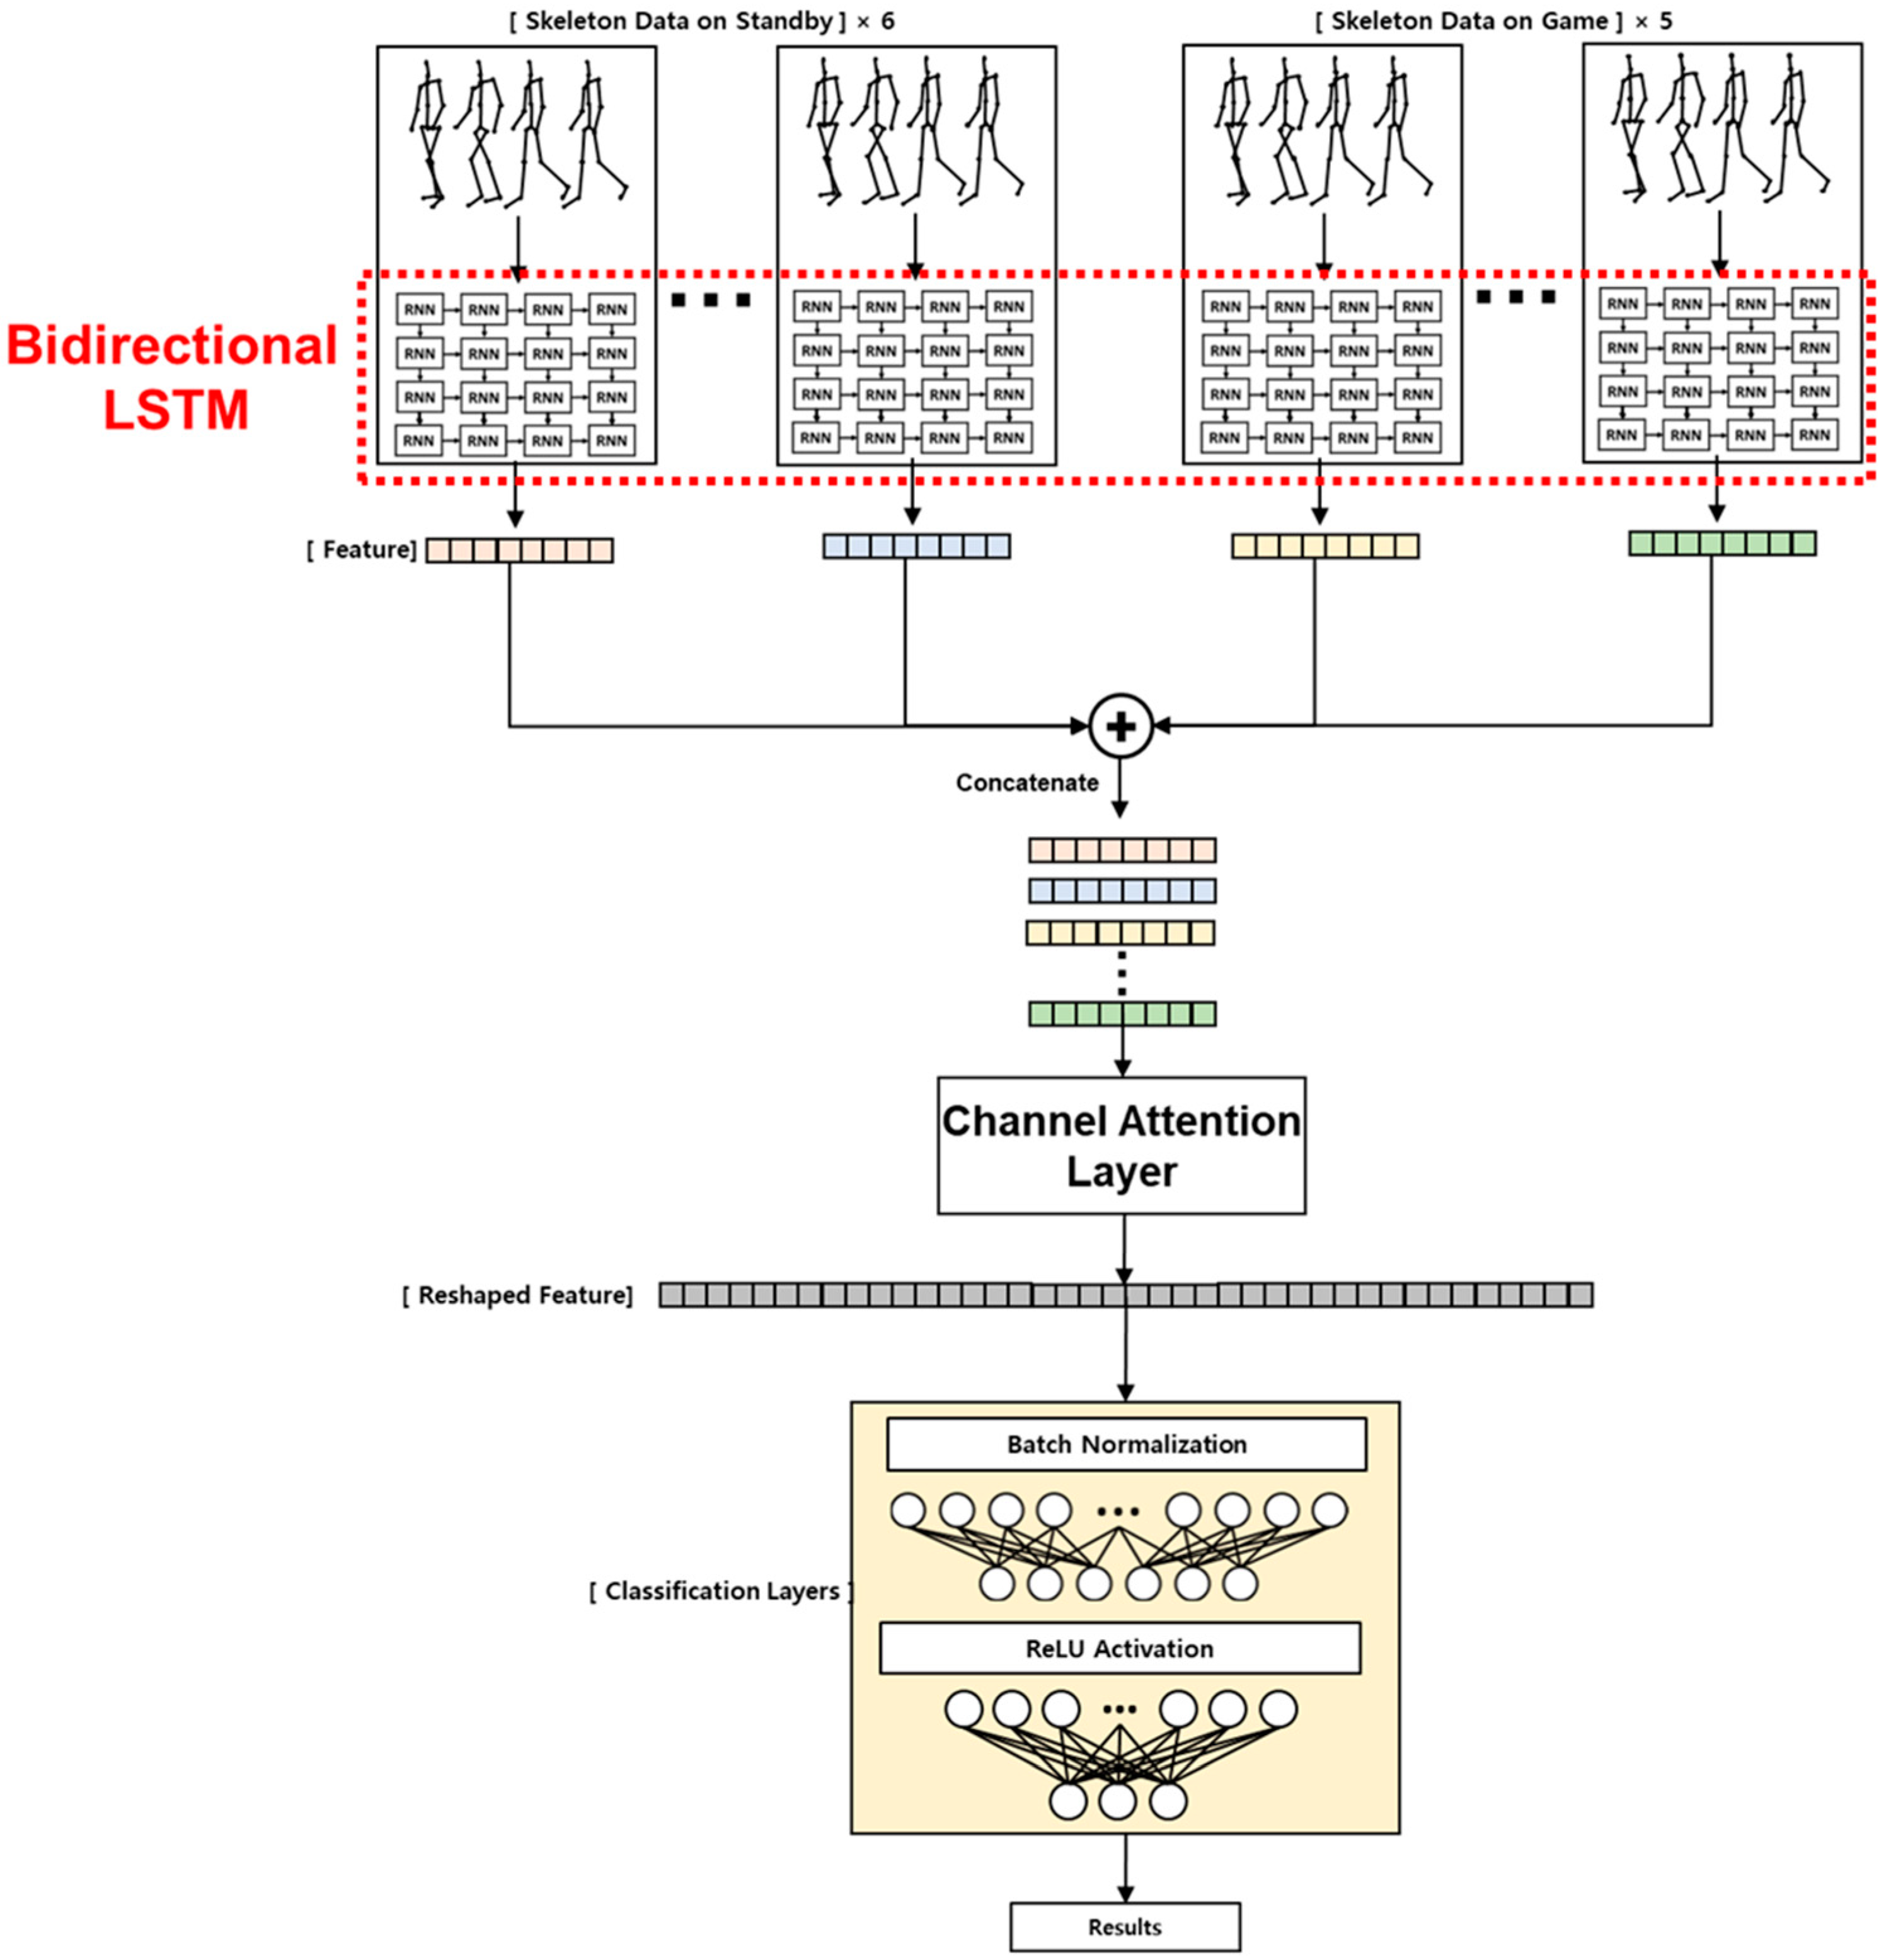
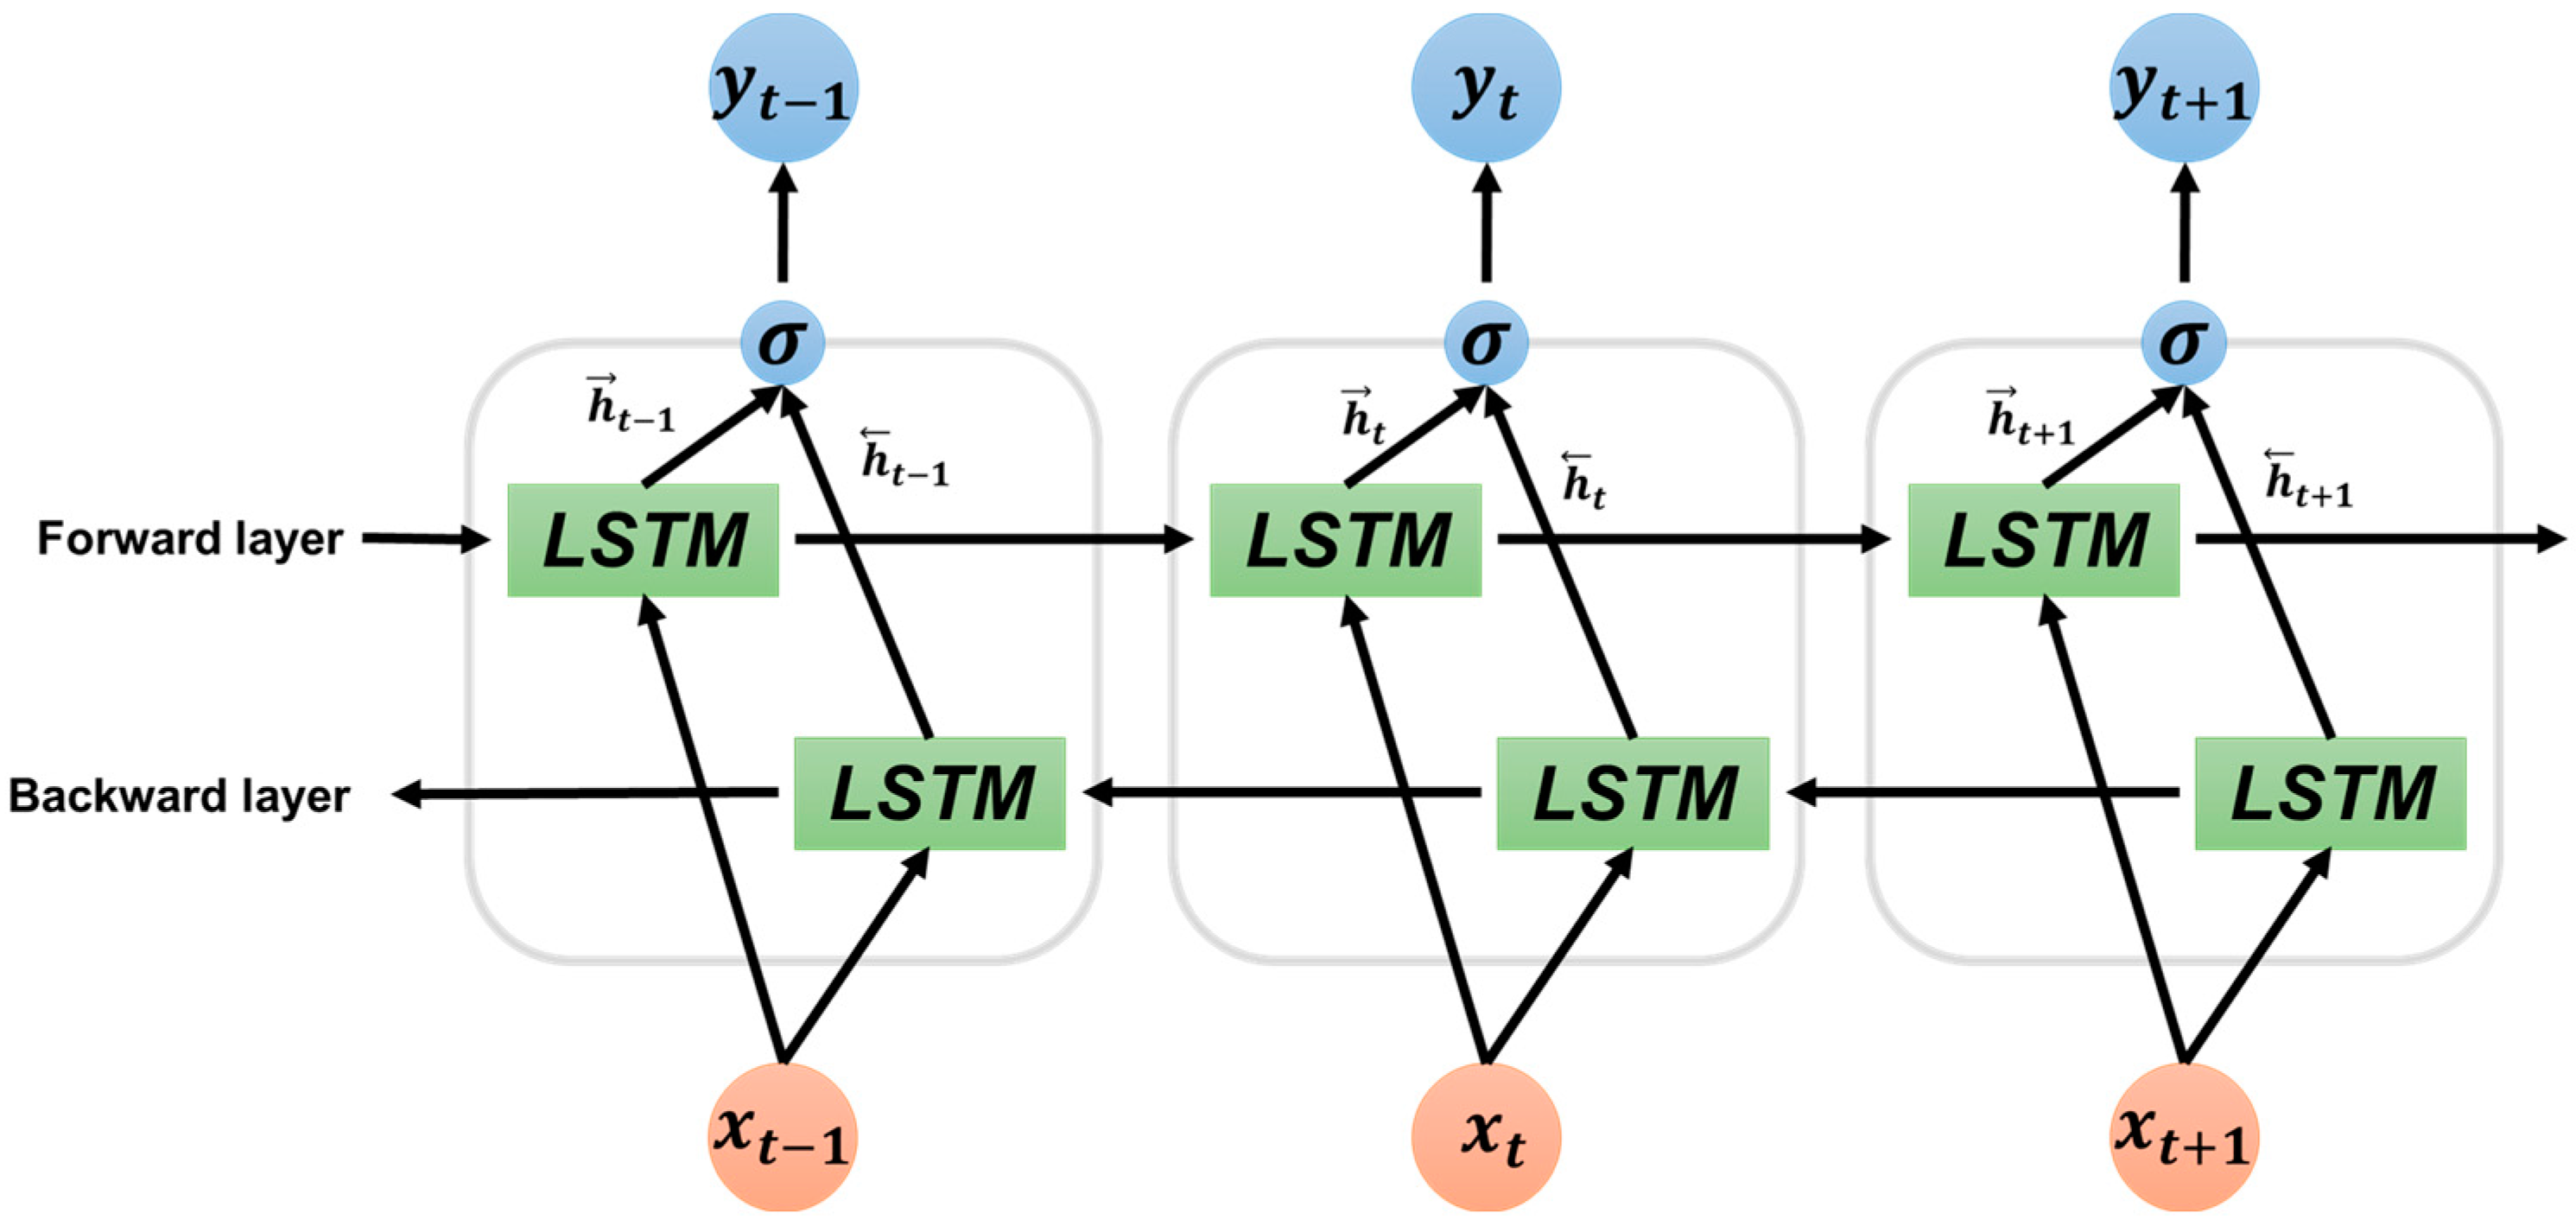
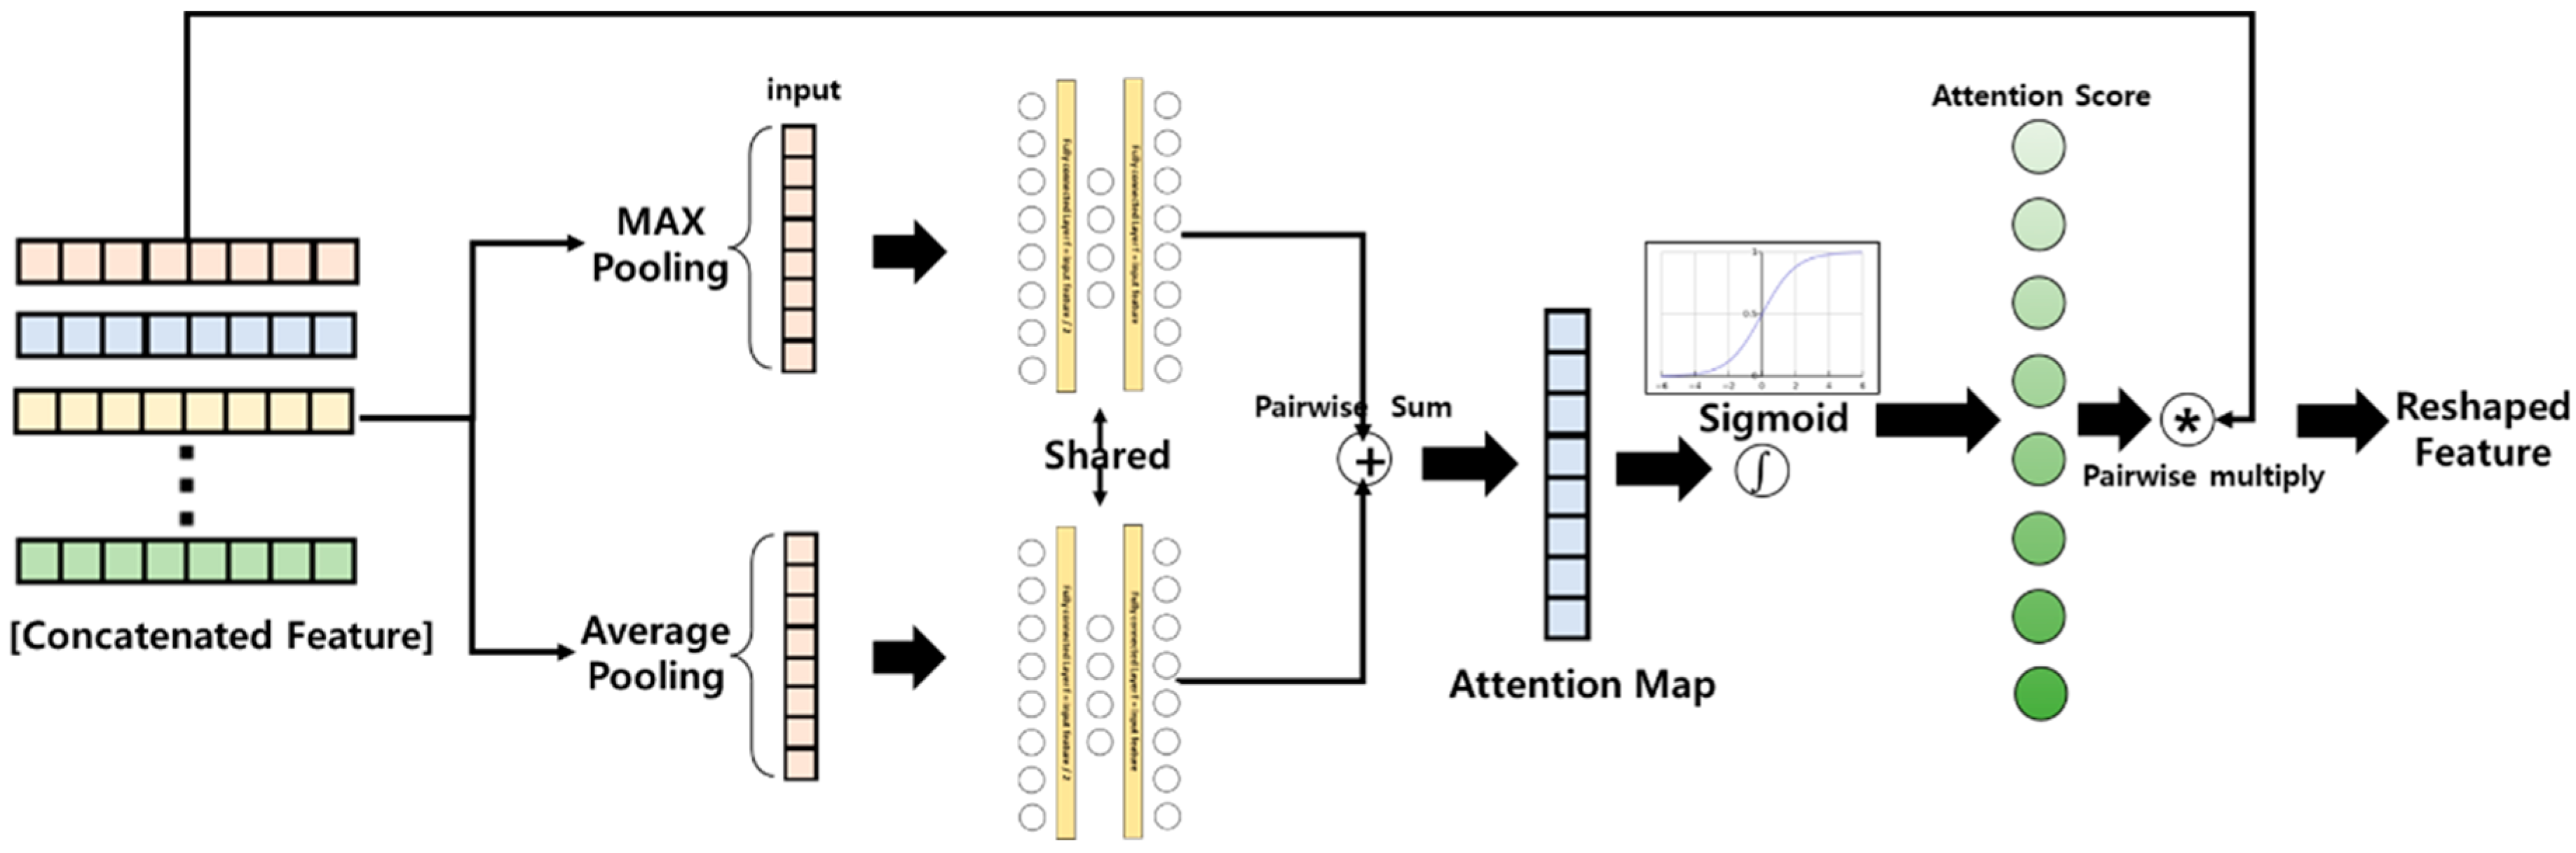
2.4. LSTM-Based Deep Learning Algorithm for Selective ADHD Screening Using Attention Layer
3. Results
4. Discussion
5. Conclusions
Author Contributions
Funding
Institutional Review Board Statement
Informed Consent Statement
Data Availability Statement
Conflicts of Interest
References
- Hoseini, B.L.; Ajilian, M.; Taghizade, M.H.; Khademi, G.; Saeidi, M. Attention Deficit Hyperactivity Disorder (ADHD) in Children: A Short Review and Literature. 2014. Available online: https://www.sid.ir/paper/337128/en (accessed on 30 November 2022.).
- Furman, L. What is attention-deficit hyperactivity disorder (ADHD)? J. Child Neurol. 2005, 20, 994–1002. [Google Scholar] [CrossRef] [PubMed]
- Rocco, I.; Corso, B.; Bonati, M.; Minicuci, N. Time of onset and/or diagnosis of ADHD in European children: A systematic review. BMC Psychiatry 2021, 21, 575. [Google Scholar] [CrossRef] [PubMed]
- Öztekin, I.; Finlayson, M.A.; Graziano, P.A.; Dick, A.S. Is there any incremental benefit to conducting neuroimaging and neurocognitive assessments in the diagnosis of ADHD in young children? A machine learning investigation. Dev. Cogn. Neurosci. 2021, 49, 100966. [Google Scholar] [CrossRef]
- Zikra Faiz, D.; Iqbal, T.; Azeem, A.; Siddique, M.; Warraich, W.Y. A Comparative Study between Online and Traditional Counseling for Students with Attention Deficit Hyperactivity Disorder (ADHD): School Psychologists Perspective in the Obsequies of Pandemic COVID-19. Linguist. Antverp. 2021, 3, 5763–5777. [Google Scholar]
- Bozinovic, K.; McLamb, F.; O’Connell, K.; Olander, N.; Feng, Z.; Haagensen, S.; Bozinovic, G. US national, regional, and state-specific socioeconomic factors correlate with child and adolescent ADHD diagnoses pre-COVID-19 pandemic. Sci. Rep. 2021, 11, 22008. [Google Scholar] [CrossRef]
- Mechler, K.; Banaschewski, T.; Hohmann, S.; Häge, A. Evidence-based pharmacological treatment options for ADHD in children and adolescents. Pharmacol. Ther. 2021, 230, 107940. [Google Scholar] [CrossRef]
- Sibley, M.H.; Kuriyan, A.B.; Evans, S.W.; Waxmonsky, J.G.; Smith, B.H. Pharmacological and psychosocial treatments for adolescents with ADHD: An updated systematic review of the literature. Clin. Psychol. Rev. 2014, 34, 218–232. [Google Scholar] [CrossRef]
- Sonuga-Barke, E.J.; Brandeis, D.; Cortese, S.; Daley, D.; Ferrin, M.; Holtmann, M.; Stevenson, J.; Danckaerts, M.; Van der Oord, S.; Döpfner, M. Nonpharmacological interventions for ADHD: Systematic review and meta-analyses of randomized controlled trials of dietary and psychological treatments. Am. J. Psychiatry 2013, 170, 275–289. [Google Scholar] [CrossRef]
- Hodgson, K.; Hutchinson, A.D.; Denson, L. Nonpharmacological treatments for ADHD: A meta-analytic review. J. Atten. Disord. 2014, 18, 275–282. [Google Scholar] [CrossRef]
- Berrezueta-Guzman, J.; Robles-Bykbaev, V.; Pau, I.; Pesántez-Avilés, F.; Martín-Ruiz, M.-L. Robotic Technologies in ADHD Care: Literature Review. IEEE Access 2021, 10, 608–625. [Google Scholar] [CrossRef]
- Pandey, A.K.; Gelin, R. A mass-produced sociable humanoid robot: Pepper: The first machine of its kind. IEEE Robot. Autom. Mag. 2018, 25, 40–48. [Google Scholar] [CrossRef]
- SILBOT. Group Type Robot Cognitive Training System (Silbot). Available online: http://www.robocare.co.kr/pages/product03_en.php (accessed on 30 November 2022.).
- Qbilat, M.; Iglesias, A.; Belpaeme, T. A proposal of accessibility guidelines for human-robot interaction. Electronics 2021, 10, 561. [Google Scholar] [CrossRef]
- Sanbot. Sanbot Elf Robot. 2021. Available online: https://www.sanbotcoUK/#sanbot-robot (accessed on 30 November 2022.).
- Kumazaki, H.; Yoshikawa, Y.; Yoshimura, Y.; Ikeda, T.; Hasegawa, C.; Saito, D.N.; Tomiyama, S.; An, K.-M.; Shimaya, J.; Ishiguro, H. The impact of robotic intervention on joint attention in children with autism spectrum disorders. Mol. Autism 2018, 9, 1–10. [Google Scholar] [CrossRef] [PubMed]
- O’Mahony, N.; Florentino-Liano, B.; Carballo, J.J.; Baca-García, E.; Rodríguez, A.A. Objective diagnosis of ADHD using IMUs. Med. Eng. Phys. 2014, 36, 922–926. [Google Scholar] [CrossRef] [PubMed]
- Slobodin, O.; Yahav, I.; Berger, I. A machine-based prediction model of ADHD using CPT data. Front. Hum. Neurosci. 2020, 14, 560021. [Google Scholar] [CrossRef] [PubMed]
- Tosun, M. Effects of spectral features of EEG signals recorded with different channels and recording statuses on ADHD classification with deep learning. Phys. Eng. Sci. Med. 2021, 44, 693–702. [Google Scholar] [CrossRef]
- Bellec, P.; Chu, C.; Chouinard-Decorte, F.; Benhajali, Y.; Margulies, D.S.; Craddock, R.C. The neuro bureau ADHD-200 preprocessed repository. Neuroimage 2017, 144, 275–286. [Google Scholar] [CrossRef]
- Chen, Y.; Tang, Y.; Wang, C.; Liu, X.; Zhao, L.; Wang, Z. ADHD classification by dual subspace learning using resting-state functional connectivity. Artif. Intell. Med. 2020, 103, 101786. [Google Scholar] [CrossRef]
- Zhou, D.; Liao, Z.; Chen, R. Deep Learning Enabled Diagnosis of Children’s ADHD Based on the Big Data of Video Screen Long-Range EEG. J. Healthc. Eng. 2022, 2022, 5222136. [Google Scholar] [CrossRef]
- Xie, J.; Huo, Z.; Liu, X.; Wang, Z. An fMRI Sequence Representation Learning Framework for Attention Deficit Hyperactivity Disorder Classification. Appl. Sci. 2022, 12, 6211. [Google Scholar] [CrossRef]
- Wang, D.; Hong, D.; Wu, Q. Attention Deficit Hyperactivity Disorder Classification Based on Deep Learning. IEEE/ACM Trans. Comput. Biol. Bioinform. 2022. [Google Scholar] [CrossRef] [PubMed]
- Qiang, N.; Dong, Q.; Liang, H.; Ge, B.; Zhang, S.; Zhang, C.; Gao, J.; Sun, Y. A novel ADHD classification method based on resting state temporal templates (RSTT) using spatiotemporal attention auto-encoder. Neural Comput. Appl. 2022, 34, 7815–7833. [Google Scholar] [CrossRef]
- Altun, S.; Alkan, A.; Altun, H. Application of deep learning and classical machine learning methods in the diagnosis of attention deficit hyperactivity disorder according to temperament features. Concurr. Comput. Pract. Exp. 2022, 34, e6908. [Google Scholar] [CrossRef]
- Choi, M.-T.; Yeom, J.; Shin, Y.; Park, I. Robot-assisted ADHD screening in diagnostic process. J. Intell. Robot. Syst. 2019, 95, 351–363. [Google Scholar] [CrossRef]
- Lee, S.-H.; Lee, D.-W.; Jun, K.; Lee, W.; Kim, M.S. Markerless 3D Skeleton Tracking Algorithm by Merging Multiple Inaccurate Skeleton Data from Multiple RGB-D Sensors. Sensors 2022, 22, 3155. [Google Scholar] [CrossRef]
- Woo, S.; Park, J.; Lee, J.-Y.; Kweon, I.S. Cbam: Convolutional block attention module. In Proceedings of the European Conference on Computer Vision (ECCV), Munich, Germany, 8–14 September 2018; pp. 3–19. [Google Scholar]
- Eroglu, Y.; Yildirim, K.; Çinar, A.; Yildirim, M. Diagnosis and grading of vesicoureteral reflux on voiding cystourethrography images in children using a deep hybrid model. Comput. Methods Programs Biomed. 2021, 210, 106369. [Google Scholar] [CrossRef]


| Dataset | Year | Model | Accuracy |
|---|---|---|---|
| IMU data [17] | 2014 | SVM | 95.12% |
| EEG [19] | 2021 | LSTM | 92.2% |
| EEG [22] | 2022 | CNN | 97.7% |
| fMRI data set [21] | 2020 | SVM | 88.1% |
| fMRI data set [23] | 2022 | CNN | 73.73% |
| fMRI data set [24] | 2022 | CNN | 69% |
| fMRI data set [25] | 2022 | Spatiotemporal attention auto encoder | 72.5% |
| test scores [18] | 2020 | Random forest | 87% |
| test scores [18] | 2020 | SVM | 86.3% |
| test scores [26] | 2022 | Decision tree | 92.5% |
| Class | Number of Participants |
|---|---|
| ADHD | 66 |
| ADHD at risk | 181 |
| Normal | 349 |
| Total | 596 |
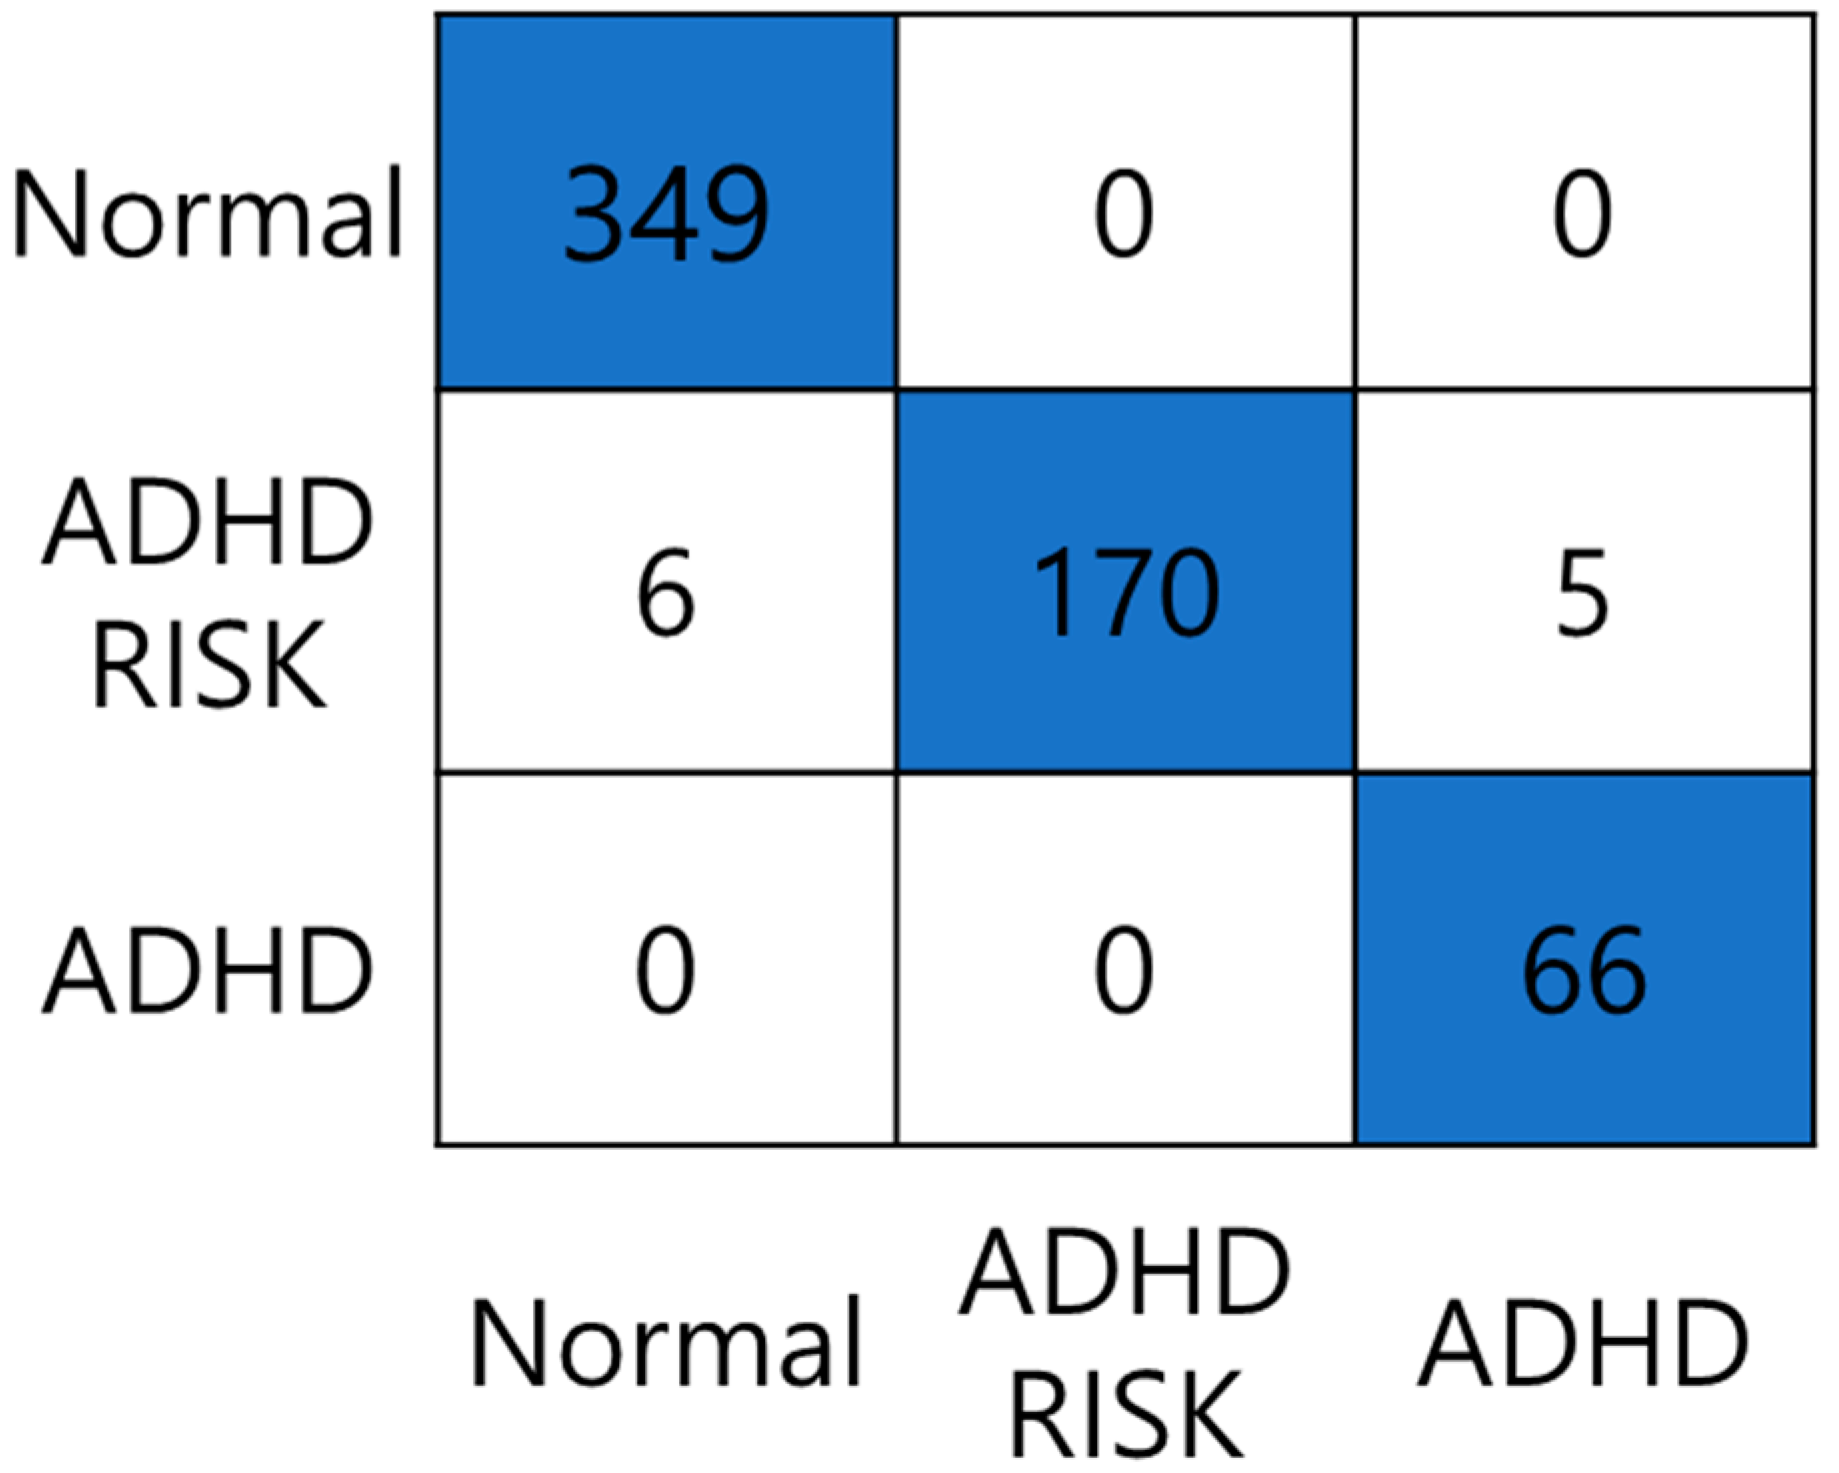
| Label | Acc (%) | Se (%) | Sp (%) | F1 (%) | FPR | FDR | FNR |
|---|---|---|---|---|---|---|---|
| Normal | 98.99 | 100 | 97.57 | 99.14 | 0.024 | 0.016 | 0 |
| ADHD–RISK | 98.15 | 93.92 | 100 | 96.86 | 0 | 0 | 0.06 |
| ADHD | 99.16 | 100 | 99.06 | 96.35 | 0.009 | 0.07 | 0 |
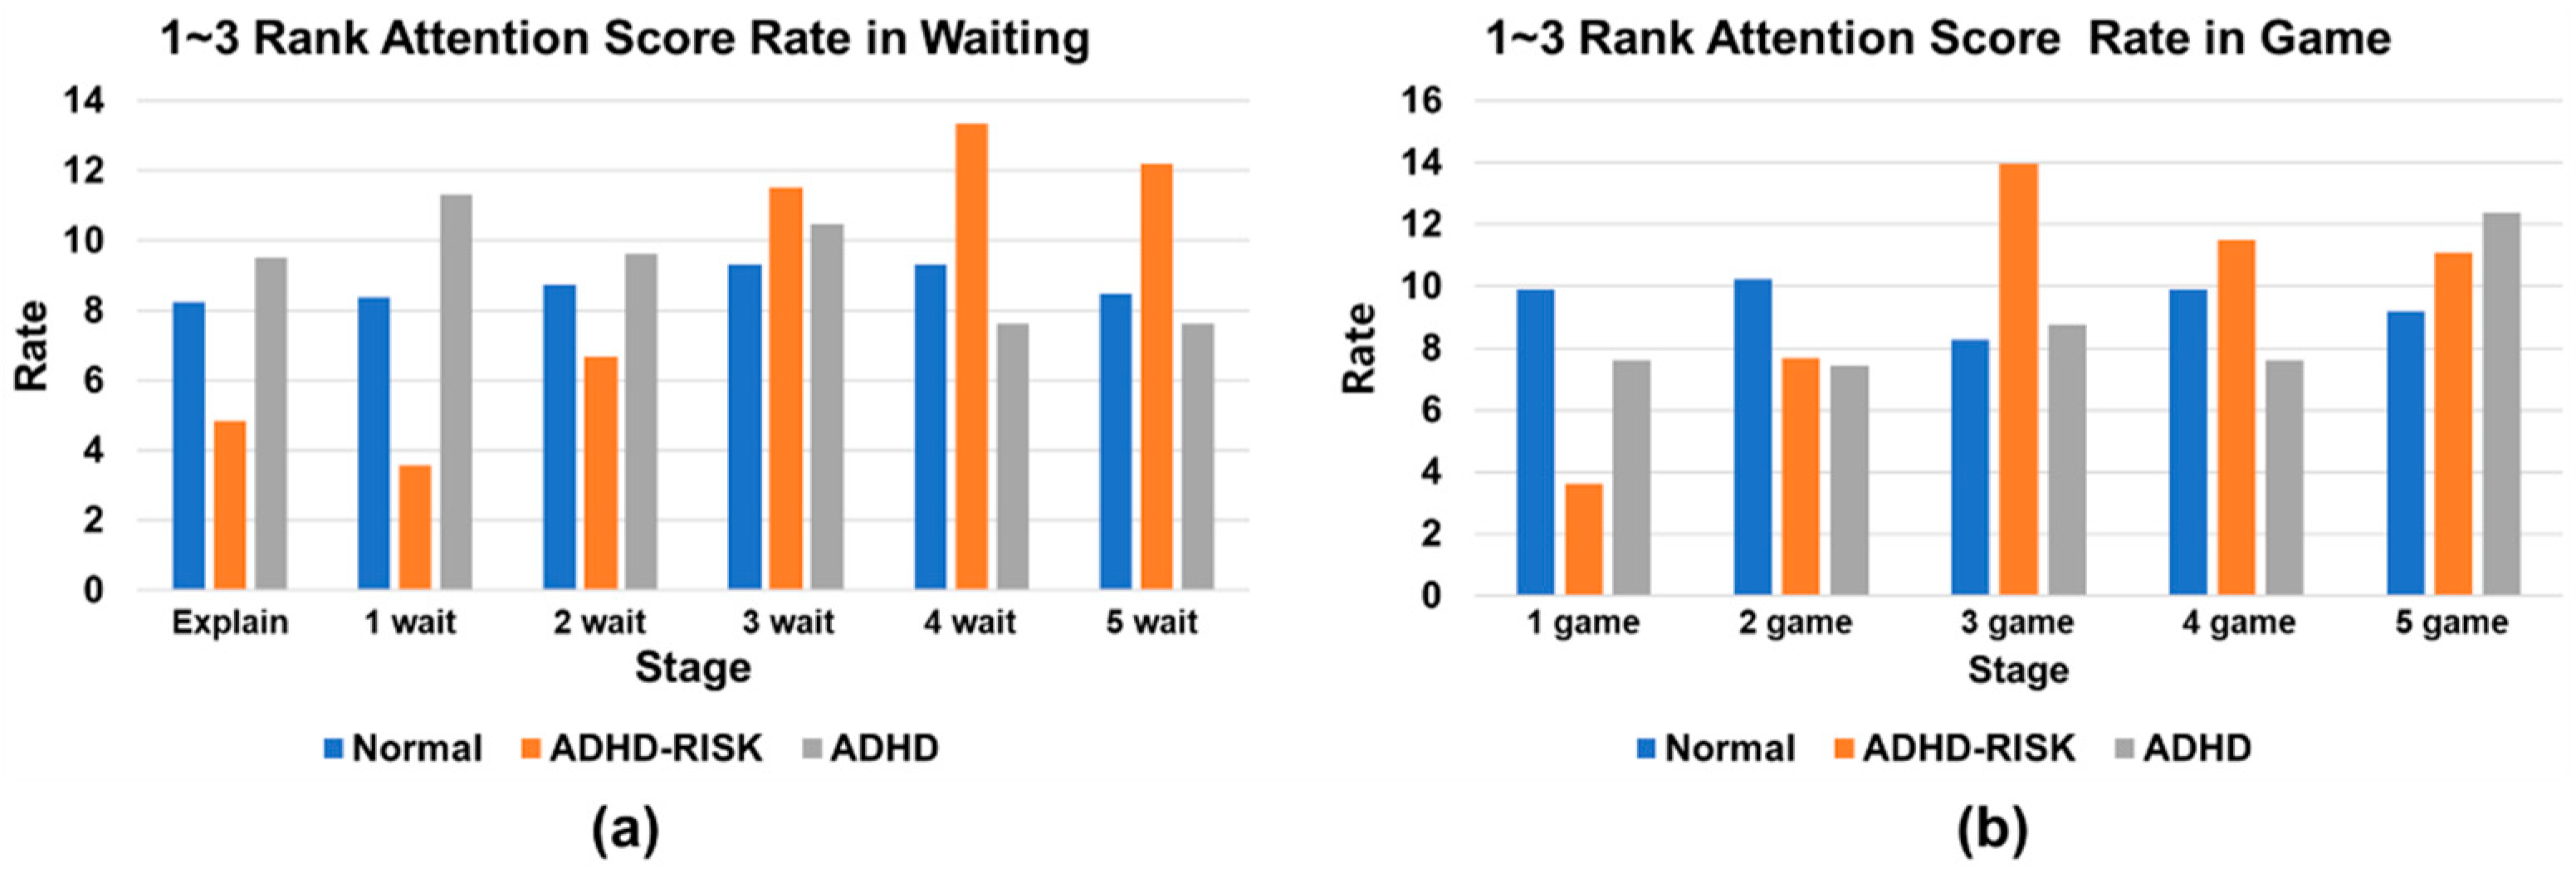
| Explain | 1 Wait | 2 Wait | 3 Wait | 4 Wait | 5 Wait | 1 Game | 2 Game | 3 Game | 4 Game | 5 Game | |
|---|---|---|---|---|---|---|---|---|---|---|---|
| Average (%) | 8.808 | 9.146 | 8.896 | 9.201 | 9.240 | 8.821 | 9.116 | 9.437 | 8.945 | 9.273 | 9.119 |
| (%) | Explain | 1 Wait | 2 Wait | 3 Wait | 4 Wait | 5 Wait | 1 Game | 2 Game | 3 Game | 4 Game | 5 Game |
|---|---|---|---|---|---|---|---|---|---|---|---|
| Normal | 8.244 | 8.363 | 8.722 | 9.319 | 9.319 | 8.483 | 9.916 | 10.231 | 8.288 | 9.916 | 9.2 |
| ADHD–RISK | 4.848 | 3.561 | 6.667 | 11.515 | 13.333 | 12.197 | 3.636 | 7.697 | 13.97 | 11.485 | 11.091 |
| ADHD | 9.524 | 11.333 | 9.619 | 10.476 | 7.619 | 7.619 | 7.619 | 7.429 | 8.762 | 7.619 | 12.381 |
Disclaimer/Publisher’s Note: The statements, opinions and data contained in all publications are solely those of the individual author(s) and contributor(s) and not of MDPI and/or the editor(s). MDPI and/or the editor(s) disclaim responsibility for any injury to people or property resulting from any ideas, methods, instructions or products referred to in the content. |
© 2022 by the authors. Licensee MDPI, Basel, Switzerland. This article is an open access article distributed under the terms and conditions of the Creative Commons Attribution (CC BY) license (https://creativecommons.org/licenses/by/4.0/).
Share and Cite
Lee, W.; Lee, S.; Lee, D.; Jun, K.; Ahn, D.H.; Kim, M.S. Deep Learning-Based ADHD and ADHD-RISK Classification Technology through the Recognition of Children’s Abnormal Behaviors during the Robot-Led ADHD Screening Game. Sensors 2023, 23, 278. https://doi.org/10.3390/s23010278
Lee W, Lee S, Lee D, Jun K, Ahn DH, Kim MS. Deep Learning-Based ADHD and ADHD-RISK Classification Technology through the Recognition of Children’s Abnormal Behaviors during the Robot-Led ADHD Screening Game. Sensors. 2023; 23(1):278. https://doi.org/10.3390/s23010278
Chicago/Turabian StyleLee, Wonjun, Sanghyub Lee, Deokwon Lee, Kooksung Jun, Dong Hyun Ahn, and Mun Sang Kim. 2023. "Deep Learning-Based ADHD and ADHD-RISK Classification Technology through the Recognition of Children’s Abnormal Behaviors during the Robot-Led ADHD Screening Game" Sensors 23, no. 1: 278. https://doi.org/10.3390/s23010278
APA StyleLee, W., Lee, S., Lee, D., Jun, K., Ahn, D. H., & Kim, M. S. (2023). Deep Learning-Based ADHD and ADHD-RISK Classification Technology through the Recognition of Children’s Abnormal Behaviors during the Robot-Led ADHD Screening Game. Sensors, 23(1), 278. https://doi.org/10.3390/s23010278