
Portable Electronic Nose Based on Digital and Analog Chemical Sensors for 2,4,6-Trichloroanisole Discrimination

 ,
,  , , and
Abstract
:1. Introduction
2. Materials and Methods
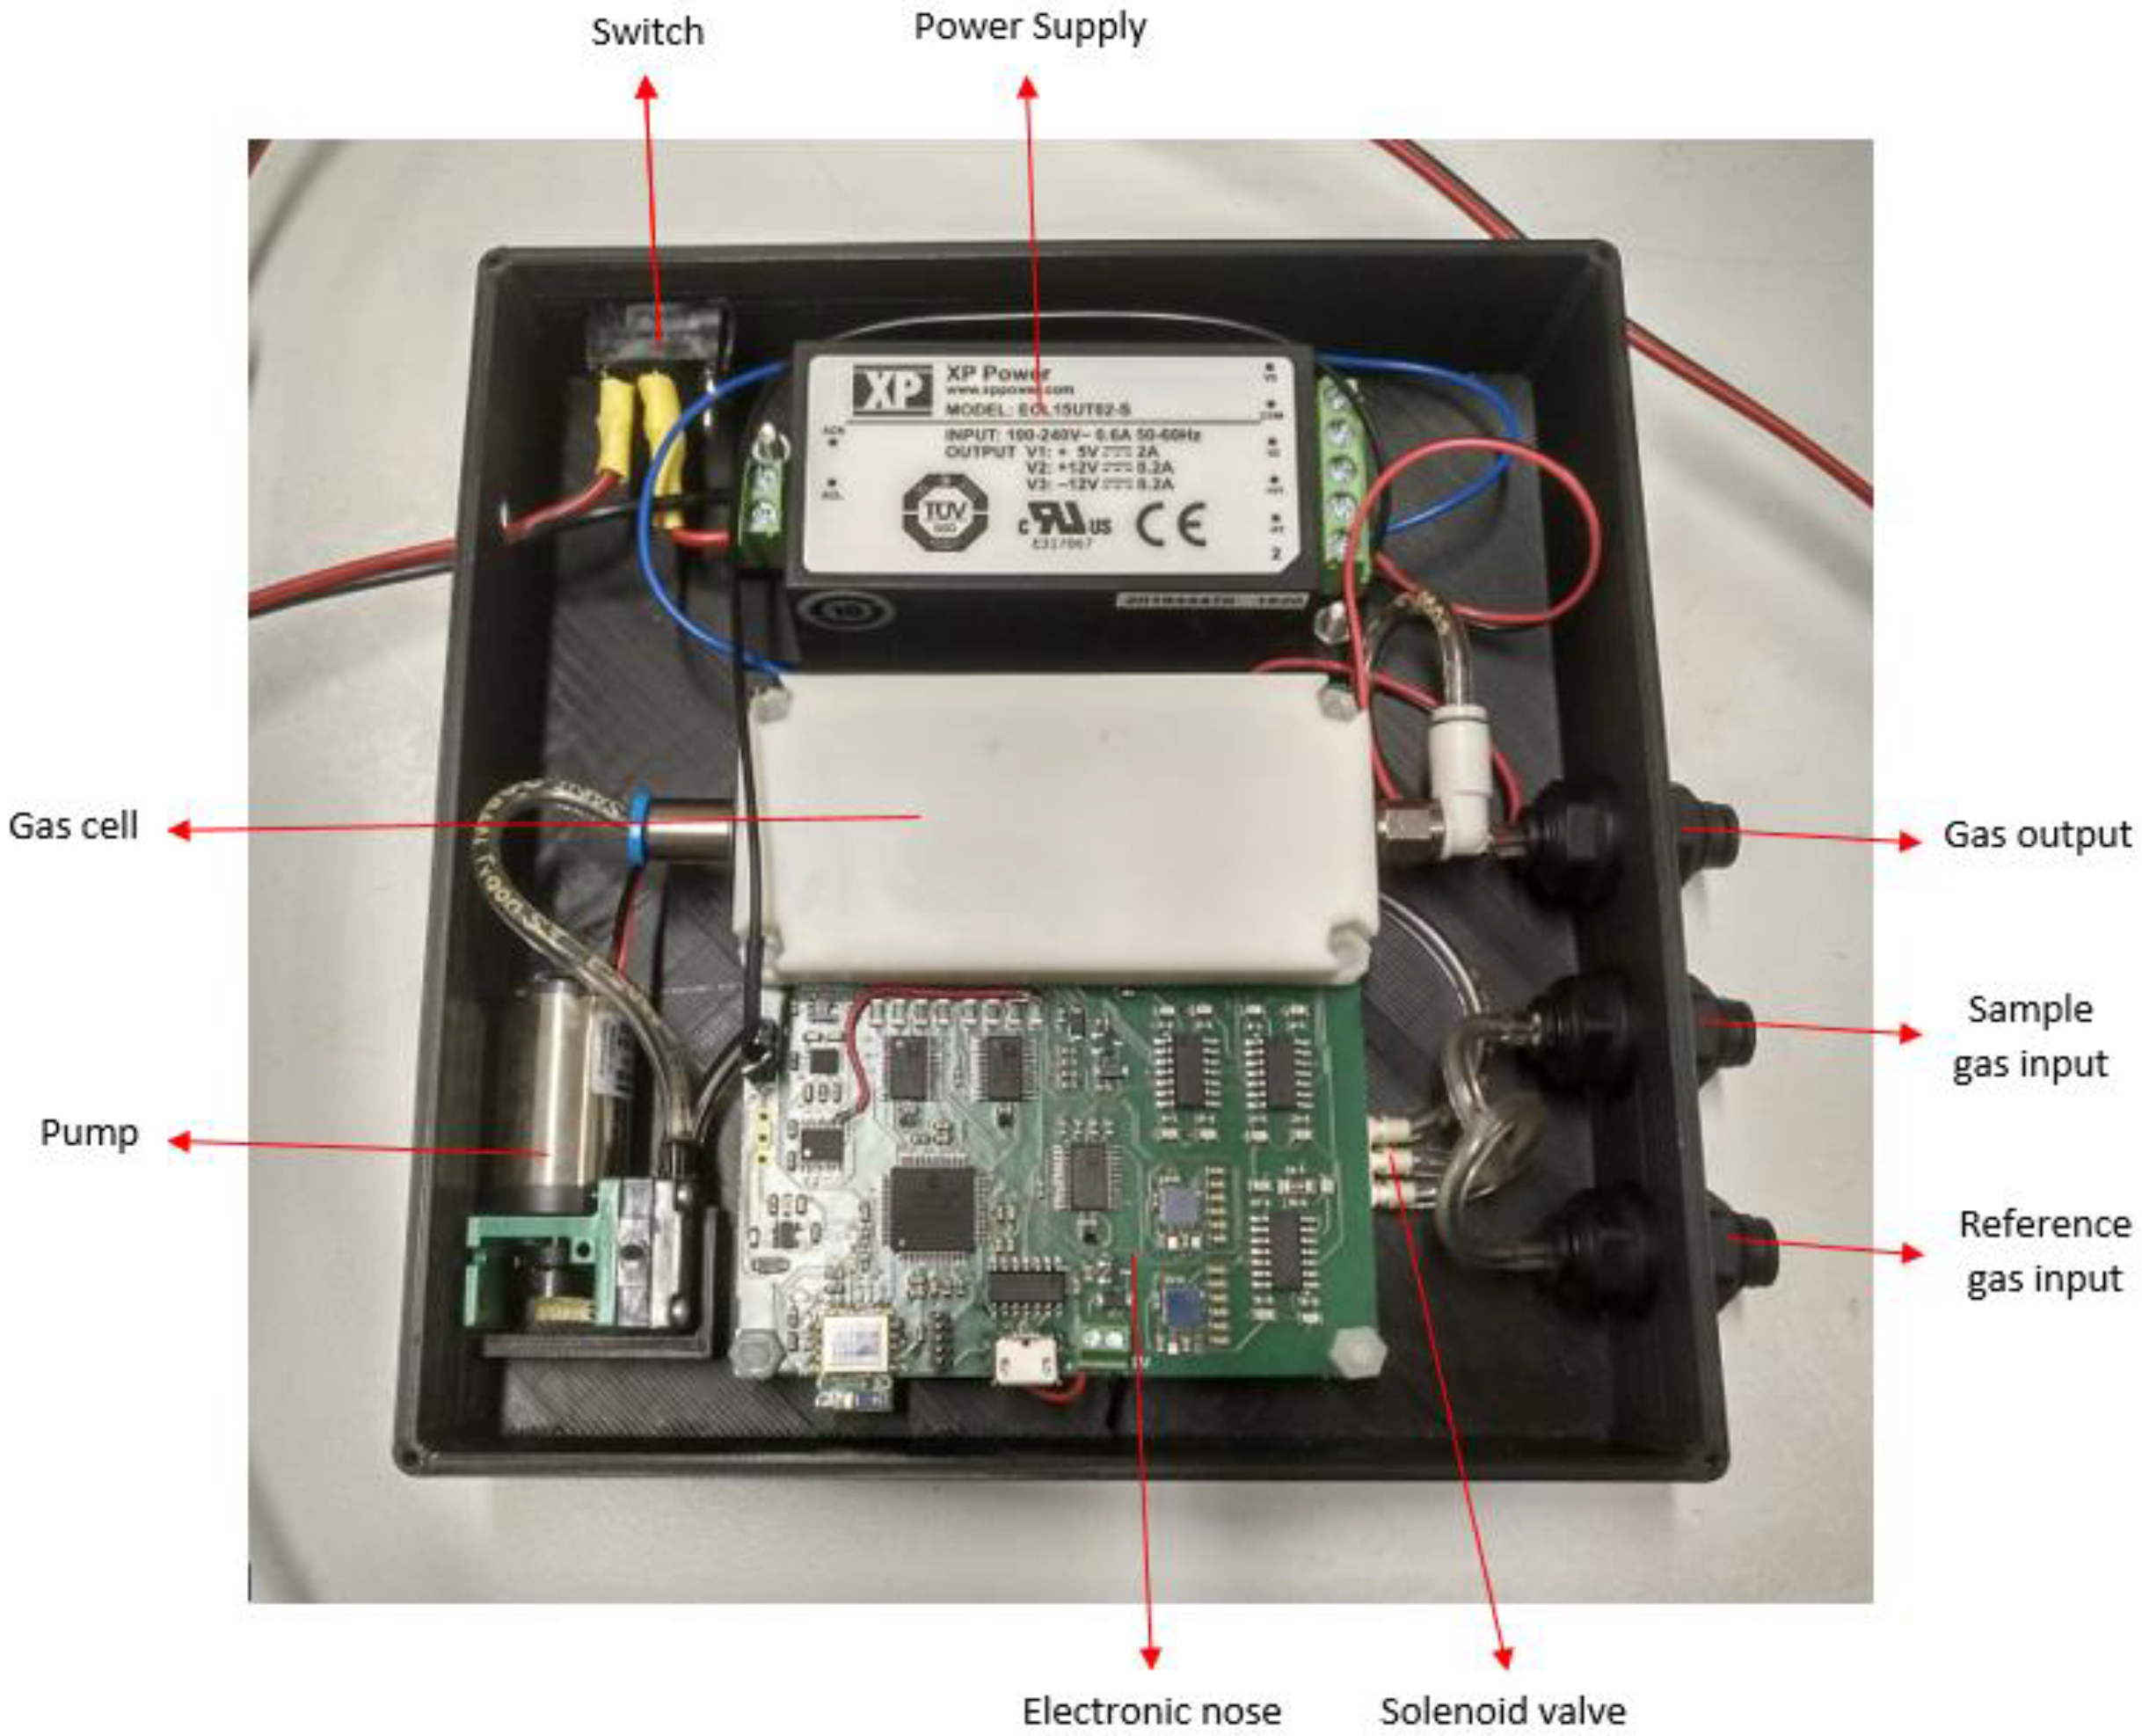
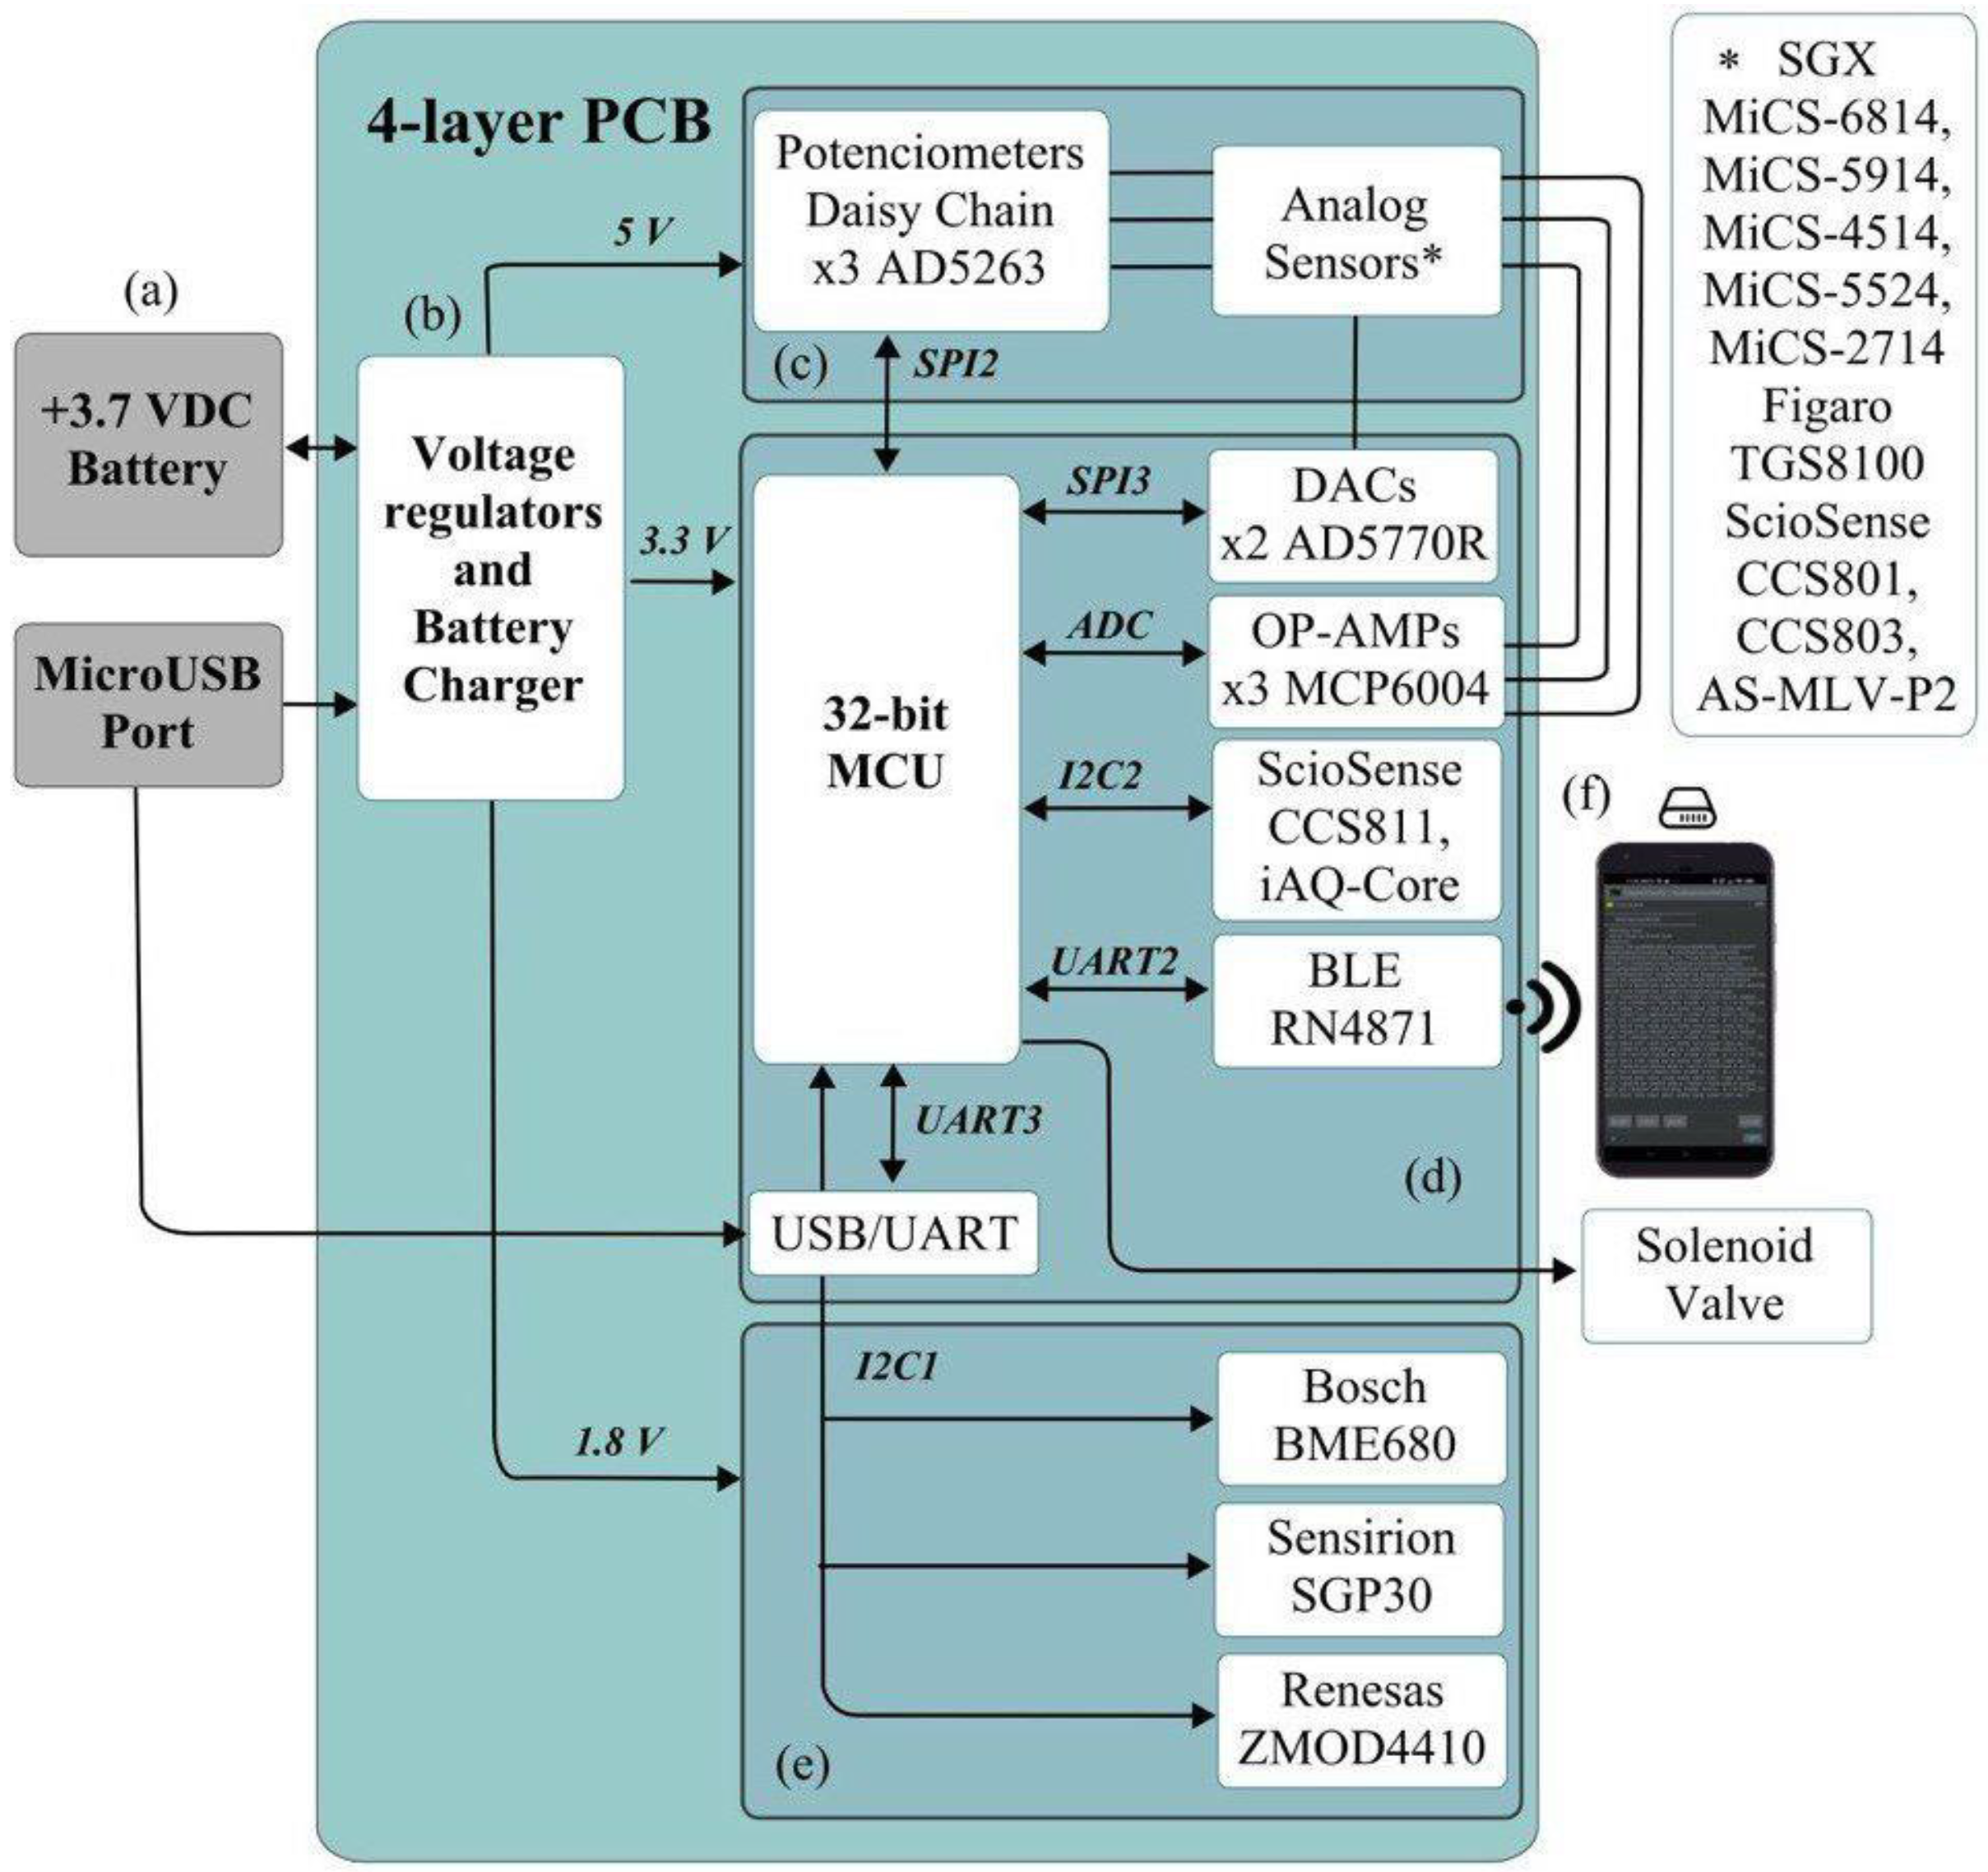
2.1. Description of the MultisensorNOSE
2.2. Communication Protocol
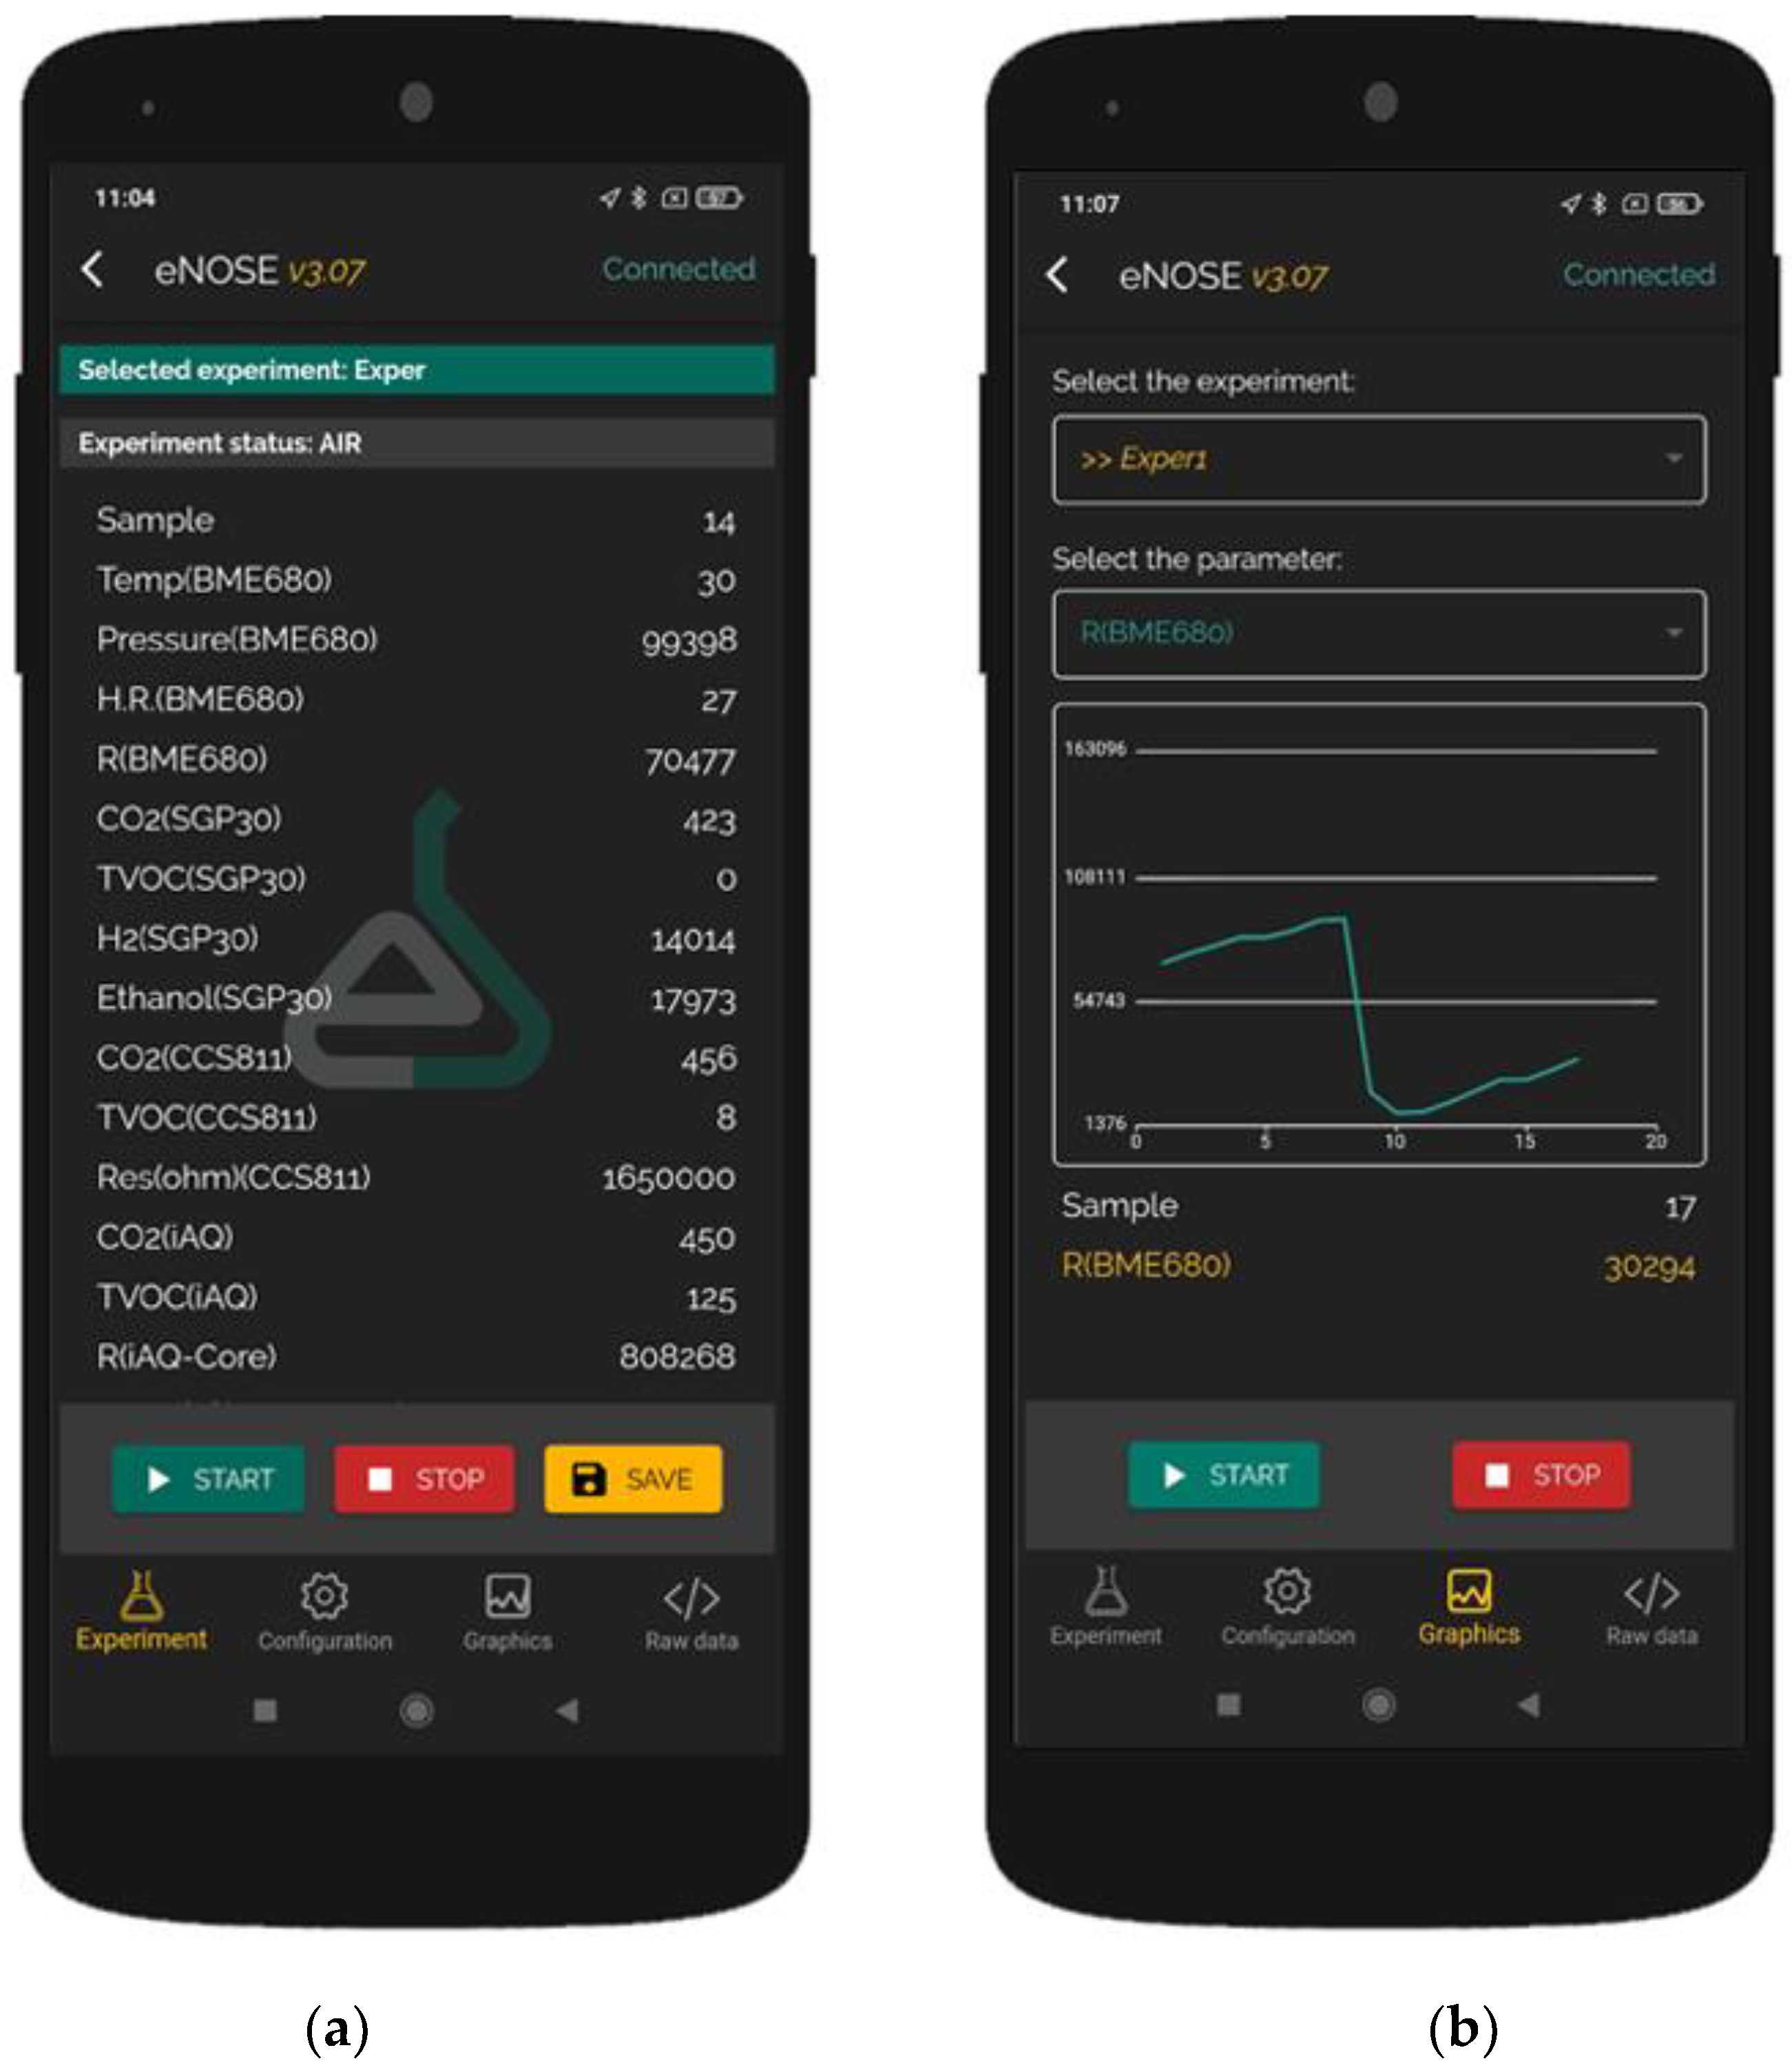
- Experiment: This section is where data are collected and stored with an easy user interface. Users can add smartphone GPS coordinates to the data and select the type of experiment. Buttons for starting and stopping the experiment and saving the data are available.
- Configuration: In this section, the user can change the adsorption and desorption times and the sampling period in an easy user interface.
- Graphics: In this section, the user can select one signal and see how it changes in real time using a graphic.
- Raw data: The application works like a UART terminal and shows all the data sent by the e-nose in this section.
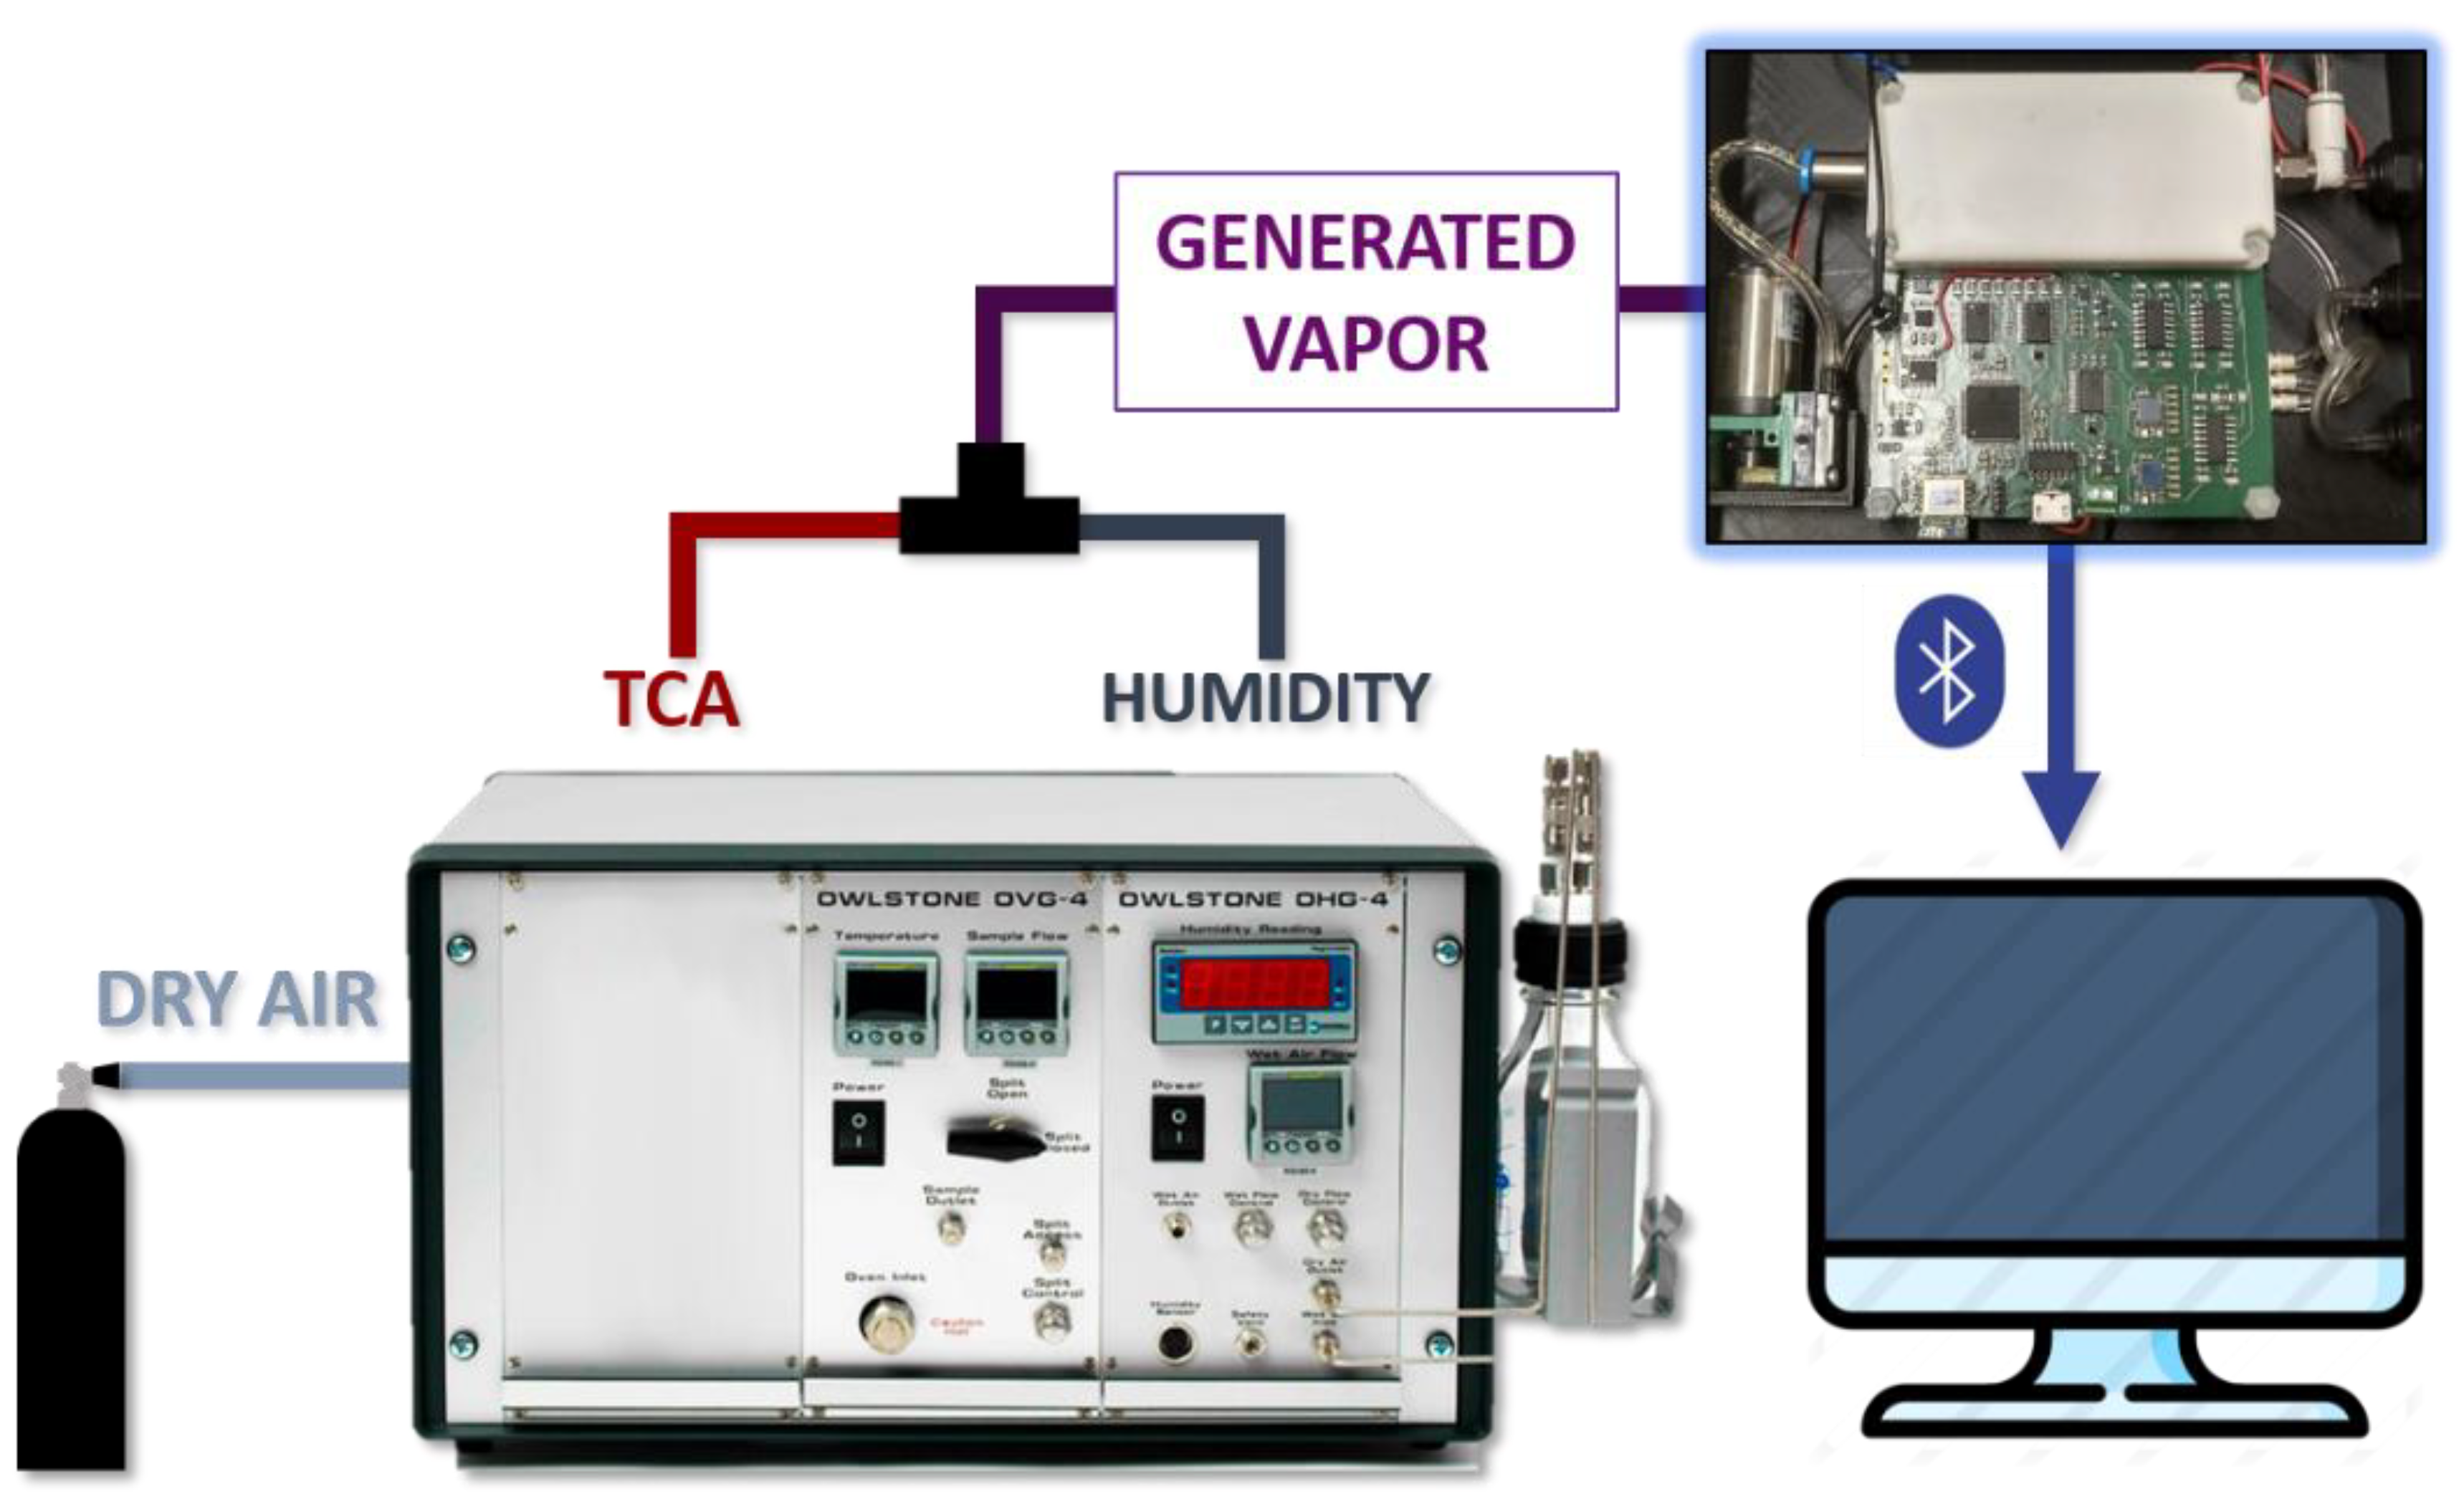
2.3. Measurement Set-Up
3. Results and Discussion
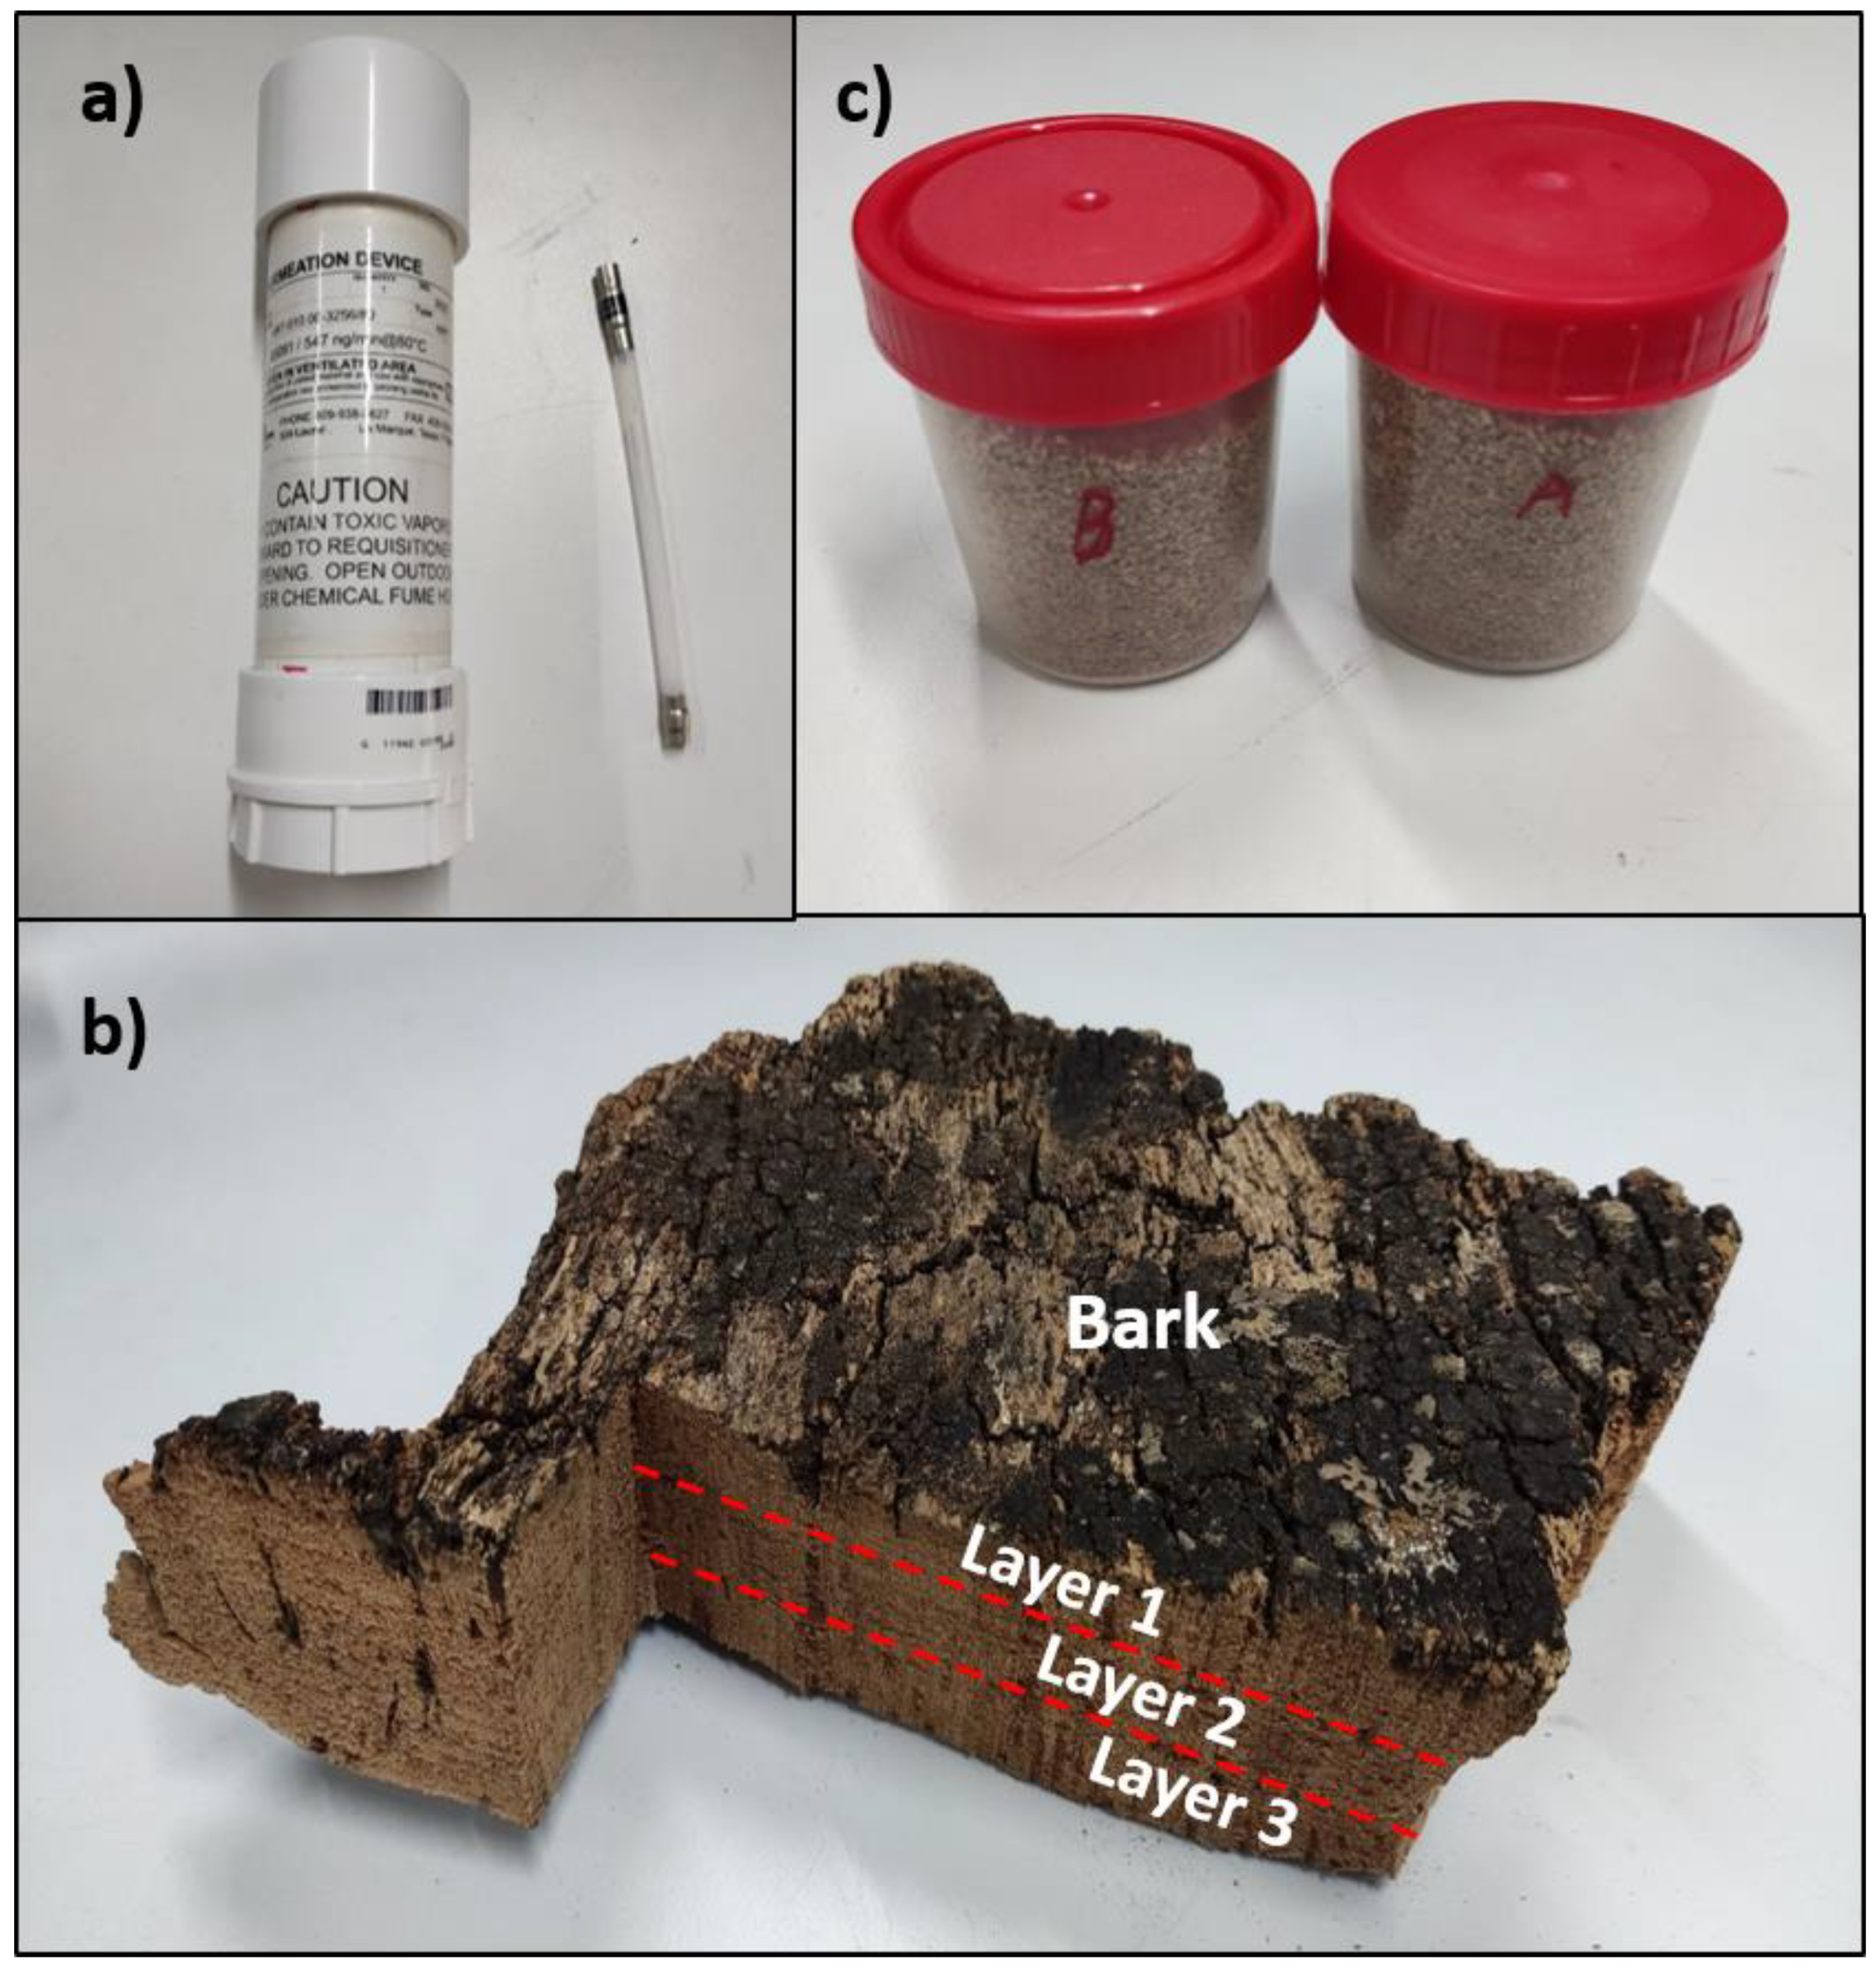
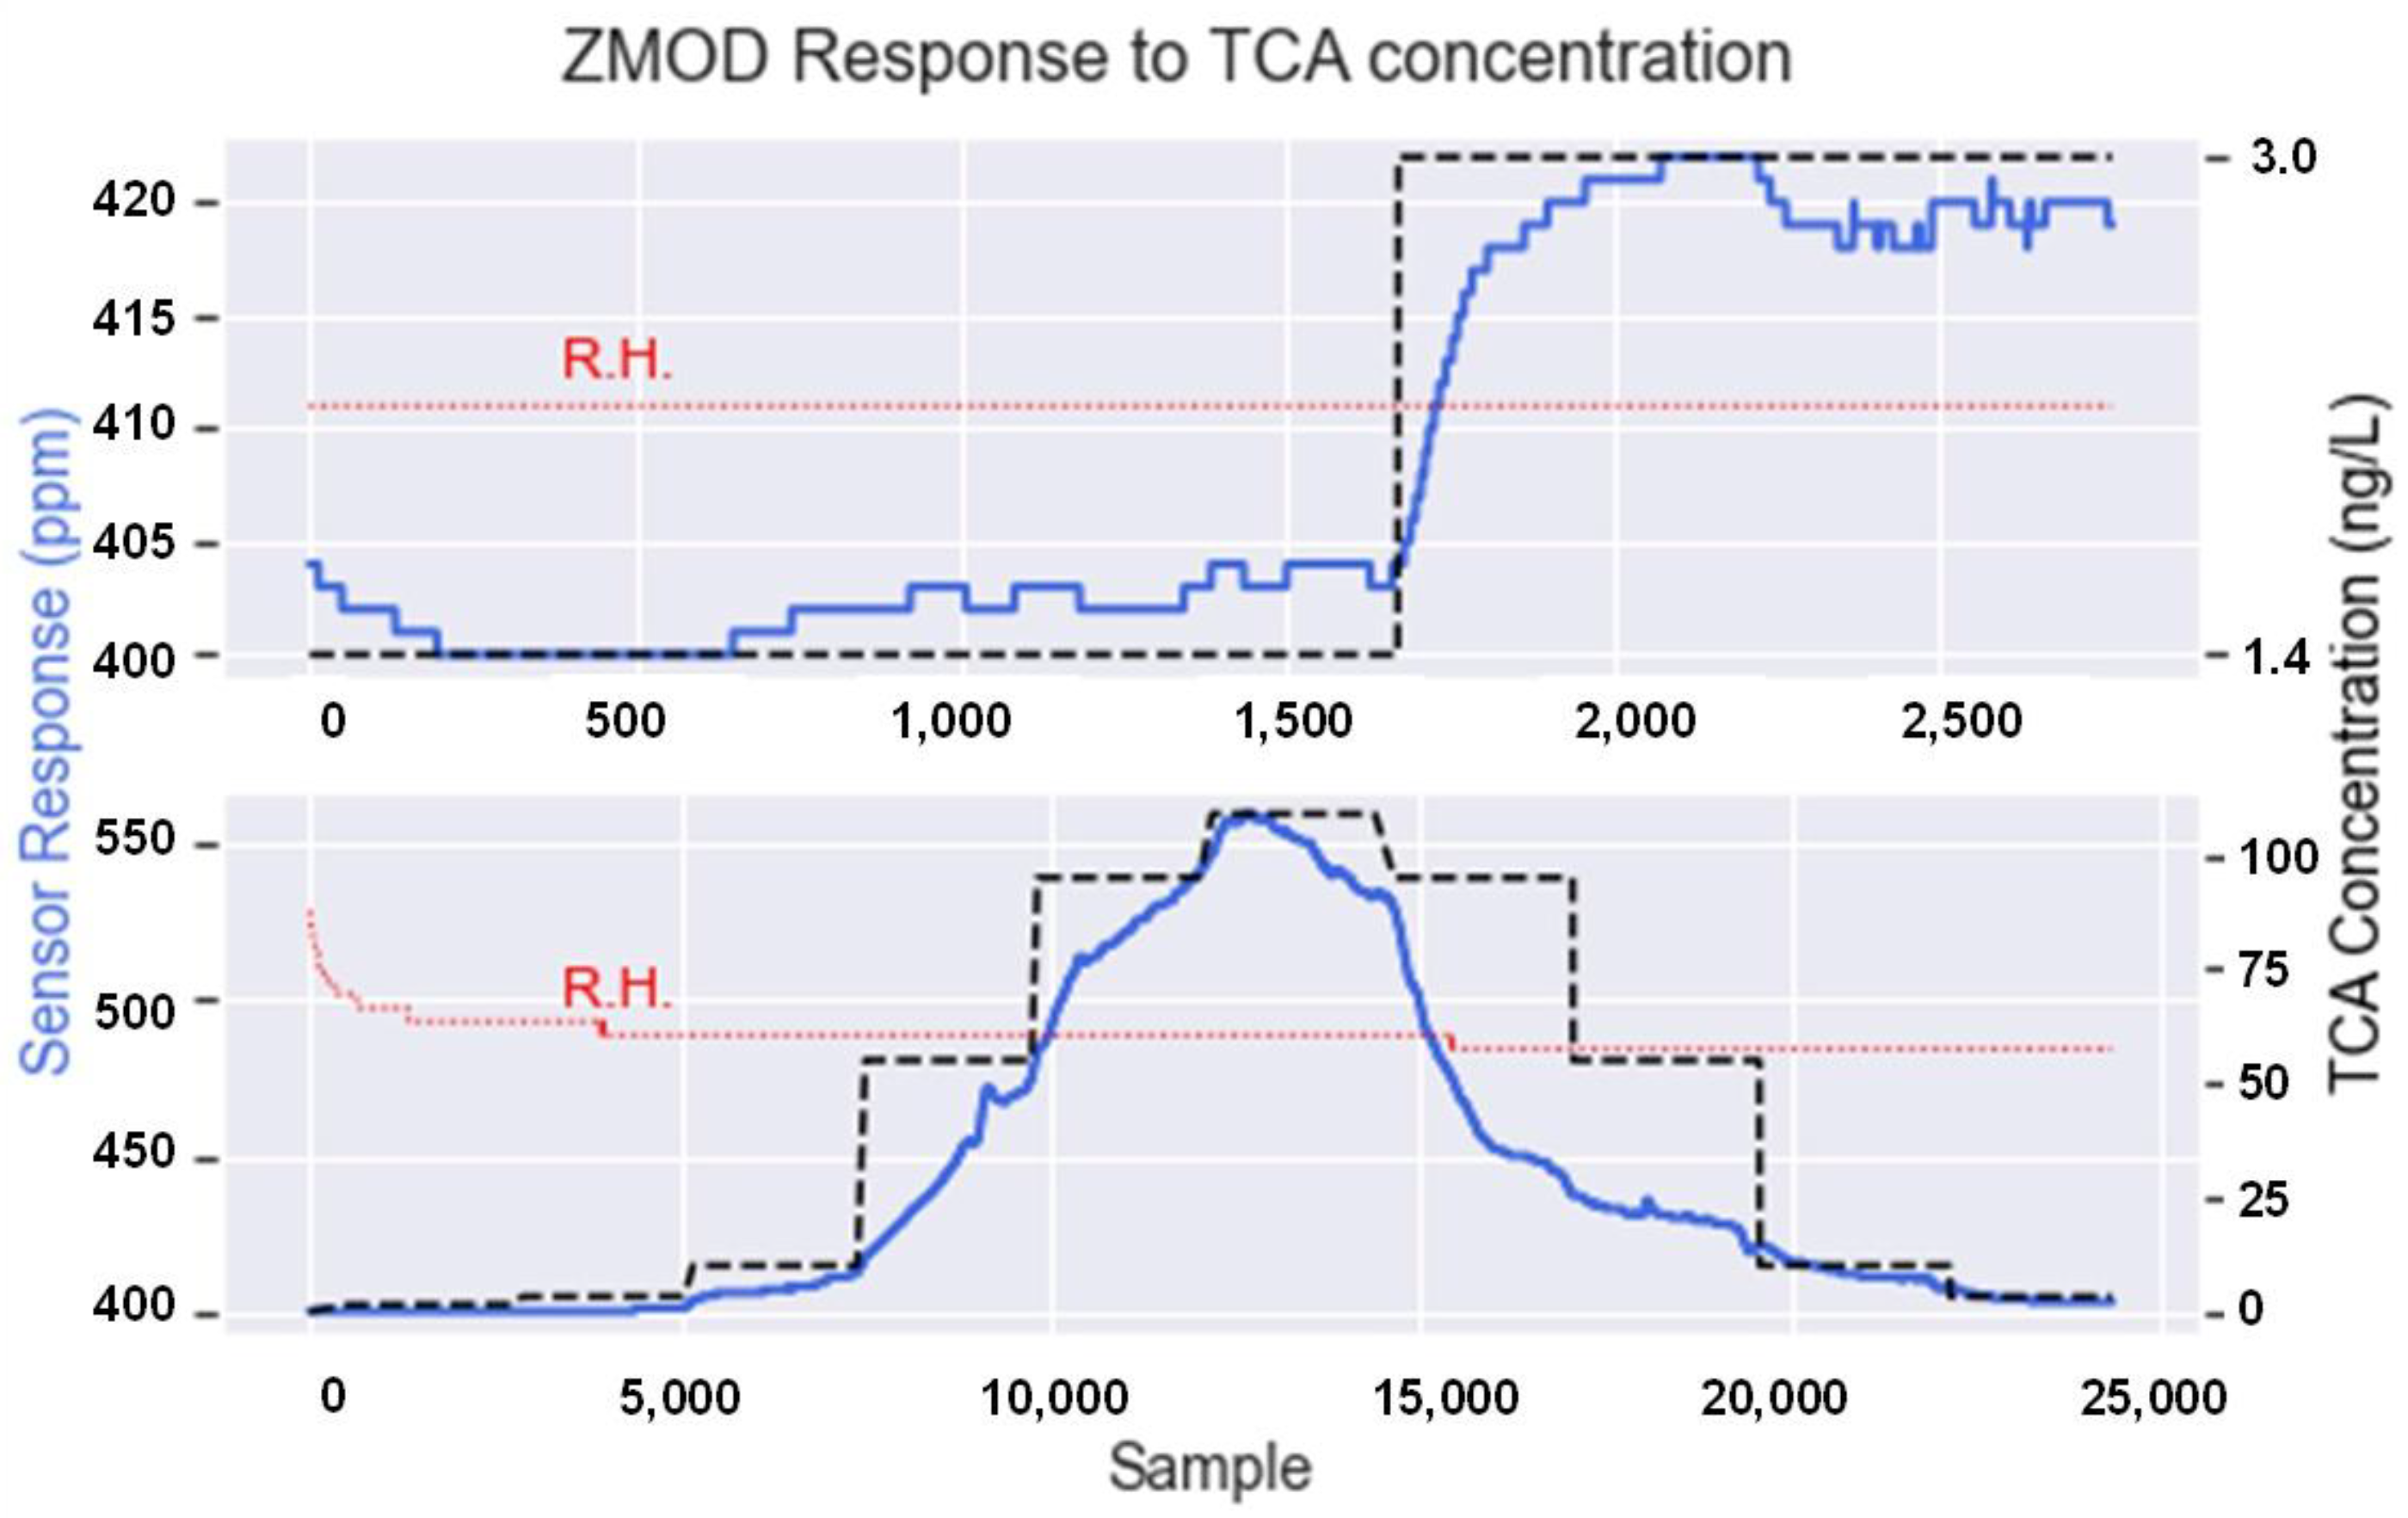
3.1. Gas Generator
3.2. Cork Slab
3.3. Granulated Cork
4. Conclusions
Author Contributions
Funding
Institutional Review Board Statement
Informed Consent Statement
Data Availability Statement
Acknowledgments
Conflicts of Interest
References
- Keller, P.E. Mimicking Biology: Applications of Cognitive Systems to Electronic Noses. In Proceedings of the 1999 IEEE International Symposium on Intelligent Control Intelligent Systems and Semiotics (Cat. No.99CH37014), Cambridge, MA, USA, 17 September 1999; pp. 447–451. [Google Scholar]
- Arroyo, P.; Gómez-Suárez, J.; Suárez, J.I.; Lozano, J. Low-Cost Air Quality Measurement System Based on Electrochemical and PM Sensors with Cloud Connection. Sensors 2021, 21, 6228. [Google Scholar] [CrossRef] [PubMed]
- Gómez-Suárez, J.; Arroyo, P.; Alfonso, R.; Suárez, J.I.; Pinilla-Gil, E.; Lozano, J. A Novel Bike-Mounted Sensing Device with Cloud Connectivity for Dynamic Air-Quality Monitoring by Urban Cyclists. Sensors 2022, 22, 1272. [Google Scholar] [CrossRef] [PubMed]
- Wojnowski, W.; Majchrzak, T.; Dymerski, T.; Gębicki, J.; Namieśnik, J. Portable Electronic Nose Based on Electrochemical Sensors for Food Quality Assessment. Sensors 2017, 17, 2715. [Google Scholar] [CrossRef] [PubMed] [Green Version]
- Arroyo, P.; Meléndez, F.; Suárez, J.I.; Herrero, J.L.; Rodríguez, S.; Lozano, J. Electronic Nose with Digital Gas Sensors Connected via Bluetooth to a Smartphone for Air Quality Measurements. Sensors 2020, 20, 786. [Google Scholar] [CrossRef] [PubMed] [Green Version]
- Tiele, A.; Wicaksono, A.; Ayyala, S.K.; Covington, J.A. Development of a Compact, IoT-Enabled Electronic Nose for Breath Analysis. Electronics 2020, 9, 84. [Google Scholar] [CrossRef] [Green Version]
- Suárez, J.I.; Arroyo, P.; Lozano, J.; Herrero, J.L.; Padilla, M. Bluetooth Gas Sensing Module Combined with Smartphones for Air Quality Monitoring. Chemosphere 2018, 205, 618–626. [Google Scholar] [CrossRef]
- Miller, T.C.; Morgera, S.D.; Saddow, S.E.; Takshi, A.; Palm, M. Electronic Nose with Detection Method for Alcohol, Acetone, and Carbon Monoxide in Coronavirus Disease 2019 Breath Simulation Model. IEEE Sens. J. 2021, 21, 15935–15943. [Google Scholar] [CrossRef]
- Gancarz, M.; Malaga-Toboła, U.; Oniszczuk, A.; Tabor, S.; Oniszczuk, T.; Gawrysiak-Witulska, M.; Rusinek, R. Detection and Measurement of Aroma Compounds with the Electronic Nose and a Novel Method for MOS Sensor Signal Analysis during the Wheat Bread Making Process. Food Bioprod. Process. 2021, 127, 90–98. [Google Scholar] [CrossRef]
- Tatli, S.; Mirzaee-Ghaleh, E.; Rabbani, H.; Karami, H.; Wilson, A.D. Rapid Detection of Urea Fertilizer Effects on VOC Emissions from Cucumber Fruits Using a MOS E-Nose Sensor Array. Agronomy 2021, 12, 35. [Google Scholar] [CrossRef]
- Wilson, A.; Oberle, C.; Oberle, D. Detection of Off-Flavor in Catfish Using a Conducting Polymer Electronic-Nose Technology. Sensors 2013, 13, 15968–15984. [Google Scholar] [CrossRef]
- Lozano, J.; Fernández, M.J.; Fontecha, J.L.; Aleixandre, M.; Santos, J.P.; Sayago, I.; Arroyo, T.; Cabellos, J.M.; Gutiérrez, F.J.; Horrillo, M.C. Wine Classification with a Zinc Oxide SAW Sensor Array. Sens. Actuators B Chem. 2006, 120, 166–171. [Google Scholar] [CrossRef]
- de Lerma, N.L.; Moreno, J.; Peinado, R.A. Determination of the Optimum Sun-Drying Time for Vitis Vinifera L. Cv. Tempranillo Grapes by E-Nose Analysis and Characterization of Their Volatile Composition. Food Bioprocess Technol. 2014, 7, 732–740. [Google Scholar] [CrossRef]
- Bashir Shaban, K.; Kadri, A.; Rezk, E. Urban Air Pollution Monitoring System with Forecasting Models. IEEE Sens. J. 2016, 16, 2598–2606. [Google Scholar] [CrossRef]
- Wu, Y.; Liu, T.; Ling, S.; Szymanski, J.; Zhang, W.; Su, S. Air Quality Monitoring for Vulnerable Groups in Residential Environments Using a Multiple Hazard Gas Detector. Sensors 2019, 19, 362. [Google Scholar] [CrossRef] [Green Version]
- Binson, V.A.; Subramoniam, M.; Mathew, L. Discrimination of COPD and Lung Cancer from Controls through Breath Analysis Using a Self-Developed e-Nose. J. Breath Res. 2021, 15, 046003. [Google Scholar] [CrossRef]
- Wilson, A. Application of Electronic-Nose Technologies and VOC-Biomarkers for the Noninvasive Early Diagnosis of Gastrointestinal Diseases. Sensors 2018, 18, 2613. [Google Scholar] [CrossRef] [Green Version]
- Palaparthy, V.S.; Doddapujar, S.N.; Gupta, G.; Das, P.; Chandorkar, S.A.; Mukherji, S.; Baghini, M.S.; Rao, V.R. E-Nose: Multichannel Analog Signal Conditioning Circuit with Pattern Recognition for Explosive Sensing. IEEE Sens. J. 2020, 20, 1373–1382. [Google Scholar] [CrossRef]
- Leite, L.S.; Visani, V.; Marques, P.C.F.; Seabra, M.A.B.L.; Oliveira, N.C.L.; Gubert, P.; de Medeiros, V.W.C.; de Albuquerque, J.O.; de Lima Filho, J.L. Design and Implementation of an Electronic Nose System for Real-Time Detection of Marijuana. Instrum. Sci. Technol. 2021, 49, 471–486. [Google Scholar] [CrossRef]
- Portalo-Calero, F.; Lozano, J.; Meléndez, F.; Arroyo, P.; Suárez, J.I. Identification of Poisonous Mushrooms by Means of a Hand-Held Electronic Nose. Proceedings 2019, 14, 33. [Google Scholar] [CrossRef] [Green Version]
- Tan, J.; Xu, J. Applications of Electronic Nose (e-Nose) and Electronic Tongue (e-Tongue) in Food Quality-Related Properties Determination: A Review. Artif. Intell. Agric. 2020, 4, 104–115. [Google Scholar] [CrossRef]
- Silva, A.; Lambri, M.; De Faveri, M.D. Evaluation of the Performances of Synthetic and Cork Stoppers up to 24 Months Post-Bottling. Eur. Food Res. Technol. 2003, 216, 529–534. [Google Scholar] [CrossRef]
- Cravero, M.C. Musty and Moldy Taint in Wines: A Review. Beverages 2020, 6, 41. [Google Scholar] [CrossRef]
- Lorenzo, C.; Zalacain, A.; Alonso, G.L.; Salinas, M.R. Non-Destructive Method to Determine Halophenols and Haloanisoles in Cork Stoppers by Headspace Sorptive Extraction. J. Chromatogr. A 2006, 1114, 250–254. [Google Scholar] [CrossRef] [PubMed]
- Álvarez-Rodríguez, M.L.; Recio, E.; Coque, J.J.R. The Analysis of Natural Cork Stoppers in Transversal Sections as an Effective Tool to Determine the Origin of the Taint by 2,4,6-Trichloroanisole. Eur. Food Res. Technol. 2009, 230, 135–143. [Google Scholar] [CrossRef]
- Prat, C.; Trias, R.; Culleré, L.; Escudero, A.; Anticó, E.; Bañeras, L. Off-Odor Compounds Produced in Cork by Isolated Bacteria and Fungi: A Gas Chromatography Mass Spectrometry and Gas Chromatography-Olfactometry Study. J. Agric. Food Chem. 2009, 57, 7473–7479. [Google Scholar] [CrossRef]
- Jové, P.; Pareras, A.; De Nadal, R.; Verdum, M. Development and Optimization of a Quantitative Analysis of Main Odorants Causing off Flavours in Cork Stoppers Using Headspace Solid-Phase Microextraction Gas Chromatography Tandem Mass Spectrometry. J. Mass Spectrom. 2021, 56, e4728. [Google Scholar] [CrossRef]
- Yin, Y.; Zhao, Y. A Feature Selection Strategy of E-Nose Data Based on PCA Coupled with Wilks Λ-Statistic for Discrimination of Vinegar Samples. J. Food Meas. Charact. 2019, 13, 2406–2416. [Google Scholar] [CrossRef]
- Laref, R.; Losson, E.; Sava, A.; Adjallah, K.; Siadat, M. A Comparison between SVM and PLS for E-Nose Based Gas Concentration Monitoring. In Proceedings of the 2018 IEEE International Conference on Industrial Technology (ICIT), Lyon, France, 20–22 February 2018; pp. 1335–1339. [Google Scholar]
- Sanaeifar, A.; ZakiDizaji, H.; Jafari, A.; de la Guardia, M. Early Detection of Contamination and Defect in Foodstuffs by Electronic Nose: A Review. TrAC Trends Anal. Chem. 2017, 97, 257–271. [Google Scholar] [CrossRef]
- Srivastava, S.; Mishra, G.; Mishra, H.N. Fuzzy Controller Based E-Nose Classification of Sitophilus Oryzae Infestation in Stored Rice Grain. Food Chem. 2019, 283, 604–610. [Google Scholar] [CrossRef]
- Hong, D.; Balzano, L.; Fessler, J.A. Asymptotic Performance of PCA for High-Dimensional Heteroscedastic Data. J. Multivar. Anal. 2018, 167, 435–452. [Google Scholar] [CrossRef]
- Gardner, M.W.; Dorling, S.R. Artificial Neural Networks (the Multilayer Perceptron)-A Review of Applications in the Atmospheric Sciences. Atmos. Environ. 1998, 32, 2627–2636. [Google Scholar] [CrossRef]
- Juanola, R.; Subirà, D.; Salvadó, V.; Garcia Regueiro, J.; Anticó, E. Evaluation of an Extraction Method in the Determination of the 2,4,6-Trichloroanisole Content of Tainted Cork. J. Chromatogr. A 2002, 953, 207–214. [Google Scholar] [CrossRef]


| Sensor Model | Manufacturer | Type | Output Signals |
|---|---|---|---|
| BME680 | Bosch Sensortech GmbH, Germany | Digital | Temperature, Relative Humidity, Pressure, Resistance Value |
| CCS811 | ScioSense B.V., The Netherlands | Digital | CO2, TVOCs 1, Resistance Value |
| SGP30 | Sensirion AG, Switzerland | Digital | CO2, TVOCs, H2 (raw signal 2), Ethanol (raw signal) |
| iAQ-Core C | ScioSense B.V., The Netherlands | Digital | CO2, TVOCs, Resistance Value |
| ZMOD4410 | Renesas Electronics Corporation, Japan | Digital | Ethanol (raw signal), Resistance Value, CO2, TVOC, IAQ 3 |
| MiCS-2714 | SGX Sensortech, Switzerland | Analog | NO2 |
| MiCS-5524 | SGX Sensortech, Switzerland | Analog | CO |
| MiCS-4514 | SGX Sensortech, Switzerland | Analog | CO, NO2 |
| MiCS-5914 | SGX Sensortech, Switzerland | Analog | NH3 |
| MiCS-6814 | SGX Sensortech, Switzerland | Analog | CO, NO2, NH3 |
| CCS801 | ScioSense B.V., The Netherlands | Analog | VOCs |
| CCS803 | ScioSense B.V., The Netherlands | Analog | Ethanol |
| TGS8100 | Figaro Engineering Inc., Japan | Analog | VOCs |
| AS-MLV-P2 | ScioSense B.V., The Netherlands | Analog | VOCs |
| Command | ASCII Code | Description |
|---|---|---|
| MEAS_BME | BME680\r\n | Send a BME680 measure |
| MEAS_SGP | SGP30\r\n | Send a SGP30 measure |
| MEAS_CCS | CCS811\r\n | Send a CCS811 measure |
| MEAS_IAQ | iAQ-Core\r\n | Send an iAQ-Core measure |
| MEAS_ZM | ZMOD4410\r\n | Send a ZMOD4410 measure |
| MEAS_SAN | SenAn\r\n | Send from all analog sensors |
| EXP_MAIN | Exper\r\n | Initiate main experiment |
| EXP_BME | Exper1\r\n | Initiate only BME680 experiment |
| EXP_SGP | Exper2\r\n | Initiate only SGP30 experiment |
| EXP_CCS | Exper3\r\n | Initiate only CCS811 experiment |
| EXP_IAQ | Exper4\r\n | Initiate only iAQ-Core experiment |
| EXP_ZM | Exper5\r\n | Initiate only ZMOD4410 experiment |
| EXP_SAN | Exper6\r\n | Initiate only analog sensors experiment |
| STOP | Stop\r\n | Stop experiment |
| INFO | INFO\r\n | Send device details |
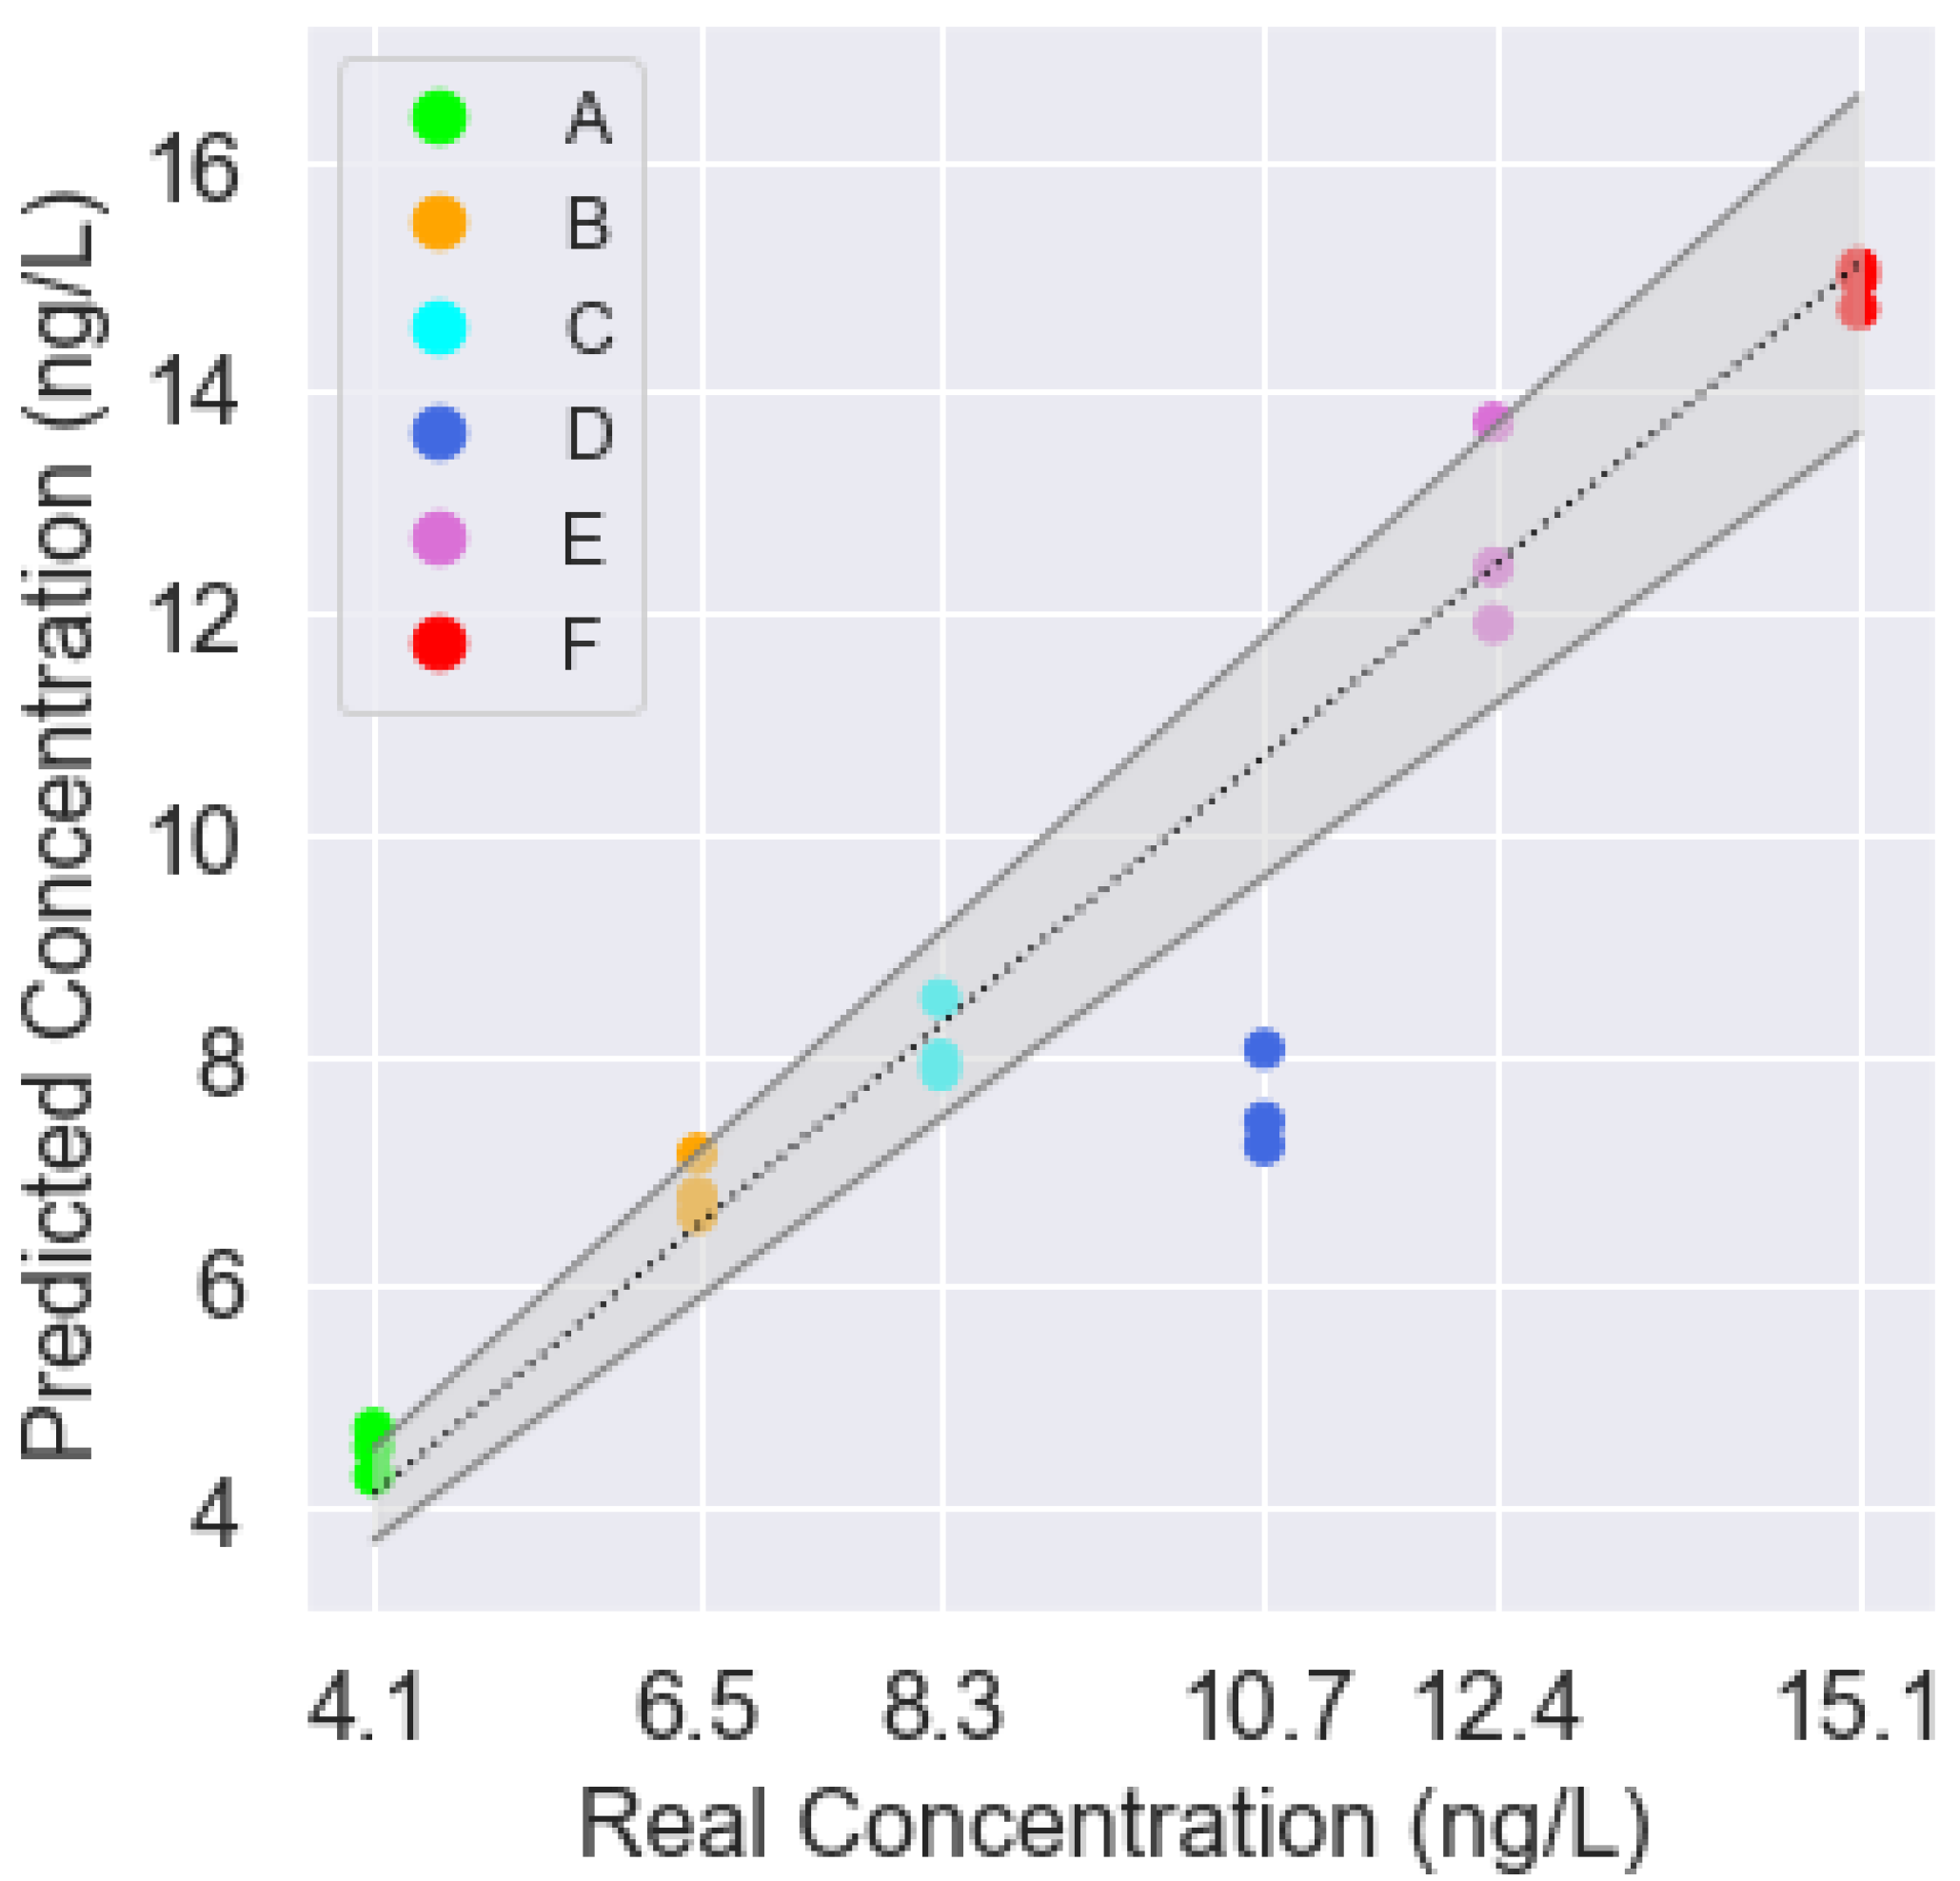
| Class | Real Concentration (ng/L) | Predicted Concentration (ng/L) |
|---|---|---|
| A | 4.1 | 4.5 |
| A | 4.1 | 4.6 |
| A | 4.1 | 4.2 |
| B | 6.5 | 6.7 |
| B | 6.5 | 7.1 |
| B | 6.5 | 6.6 |
| C | 8.3 | 8.5 |
| C | 8.3 | 7.8 |
| C | 8.3 | 7.9 |
| D | 10.7 | 7.2 |
| D | 10.7 | 7.4 |
| D | 10.7 | 8.0 |
| E | 12.4 | 11.8 |
| E | 12.4 | 12.3 |
| E | 12.4 | 13.6 |
| F | 15.1 | 14.9 |
| F | 15.1 | 15.0 |
| F | 15.1 | 14.6 |
Publisher’s Note: MDPI stays neutral with regard to jurisdictional claims in published maps and institutional affiliations. |
© 2022 by the authors. Licensee MDPI, Basel, Switzerland. This article is an open access article distributed under the terms and conditions of the Creative Commons Attribution (CC BY) license (https://creativecommons.org/licenses/by/4.0/).
Share and Cite
Meléndez, F.; Arroyo, P.; Gómez-Suárez, J.; Palomeque-Mangut, S.; Suárez, J.I.; Lozano, J. Portable Electronic Nose Based on Digital and Analog Chemical Sensors for 2,4,6-Trichloroanisole Discrimination. Sensors 2022, 22, 3453. https://doi.org/10.3390/s22093453
Meléndez F, Arroyo P, Gómez-Suárez J, Palomeque-Mangut S, Suárez JI, Lozano J. Portable Electronic Nose Based on Digital and Analog Chemical Sensors for 2,4,6-Trichloroanisole Discrimination. Sensors. 2022; 22(9):3453. https://doi.org/10.3390/s22093453
Chicago/Turabian StyleMeléndez, Félix, Patricia Arroyo, Jaime Gómez-Suárez, Sergio Palomeque-Mangut, José Ignacio Suárez, and Jesús Lozano. 2022. "Portable Electronic Nose Based on Digital and Analog Chemical Sensors for 2,4,6-Trichloroanisole Discrimination" Sensors 22, no. 9: 3453. https://doi.org/10.3390/s22093453
APA StyleMeléndez, F., Arroyo, P., Gómez-Suárez, J., Palomeque-Mangut, S., Suárez, J. I., & Lozano, J. (2022). Portable Electronic Nose Based on Digital and Analog Chemical Sensors for 2,4,6-Trichloroanisole Discrimination. Sensors, 22(9), 3453. https://doi.org/10.3390/s22093453