
The Transition from MODIS to VIIRS for Global Volcano Thermal Monitoring


Abstract
1. Introduction
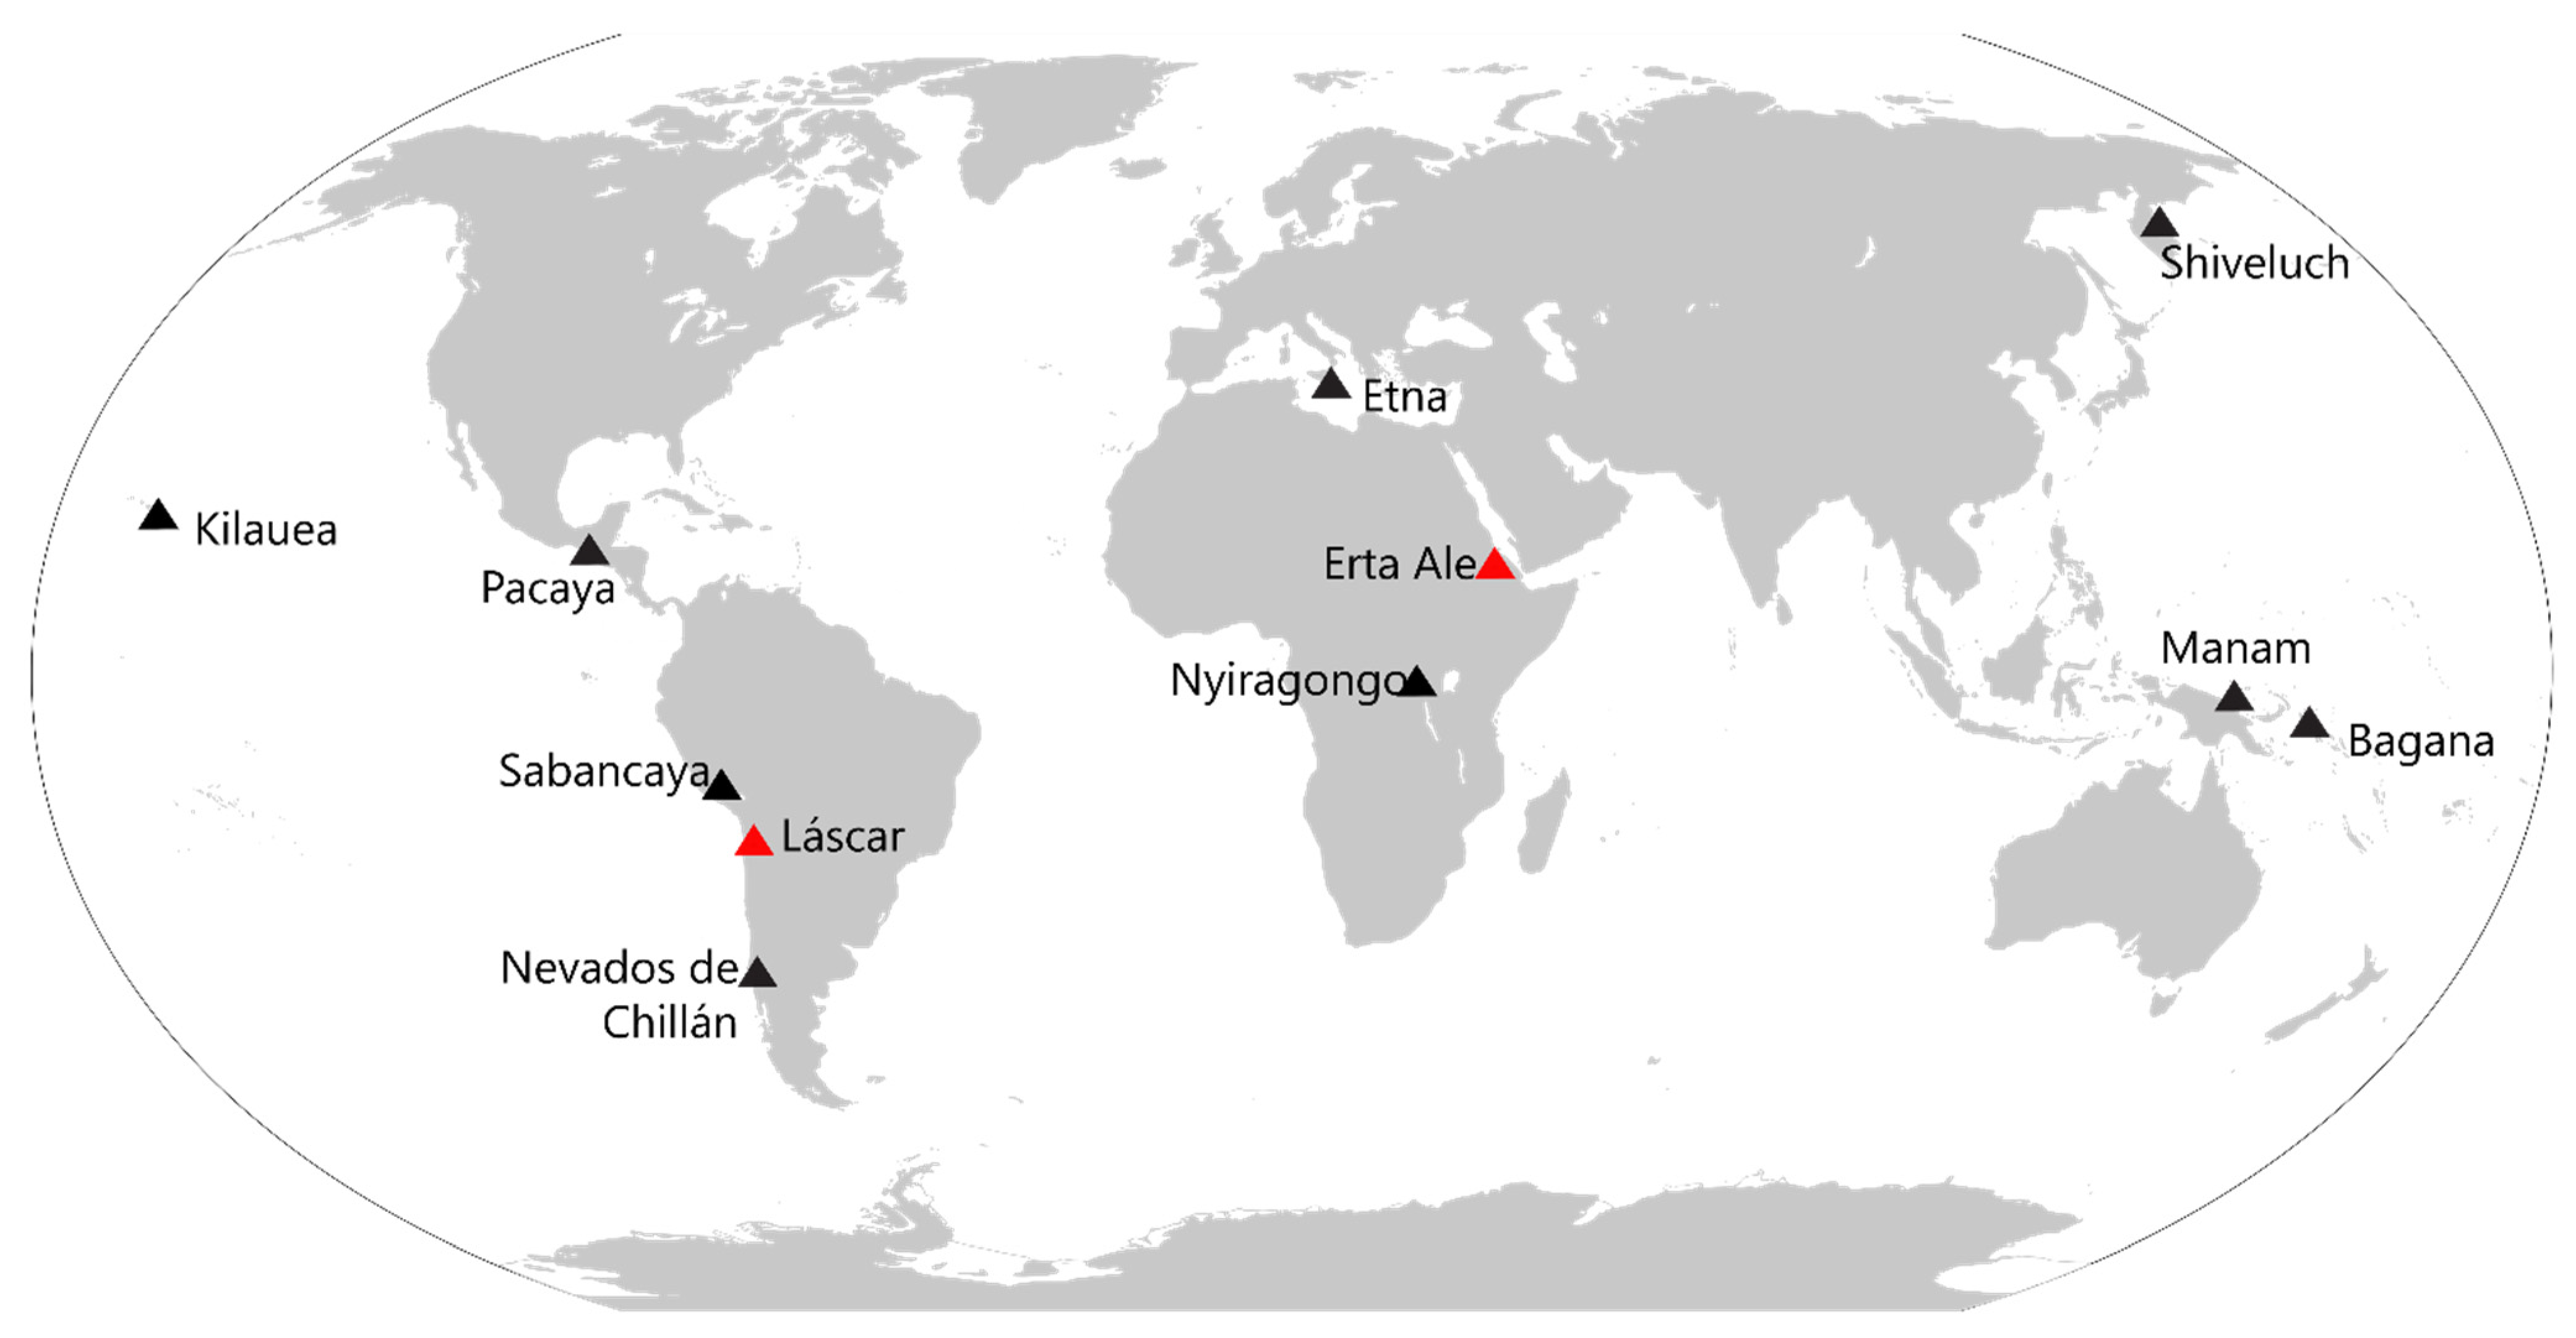
2. Case Studies
- both volcanoes were in persistent activity for the entire duration of the analyzed period (2012–2020). This makes thermal datasets large enough to allow a robust correlation (>3000 images analyzed at each volcano);
- both volcanoes are located in arid areas with low cloud fraction, which favors the high alert detection frequency, and reduces the noise in radiative power time series;
- both volcanoes are characterized by evident fluctuations of heat flux during the considered period. This feature allows to evaluate how the VRP/FRP responds to sudden variations of the heat flux over several orders of magnitude;
- the two volcanoes are characterized by different kinds of activity (lava lake and basaltic lava flow for Erta Ale, and persistent fumarolic degassing and explosive activity for Láscar); thus we may evaluate the algorithm’s performance on volcanic thermal sources having different intensity and temperature distributions.
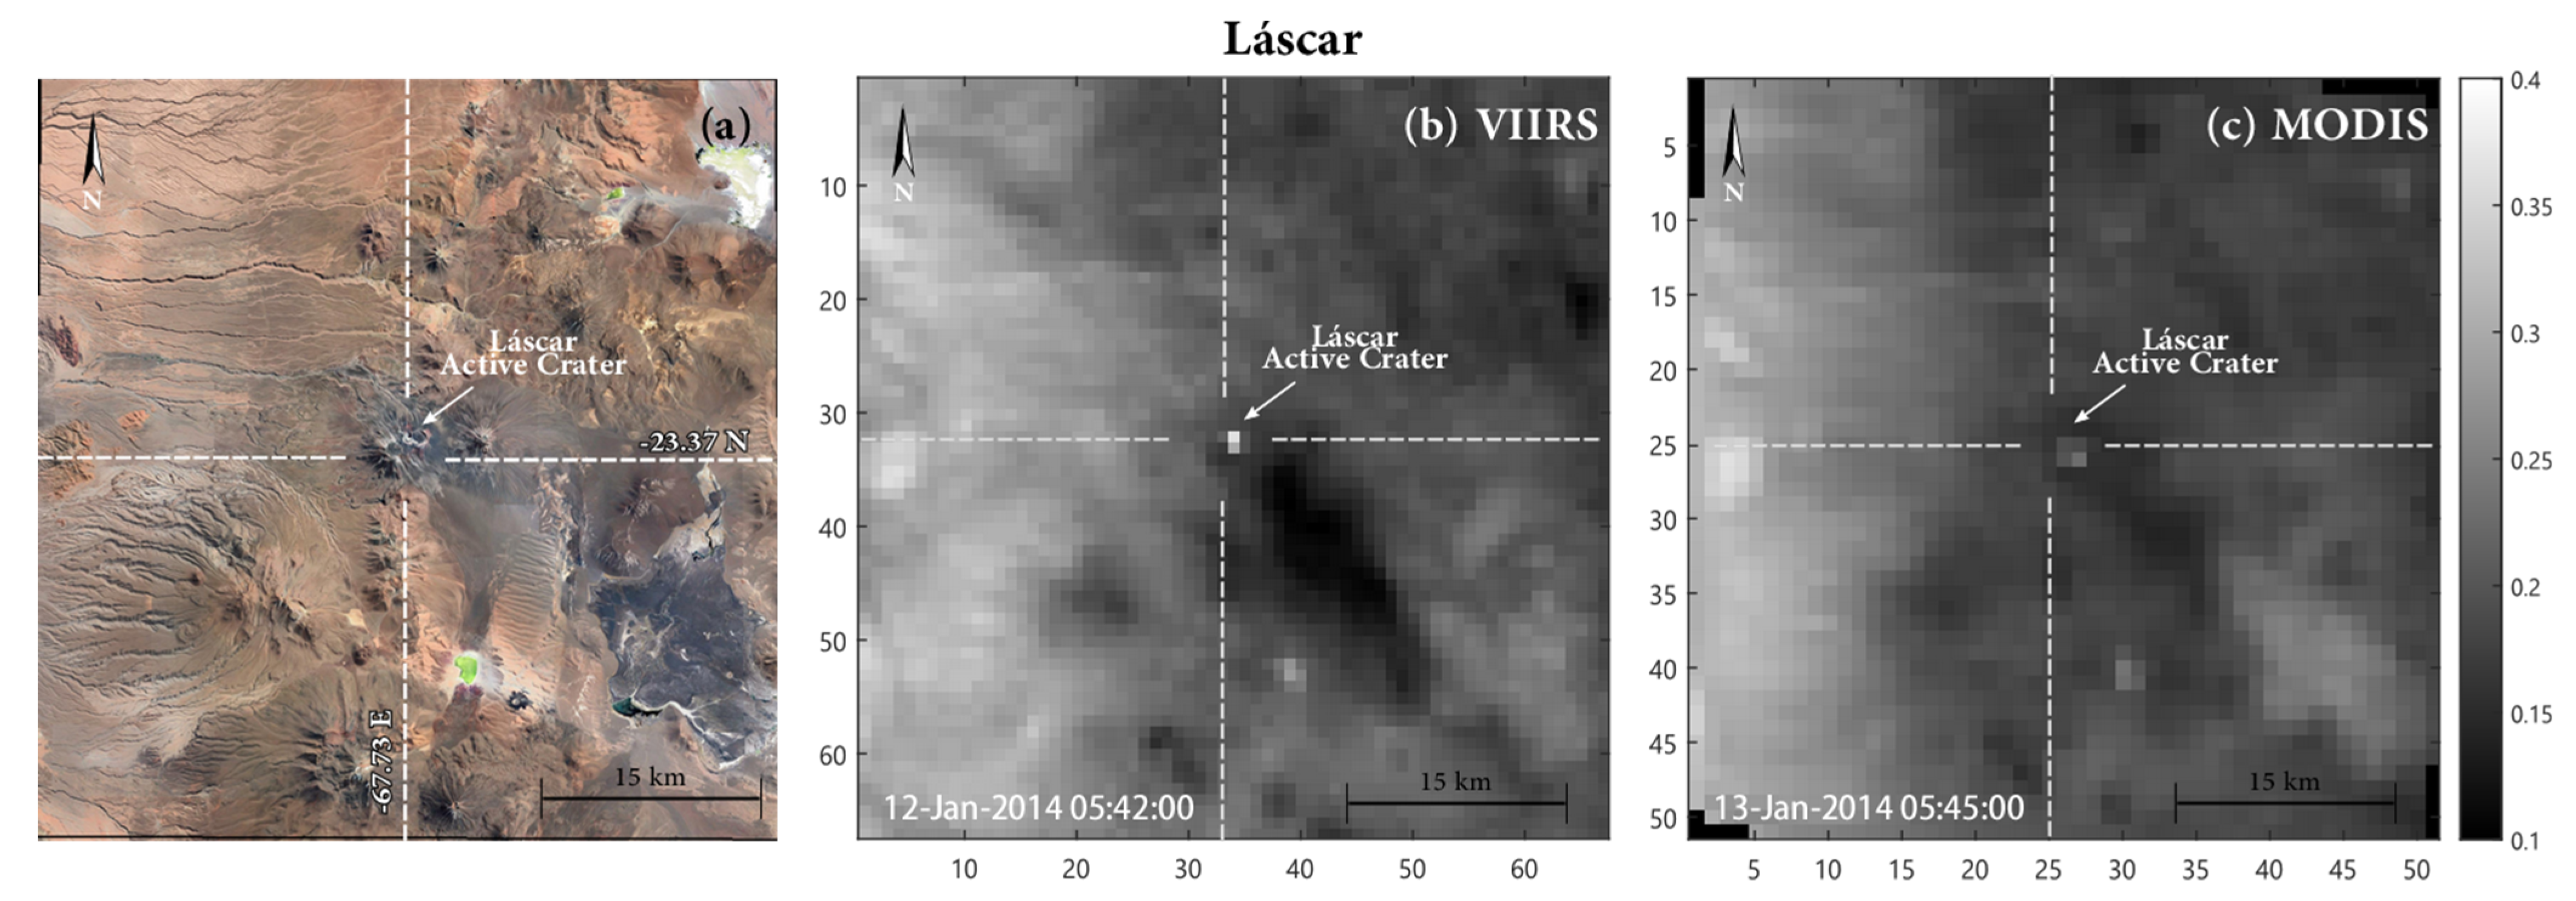
2.1. Láscar
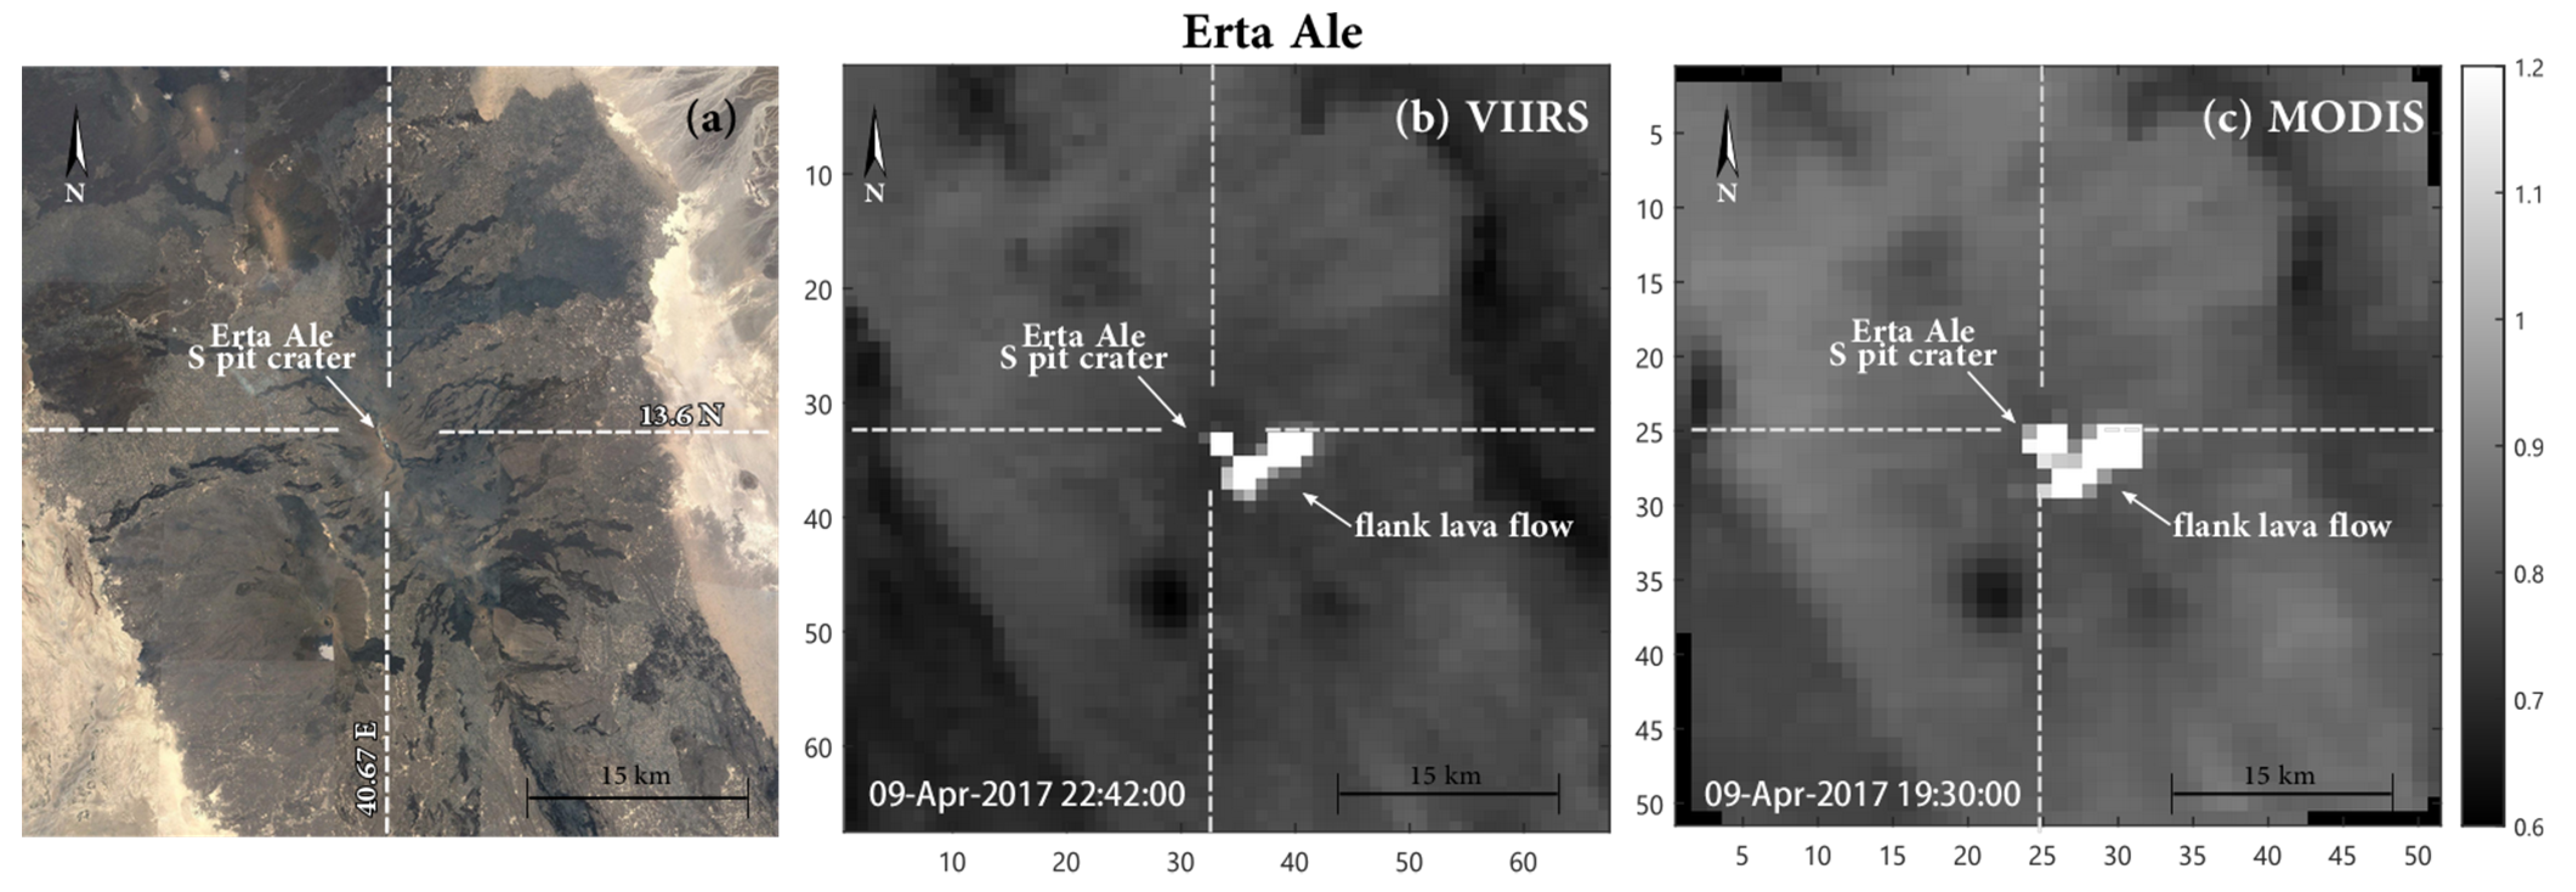
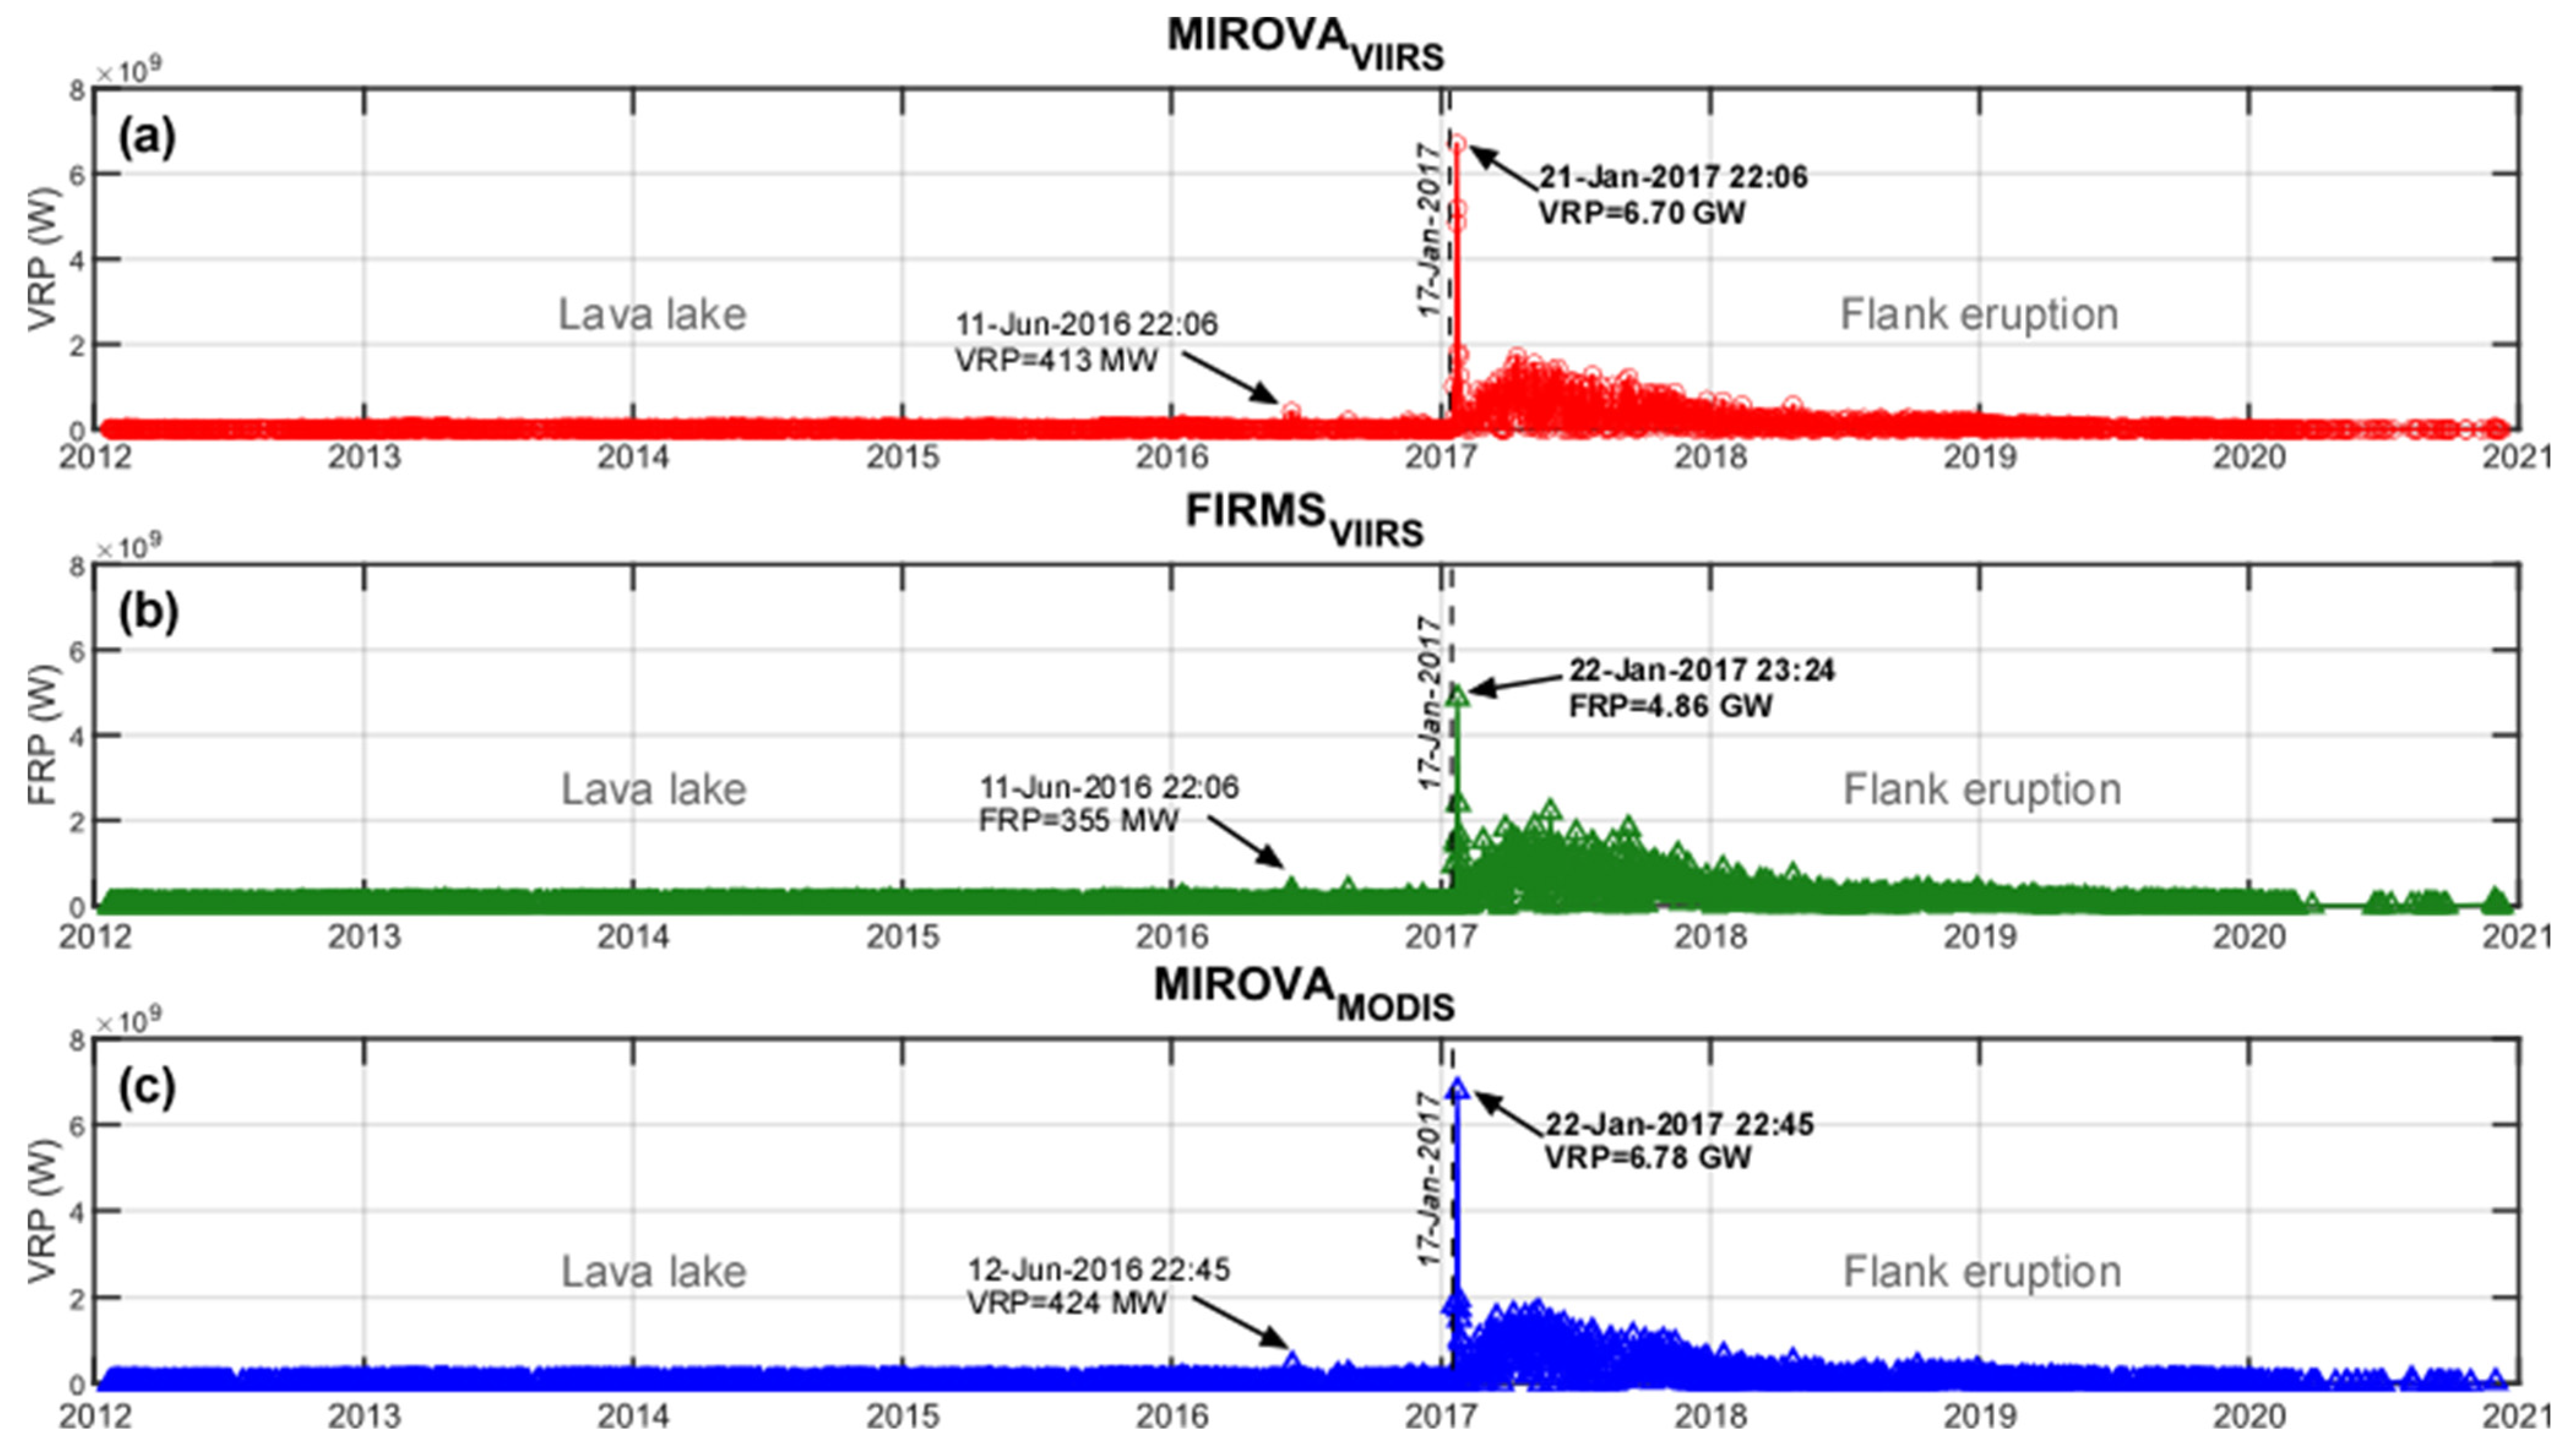
2.2. Erta Ale
3. Materials and Methods
3.1. Sensor and Products
3.2. MIROVA Algorithm and Calculation of Volcanic Radiative Power (VRP)
3.3. FIRMS Database and Fire Radiative Power (FRPFIRMS)
3.4. Uncertainties and Limits
4. Results
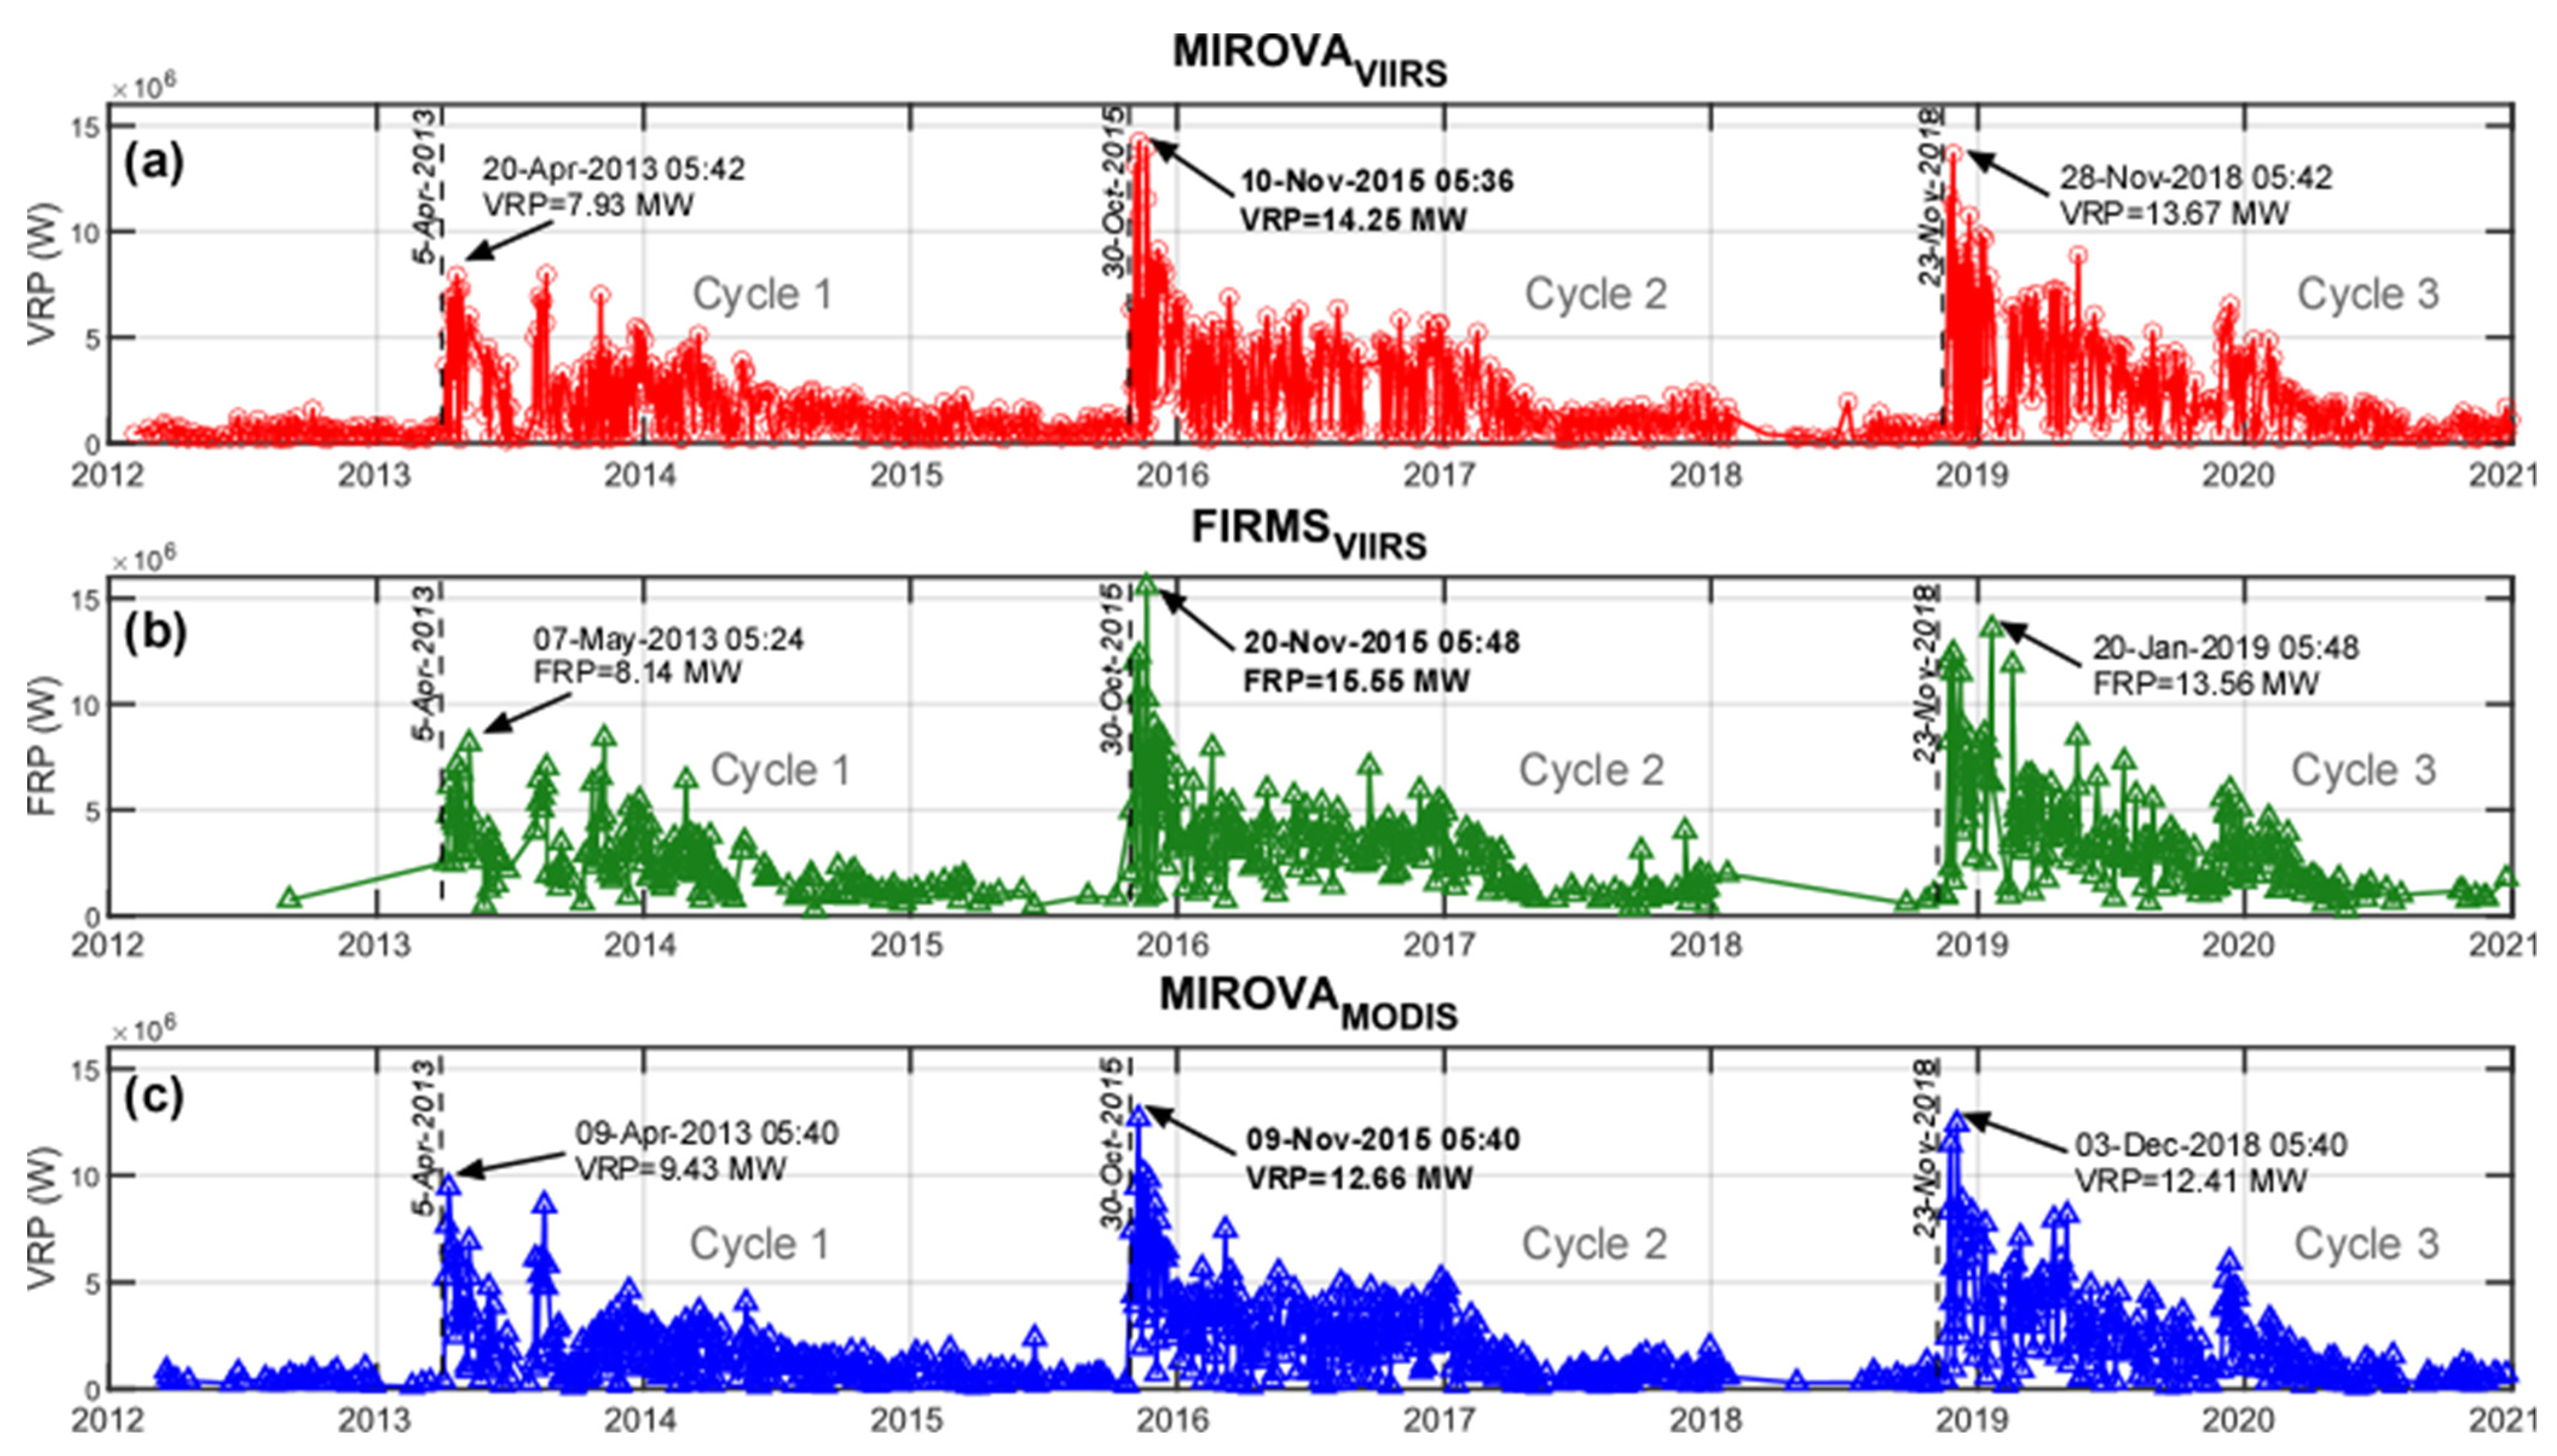
4.1. Láscar
4.2. Erta Ale
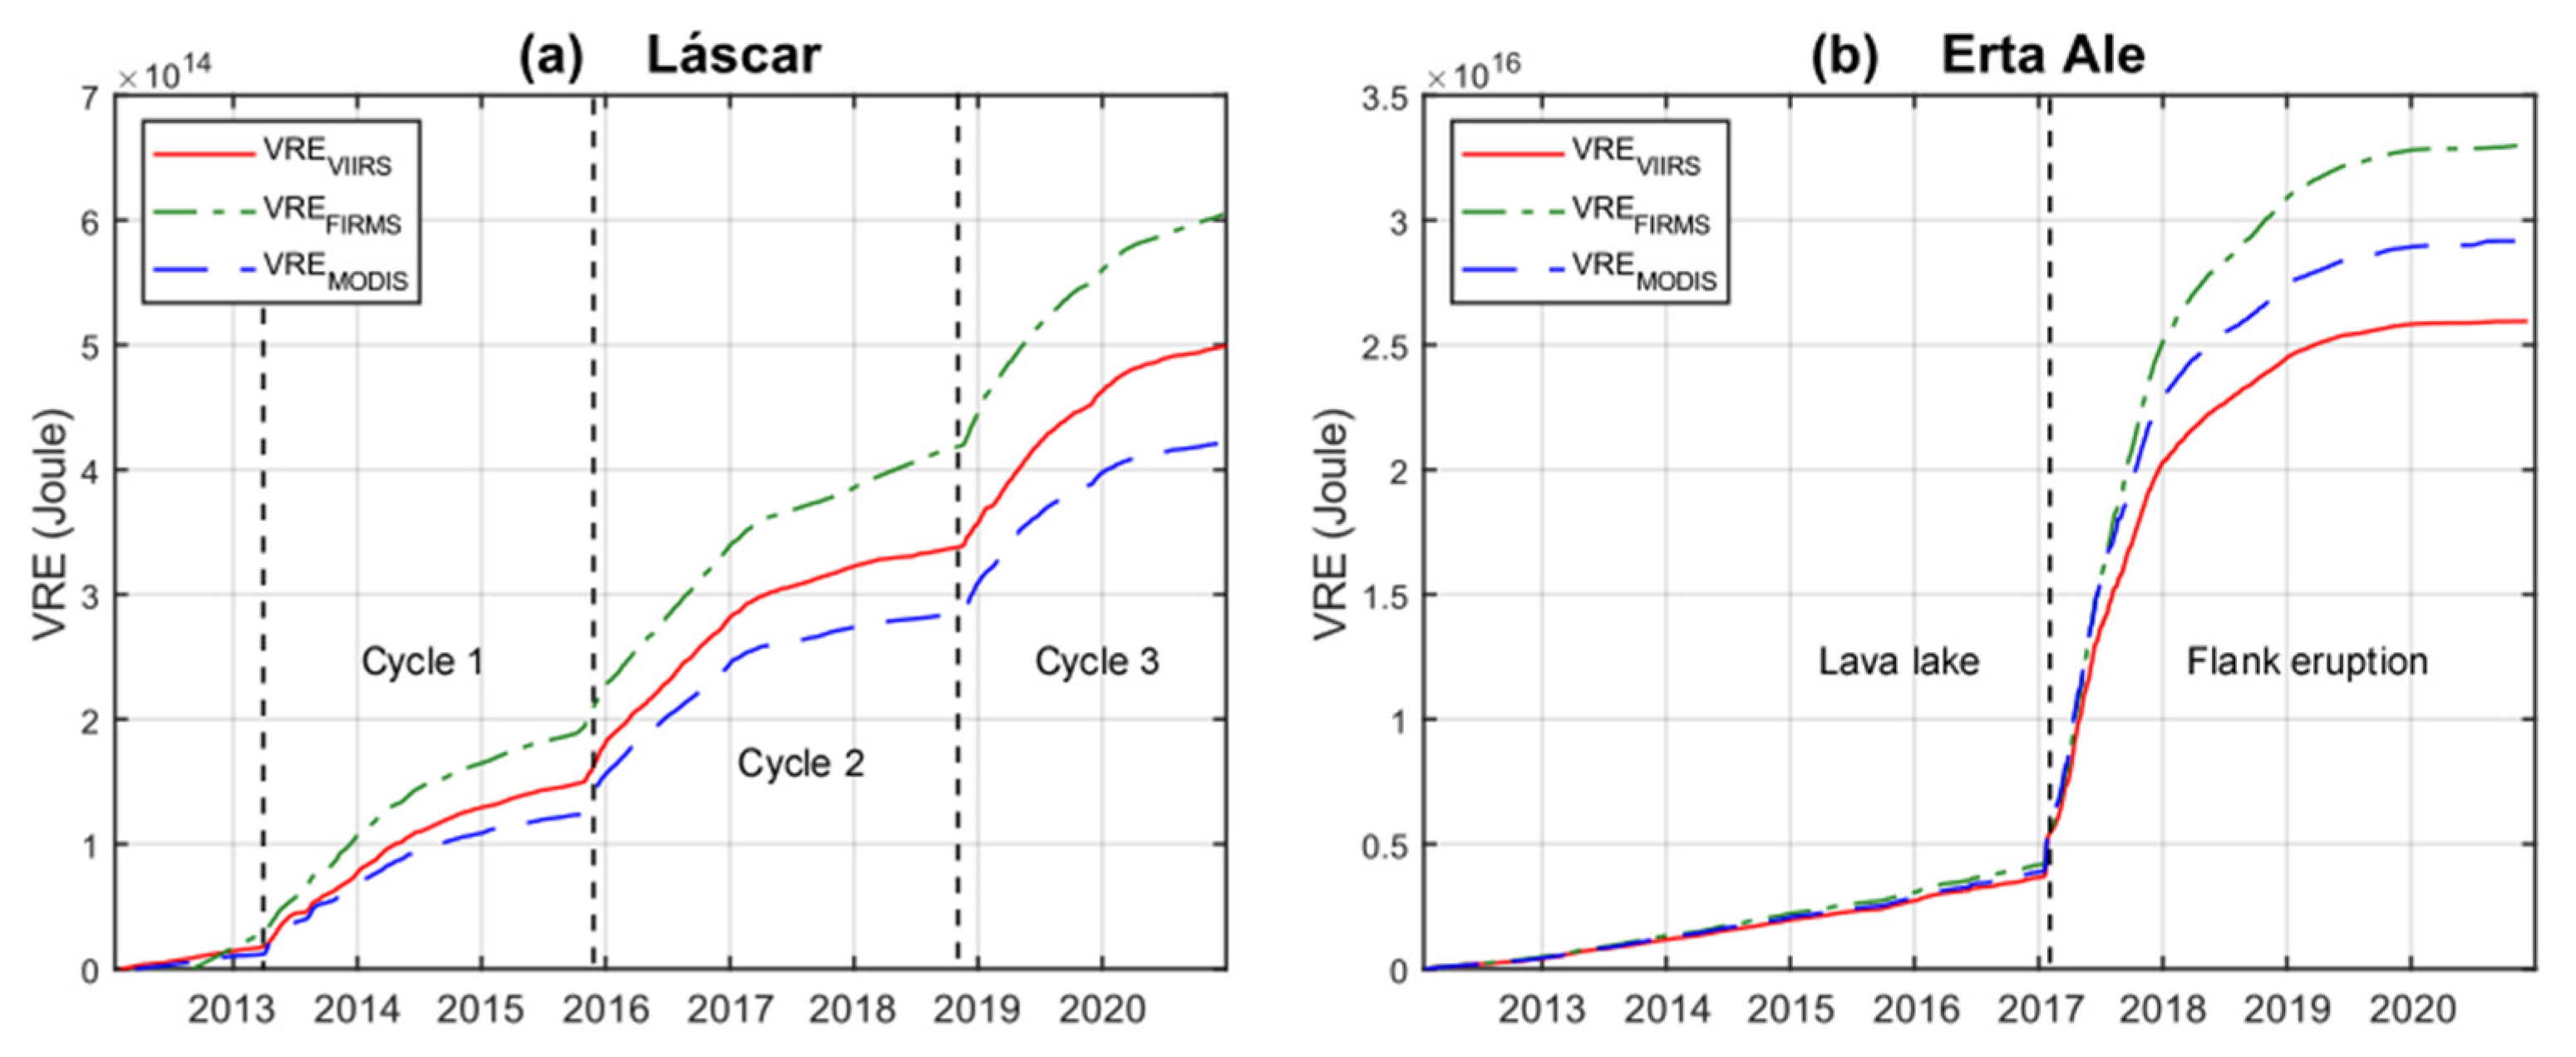
4.3. Cumulative Radiant Energy (VRE) Calculation via VRP Datasets
5. Toward Global Volcano Thermal Monitoring Using VIIRS
6. Conclusions
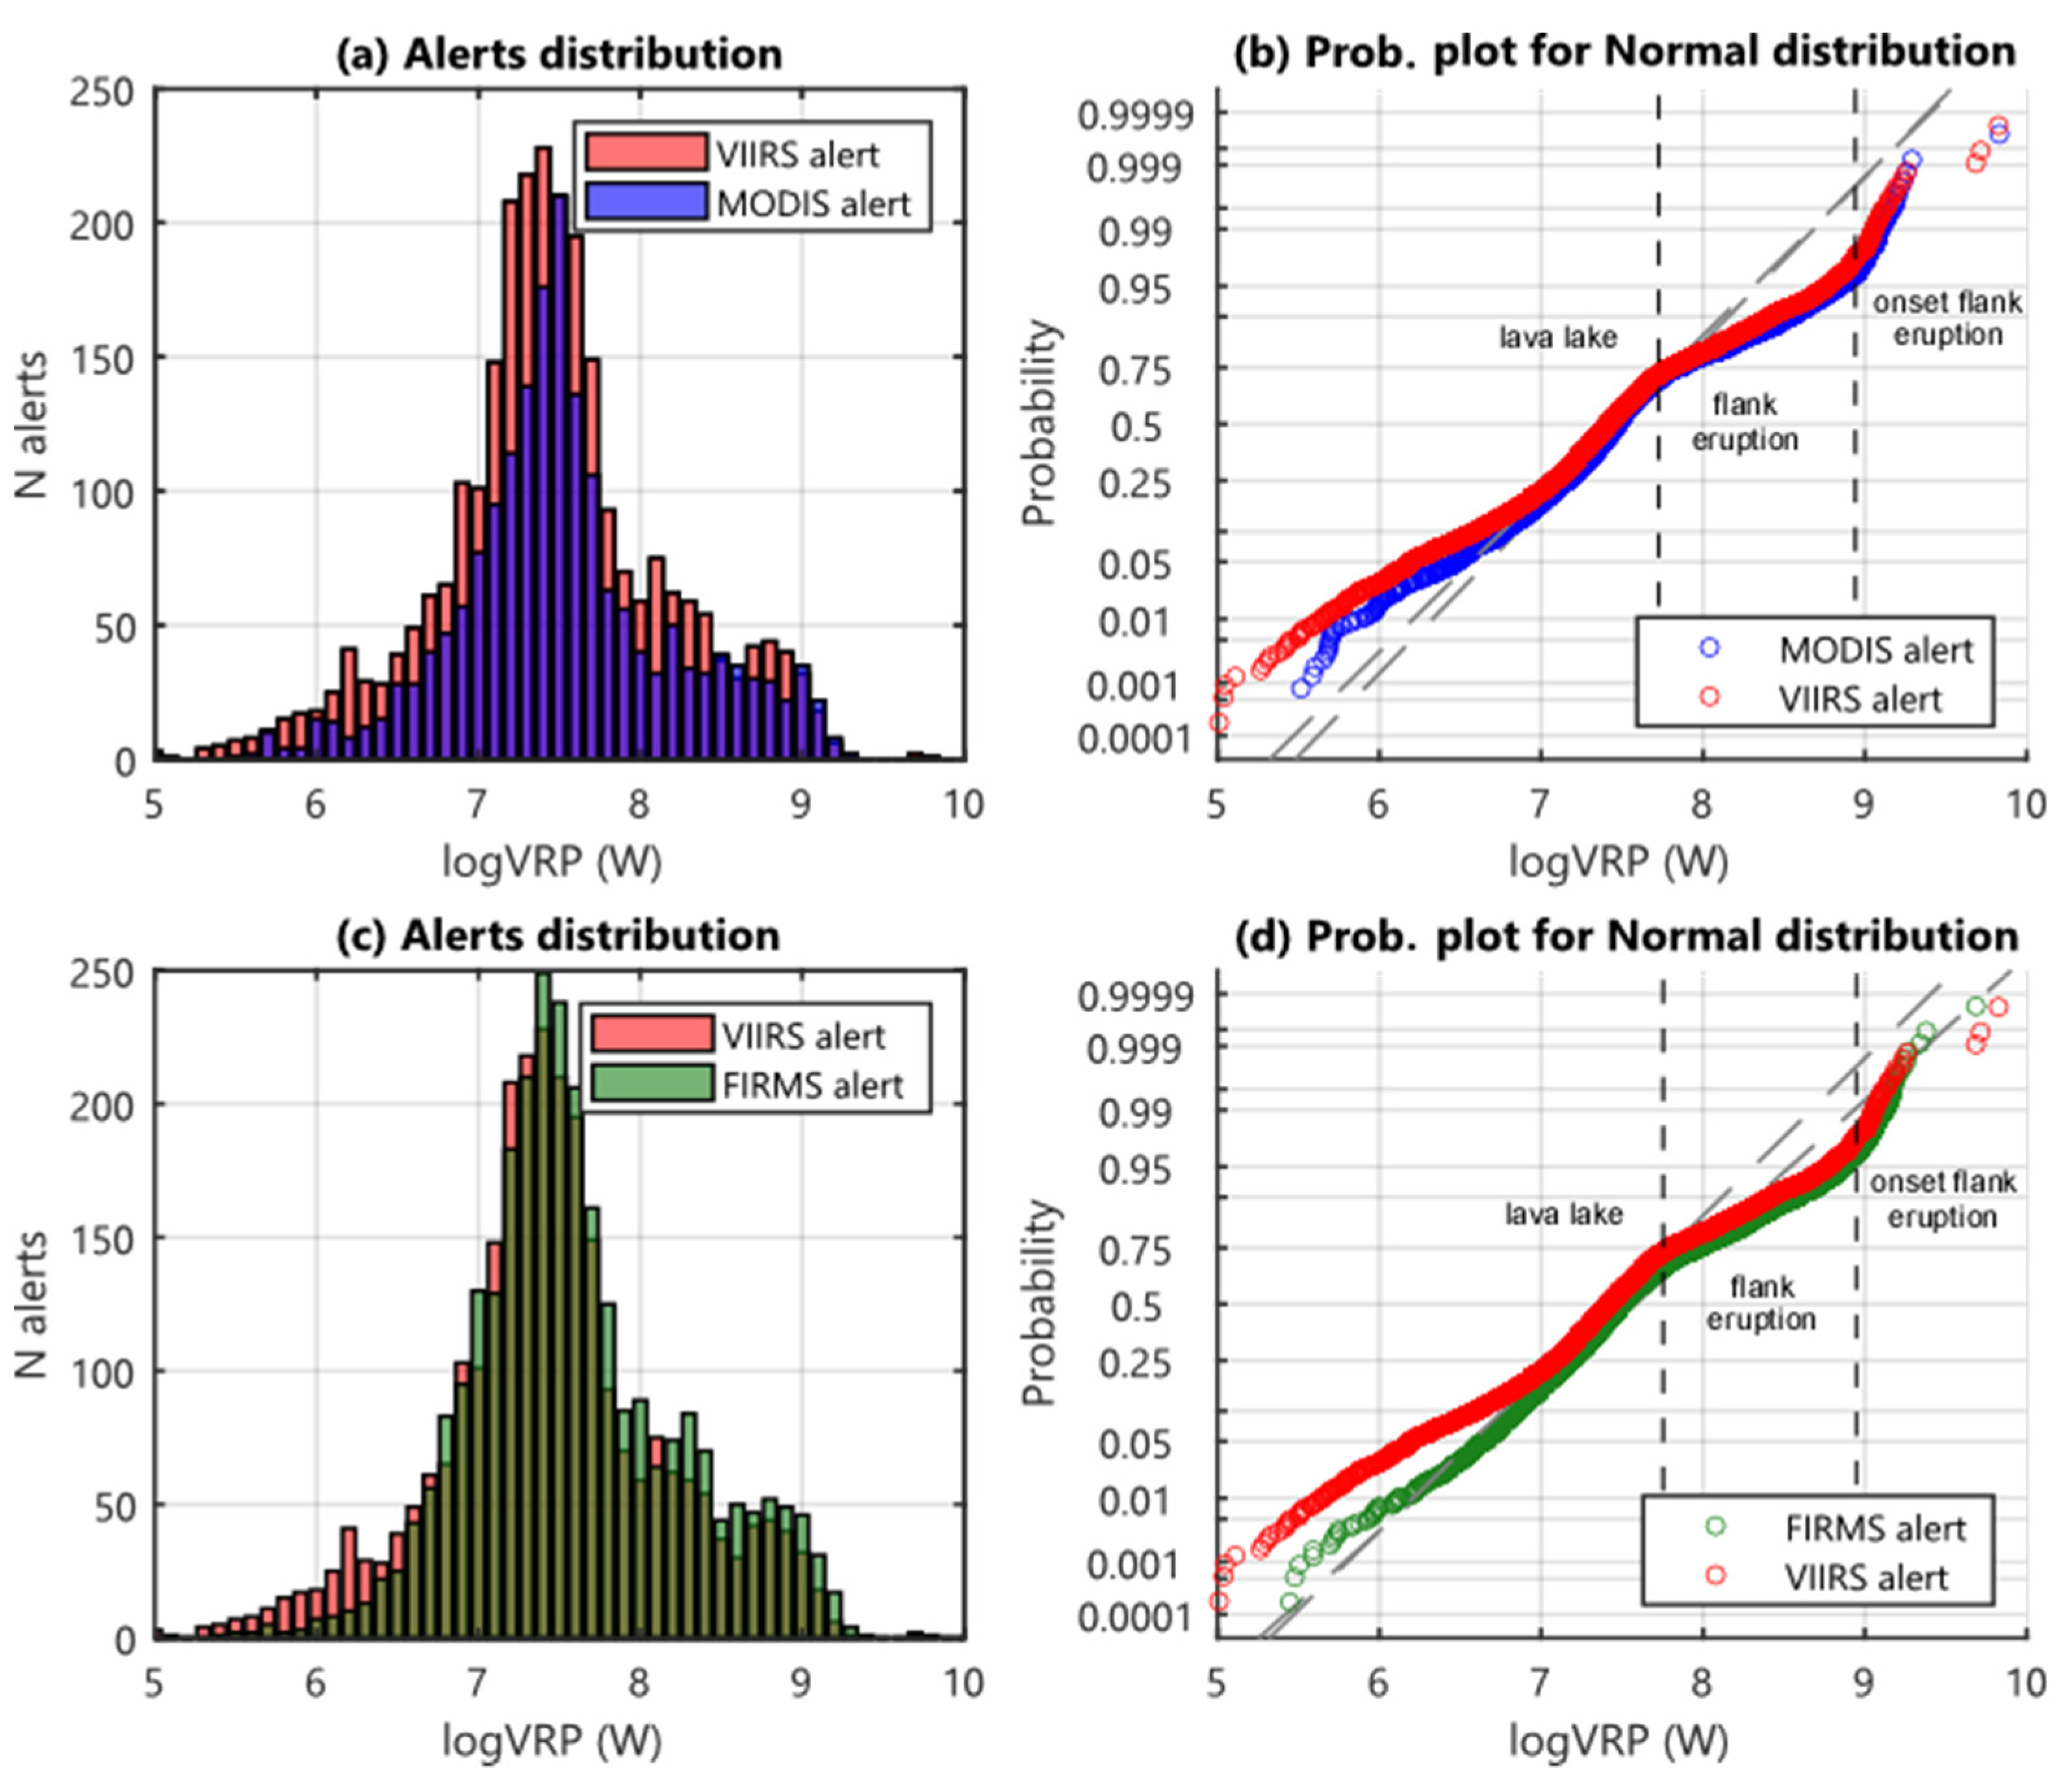
- by using the MIROVA algorithm, the VIIRS sensor detects ~40% more alerts than MODIS (on average). This difference is likely due to the greater number of VIIRS overpasses, compared to MODIS (+29% on average), but also to a better quality of the VIIRS images which make the hot-spot detection more efficient (e.g., better spatial resolution, better pixel aggregation at high satellite zenith angle, less NEdT);
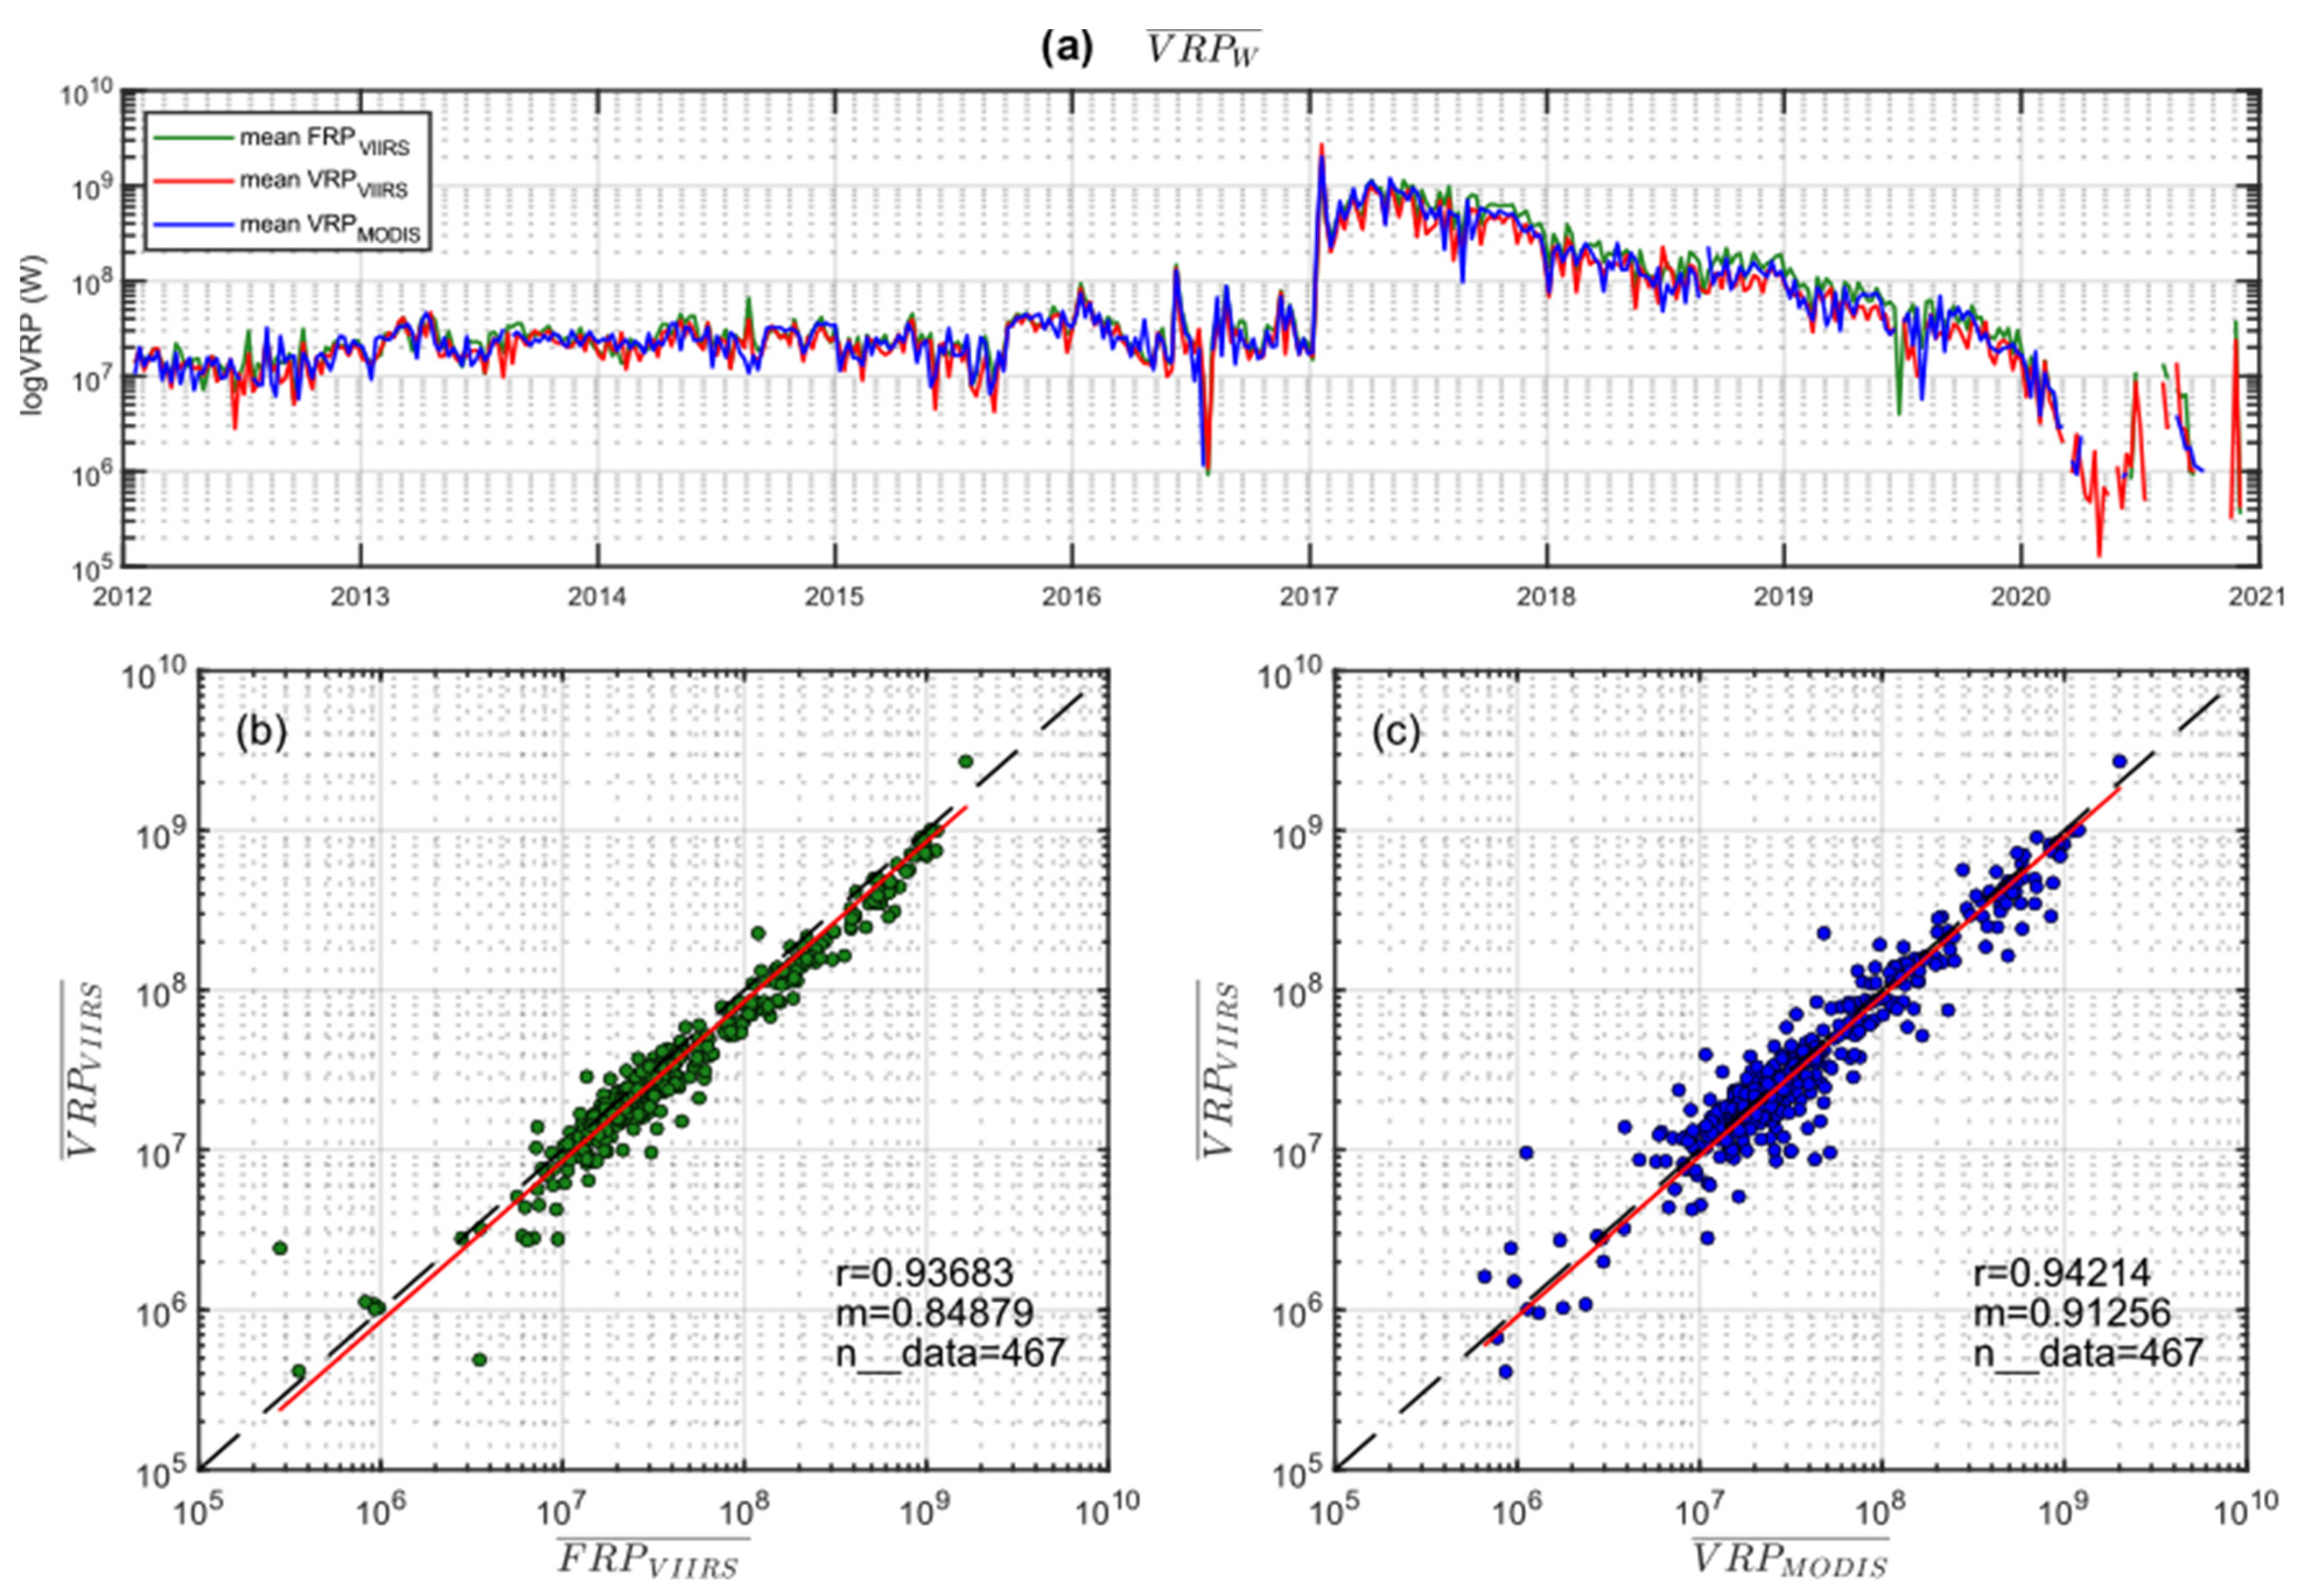
- the two MIROVA-derived datasets are highly correlated each other (r = 0.81–0.94 for Láscar and Erta Ale, respectively) and show a best-fit linear coefficient (m = VRPVIIRS/VRPMODIS) around the 1:1 ratio, ranging from 0.91 (Erta Ale) to 1.05 (Láscar); the two datasets are also comparable in terms of VRP distributions (modal value ±5%), the timing of major events (within 24 h), and cumulative radiant energy (±18%);
- the comparison of the VIIRS data processed with FIRMS algorithms instead reveals a better ability of the MIROVA algorithm to detect small thermal anomalies (<10 MW). At volcanoes characterized by low-amplitude thermal anomalies (such as Láscar), this difference translates into an increase of up to 95% of the number of alerts detected by MIROVAVIIRS compared to the FIRMSVIIRS. On the other hand, the two algorithms, appear to be equally efficient on volcanoes characterized by a more intense thermal activity (e.g., Erta Ale);
- regardless of the frequency of detections the VRP time series retrieved from MIROVAVIIRS and FIRMSVIIRS are highly correlated (r = 0.87 to 0.94) and show a best-fit linear regression coefficient (m = VRPVIIRS/FRPFIRMS) equal to 0.90 (Láscar) and 0.84 (Erta Ale);
Supplementary Materials
Author Contributions
Funding
Institutional Review Board Statement
Informed Consent Statement
Data Availability Statement
Acknowledgments
Conflicts of Interest
References
- Laiolo, M.; Coppola, D.; Barahona, F.; Benítez, J.E.; Cigolini, C.; Escobar, D.; Funes, R.; Gutierrez, E.; Henriquez, B.; Hernandez, A.; et al. Evidences of volcanic unrest on high-temperature fumaroles by satellite thermal monitoring: The case of Santa Ana volcano, El Salvador. J. Volcanol. Geotherm. Res. 2017, 340, 170–179. [Google Scholar] [CrossRef][Green Version]
- Furtney, M.A.; Pritchard, M.E.; Biggs, J.; Carn, S.A.; Ebmeier, S.K.; Jay, J.A.; McCormick Kilbride, B.T.; Reath, K.A. Synthesizing multi-sensor, multi-satellite, multi-decadal datasets for global volcano monitoring. J. Volcanol. Geotherm. Res. 2018, 365, 38–56. [Google Scholar] [CrossRef]
- Reath, K.; Pritchard, M.; Poland, M.; Delgado, F.; Carn, S.; Coppola, D.; Andrews, B.; Ebmeier, S.K.; Rumpf, E.; Henderson, S.; et al. Thermal, deformation, and Degassing remote Sensing time Series (CE 2000–2017) at the 47 most active volcanoes in Latin AMERICA: Implications for volcanic systems. J. Geophys. Res. Solid Earth 2019, 124, 195–218. [Google Scholar] [CrossRef]
- Girona, T.; Realmuto, V.; Lundgren, P. Large-scale thermal unrest of volcanoes for years prior to eruption. Nat. Geosci. 2021, 14, 238–241. [Google Scholar] [CrossRef]
- Ramsey, M.; Harris, A.J.L. How will thermal remote sensing of volcanic surface activity evolve over the next decade? J. Volcanol. Geotherm. Res. 2013, 249, 217–233. [Google Scholar] [CrossRef]
- Laiolo, M.; Massimetti, F.; Cigolini, C.; Ripepe, M.; Coppola, D. Long-term eruptive trends from space-based thermal and SO2 emissions: A comparative analysis of Stromboli, Batu Tara and Tinakula volcanoes. Bull. Volcanol. 2018, 80, 68. [Google Scholar] [CrossRef]
- Coppola, D.; Laiolo, M.; Cigolini, C.; Massimetti, F.; Delle Donne, D.; Ripepe, M.; Arias, H.; Barsotti, S.; Parra, C.B.; Centeno, R.G.; et al. Thermal Remote Sensing for Global Volcano Monitoring: Experiences from the MIROVA System. Front. Earth Sci. 2020, 7, 362. [Google Scholar] [CrossRef]
- Williams, R.S.; Friedman, J.D. Satellite observation of effusive volcanism. Br. Interplanet. Soc. J. 1970, 23, 441–450. [Google Scholar]
- Francis, P.W.; Rothery, D.A. Using the Landsat Thematic Mapper to detect and monitor active volcanoes: An example from Lascar volcano, northern Chile. Geology 1987, 15, 614–617. [Google Scholar] [CrossRef]
- Glaze, L.; Francis, P.W.; Rothery, D.A. Measuring thermal budgets of active volcanoes by satellite remote sensing. Nature 1989, 338, 144–146. [Google Scholar] [CrossRef]
- Wiesnet, D.R.; D’Aguanno, J. Thermal imagery of Mount Erebus from the NOAA-6 satellite. Antarct. J. US 1982, 17, 32–34. [Google Scholar]
- Harris, A.J.L.; Keszthelyi, L.; Flynn, L.P.; Mouginis-Mark, P.J.; Thornber, C.; Kauahikaua, J.; Sherrod, D.; Trusdell, F.; Sawyer, M.W.; Flament, P. Chronology of the Episode 54 eruption at Kilauea Volcano, Hawaii, from GOES-9 satellite data. Geophys. Res. Lett. 1997, 24, 3281–3284. [Google Scholar] [CrossRef]
- Pergola, N.; Marchese, F.; Tramutoli, V. Automated detection of thermal features of active volcanoes by means of infrared AVHRR records. Remote Sens. Environ. 2004, 93, 311–327. [Google Scholar] [CrossRef]
- Marchese, F.; Filizzola, C.; Genzano, N.; Mazzeo, G.; Prgola, N.; Tramutoli, V. Assesment and improvement of a robust satellite technique (RST) for thermal monitoring of volcanoes. Remote Sens. Environ. 2011, 115, 1556–1563. [Google Scholar] [CrossRef]
- Lombardo, V. AVHotRR: Near-real time routine for volcano monitoring using IR satellite data. Geol. Soc. Lond. Spec. Publ. 2015, 426, 72–93. [Google Scholar] [CrossRef]
- Harris, A. Thermal Remote Sensing of Active Volcanoes: A User’s Manual; Cambridge University Press: Cambridge, UK, 2013; p. 728. [Google Scholar]
- Harris, A.J.L.; Pilger, E.; Flynn, L.P.; Garbeil, H.; Mouginis-Mark, P.J.; Kauahikaua, J.; Thornber, C. Automated, high temporal resolution, thermal analysis of Kilauea volcano, Hawaii, using GOES-9 satellite data. Int. J. Remote Sens. 2001, 22, 945–967. [Google Scholar] [CrossRef]
- Harris, A.; Steffke, A.; Calvari, S.; Spampinato, L. Thirty years of satellite-derived lava discharge rates at Etna: Implications for steady volumetric output. J. Geophys. Res. 2011, 116, B08204. [Google Scholar] [CrossRef]
- Ramsey, M.S.; Flynn, I.T.W. The Spatial and Spectral Resolution of ASTER Infrared Image Data: A Paradigm Shift in Volcanological Remote Sensing. Remote Sens. 2020, 12, 738. [Google Scholar] [CrossRef]
- Wright, R.; Flynn, L.P.; Garbeil, H.; Harris, A.J.L.; Pilger, E. Automated volcanic eruption detection using MODIS. Remote Sens. Environ. 2002, 82, 135–155. [Google Scholar] [CrossRef]
- Wright, R.; Flynn, L.P.; Garbeil, H.; Harris, A.J.L.; Pilger, E. MODVOLC: Near-real-time thermal monitoring of global volcanism. J. Volcanol. Geotherm. Res. 2004, 135, 29–49. [Google Scholar] [CrossRef]
- Steffke, A.M.; Harris, A.J.L. A review of algorithms for detecting volcanic hot spots in satellite infrared data. Bull. Volcanol. 2011, 73, 1109–1137. [Google Scholar] [CrossRef]
- Kervyn de Meerendre, M.; Harris, A.J.L.; Belton, F.; Mbede, E.; Jacobs, P.; Ernst, G.G.J. MODLEN: A semi-automated algorithm for monitoring small-scale thermal activity al Oldoinyo Lengai Volcano, Tanzania. In Proceedings of the AMG ’06. Quantitative Geology from Multiple Sources, Association Mathematical Geology, XI Annual Conference, Liege, Belgium, 3–8 September 2006. [Google Scholar]
- Harris, A.J.L.; Swabey, S.E.J.; Higgins, J. Automated thresholding of active lavas using AVHRR data. Int. J. Remote Sens. 1995, 16, 3681–3686. [Google Scholar] [CrossRef]
- Higgins, J.; Harris, A.J.L. VAST: A program to locate and analyse volcanic thermal anomalies automatically from remote sensed data. Comput. Geosci. 1997, 3, 627–645. [Google Scholar] [CrossRef]
- Dean, K.; Servilla, M.; Roach, A.; Foster, B.; Engle, K. Satellite monitoring of remote volcanoes improves study efforts in Alaska. Eos Trans. Am. Geophys. Union 1998, 79, 413–423. [Google Scholar] [CrossRef]
- Hirn, B.; Di Bartola, C.; Ferrucci, F. Spaceborne Monitoring 2000–2005 of the Pu’u ‘O’o-Kupaianaha (Hawaii) Eruption by Synergetic Merge of Multispectral Payloads ASTER and MODIS. IEEE Trans. Geosci. Remote Sens. 2008, 46, 2848–2856. [Google Scholar] [CrossRef]
- Coppola, D.; Laiolo, M.; Cigolini, C.; Delle Donne, D.; Ripepe, M. Enhanced volcanic hot-spot detection using MODIS IR data: Results from the MIROVA system. Geol. Soc. Lond. Spec. Publ. 2016, 426, 181–205. [Google Scholar] [CrossRef]
- Wright, R.; Blackett, M.; Hill-Butler, C. Some observations regarding the thermal flux from Earth’s erupting volcanoes for the period of 2000 to 2014. Geophys. Res. Lett. 2015, 42, 282–289. [Google Scholar] [CrossRef]
- Coppola, D.; Laiolo, M.; Piscopo, D.; Cigolini, C. Rheological control on the radiant density of active lava flows and domes. J. Volcanol. Geotherm. Res. 2013, 249, 39–48. [Google Scholar] [CrossRef]
- Wooster, M.J.; Zhukov, B.; Oertel, D. Fire radiative energy for quantitative study of biomass burning: Derivation from the BIRD experimental satellite and comparison to MODIS fire products. Remote Sens. Environ. 2003, 86, 83–107. [Google Scholar] [CrossRef]
- Wright, R.; Pilger, E. Radiant flux from Earth’s subaerially erupting volcanoes. Int. J. Remote Sens. 2008, 29, 6443–6466. [Google Scholar] [CrossRef]
- Coppola, D.; Piscopo, D.; Laiolo, M.; Cigolini, C.; Delle Donne, D.; Ripepe, M. Radiative heat power at Stromboli volcano during 2000–2011: Twelve years of MODIS observations. J. Volcanol. Geotherm. Res. 2012, 215–216, 48–60. [Google Scholar] [CrossRef]
- Harris, A.J.L.; Villeneuve, N.; Di Muro, A.; Ferrazzini, V.; Peltier, A.; Coppola, D.; Favalli, M.; Bachèlery, P.; Froger, J.-L.; Gurioli, L.; et al. Effusive crises at Piton de la Fournaise 2014–2015: A review of a multi-national response model. J. Appl. Volcanol. 2017, 6, 11. [Google Scholar] [CrossRef]
- Naismith, A.K.; Watson, I.M.; Escobar-Wolf, R.; Chigna, G.; Thomas, H.; Coppola, D.; Chun, C. Eruption frequency patterns through time for the current (1999–2018) activity cycle at Volcán de Fuego derived from remote sensing data: Evidence for an accelerating cycle of explosive paroxysms and potential implications of eruptive activity. J. Volcanol. Geotherm. Res. 2019, 371, 206–219. [Google Scholar] [CrossRef]
- Gouhier, M.; Guéhenneux, Y.; Labazuy, P.; Cacault, P.; Decriem, J.; Rivet, S. HOTVOLC: A web-based monitoring system for volcanic hot spots. Geol. Soc. Lond. Spec. Publ. 2016, 426, 223–241. [Google Scholar] [CrossRef]
- Ganci, G.; Bilotta, G.; Cappello, A.; Herault, A.; Del Negro, C. HOTSAT: A multiplatform system for the thermal monitoring of volcanic activity using satellite data. Ann. Geophys. 2011, 54, 5. [Google Scholar] [CrossRef]
- Bonny, E.; Wright, R. Predicting the end of lava flow-forming eruptions from space. Bull. Volcanol. 2017, 79, 52. [Google Scholar] [CrossRef]
- Coppola, D.; Di Muro, A.; Peltier, A.; Villeneuve, N.; Ferrazzini, V.; Favalli, M.; Bachèlery, P.; Gurioli, L.; Harris, A.J.L.; Moune, S.; et al. Shallow system rejuvenation and magma discharge trends at Piton de la Fournaise volcano (La Réunion Island). Earth Planet. Sci. Lett. 2017, 463, 13–24. [Google Scholar] [CrossRef]
- Coppola, D.; Laiolo, M.; Massimetti, F.; Hainzl, S.; Shevchenko, A.V.; Mania, R.; Shapiro, N.M.; Walter, T.R. Thermal remote sensing reveals communication between volcanoes of the Klyuchevskoy Volcanic Group. Sci. Rep. 2021, 11, 13090. [Google Scholar] [CrossRef]
- Schneider, F.D.; Ferraz, A.; Schimel, D. Watching Earth’s interconnected systems at work. Eos 2019, 100. [Google Scholar] [CrossRef]
- Cawse-Nicholson, K.; Townsend, P.A.B.; Schimel, D.; Assiri, A.M.C.; Blake, P.L.D.; Buongiorno, M.F.E.; Campbell, P.F.; Carmon, N.A.; Casey, K.A.G.; Correa-Pabón, R.E.I.; et al. NASA’s surface biology and geology designated observable: A perspective on surface imaging algorithms. Remote Sens. Environ. 2021, 257, 112349. [Google Scholar] [CrossRef]
- MODIS Design. Available online: https://modis.gsfc.nasa.gov/about/design.php (accessed on 18 November 2021).
- Aqua Summary. Available online: https://aqua.nasa.gov/sites/default/files/AquaStatus_September2021.pdf (accessed on 18 November 2021).
- Cao, C.; Xiong, X.; Wolfe, R.; DeLuccia, F.; Liu, Q.; Blonski, S.; Lin, G.; Nishihama, M.; Pogorzala, D.; Oudrari, H.; et al. Visible Infrared Imaging Radiometer Suite (VIIRS) Sensor Data Record (SDR) User’s Guide, Version 1.3; NOAA Technical Report NESDIS; NESDIS: College Park, MD, USA, 2017.
- Ramsey, M.S.; Harris, A.J.L.; Watson, I.M. Volcanology 2030: Will an orbital volcano observatory finally become a reality? Bull. Volcanol. 2022, 84, 6. [Google Scholar] [CrossRef]
- Li, F.; Zhang, X.; Kondragunta, S.; Csiszar, I. Comparison of fire radiative power estimates from VIIRS and MODIS observations. J. Geophys. Res. Atmos. 2018, 123, 4545–4563. [Google Scholar] [CrossRef]
- FIRMS. Fire Information for Resource Management System. Available online: https://firms.modaps.eosdis.nasa.gov/ (accessed on 10 January 2022).
- Blackett, M. An initial comparison of the thermal anomaly detection products of MODIS and VIIRS in their observation of Indonesian volcanic activity. Remote Sens. Environ. 2015, 171, 75–82. [Google Scholar] [CrossRef]
- Plank, S.; Marchese, F.; Filizzola, C.; Pergola, N.; Neri, M.; Nolde, M.; Martinis, S. The July/August lava flows at the Sciara del Fuoco, Stromboli—Analysis from multi-sensor infrared satellite imagery. Remote Sens. 2019, 11, 2879. [Google Scholar] [CrossRef]
- Plank, S.; Massimetti, F.; Soldati, A.; Hess, K.; Nolde, M.; Martinis, S.; Dingwell, D.B. Estimates of lava discharge rate of 2018 Kīlauea Volcano, Hawai‘i eruption using multi-sensor satellite and laboratory measurements. Int. J. Remote Sens. 2021, 42, 1492–1511. [Google Scholar] [CrossRef]
- Trifonov, M.; Zhizhin, M.N.; Melnikov, D.V.; Poyda, A.A. VIIRS Nightfire remote sensing volcanoes. In Proceedings of the 6th International Young Scientists Conference in HPC and Simulation, YSC 2017, Kotka, Finland, 1–3 November 2017. [Google Scholar]
- Gordeev, E.I.; Girina, O.A.; Lupyan, E.A.; Sorokin, A.A.; Kramareva, L.S.; Efremov, V.Y.; Kashnitskii, A.V.; Uvarov, I.A.; Burtsev, M.A.; Romanova, I.M.; et al. The VolSatView information system for monitoring the volcanic activity in Kamchatka and on the Kuril Islands. J. Volcanol. Seismol. 2016, 10, 382–394. [Google Scholar] [CrossRef]
- Genzano, N.; Pergola, N.; Marcese, F. A Google Earth Engine Tool to Investigate, Map and Monitor Volcanic Thermal Anomalies at Global Scale by Means of Mid-High Spatial Resolution Satellite Data. Remote Sens. 2020, 12, 3232. [Google Scholar] [CrossRef]
- MIROVA. Available online: https://www.mirovaweb.it/ (accessed on 20 January 2022).
- Schroeder, W.; Giglio, L. Visible Infrared Imaging Radiometer Suite (VIIRS) 750 m Active Fire Detection and Characterization Algorithm Theoretical Basis Document 1.0. September 2017. Available online: https://viirsland.gsfc.nasa.gov/PDF/VIIRS_activefire_750m_ATBD.pdf (accessed on 23 January 2022).
- Jordan, T.E.; Isacks, B.L.; Allmendinger, R.W.; Brewer, J.A.; Ramos, V.A.; Ando, C.J. Andean tectonics related to geometry of subducted Nazca plate. Geol. Soc. Am. Bull. 1983, 94, 341–361. [Google Scholar] [CrossRef]
- Gardeweg, M.C.; Sparks, R.S.J.; Matthews, S.J. Evolution of Láscar volcano, Northern Chile. J. Geol. Soc. 1998, 155, 84–104. [Google Scholar] [CrossRef]
- Tassi, F.; Aguilera, F.; Vaselli, O.; Medina, E.; Tedesco, D.; Delgado Huertas, A.; Poreda, R.; Kojima, S. The magmatic- and hydrothermal-dominated fumarolic system at the Active Crater of Lascar volcano, northern Chile. Bull. Volcanol. 2009, 71, 171–183. [Google Scholar] [CrossRef]
- De Zeeuw-van Dalfsen, E.; Richter, N.; González, G.; Walter, T.R. Geomorphology and structural development of the nested summit crater of Láscar Volcano studied with Terrestrial Laser Scanner data analogue modelling. J. Volcanol. Geotherm. Res. 2017, 329, 1–12. [Google Scholar] [CrossRef]
- Matthews, S.J.; Gardeweg, M.C.; Sparks, R.S.J. The 1984 to 1996 cyclic activity of Láscar volcano, Northern Chile: Cycles of dome growth, dome subsidence, degassing and explosive eruptions. Bull. Volcanol. 1997, 59, 72–82. [Google Scholar] [CrossRef]
- Global Volcanism Program. Report on Lascar (Chile); Venzke, E., Ed.; Bulletin of the Global Volcanism Network; Smithsonian Institution: Whashington, DC, USA, 1993; Volume 18. [Google Scholar] [CrossRef]
- Gaete, A.; Walter, T.R.; Bredemeyer, S.; Zimmer, M.; Kujawa, C.; Franco Marin, L.; San Martin, J.; Bucarey Parra, C. Processes culminating in the 2015 phreatic explosion at Lascar volcano, Chile, evidenced by multiparametric data. Nat. Hazards Earth Syst. Sci. 2020, 20, 377–397. [Google Scholar] [CrossRef]
- Global Volcanism Program. Report on Lascar (Chile); Crafford, A.E., Venzke, E., Eds.; Bulletin of the Global Volcanism Network; Smithsonian Institution: Whashington, DC, USA, 2017; Volume 42. [Google Scholar] [CrossRef]
- Layana, S.; Aguilera, F.; Rojo, G.; Vergara, Á.; Salazar, P.; Quispe, J.; Urra, P.; Urrutia, D. Volcanic Anomalies Monitoring System (VOLCANOMS), a Low-Cost Volcanic Monitoring System Based on Landsat Images. Remote Sens. 2020, 12, 1589. [Google Scholar] [CrossRef]
- Reporte de actividad volcánica. Region de Antofagasta. Available online: http://sitiohistorico.sernageomin.cl/lista-region-2.php (accessed on 18 November 2021).
- Oppenheimer, C.; Francis, P.W.; Rothery, D.A.; Carlton, R.W.T.; Glaze, L.S. Infrared Image Analysis of Volcanic Thermal Features: Lascar Volcano, Chile, 1984–1992. J. Geophys. Res. 1993, 98, 4269–4286. [Google Scholar] [CrossRef]
- Wooster, M.J.; Rothery, D.A. Thermal monitoring of Lascar Volcano, Chile, using infrared data from the along-track scanning radiometer: A 1992-1995 time series. Bull. Volcanol. 1997, 58, 566–579. [Google Scholar] [CrossRef]
- Wooster, M.J. Long-term infrared surveillance of Lascar Volcano: Contrasting activity cycles and cooling pyroclastics. Geophys. Res. Lett. 2001, 28, 847–850. [Google Scholar] [CrossRef]
- Aguilera, F. Contrasting styles of volcanic activity as observed by remote sensing: The cases of Lascar, Llaima and Villarrica volcanoes, Chile. In Proceedings of the 6th International Symposium on Andean Geodynamics, ISAG 2005, Barcelona, Spain, 12–14 September 2005. [Google Scholar]
- Menard, G.; Moune, S.; Vlastélic, I.; Aguilera, F.; Valade, S.; Bontemps, M.; González, R. Gas and aerosol emissions from Lascar volcano (Northern Chile): Insights into the origin of gases and their links with the volcanic activity. J. Volcanol. Geotherm. Res. 2014, 287, 51–67. [Google Scholar] [CrossRef]
- González, C.; Inostroza, M.; Aguilera, F.; González, R.; Viramonte, J.; Menzies, A. Heat and mass flux measurements using Landsat images from the 2000-2004 period, Lascar volcano, northern Chile. J. Volcanol. Geotherm. Res. 2015, 301, 277–292. [Google Scholar] [CrossRef]
- Reporte Especial de Actividad Volcánica (REAV). Región de Antofagasta. Available online: http://sitiohistorico.sernageomin.cl/reportesVolcanes/20130410030029305REAV_Antofagasta_2013_abril_10.pdf (accessed on 20 January 2022).
- Corti, G.; Bastow, I.D.; Keir, D.; Pagli, C.; Baker, E. Rift-Related Morphology of the Afar Depression. In Landscapes and Landforms of Ethiopia. World Geomorphological Landscapes; Billi, P., Ed.; Springer: Dordrecht, The Netherlands, 2015. [Google Scholar] [CrossRef]
- Pagli, C.; Wright, T.J.; Ebinger, C.; Yun, S.-H.; Cann, J.R.; Barnie, T.; Ayele, A. Shallow axial magma chamber at the slow spreading Erta Ale Ridge. Nat. Geosci. 2012, 5, 284–288. [Google Scholar] [CrossRef]
- Barnie, T.D.; Oppenheimer, C.; Pagli, C. Does the lava lake of Erta ‘Ale volcano respond to regional magmatic and tectonic events? An investigation using Earth Observation data. Geol. Soc. Lond. Spec. Publ. 2016, 420, 181–208. [Google Scholar] [CrossRef]
- Moore, C.; Wright, T.; Hooper, A.; Biggs, J. The 2017 eruption of Erta ‘Ale Volcano, Ethiopia: Insights into the shallow axial plumbing system of an incipient mid-ocean ridge. Geochem. Geophys. Geosystems 2019, 20, 5727–5743. [Google Scholar] [CrossRef]
- Barberi, F.; Varet, J. The Erta Ale volcanic range (Danakil Depression, northern Afar, Ethiopia). Bull. Volcanol. 1970, 34, 848–917. [Google Scholar] [CrossRef]
- Dainelli, G.; Marinelli, O. Vulcani attivi della Dancalia. Riv. Geog. Ital. 1907, 13, 261–270. [Google Scholar]
- Xu, W.; Xie, L.; Aoki, Y.; Rivalta, E.; Jónsson, S. Volcano-wide deformation after the 2017 Erta Ale dike intrusion, Ethiopia, observed with radar interferometry. J. Geophys. Res. Solid Earth 2020, 125, e2020JB019562. [Google Scholar] [CrossRef]
- Global Volcanism Program. Report on Erta Ale (Ethiopia). In Weekly Volcanic Activity Report, 25–31 January 2017; Sennert, S.K., Ed.; Smithsonian Institution and US Geological Survey: Whashington, DC, USA, 2017. [Google Scholar]
- Global Volcanism Program. Report on Erta Ale (Ethiopia); Bennis, K.L., Venzke, E., Eds.; Bulletin of the Global Volcanism Network; Smithsonian Institution: Whashington, DC, USA, 2020; Volume 45. [Google Scholar] [CrossRef]
- Massimetti, F.; Coppola, D.; Laiolo, M.; Valade, S.; Cigolini, C.; Ripepe, M. Volcanic Hot-Spot Detection Using SENTINEL-2: A Comparison with MODIS–MIROVA Thermal Data Series. Remote Sens. 2020, 12, 820. [Google Scholar] [CrossRef]
- Valade, S.; Ley, A.; Massimetti, F.; D’Hondt, O.; Laiolo, M.; Coppola, D.; Loibl, D.; Hellwich, O.; Walter, T.R. Towards Global Volcano Monitoring Using Multisensor Sentinel Missions and Artificial Intelligence: The MOUNTS Monitoring System. Remote Sens. 2019, 11, 1528. [Google Scholar] [CrossRef]
- Marchese, F.; Genzano, N.; Neri, M.; Falconieri, A.; Mazzeo, G.; Pergola, N. A Multi-Channel Algorithm for Mapping Volcanic Thermal Anomalies by Means of Sentinel-2 MSI and Landsat-8 OLI Data. Remote Sens. 2019, 11, 2876. [Google Scholar] [CrossRef]
- Global Volcanism Program. Report on Erta Ale (Ethiopia); Crafford, A.E., Venzke, E., Eds.; Bulletin of the Global Volcanism Network; Smithsonian Institution: Whashington, DC, USA, 2017; Volume 42. [Google Scholar] [CrossRef]
- Oppenheimer, C.; Francis, P. Remote sensing of heat, lava and fumarole emissions from Erta ‘Ale volcano, Ethiopia. Int. J. Remote Sens. 1997, 18, 1661–1692. [Google Scholar] [CrossRef]
- Field, L.; Barnie, T.; Blundy, J.; Brooker, R.A.; Keir, D.; Lewi, E.; Saunders, K. Integrated field, satellite and petrological observations of the November 2010 eruption of Erta Ale. Bull. Volcanol. 2012, 74, 2251–2271. [Google Scholar] [CrossRef]
- Goldberg, M. The Joint Polar Satellite System Overview. In Proceedings of the IGARSS 2018–2018 IEEE International Geoscience and Remote Sensing Symposium, Valencia, Spain, 22–27 July 2018. [Google Scholar]
- Xiong, X.; Oudrari, H.; McIntire, J.; Lei, N.; Chiang, K.; Angal, A. Initial Calibration Activities and Performance Assessments of NOAA-20 VIIRS. In Proceedings of the Earth Observing Missions and Sensors: Development, Implementation, and Characterization V, SPIE Asia-Pacific Remote Sensing, Honolulu, HI, USA, 23 October 2018. [Google Scholar] [CrossRef]
- NASA. Visible Infrared Imaging Radiometer Suite Level-1B Product User Guide; NASA Goddard Space Flight Center: Greenbelt, MD, USA, 2018.
- Cao, C.; De Luccia, F.J.; Xiong, X.; Wolfe, R.; Weng, F. Early on orbit performance of the visible infrared imaging radiometer suite onboard the Suomi National Polar-Orbiting Partnership (S-NPP) Satellite. IEEE Trans. Geosci. Remote Sens. 2014, 52, 1142–1156. [Google Scholar] [CrossRef]
- Justice, C.O.; Giglio, L.; Korontzi, S.; Owens, J.; Morisette, J.T.; Roy, D.; Descloitres, J.; Alleaume, S.; Petitcolin, F.; Kaufman, Y. The MODIS fire product. Remote Sens. Environ. 2002, 83, 244–262. [Google Scholar] [CrossRef]
- LAADS-DAAC. Available online: https://ladsweb.modaps.eosdis.nasa.gov/ (accessed on 18 November 2021).
- Schroeder, W.; Oliva, P.; Giglio, L.; Csiszar, I.A. The new VIIRS 375 m activefire detection data product: Algorithm description andinitial assessment. Remote Sens. Environ. 2014, 143, 85–96. [Google Scholar] [CrossRef]
- Rothery, D.A.; Coltelli, M.; Pirie, D.; Wooster, M.J.; Wright, R. Documenting surface magmatic activity at Mount Etna using ATSR remote sensing. Bull. Volcanol. 2001, 63, 387–397. [Google Scholar] [CrossRef]
- Coppola, D.; Laiolo, M.; Delle Donne, D.; Ripepe, M.; Cigolini, C. Hot-spot detection and characterization of strombolian activity from MODIS infrared data. Int. J. Remote Sens. 2014, 35, 3403–3426. [Google Scholar] [CrossRef]
- Coppola, D.; Laiolo, M.; Cigolini, C. Fifteen years of thermal activity at Vanuatu’s volcanoes (2000-2015) revealed by MIROVA. J. Volcanol. Geotherm. Res. 2015, 322, 6–19. [Google Scholar] [CrossRef]
- Calvari, S.; Bonaccorso, A.; Ganci, G. Anatomy of a Paroxysmal Lava Fountain at Etna Volcano: The Case of the 12 March 2021, Episode. Remote Sens. 2021, 13, 3052. [Google Scholar] [CrossRef]
- Marchese, F.; Filizzola, C.; Lacava, T.; Falconieri, A.; Faruolo, M.; Genzano, N.; Mazzeo, G.M.; Pietrapertosa, C.; Pergola, N.; Tramutoli, V.; et al. Mt. Etna Paroxysms of February-April 2021 Monitored and Quantified through a Multi-Platform Satellite Observing System. Remote Sens. 2021, 13, 3074. [Google Scholar] [CrossRef]
- Global Volcanism Program. Report on Nyiragongo (DR Congo); Bennis, K.L., Venzke, E., Eds.; Bulletin of the Global Volcanism Network; Smithsonian Institution: Whashington, DC, USA, 2021; Volume 46. [Google Scholar] [CrossRef]
- Marchese, F.; Genzano, N.; Nolde, M.; Falconieri, A.; Pergola, N.; Plank, S. Mapping and characterizing the Kīlauea (Hawai‘i) lava lake through Sentinel-2 MSI and Landsat-8 OLI observations of December 2020–February 2021. Environ. Model. Softw. 2022, 148, 105273. [Google Scholar] [CrossRef]
- Coppola, D.; Valade, S.; Masias, P.; Laiolo, M.; Massimetti, F.; Campus, A.; Aguilar, R.; Anccasi, R.; Apaza, F.; Ccallata, B.; et al. Shallow magma convection evidenced by excess degassing and thermal radiation during the dome-forming Sabancaya eruption (2012–2020). Bull. Volcanol. 2022, 84, 16. [Google Scholar] [CrossRef]
- Joint Polar Satellite System—Missions and Instruments. Available online: https://www.jpss.noaa.gov/mission_and_instruments.html (accessed on 15 December 2021).


| VIIRS (S-NPP/N20) | MODIS (TERRA/AQUA) | |
|---|---|---|
| Orbit altitude (km) | 824 | 705 |
| Equator crossing time | 13:30 LT/12:40 LT | 10:30 LT/13:30 LT |
| Swath (km) | 3060 | 2330 |
| Pixel resolution at nadir (km) | 0.75–0.375 | 1 |
| Pixel resolution at the edge (km) | 1.5–0.75 | 4 |
| Spectral coverageofthermal bands (μm) | 3.550–12.488 | 3.660–14.385 |
| Number of thermal bands | 7 | 14 |
| ID MIR Band(s) | M-13 | 21 22 |
| Spectral range (μm) | 3.973–4.128 | 3.929–3.989 3.940–4.001 |
| TMAX (SNR-NEdT on orbit) | 634 K (0. 04) | 500 K (0.183) 331 K (0.019) |
| ID TIRBand(s) | M-15 | 31 |
| Spectral range (μm) | 10.263–11.263 | 10.780–11.280 |
| TMAX (SNR-NEdT on orbit) | 343 K (0.03) | 400 K (0.017) |
| Volcano | # | Láscar | Erta Ale |
|---|---|---|---|
| Npass | MIROVAVIIRS | 4049 | 3885 |
| MIROVAMODIS | 3164 | 2977 | |
| FIRMSVIIRS | 4049 | 3885 | |
| Nalerts (f%) | MIROVAVIIRS | 1221 (30%) | 2711 (70%) |
| MIROVAMODIS | 875 (28%) | 1868 (63%) | |
| FIRMSVIIRS | 627 (15%) | 2816 (72%) | |
| Nalert ratio | MIROVAVIIRS/ MIROVAMODIS | 140% | 145% |
| MIROVAVIIRS/FIRMSVIIRS | 195% | 96% | |
| Mean VRP (MW) | MIROVAVIIRS | 1.78 | 92.6 |
| MIROVAMODIS | 1.53 | 104.5 | |
| FIRMSVIIRS | 2.31 | 117.9 | |
| Max VRP (MW) | MIROVAVIIRS | 14.25 | 6700.7 |
| MIROVAMODIS | 12.66 | 6781.1 | |
| FIRMSVIIRS | 15.55 | 4863.9 |
| VRE (J) | ||||
|---|---|---|---|---|
| MIROVAVIIRS | FIRMSVIIRS | MIROVAMODIS | ||
| Láscar | 5 Apr 2013–30 Oct 2015 | |||
| 31 Oct 2015–23 Nov 2018 | ||||
| 24 Nov 2018–31 Dec 2020 | ||||
| 2012–2020 | ||||
| Erta Ale | 19 Jan 2012–16 Jan 2017 | |||
| 17 Jan 2017–31 Dec 2020 | ||||
| 2012–2020 | ||||
| Volcano | Correlation Coefficient | Npass | Nalerts (f%) | Nalert ratio | f% (Nalert/Npass) Nighttime | f% (Nalert/Npass) Daytime | Mean VRP (MW) | ||||||
|---|---|---|---|---|---|---|---|---|---|---|---|---|---|
| m | r | VIIRS | MODIS | VIIRS | MODIS | VIIRS/MODIS | VIIRS | MODIS | VIIRS | MODIS | VIIRS | MODIS | |
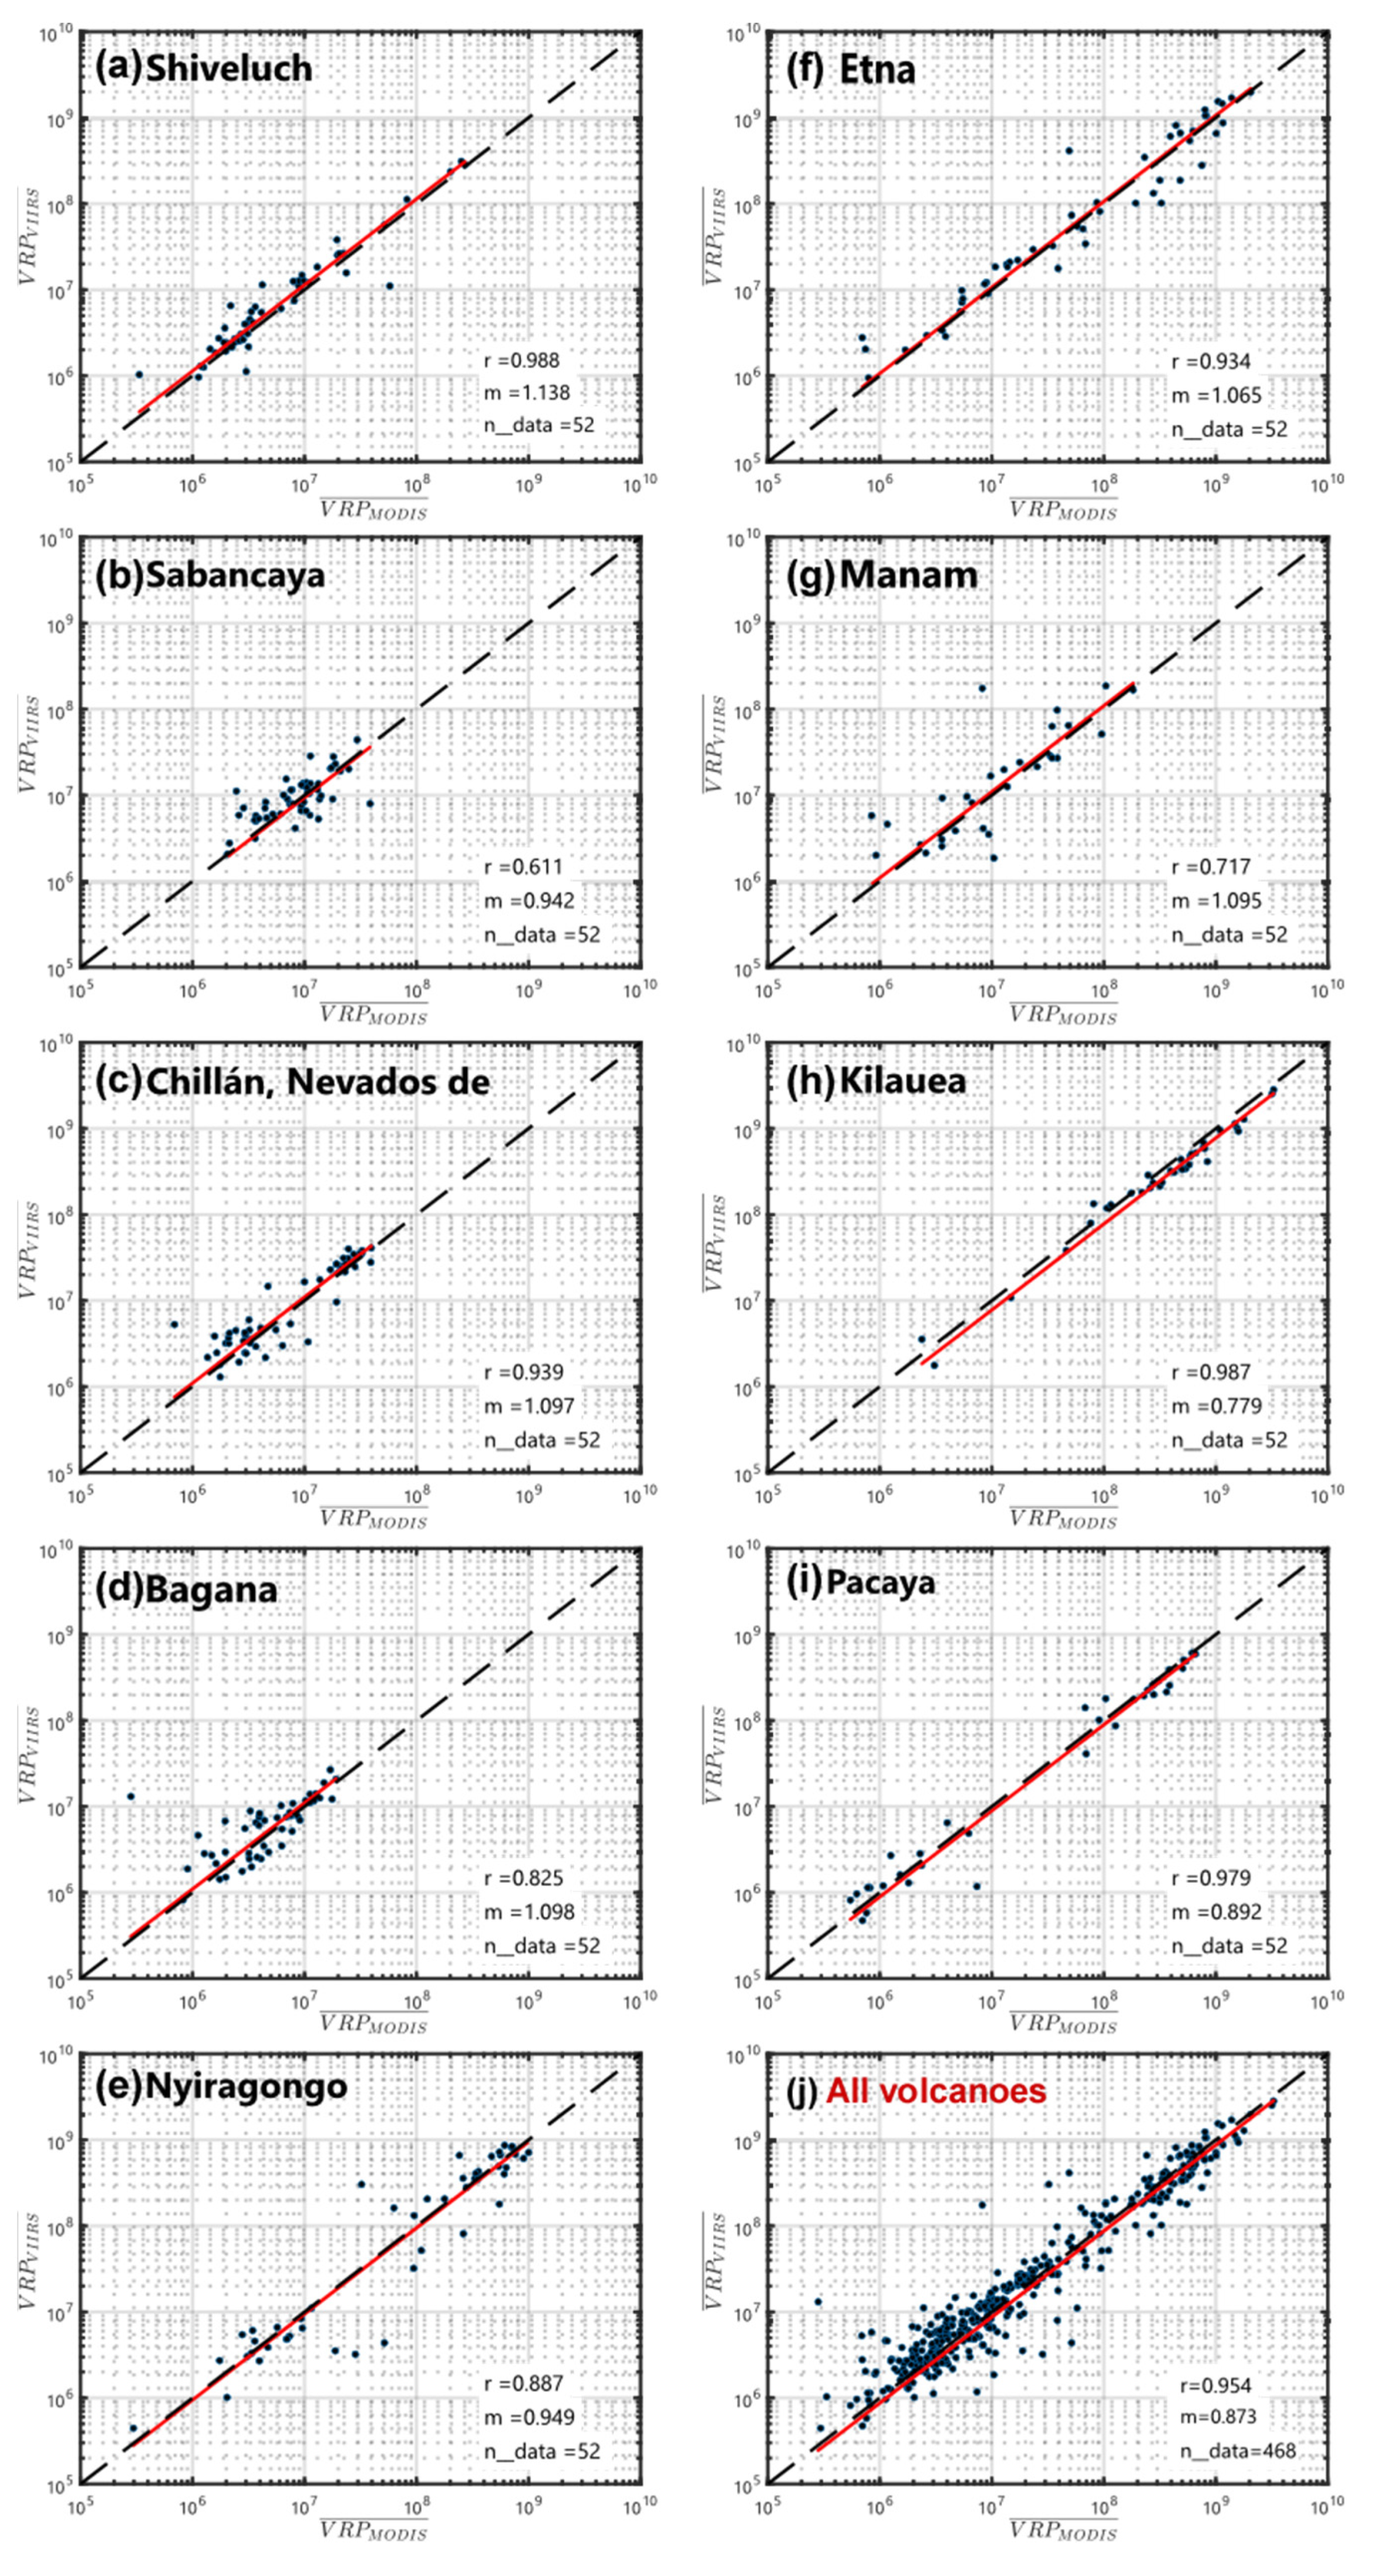
| Shiveluch (Kamchatcka) | 1.138 | 0.988 | 3264 | 2424 | 1098 (33.6%) | 655 (27%) | 167.6% | 45.3% | 45.3% | 23.3% | 23.3% | 26.2 | 22.8 |
| Sabancaya (Chile) | 0.942 | 0.611 | 1684 | 1287 | 689 (40.9%) | 374 (29.1%) | 184.2% | 69.5% | 55.0% | 13.7% | 3.5% | 11.1 | 10.3 |
| Chillán, Nevados de (Chile) | 1.097 | 0.939 | 2109 | 1617 | 970 (46%) | 574 (35.5%) | 169.0% | 71.4% | 57.5% | 21.2% | 14.1% | 13.8 | 12.1 |
| Bagana (Bouganville Island) | 1.098 | 0.825 | 1664 | 1291 | 364 (21.9%) | 175 (13.6%) | 208.0% | 40.1% | 25.1% | 3.4% | 2.2% | 7.4 | 6.2 |
| Nyiragongo (DRC) | 0.949 | 0.887 | 1576 | 1274 | 530 (33.6%) | 368 (28.9%) | 144.0% | 53.3% | 45.5% | 14.0% | 12.6% | 254.4 | 247.9 |
| Etna (Italy) | 1.065 | 0.934 | 2095 | 1605 | 999 (47.7%) | 646 (40.2%) | 154.6% | 68.9% | 62.0% | 26.8% | 18.4% | 339.9 | 314.0 |
| Manam (Papua New Guinea) | 1.095 | 0.717 | 1640 | 1275 | 317 (19.3%) | 157 (12.3%) | 201.9% | 20.0% | 14.6% | 18.7% | 10.1% | 36.1 | 26.3 |
| Kilauea (Hawaii) | 0.779 | 0.987 | 1732 | 1324 | 742 (42.8% | 559 (42.2%) | 132.7% | 47.5% | 47.6% | 38.2% | 36.9% | 527.7 | 685.2 |
| Pacaya (Guatemala) | 0.892 | 0.979 | 1723 | 1319 | 584 (33.9%) | 375 (28.40) | 155.7% | 42.9% | 35.3% | 24.7% | 21.6% | 161.3 | 178.8 |
| Whole | 0.873 | 0.954 | 17487 | 13416 | 6293 (36.0%) | 3883 (28.9%) | 162.1% | 51.0% | 43.1% | 20.4% | 15.9% | 153.1 | 167.1 |
Publisher’s Note: MDPI stays neutral with regard to jurisdictional claims in published maps and institutional affiliations. |
© 2022 by the authors. Licensee MDPI, Basel, Switzerland. This article is an open access article distributed under the terms and conditions of the Creative Commons Attribution (CC BY) license (https://creativecommons.org/licenses/by/4.0/).
Share and Cite
Campus, A.; Laiolo, M.; Massimetti, F.; Coppola, D. The Transition from MODIS to VIIRS for Global Volcano Thermal Monitoring. Sensors 2022, 22, 1713. https://doi.org/10.3390/s22051713
Campus A, Laiolo M, Massimetti F, Coppola D. The Transition from MODIS to VIIRS for Global Volcano Thermal Monitoring. Sensors. 2022; 22(5):1713. https://doi.org/10.3390/s22051713
Chicago/Turabian StyleCampus, Adele, Marco Laiolo, Francesco Massimetti, and Diego Coppola. 2022. "The Transition from MODIS to VIIRS for Global Volcano Thermal Monitoring" Sensors 22, no. 5: 1713. https://doi.org/10.3390/s22051713
APA StyleCampus, A., Laiolo, M., Massimetti, F., & Coppola, D. (2022). The Transition from MODIS to VIIRS for Global Volcano Thermal Monitoring. Sensors, 22(5), 1713. https://doi.org/10.3390/s22051713