Abstract
River floods are listed among the natural disasters that can directly influence different aspects of life, ranging from human lives, to economy, infrastructure, agriculture, etc. Organizations are investing heavily in research to find more efficient approaches to prevent them. The Artificial Intelligence of Things (AIoT) is a recent concept that combines the best of both Artificial Intelligence and Internet of Things, and has already demonstrated its capabilities in different fields. In this paper, we introduce an AIoT architecture where river flood sensors, in each region, can transmit their data via the LoRaWAN to their closest local broadcast center. The latter will relay the collected data via 4G/5G to a centralized cloud server that will analyze the data, predict the status of the rivers countrywide using an efficient Artificial Intelligence approach, and thus, help prevent eventual floods. This approach has proven its efficiency at every level. On the one hand, the LoRaWAN-based communication between sensor nodes and broadcast centers has provided a lower energy consumption and a wider range. On the other hand, the Artificial Intelligence-based data analysis has provided better river flood predictions.
1. Introduction
Human beings have always tended to live and prosper beside rivers. Iconic civilizations, such as the Pharaohs and the Babylonians, were known for thriving on the banks of the Nile and the Euphrates. These civilizations and others, up until nowadays, have always been under the threat of river flooding, which can have disastrous effects, ranging from taking human lives to destroying both agriculture and infrastructure, thus, causing repetitive economic crises. The extreme climate changes that occurred during the 20th century and are still occurring during the first quarter of the 21st have increased the frequency and magnitude of floods. According to the European Commission [1], river floods are the most common natural disaster in Europe, with annual damages of €11 billion (€98 billion worldwide). Different causes are behind river floods, whether they be other natural disasters, such as heavy rainfalls and hurricanes, or human intervention, such as urbanization, deforestation, and mining [2]. The human impact has even caused changes in flooding behaviors. In Western China, the Weihe River is known to flood during summer and autumn, but sudden land use changes and the industrialization of the area have caused radical changes in the river run-off [3]. The same can be said for a shift in flooding patterns in the Mekong Delta of Vietnam, which is considered the third largest delta in the world. Such shifts may heavily impact policy decisions regarding different issues such as water management, urbanization, agriculture, etc.
Heavy flooding has a huge impact on different socioeconomic fields. For instance, in agriculture, it can cause drastic policy adjustments. A study by Wang et al. [4] put forward the impact of the Yangtze River floods in 2020 on China’s importation of feeds and grains from the USA, raising its rates to over 316% in the first semester of 2021. In Uganda, Mubialiwo et al. [5] presented a model that estimated the direct losses due to the recurrent Malaba river flooding as $33 Million in a two-year return period, including over $855,000 in worshipping places alone. Other socioeconomic infrastructures remain under direct flood threat, including 27 health and education facilities. In Brazil, Silva Araújo et al. [6] assessed the correlation between income inequality and the vulnerability to flooding risks in the Itapocu river basin area. Their study showed that low-income households tend be positioned in riskier areas, thus are more susceptible, than their higher income counterparts, to having their homes and farms destroyed by floods. As an effect, the Itapocu river floods are regarded as an important cause of socioeconomic inequality in its surrounding area.
Governments and research organizations have heavily invested in finding efficient approaches to preventing river floods. The most common method is based on measuring the water level from different locations on a river’s course. Despite its efficiency in normal case scenarios, this traditional method has presented serious shortcomings when it comes to predicting extreme flooding. Some attempts are worth mentioning, such as [7] who suggested a decision support system based on two hydrological models, coupled with a web application for monitoring river levels. Other methods are based on Geographic Information Systems (GIS), as well as images captured by autonomous cars [8,9]. Others attempts were based on analyzing satellite images, such as the work done by Nghia et al. [10] who built a logical model based on the “Google Earth Engine” and “Sentinel 1” data to monitor flood levels downstream of the Mekong River.
One of the main issues that these methods face is the lack of real-time monitoring capabilities that can keep the decision-makers updated on the current issue of the rivers and can predict imminent flooding. In this paper, we will address this issue by presenting an efficient and fully integrated Artificial Intelligence on Things (AIoT) architecture. In this architecture, the sensors placed on the water bodies can communicate the data collected using the LoRaWAN protocol, known for its wide coverage and low energy consumption. The collected data is sent to the closest local broadcasting tower, which will relay the data to the centralized cloud server. This server will process the data based on Artificial Intelligence and will predict the river’s status.
In the next section, we will discuss different approaches in the literature that addressed the flood prediction issue. In Section 3, we will further develop our approach, then discuss the results and findings in Section 4. Section 5 will conclude the paper and suggest different areas of improvement.
2. Related Works
Wireless Sensor Networks (WSNs) are a combination of spatially dispatched sensors that monitor real-time physical reactions, such as temperature, motion, vibration, and produce data which will be later collected by sink nodes [11]. Siddique et al. [12] presented an approach based on a WSN that was able to warn nearby villages in case of imminent flooding. They placed four sensors at different locations on the river to constantly monitor its flow and transmit the data to a sink node that will generate a warning in case of a flood. Lukić et al. [13] suggested a WSN architecture where sensor nodes periodically measure different variables such as flow rate, temperature, rainfall, etc. The measurements are compared on sensor levels with two thresholds before being sent to the sink node. Wahyono et al. [14] presented a solution to optimize the performance on a river flood detection WSN by finding the best locations where sensors can be clustered. Their method for grouping the sensors is based on the K-Means algorithm, and the data taken from each grouping is used to predict potential floods in the area it covers. Saharia et al. [15] put forward a WSN architecture consisting of four sensors (ultrasonic, water flow, raindrop, and temperature/humidity), and an Arduino UNO that transmits the collected data to a cloud monitoring system. SMS alerts are sent in case of emergency.
The Internet of Things (IoT), as defined by Oracle [16], is a network of physical objects or “things” embedded to sensors and other devices so they can connect and exchange data with each other via the internet. As of 2020, the number of interconnected IoT devices is estimated to be 10 billion, and it is expected to grow to 22 billion by 2025. Soh et al. [17] presented an architecture where camera-equipped IoT devices capture river water levels and compare them to the riverbank level. When the flood severity reaches a critical level, an alert is sent to the threatened community via social media (Telegram App). Biantoro et al. [18] developed an IoT prototype backed by the Blynk platform [19]. The “FEDS” prototype consists of a microcontroller, a rainfall sensor, and an ultrasonic sensor. Acosta et al. [20] presented an IoT-based solution for flood monitoring. They implemented ultrasonic sensors in 31 interconnected stations along two rivers, and the collected data is consolidated in a cloud platform where an overall dashboard will alert the authorities in case of emergency. Ganesh et al. [21] put forward an IoT-based solution to monitor dam water levels and alert people in case of imminent flooding. They used different sensors to check on the levels in both the dam as a whole and its main pipeline. The collected data is transmitted to a cloud platform.
As defined by [22], Low Power Wide Area Networks (LPWAN) are a set of standards that govern the IoT communication that have specific aspects such as very low battery consumption, wide area coverage, transmission of small data packets, etc. LPWAN-based solutions have been applied in different fields and have displayed great capabilities to connect the IoT devices even in strained circumstances. According to [23], different technologies follow the LPWAN standards but the three most famous are:
- “LoRaWAN”, which is known for transmitting in several sub-gigahertz frequencies, making it less inclined to have interference.
- “Weightless SIG”, which runs in the sub-1 GHz spectrum but can also support 12.5 kHz narrowband technology.
- “NB-IoT”, which can operate on existing cellular infrastructure by taking advantage of the 3GPP standards.
Manuel et al. [24] suggested a novel communication architecture for a search and rescue (SAR) mission. This architecture is based on the LoRaWAN, and a SAR robot called “Rescuer”, which can be deployed in areas where all communication networks are supposed to be wiped out. Ibarreche et al. [25] presented a flash flood prediction and early warning sensor system based on the LoRaWAN architecture. Their “Emergency Water Information Network” revolves around meteorological stations, fixed and mobile water monitoring stations along the river, and a data transmission unit. Sung et al. [26] proposed a LoRaWAN- and SIM900-based mountain flood observation system where the communication between the sensors and a cloud server is ensured via the internet. The data is accessible via a special app, and warnings are sent via SMS. Ragnoli et al. [27] put forward a modular LoRaWAN-based architecture of a flood monitoring system where no major updates in the hardware disposition would be necessary. They wired the sensors to a microcontroller which will send the data through the LoRaWAN to a web structure that will take charge of raising the alarm in case of floods. Yeon et al. [28] suggested a real-time flood monitoring system based on flood sensors communicating through the NB-IoT and transmitting their collected data to the sever using TCP/UDP protocols. Di Gennaro et al. [29] proposed a water monitoring system where the communication between the sensors is based on Weightless Sigfox.
Artificial Intelligence (AI) is a set of algorithms which, based on the rapid growth of data, can efficiently provide computers and machines with the ability to sense their environment, learn from it, and react to it [30]. AI has an incredible impact on different socioeconomic fields, and it is expected by 2030 to add up to $13 trillion to the GDP [31]. AI has demonstrated its capacities in different fields [32,33,34,35,36]. For instance, the authors in [37] suggest a sparse regression-based, data-driven model identification for ships with 6 degrees of freedom. In [38], the authors propose a solution to optimize sensor mapping in smart homes based on deep adversarial transfer learning. In [39], the authors provided a means to optimize the performance of hyperspectral image classification by combining the PCA, LBP, Grey Wolf, and KELM algorithms. In [40], the authors suggest a new approach to solve the problem of airport gate allocations. Their solution is based on a combination of a quantum-inspired co-evolutionary algorithm, along with random rotation direction, and a Hamming adaptive rotation angle. As for river flood monitoring, Hasanuzzaman et al. [41] compared the performance of three Machine Learning (ML) algorithms for flood susceptibility mapping. Their dataset consisted of 500 historical flood points with twelve influencing factors (elevation, rainfall, slope, etc.). The best performance was provided by the Random Forest (RF) algorithm. Luppichini et al. [42] fully relied on historical data when training their Long Short Term Memory (LSTM) algorithm and tried to prove that their approach remains able to provide good flood level predictions, even in case of data shortage. Atashi et al. [43] also relied on historical data, namely, twelve years of hourly data from three stations along the Red River of the North. They used this data to train the RF, LSTM, and Seasonal Autoregressive Integrated Moving Average (SARIMA) algorithms. The LSTM algorithm has provided the best flood level predictions. Tanim et al. [44] put forward an unsupervised Machine Learning approach based on a combination of the Change Detection method, the Otsu algorithm, and fuzzy rules. This approach was tested on flood images captured by the ESA’s “Sentinel 1” satellite and has proved better classification performance when compared to the Random Forest (RF) algorithm, Support Vector Machines (SVM), and the Maximum Likelihood Classifier (MLC). The Artificial Intelligence of Things (AIoT) is an architecture that takes the best of both AI and IoT. It is expected to represent the trend of the future due to its widespread applicability that can cover every possible domain including environment and weather monitoring [45]. Previous literature presents several models using the AIoT as an efficient means of real-time monitoring of river levels, and of providing predictions on eventual river floods. Goudarzi et al. [46] proposed a multilevel architecture where WSNs are backed by Unmanned Aerial Vehicles (UAV) that can act in case of connectivity issues. The collected data is fed to a Particle Swarm Optimization (PSO) algorithm that will predict forthcoming floods. Fernandes Junior et al. [47] suggested a lightweight Deep Neural Network (DNN) that can be embarked in memory-constrained IoT devices deployed for river flood detection. Mangukiya et al. [48] proposed an IoT-based architecture where sensors are dispatched along the lower Narmada basin in India. The collected data is fed to a Random Forest algorithm that was trained on historical data taking different variables into consideration such as elevation, slope, drainage density, annual rainfall, etc. A RandomizedSearchCV algorithm was deployed prior to the RF training for a better performance. Anuradha et al. [49] put forward an LSTM-backed IoT hazard monitoring and prediction system taking into consideration the specific case of hills and mountainous terrain. Their system is meant to cover different natural disaster scenarios such as flooding, landslides, and avalanches.
With the recent advances in microcontroller-related technologies, embedded Machine Learning has gained momentum and demonstrated its capabilities in different areas. For instance, Dudak et al. [50] implemented a neural network model in an STM32L4x microcontroller for motion detection purposes, enabling it to recognize six basic movements in three axes. Healthcare has its fair share of embedded Machine Learning applications. On the one hand, Gokul et al. [51] implemented the ProtoNN embedded classifier [52] in an ATMega2560 microcontroller to detect Freeze of Gait events in Parkinson Disease patients. On the other hand, Peruzzi et al. [53] implemented a CNN model in a microcontroller making it able to detect and prevent sleep bruxism. Incorporating embedded Machine Learning in river flood prevention systems is a recent research area with promising results. For example, Syed Ahmed Ali et al. [54] implemented a Machine Learning model in an ESP32 microcontroller that collects data via 4G from precipitation, water flow, and water level sensors. The alert is sent to the community via an Android app connected to the microcontroller. Coveñas et al. [55] set up a Wireless Sensor Network centered around an ESP32 microcontroller with an implemented Machine Learning model making it able to prevent eventual floods and mudslides. Shun-Nien Yang et al. [56] implemented an IoT-based sensor network enhanced with Machine Learning capabilities to predict the average regional flood depth in the Erren river basin in south Taiwan. Khalaf et al. [57] merged an IoT sensor network with an ensemble learning model combining LSTM and RF to provide an optimized river flood prevention.
Table 1 provides a general overview about the different approaches described in this section.

Table 1.
Summary table of the literature review.
The studies summarized in Table 1 have one main issue, which is that they base their works on covering one river at a time; this raises several questions regarding scalability, especially with the possibilities offered by the AIoT and Big Data Analytics. In this paper, we introduce a fully integrated AIoT environment that can provide a more efficient insight on the data collected by sensors from different rivers, and thus, can better prevent the possibility of floods. This environment will have a multilayer architecture. In the lowest layer, a Low Power Wide Area Network (LPWAN) will connect different sensors that are widespread over all the rivers. The collected data will be fed to a Deep Learning layer that will analyze the data and predict the status of the rivers countrywide.
3. Materials and Methods
3.1. LPWAN Architecture
3.1.1. LPWAN
Long distance and low power communication is one of the main challenges for the IoT and M2M. LPWAN networks can face this challenge by adopting a star network architecture and allowing communications of up to 20 kilometers in a free field. This network topology is based on a central piece of equipment that will direct all connections. Each sensor will therefore send messages to a local hub but will not be able to send messages directly to other transmitters. This technology makes it possible to send and receive messages of very small sizes, with the major advantage that the components used to send these messages are very inexpensive and very energy-efficient. As explained by Adefemi et al. [58], it is now possible with a simple battery to send a few messages per day for 10 years.
In addition, LPWAN networks differ from traditional short-range networks such as ZigBee, Bluetooth, and the Wireless Local Area Network (WLAN). The range of these communicating systems, which tops out at around 100 hundred meters, is sometimes compensated for by a denser mesh of gateways or a mesh architecture. This, therefore, implies a much higher network infrastructure installation and maintenance costs. The use cases seem to be closer to the classic uses of the Global System for Mobile communication (GSM) and Long Term Evolution (LTE). Although they have significant coverage, Muteba et al. [59] argued that GSM networks do not compete on the vital points of the IoT, namely consumption and prices.
In Figure 1, we can see where the LPWAN networks are located in relation to the others, in terms of power consumption, flow, and distance. It is interesting to note that they occupy an important place on the graph covered by no other communication protocol.
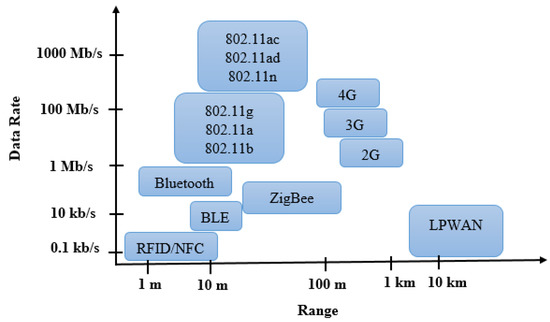
Figure 1.
Data Rate vs. Range: LPWAN Positioning.
3.1.2. LoRaWAN
A LoRaWAN (Low Range Wide Aera Network) is a radio communication protocol regulated by the LoRa alliance [60]. It allows the transmission of low amounts of data between different devices. It is based on a star topology in which gateways or hubs relay messages between devices; in our case, sensors and a central data analytics server. As described by Amazon [61], a LoRaWAN allows a communication range of up to 10 miles, and a battery duration of 10 years. It offers a license-free radio spectrum, and its devices are of low cost in either purchasing or maintenance.
The choice of a LoRaWAN in our case scenario of river flood monitoring is based on the different advantages it offers. The first is its ability to transmit small amounts of data in frequent time frames, and with low power needs. The second is its built-in ability to fit into a star-based topology. The third is that, as argued by both Tadrist et al. [62] and Ortega-Gonzalez et al. [63], a LoRaWAN has demonstrated its robustness in adverse weather conditions, which usually go hand-in-hand with river flooding.
3.1.3. The Suggested Architecture
In our architecture, described in Figure 2, we suggest placing flood detection sensors in concerned water bodies. The sensors from each region will transmit their data via a LoRaWAN to their closest broadcast tower, which operates as both a local LPWAN hub and a national 4G/5G transmitter (according to the network protocol adopted by the country). The broadcast tower will transfer the data via 4G or 5G to the cloud server via its router.

Figure 2.
The suggested architecture.
The cloud server will analyze the data using an artificial intelligence approach that will be described in the following subsection. The results of the data analytics step will be carried by the application server which will feed them to both a web server and a data monitoring system. In the case of an imminent flood emergency, SMS messages will be sent to the nearby population.
This architecture is using WISE-4610P [64] sensor nodes. This model ensures a data transmission range of 15 km to the closest hub via a selection between either LoRa or LoRaWAN. Its external antenna allows a better obstacle penetration. It offers a built-in 4100 mAh rechargeable battery with a 10~50 VDC external power and a 17–21 VDC solar energy panel. It works on an EU region LoRaWAN frequency range of EU 868 with a data rate of 50 kbps at FSK mode. It has a spreading factor of 7~12, a transmit power of up to +18 dBm, and a receiver sensitivity of −136 dBm at SF = 12/125 KHz. It can operate at a range of −40~85 °C temperature and at a range of 5~95% RH humidity.
The hubs used in this architecture are based on WISE-6610-N100C-A [65] gateways implemented in each broadcast tower. This gateway model offers a support of up to 100 nodes with 951 MHz along with a built-in LTE Cat-M1 cellular interface.
Figure 3 displays pictures of the used sensor nodes and hubs.

Figure 3.
Pictures of the sensor node and hub listed as: (a) WISE-4610P sensor node; (b) WISE-6610-N100C-A hub [66].
When compared to embedded Machine Learning approaches such as the one implemented by Syed Ahmed Ali et al. [54], our architecture, in theory, may gain in performance. In their approach, the authors in [54] used 4G to transmit data from the sensors to the ESP microcontroller. This will consume energy and be a waste of data, since 4G allows the transmission of more data than is needed for a sensor. In our approach, the sensors and hubs communicate via the LoRaWAN. This will consume less energy, especially in sensor level, and take full advantage of LoRaWAN capabilities as being more robust in harsh environments [62].
3.2. Artificial Intelligence Approach
3.2.1. England’s DEFRA Catchment Dataset
A suitable dataset for training our candidate artificial intelligence algorithms needs to cover different bodies of water and their flood measurement data, as well as a status variable that can help for the classification. In 2013, the UK’s Department for Environment, Food, and Rural Affairs (DEFRA) launched an initiative called a “Catchment Based Approach” (CBA) [67]. It is a framework that facilitates data collection from different water bodies at local, regional, and national levels by encouraging different actors to take part in the process, whether they be DEFRA officials, industrial collaborators, local politicians, or NGOs.
In the CBA, the water bodies are divided into a hierarchical catchment design running from the larger river basin districts to the smaller water body units. The diagram showing the CBA hierarchy is described in Figure 4.

Figure 4.
The hierarchy adopted by the Catchment Based Approach [68].
The catchment dataset is provided by DEFRA [68] as open data. It includes flood measurements and classification along with other types of data from the 10 following river basin districts (RBDs):
- Anglian;
- Dee;
- Humber;
- North West;
- Northumbria;
- Severn;
- Solway Tweed;
- South East;
- South West;
- Thames.
These RBDs contain a total of 4950 water bodies grouped into 750 Operational Catchments and 117 Management Catchments.
The dataset, in its latest update on 20 May 2022, contains over 1 M entry with 21 features. The target column “Status” is a multiclass with 13 possible classes. These classes and their value counts are described in Table 1.
3.2.2. Data Preprocessing
Among the 21 features, “Status” is considered as a target, so we needed to isolate it from the rest of the dataset. Other columns, such as “Linked Reasons”, “Ngr”, “Investigation Outcome”, etc, were removed as the columns that either had more than 20% of missing values or too many unique categories were removed. Thus, the number of the most relevant features that were kept is 12.
After that, we checked the number of null values in the dataset. The number of these values was 920,976. We first thought about removing the lines where these data are, but we ended up reducing the size of the dataset from over 1 M lines to a mere 233,770 lines. This drastic reduction would hurt the algorithms’ learning process, so we opted for another option, which is “Forward Filling”. This method will fill every null value with its corresponding value from the previous line. Since there were missing values in the first line itself, a “Backward Filling” was also needed so we can fill the null values with their corresponding counterparts from the next line.
As it can be seen from Table 2, there is a huge difference in the value counts between some of the “Status” classes. For instance, the “Good” class has 330,940 values, while “Upward trend” has only 1022 values. To remedy this difference, we opted to rally these 13 classes into 3 so we could have a better equilibrium.
Table 2.
“Status” column classes and their value counts.
From those classes, we kept the following 3:
- Good;
- Moderate;
- Bad.
Table 3 displays the old classification values and their matching counterparts in the new classification as well as the value counts of each of the new classes.
Table 3.
The “Status” column’s old and new classes and the value counts of the new ones.
Even after resetting the categories, the dataset is still lacking equilibrium. The “Good” class still has more than four times more occurrences than “Moderate”, and around three times more than “Bad”. This imbalance may raise suspicions about the effectiveness of the classification algorithms. To make sure that such a lack of equilibrium would not impact the performance of the candidate algorithms, we run them on two different settings:
- Setting 1: The candidate algorithms run using this data as it is;
- Setting 2: The dataset is rebalanced using the Synthetic Minority Oversampling Technique (SMOTE), a method for oversampling minority classes. To avoid a simple cloning of minority classes, SMOTE is based on a simple principle: to generate new minority classes that resemble the others, without being strictly identical. This makes it possible to increase the density of minority classes in a more homogeneous way.
In this dataset, some of the features such as “Cycle” are numerical, while others such as “Status” and “Water Body Type” are categorical. Ordinal and One-Hot encoding were adopted depending on each of the concerned columns.
3.2.3. Candidate Algorithms
The dataset is a bit structured and contains both numerical and categorical features. According to the literature, Deep Learning algorithms as well as tree-based Machine Learning algorithms tend to perform best in these kinds of scenarios. We chose to compare the performance of four algorithms, two from each category, with our dataset:
- A Decision Tree (DT) algorithm is where the set of choices is represented in the graphic form of a tree, hence its name. A decision tree is a diagram representing the possible outcomes of a series of interconnected choices. It allows a person or organization to evaluate different possible actions in terms of their cost, probability, and benefits. A decision tree typically begins with a node from which several possible outcomes flow. Each of these outcomes leads to other nodes, from which other possibilities emerge. The resulting diagram is similar to the shape of a tree. At the ends of the branches, the leaves of the tree, we find different possible decisions. This type of tool has the advantage of being readable and quick to execute classification tasks.
- A Random Forest (RF) algorithm is composed of several decision trees, trained independently on subsets of the training dataset (bagging method). Each one produces an estimate and it is the combination of the results that will give the final prediction, which results in a reduced variance. In short, it is a matter of drawing inspiration from different opinions, dealing with the same problem, to better understand it. Each model is randomly distributed into subsets of decision trees. In classification, the final estimation consists of choosing the most frequent response category. Rather than using all the results obtained, a selection is made by looking for the most frequent prediction.
- A Deep Neural Network (DNN) algorithm tries to mimic the human brain. The neural network is based on a large number of processors that operate in parallel and are organized in layers. One of these layers receives the raw information inputs, as the optic nerve of the human being operates when it processes visual signals. Then, each layer receives the information output from the previous layer, a process that is found in humans. This is, in fact, what happens during the transmission of information between neurons via synapses, especially near the optic nerve. The results of the system are produced by the last layer of neurons.
- The Long-Short Term Memory (LSTM) is the most widely used recurrent neural network architecture in practice that addresses the gradient vanishing problem. The data transfer process is the same as that of standard recurrent neural networks. However, the information propagation operation is different. As the information passes through, the operation decides which information to process further and which information to discard. The main operation consists of cells and gates. The state of the cell functions as a pathway for the transfer of information. Each cell is composed of three gates which determine whether to let in a new input (input gate), delete the information because it is not important (forget gate), or let it influence the output at the current time step (output gate).
3.2.4. Evaluation Metrics
After preprocessing, we held a comparative study of the performance of the candidate algorithms. The indicators were:
- Accuracy;
- Precision;
- Recall;
- F1-Score;
- Confusion Matrix;
- ROC Curve
Accuracy measures the rate of correct predictions for all the values. It is the ratio of the total of true values (True Positives or “TP” and True Negatives or “TN”) and the overall values, as explained in the following equation:
“FP” being False Positives, and “FN” being False Negatives.
Precision measures the algorithm’s ability to avoid mistakes while predicting positive values. It is the ratio of the true positives and the overall positives, as explained in the following equation:
Recall, also known as “Sensitivity”, measures the algorithm’s ability to get true positives. It is the ratio of true positives and the sum of true positives and false negatives, as explained in the following equation:
The F1−score evaluates the ability of a classification model to efficiently predict positive values, by making a trade-off between precision and recall. Mathematically, the F1−score is defined as the harmonic mean of the precision and recall, which translates into the following equation:
That same equation can be further simplified as following:
A Confusion Matrix (CM) is a square matrix that displays the number of true positives, true negatives, false positives, and false negative altogether. The matrix lines represent the predicted classes while the columns represent the real classes. In the case of 3 classes, as in Figure 5, the true positives (in green) are in the confusion matrix’s diagonal, while the false positives and false negatives for each class (in red) are outside the confusion matrix’s diagonal.
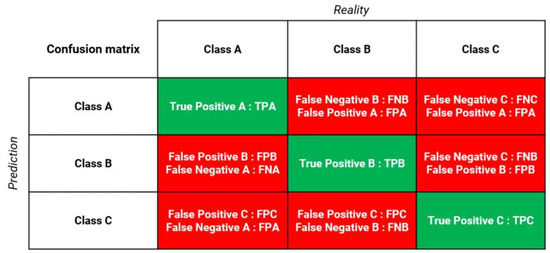
Figure 5.
The Confusion Matrix in case of 3 classes [69].
The receiver operating characteristic curve (ROC curve) is a graph that displays how well a classification model performs across all categorization levels. The True Positive Rate and False Positive Rate are plotted on this curve at various categorization thresholds. The True Positive Rate refers to Recall while the false positive rate is specified as:
4. Results and Discussion
As described earlier, the candidate classification algorithms were run under two settings. The first setting used the curated dataset as it is, while the second setting oversampled the minority classes to reach an equilibrium between the three classes. The dataset was split into training and testing subsets with an 80:20 ratio (80% for the training subset against 20% for the testing subset). This choice was based on the argument of Roshan Joseph [70], stipulating that this split ratio tends to provide the best results. The training parameters for the candidate algorithms were tuned using a Random Search cross-validation approach [71] for optimized performance. The results in both settings were evaluated based on the abovementioned evaluation metrics.
The results, as described in Table 4, and in Figure 6 and Figure 7, display a large advantage in the accuracy of the tree-based algorithms. Indeed, the DT has scored 94.74% in setting 1 and 94.44% in setting 2, while the RF has scored 95.24% in setting 1 and 95.21% in setting 2. On the other hand, the DNN has scored an accuracy of 89.74% in setting 1 and 90.27% in setting 2, while the LSTM scored 91.18% in setting 1 and 90.41% in setting 2.
Table 4.
Values of the evaluation metrics for each candidate algorithm in both settings.

Figure 6.
Values of the evaluation metrics for each candidate algorithm in setting 1.

Figure 7.
Values of the evaluation metrics for each candidate algorithm in setting 2.
Accuracy-wise, it seems that the dataset imbalance issue did not affect the performance of the algorithms in general. The only case scenario where balanced data provided more accuracy was with DNN, giving it a 0.01 increase. For RF, the accuracy remained almost the same (a 0.03% decrease). The decrease in accuracy was a bit more important in DT (a 0.3% decrease), and in LSTM (a 0.77% decrease).
However, the impact of data imbalance was more visible on Precision, Recall, and the F1-Score, giving them an average increase of 3% for DT and RF, 5% for DNN, and 4% for LSTM. Although, these differences may seem to be low, their effect is more visible on the confusion matrices of each of the candidate algorithms. As displayed in Figure 8 and Figure 9, the number of true positives for all the candidate algorithms is more balanced in setting 2 when compared to setting 1.

Figure 8.
The Confusion Matrices for the tree-based algorithms, listed as: (a) DT in setting 1; (b) DT in setting 2; (c) RF in setting 1; (d) RF in setting 2.

Figure 9.
The Confusion Matrices for the Deep Learning algorithms, listed as: (a) DNN in setting 1; (b) DNN in setting 2; (c) LSTM in setting 1; (d) LSTM in setting 2.
Again, and as described in Figure 10 and Figure 11, the effect of class imbalance is evident in the AUC-ROC curve, especially in the case of the Random Forest and Decision Tree algorithms. We can clearly see that in the setting 1, the difference in true positive rate for a particular value of false positive rate is more as compared to that in the setting 2. Additionally, the curves for the Random Forest and Decision Tree algorithms are sharper compared to that of DNN and LSTM signifying that the former perform significantly better than the latter in this case.

Figure 10.
The AUC-ROC curves for the tree-based algorithms, listed as: (a) DT in setting 1; (b) DT in setting 2; (c) RF in setting 1; (d) RF in setting 2.
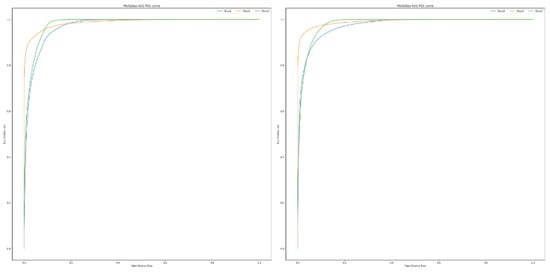

Figure 11.
The AUC-ROC curves for the Deep Learning algorithms, listed as: (a) DNN in setting 1; (b) DNN in setting 2; (c) LSTM in setting 1; (d) LSTM in setting 2.
As displayed in Table 5, when compared to other approaches that used Accuracy as a performance metric, our approach demonstrated the best accuracy with 95.24%, closely followed by Wahyono et al. [14] with 94%. The approach of Khalaf et al. [57] was third with 85.9% accuracy. The remaining approaches [26,41,44] all had an 85% accuracy.
Table 5.
Comparing our approach with those that used Accuracy as a metric.
5. Conclusions
This work presented an AIoT based architecture for effective data collection, analysis, and the prevention of imminent flooding that can cover multiple rivers countrywide. This architecture has three levels. The first level contains different sensors that continuously collect data and transfer them to their regional master nodes. The second level of this architecture contains an LPWAN infrastructure. This relays the data collected by the master nodes to the third layer, which contains a centralized Data Analytics server equipped with a Machine Learning-based control system which processes the incoming data and judges whether to signal an imminent flood warning. The Random Forest algorithm has displayed its ability as a best fit for this task with a 95.24% accuracy, closely followed by the Decision Tree algorithm with 94.74%. Deep Learning-based algorithms did not perform as well with an accuracy close to 90%.
Future work will focus on increasing the performance of the AIoT architecture, in both the sensor layer and the data analytics layer. In the sensor layer, we will explore the possibility of lowering energy consumption even further, especially for the data relaying tasks. We will also explore the possibilities provided with embedded Machine Learning, by implementing a Machine Learning model inside a microcontroller that can equip each local hub. In the data analytics layer, we can adopt a federated learning approach where the central data server can relay the learnt models back and forth between the different local hubs, making them learn from each other, and thus, increasing their efficiency.
Author Contributions
Conceptualization, Z.B.; methodology, Z.B. and M.O. (Mariyam Ouaissa); software, F.S.; validation, Z.B., M.O. (Mariyam Ouaissa) and M.O. (Mariya Ouaissa); formal analysis, Z.B., investigation, M.O. (Mariyam Ouaissa); resources, Z.B. and M.O. (Mariya Ouaissa); data curation, F.S.; writing—original draft preparation, Z.B., writing—review and editing, M.O. (Mariya Ouaissa), F.S. and M.K.; visualization, Z.B. and F.S.; supervision, M.O. (Mariya Ouaissa), M.A. and M.K.; project administration, M.A.; funding acquisition, M.A.. All authors have read and agreed to the published version of the manuscript.
Funding
This research received no external funding.
Institutional Review Board Statement
Not applicable.
Informed Consent Statement
Not applicable.
Acknowledgments
The researchers would like to thank the Deanship of Scientific Research, Qassim University for funding the publication of this project.
Conflicts of Interest
The authors declare no conflict of interest.
References
- European Commission. River Floods. EU Science Hub. Available online: https://bit.ly/EURiverF (accessed on 20 July 2022).
- BBC Bitesize. Rivers and Flooding—KS3 Geography Revision. BBC. Available online: https://bbc.in/3coAZxn (accessed on 20 July 2022).
- Liu, Y.; Xu, Y.; Zhao, Y.; Long, Y. Using SWAT Model to Assess the Impacts of Land Use and Climate Changes on Flood in the Upper Weihe River, China. Water 2022, 14, 2098. [Google Scholar] [CrossRef]
- Wang, L.-C.; Hoang, D.V.; Liou, Y.-A. Quantifying the Impacts of the 2020 Flood on Crop Production and Food Security in the Middle Reaches of the Yangtze River, China. Remote Sens. 2022, 14, 3140. [Google Scholar] [CrossRef]
- Mubialiwo, A.; Abebe, A.; Kawo, N.S.; Ekolu, J.; Nadarajah, S.; Onyutha, C. Hydrodynamic Modelling of Floods and Estimating Socio-economic Impacts of Floods in Ugandan River Malaba Sub-catchment. Earth Syst. Environ. 2022, 6, 45–67. [Google Scholar] [CrossRef]
- Silva Araújo, R.; Ohara, M.; Miyamoto, M.; Takeuchi, K. Flood impact on income inequality in the Itapocu River basin, Brazil. J. Flood Risk Manag. 2022, 15, e12805. [Google Scholar] [CrossRef]
- Mattos, T.S.; Oliveira, P.T.S.; Bruno, L.d.S.; Carvalho, G.A.; Pereira, R.B.; Crivellaro, L.L.; Lucas, M.C.; Roy, T. Towards reducing flood risk disasters in a tropical urban basin by the development of flood alert web application. Environ. Model. Softw. 2022, 151, 105367. [Google Scholar] [CrossRef]
- Nkeki, F.N.; Bello, E.I.; Agbaje, I.G. Flood risk mapping and urban infrastructural susceptibility assessment using a GIS and analytic hierarchical raster fusion approach in the Ona River Basin, Nigeria. Int. J. Disaster Risk Reduct. 2022, 77, 103097. [Google Scholar] [CrossRef]
- Samantaray, S.; Das, S.S.; Sahoo, A.; Satapathy, D.P. Evaluating the application of metaheuristic approaches for flood simulation using GIS: A case study of Baitarani river Basin, India. Mater. Today Proc. 2022, 61, 452–465. [Google Scholar] [CrossRef]
- Nghia, B.P.Q.; Pal, I.; Chollacoop, N.; Mukhopadhyay, A. Applying Google earth engine for flood mapping and monitoring in the downstream provinces of Mekong river. Prog. Disaster Sci. 2022, 14, 100235. [Google Scholar] [CrossRef]
- Senouci, M.R.; Mellouk, A. Deploying Wireless Sensor Networks; Elsevier: Amsterdam, The Netherlands, 2016. [Google Scholar] [CrossRef]
- Siddique, A.A.; Qadri, M.T. Wireless sensor network (WSN) based early flood warning system. Int. J. Inf. Technol. 2020, 12, 567–570. [Google Scholar] [CrossRef]
- Lukić, Đ.; Lukić, B. Application of Wireless Sensor Networks in Flood Detection and River Pollution Monitoring. Forum Geogr. 2018, XVII, 118–122. [Google Scholar] [CrossRef]
- Wahyono, I.D.; Aripriharta; Jong, G.J.; Asfani, K.; Afandi, A.N.; Fadlika, I. New Algorithm to Determine Prediction Accuracy on Wireless Sensor Networks. In Proceedings of the 2019 International Conference on Electrical, Electronics and Information Engineering (ICEEIE), Denpasar, Indonesia, 3–4 October 2019; pp. 144–147. [Google Scholar] [CrossRef]
- Saharia, T.; Baruah, R.K.; Goswami, R.; Sonowal, D. Validation and Implementation of a Smart Flood Surveillance System Based on Wireless Sensor Network. In The Micro and Nanoelectronics Devices, Circuits and Systems Conference 2021; Springer: Berlin/Heidelberg, Germany, 2022; Volume 781, pp. 471–479. [Google Scholar] [CrossRef]
- Oracle What Is the Internet of Things (IoT)? Available online: https://bit.ly/orcliot (accessed on 21 July 2022).
- Che Soh, Z.H.; Abd Razak, M.S.; Hamzah, I.H.; Zainol, M.N.; Sulaiman, S.N.; Yahaya, S.Z.; Che Abdullah, S.A. Riverbank Monitoring using Image Processing for Early Flood Warning System via IoT. Int. J. Integr. Eng. 2022, 14, 166–174. [Google Scholar] [CrossRef]
- Biantoro, A.W.; Wahyudi, S.I.; Niam, M.F.; Mahardika, A.G. Analysis of Ciliwung river flood debit and city flood anticipation using floods early detection system (FEDS). IOP Conf. Ser. Earth Environ. Sci. 2022, 955, 012011. [Google Scholar] [CrossRef]
- Blynk IoT Platform: For Businesses and Developers. Available online: https://blynk.io/ (accessed on 21 July 2022).
- Acosta, J.; Mendez, D.; Moreno, D.; Montanez, G.; Trujillo, L.; Escobar, M.; Gonzalez, I. An IoT-based scalable river level monitoring platform. Int. J. Sens. Netw. 2022, 38, 263–272. [Google Scholar] [CrossRef]
- Ganesh, R.S.; Sasipriya, S.; Gowtham Balaji, M.; Ashok Karthi, G.; Gokul Dharan, S. An IoT-based Dam Water Level Monitoring and Alerting System. In Proceedings of the 2022 International Conference on Applied Artificial Intelligence and Computing (ICAAIC), Salem, India, 9–11 May 2022; pp. 1551–1554. [Google Scholar] [CrossRef]
- Chaudhari, B.S.; Zennaro, M.; Borkar, S. LPWAN technologies: Emerging application characteristics, requirements, and design considerations. Future Internet 2020, 12, 46. [Google Scholar] [CrossRef]
- Shea, S. What is LPWAN (Low-Power Wide Area Network)?—Definition from WhatIs.com. Available online: https://bit.ly/LPWANss (accessed on 24 July 2022).
- Manuel, M.P.; Faied, M.; Krishnan, M. A Novel LoRa LPWAN-Based Communication Architecture for Search & Rescue Missions. IEEE Access 2022, 10, 57596–57607. [Google Scholar] [CrossRef]
- Ibarreche, J.; Aquino, R.; Edwards, R.M.; Rangel, V.; Pérez, I.; Martínez, M.; Castellanos, E.; Álvarez, E.; Jimenez, S.; Rentería, R.; et al. Flash Flood Early Warning System in Colima, Mexico. Sensors 2020, 20, 5231. [Google Scholar] [CrossRef]
- Sung, W.-T.; Devi, I.V.; Hsiao, S.-J. Early warning of impending flash flood based on AIoT. EURASIP J. Wirel. Commun. Netw. 2022, 2022, 15. [Google Scholar] [CrossRef]
- Ragnoli, M.; Barile, G.; Leoni, A.; Ferri, G.; Stornelli, V. An Autonomous Low-Power LoRa-Based Flood-Monitoring System. J. Low Power Electron. Appl. 2020, 10, 15. [Google Scholar] [CrossRef]
- Yeon, S.; Kang, J.; Lee, I. A study on real-time flood monitoring system based on sensors using flood damage insurance map. Int. Arch. Photogramm. Remote Sens. Spat. Inf. Sci. 2018, XLII-3/W4, 569–571. [Google Scholar] [CrossRef]
- Di Gennaro, P.; Lofú, D.; Vitanio, D.; Tedeschi, P.; Boccadoro, P. WaterS: A Sigfox-compliant prototype for water monitoring. Internet Technol. Lett. 2019, 2, e74. [Google Scholar] [CrossRef]
- Eling, M.; Nuessle, D.; Staubli, J. The impact of artificial intelligence along the insurance value chain and on the insurability of risks. Geneva Pap. Risk Insur.-Issues Pract. 2022, 47, 205–241. [Google Scholar] [CrossRef]
- Shi, Y.; Yang, K.; Yang, Z.; Zhou, Y. Mobile Edge Artificial Intelligence: Opportunities and Challenges; Elsevier: Amsterdam, The Netherlands, 2021. [Google Scholar] [CrossRef]
- Qaisar, S.M.; Mihoub, A.; Krichen, M.; Nisar, H. Multirate Processing with Selective Subbands and Machine Learning for Efficient Arrhythmia Classification. Sensors 2021, 21, 1511. [Google Scholar] [CrossRef] [PubMed]
- Mihoub, A. A Deep Learning-Based Framework for Human Activity Recognition in Smart Homes. Mob. Inf. Syst. 2021, 2021, 6961343. [Google Scholar] [CrossRef]
- Zidi, S.; Mihoub, A.; Mian Qaisar, S.; Krichen, M.; Abu Al-Haija, Q. Theft detection dataset for benchmarking and machine learning based classification in a smart grid environment. J. King Saud Univ. —Comput. Inf. Sci. 2022, in press. [Google Scholar] [CrossRef]
- Mihoub, A.; Snoun, H.; Krichen, M.; Salah, R.B.H.; Kahia, M. Predicting COVID-19 Spread Level using Socio- Economic Indicators and Machine Learning Techniques. In Proceedings of the 2020 First International Conference of Smart Systems and Emerging Technologies (SMARTTECH), Riyadh, Saudi Arabia, 3–5 November 2020; pp. 128–133. [Google Scholar] [CrossRef]
- Mihoub, A.; Fredj, O.B.; Cheikhrouhou, O.; Derhab, A.; Krichen, M. Denial of service attack detection and mitigation for internet of things using looking-back-enabled machine learning techniques. Comput. Electr. Eng. 2022, 98, 107716. [Google Scholar] [CrossRef]
- Ren, Z.; Han, X.; Yu, X.; Skjetne, R.; Leira, B.J.; Sævik, S.; Zhu, M. Data-driven simultaneous identification of the 6DOF dynamic model and wave load for a ship in waves. Mech. Syst. Signal Process. 2023, 184, 109422. [Google Scholar] [CrossRef]
- Yu, Y.; Hao, Z.; Li, G.; Liu, Y.; Yang, R.; Liu, H. Optimal search mapping among sensors in heterogeneous smart homes. Math. Biosci. Eng. 2022, 20, 1960–1980. [Google Scholar] [CrossRef]
- Chen, H.; Miao, F.; Chen, Y.; Xiong, Y.; Chen, T. A Hyperspectral Image Classification Method Using Multifeature Vectors and Optimized KELM. IEEE J. Sel. Top. Appl. Earth Obs. Remote Sens. 2021, 14, 2781–2795. [Google Scholar] [CrossRef]
- Cai, X.; Zhao, H.; Shang, S.; Zhou, Y.; Deng, W.; Chen, H.; Deng, W. An improved quantum-inspired cooperative co-evolution algorithm with muli-strategy and its application. Expert Syst. Appl. 2021, 171, 114629. [Google Scholar] [CrossRef]
- Hasanuzzaman, M.; Islam, A.; Bera, B.; Shit, P.K. A comparison of performance measures of three machine learning algorithms for flood susceptibility mapping of river Silabati (tropical river, India). Phys. Chem. Earth Parts A/B/C 2022, 127, 103198. [Google Scholar] [CrossRef]
- Luppichini, M.; Barsanti, M.; Giannecchini, R.; Bini, M. Deep learning models to predict flood events in fast-flowing watersheds. Sci. Total Environ. 2022, 813, 151885. [Google Scholar] [CrossRef] [PubMed]
- Atashi, V.; Gorji, H.T.; Shahabi, S.M.; Kardan, R.; Lim, Y.H. Water Level Forecasting Using Deep Learning Time-Series Analysis: A Case Study of Red River of the North. Water 2022, 14, 1971. [Google Scholar] [CrossRef]
- Tanim, A.H.; McRae, C.B.; Tavakol-Davani, H.; Goharian, E. Flood Detection in Urban Areas Using Satellite Imagery and Machine Learning. Water 2022, 14, 1140. [Google Scholar] [CrossRef]
- Boulouard, Z.; Ouaissa, M.; Ouaissa, M.; El Himer, S. AI and IoT for Sustainable Development in Emerging Countries; Lecture Notes on Data Engineering and Communications Technologies; Springer International Publishing: Cham, Swizerland, 2022; Volume 105. [Google Scholar] [CrossRef]
- Goudarzi, S.; Ahmad Soleymani, S.; Hossein Anisi, M.; Ciuonzo, D.; Kama, N.; Abdullah, S.; Abdollahi Azgomi, M.; Chaczko, Z.; Azmi, A. Real-Time and Intelligent Flood Forecasting Using UAV-Assisted Wireless Sensor Network. Comput. Mater. Contin. 2022, 70, 715–738. [Google Scholar] [CrossRef]
- Fernandes Junior, F.E.; Nonato, L.G.; Ranieri, C.M.; Ueyama, J. Memory-Based Pruning of Deep Neural Networks for IoT Devices Applied to Flood Detection. Sensors 2021, 21, 7506. [Google Scholar] [CrossRef]
- Mangukiya, N.K.; Sharma, A. Flood risk mapping for the lower Narmada basin in India: A machine learning and IoT-based framework. Nat. Hazards 2022, 113, 1285–1304. [Google Scholar] [CrossRef]
- Anuradha, B.; Abinaya, C.; Bharathi, M.; Janani, A.; Khan, A. IoT Based Natural Disaster Monitoring and Prediction Analysis for Hills Area Using LSTM Network. In Proceedings of the 2022 8th International Conference on Advanced Computing and Communication Systems (ICACCS), Coimbatore, India, 25–26 March 2022; pp. 1908–1913. [Google Scholar] [CrossRef]
- Dudak, J.; Kebisek, M.; Gaspar, G.; Fabo, P. Implementation of machine learning algorithm in embedded devices. In Proceedings of the 2020 19th International Conference on Mechatronics—Mechatronika (ME), Prague, Czech Republic, 2–4 December 2020; pp. 1–6. [Google Scholar] [CrossRef]
- Gokul, H.; Suresh, P.; Hari Vignesh, B.; Pravin Kumaar, R.; Vijayaraghavan, V. Gait Recovery System for Parkinson’s Disease using Machine Learning on Embedded Platforms. In Proceedings of the 2020 IEEE International Systems Conference (SysCon), Montreal, QC, Canada, 24 August 2020; pp. 1–8. [Google Scholar] [CrossRef]
- Gupta, C.; Suggala, A.S.; Goyal, A.; Simhadri, H.V.; Paranjape, B.; Kumar, A.; Goya, S.; Udupa, R.; Varma, M.; Jain, P. ProtoNN: Compressed and accurate kNN for resource-scarce devices. In Proceedings of the 34th International Conference on Machine Learning, ICML 2017, Sydney, Australia, 6–11 August 2017; Volume 3, pp. 2144–2159. [Google Scholar]
- Peruzzi, G.; Galli, A.; Pozzebon, A. A Novel Methodology to Remotely and Early Diagnose Sleep Bruxism by Leveraging on Audio Signals and Embedded Machine Learning. In Proceedings of the 2022 IEEE International Symposium on Measurements & Networking (M&N), Padua, Italy, 18–20 July 2022; pp. 1–6. [Google Scholar] [CrossRef]
- Ali, S.A.; Ashfaq, F.; Nisar, E.; Azmat, U.; Zeb, J. A Prototype for Flood Warning and Management System using Mobile Networks. In Proceedings of the 2020 17th International Bhurban Conference on Applied Sciences and Technology (IBCAST), Islamabad, Pakistan, 14–18 January 2020; pp. 326–331. [Google Scholar] [CrossRef]
- Covenas, F.E.M.; Palomares, R.; Milla, M.A.; Verastegui, J.; Cornejo, J. Design and Development of a Low-Cost Wireless Network Using IoT Technologies for a Mudslides Monitoring System. In Proceedings of the 2021 IEEE URUCON, Montevideo, Uruguay, 24–26 November 2021; pp. 172–176. [Google Scholar] [CrossRef]
- Yang, S.-N.; Chang, L.-C. Regional Inundation Forecasting Using Machine Learning Techniques with the Internet of Things. Water 2020, 12, 1578. [Google Scholar] [CrossRef]
- Khalaf, M.; Alaskar, H.; Hussain, A.J.; Baker, T.; Maamar, Z.; Buyya, R.; Liatsis, P.; Khan, W.; Tawfik, H.; Al-Jumeily, D. IoT-Enabled Flood Severity Prediction via Ensemble Machine Learning Models. IEEE Access 2020, 8, 70375–70386. [Google Scholar] [CrossRef]
- Adefemi Alimi, K.O.; Ouahada, K.; Abu-Mahfouz, A.M.; Rimer, S. A Survey on the Security of Low Power Wide Area Networks: Threats, Challenges, and Potential Solutions. Sensors 2020, 20, 5800. [Google Scholar] [CrossRef]
- Muteba, F.; Djouani, K.; Olwal, T. A comparative survey study on LPWA IoT technologies: Design, considerations, challenges and solutions. Procedia Comput. Sci. 2019, 155, 636–641. [Google Scholar] [CrossRef]
- LoRa Alliance What is LoRaWAN® Specification? Available online: https://bit.ly/lorawan1 (accessed on 22 November 2022).
- Amazon Web Services What is LoRaWAN?—AWS IoT Core. Available online: https://bit.ly/lorawanaws (accessed on 23 November 2022).
- Tadrist, N.; Debauche, O.; Mahmoudi, S.; Guttadauria, A. Towards Low-Cost IoT and LPWAN-Based Flood Forecast and Monitoring System. J. Ubiquitous Syst. Pervasive Netw. 2022, 17, 43–49. [Google Scholar] [CrossRef]
- Ortega-Gonzalez, L.; Acosta-Coll, M.; Piñeres-Espitia, G.; Aziz Butt, S. Communication protocols evaluation for a wireless rainfall monitoring network in an urban area. Heliyon 2021, 7, e07353. [Google Scholar] [CrossRef] [PubMed]
- Advantech WISE-4610. 2020. Available online: https://bit.ly/wise4610p (accessed on 23 November 2022).
- Advantech WISE-6610. 2021. Available online: https://bit.ly/wise6610w (accessed on 23 November 2022).
- Advantech Co-Creating the Future of the IoT World. Available online: https://www.advantech.com/en (accessed on 23 November 2022).
- UK-DEFRA Catchment Based Approach: Improving the Quality of Our Water Environment A Policy Framework to Encourage the Wider Adoption of an Integrated Catchment Based Approach to Improving the Quality of Our Water Environment. Available online: https://bit.ly/catchmentpaper (accessed on 27 July 2022).
- UK-DEFRA. How to Use Catchment Data Explorer. Available online: https://bit.ly/catchdataexp (accessed on 28 July 2022).
- Kobia. Multi-Class Classification Metrics. Available online: https://bit.ly/multicm (accessed on 29 July 2022).
- Joseph, V.R. Optimal ratio for data splitting. Stat. Anal. Data Min. ASA Data Sci. J. 2022, 15, 531–538. [Google Scholar] [CrossRef]
- Hashmi, F. How to Tune Hyperparameters Using Random Search CV in Python—Thinking Neuron. Available online: https://bit.ly/RScv2 (accessed on 22 November 2022).
Publisher’s Note: MDPI stays neutral with regard to jurisdictional claims in published maps and institutional affiliations. |
© 2022 by the authors. Licensee MDPI, Basel, Switzerland. This article is an open access article distributed under the terms and conditions of the Creative Commons Attribution (CC BY) license (https://creativecommons.org/licenses/by/4.0/).