
Evolution of Sensor Research for Clarifying the Dynamics and Properties of Future Directions


Abstract
1. Introduction
2. Materials and Methods
2.1. Data Processing Resources
2.2. Data Processing Procedure and Computational Approach for Network Analysis
- ▪
- Bibliographic data were downloaded from the Web of Science (2022) database [38] and split into three periods: 1990 to 2000, 2001 to 2010, and 2011 to 2020.
- ▪
- All the combined phrases that lacked “sensor”, “sensing”, or “sense” and adjective clauses were removed. This step focused only on words related to sensor technologies (for instance, biosensors, wireless sensor networks, gas sensors, etc.)
- ▪
- ▪
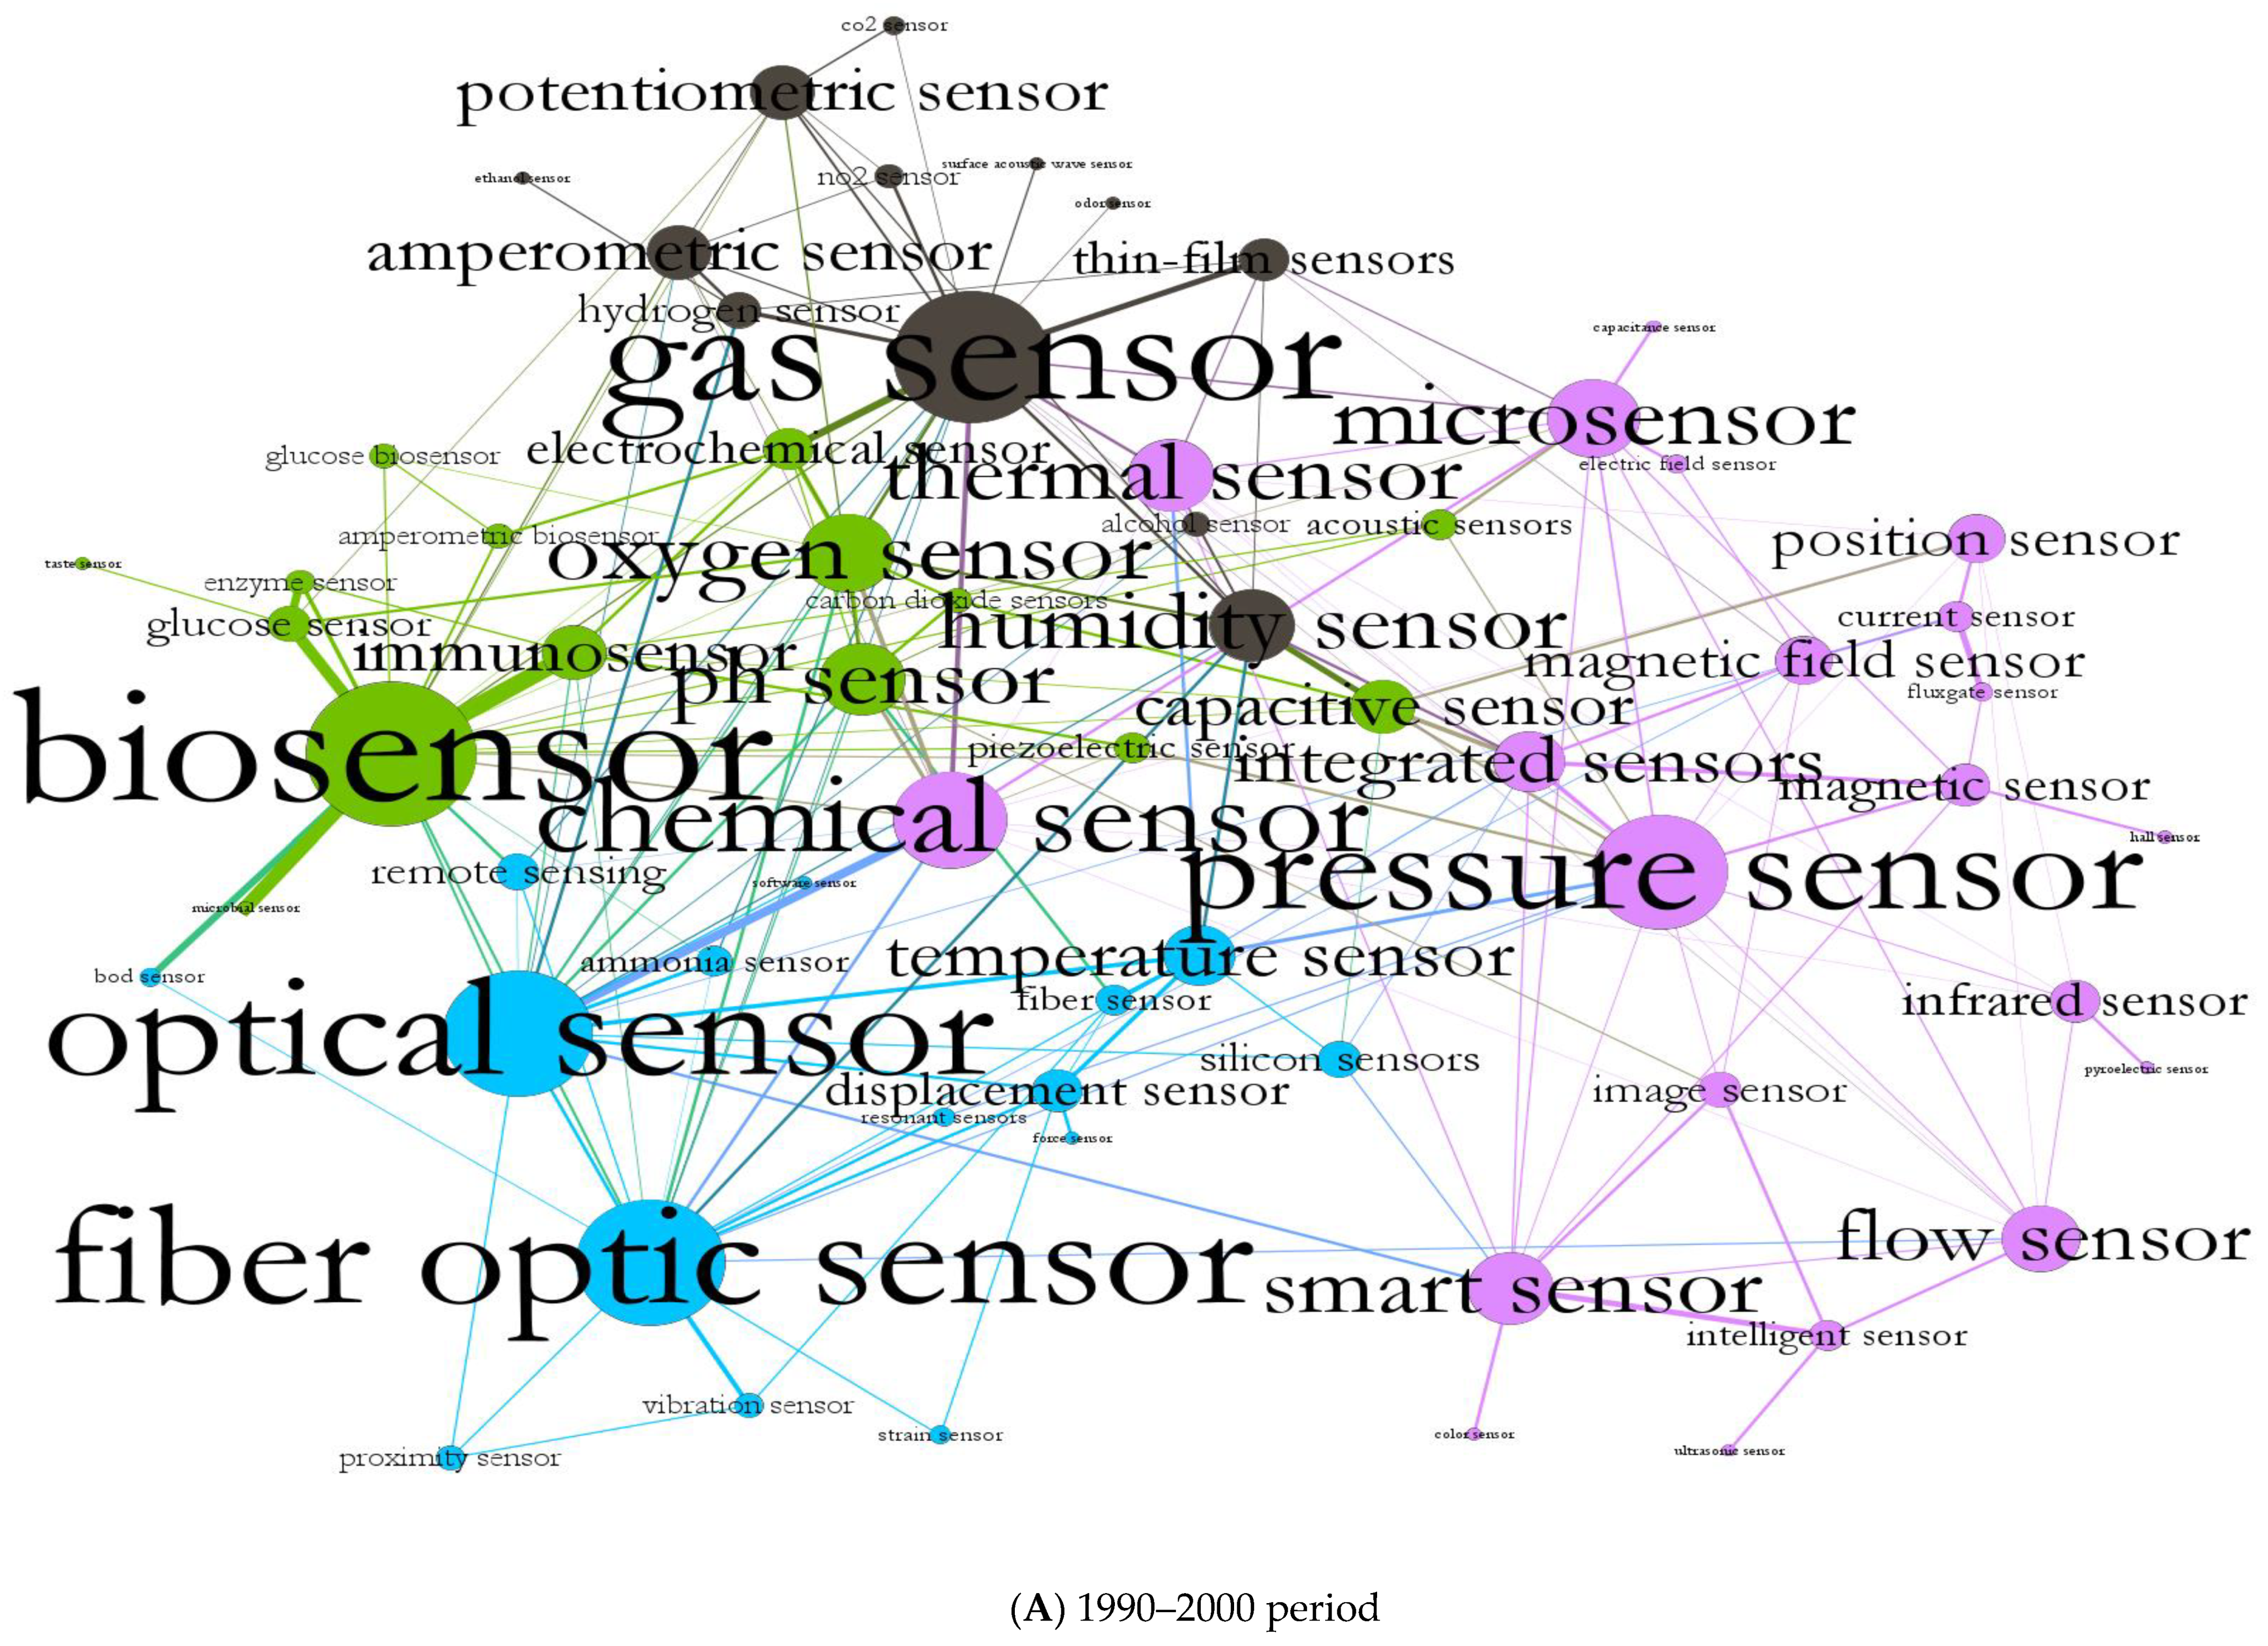
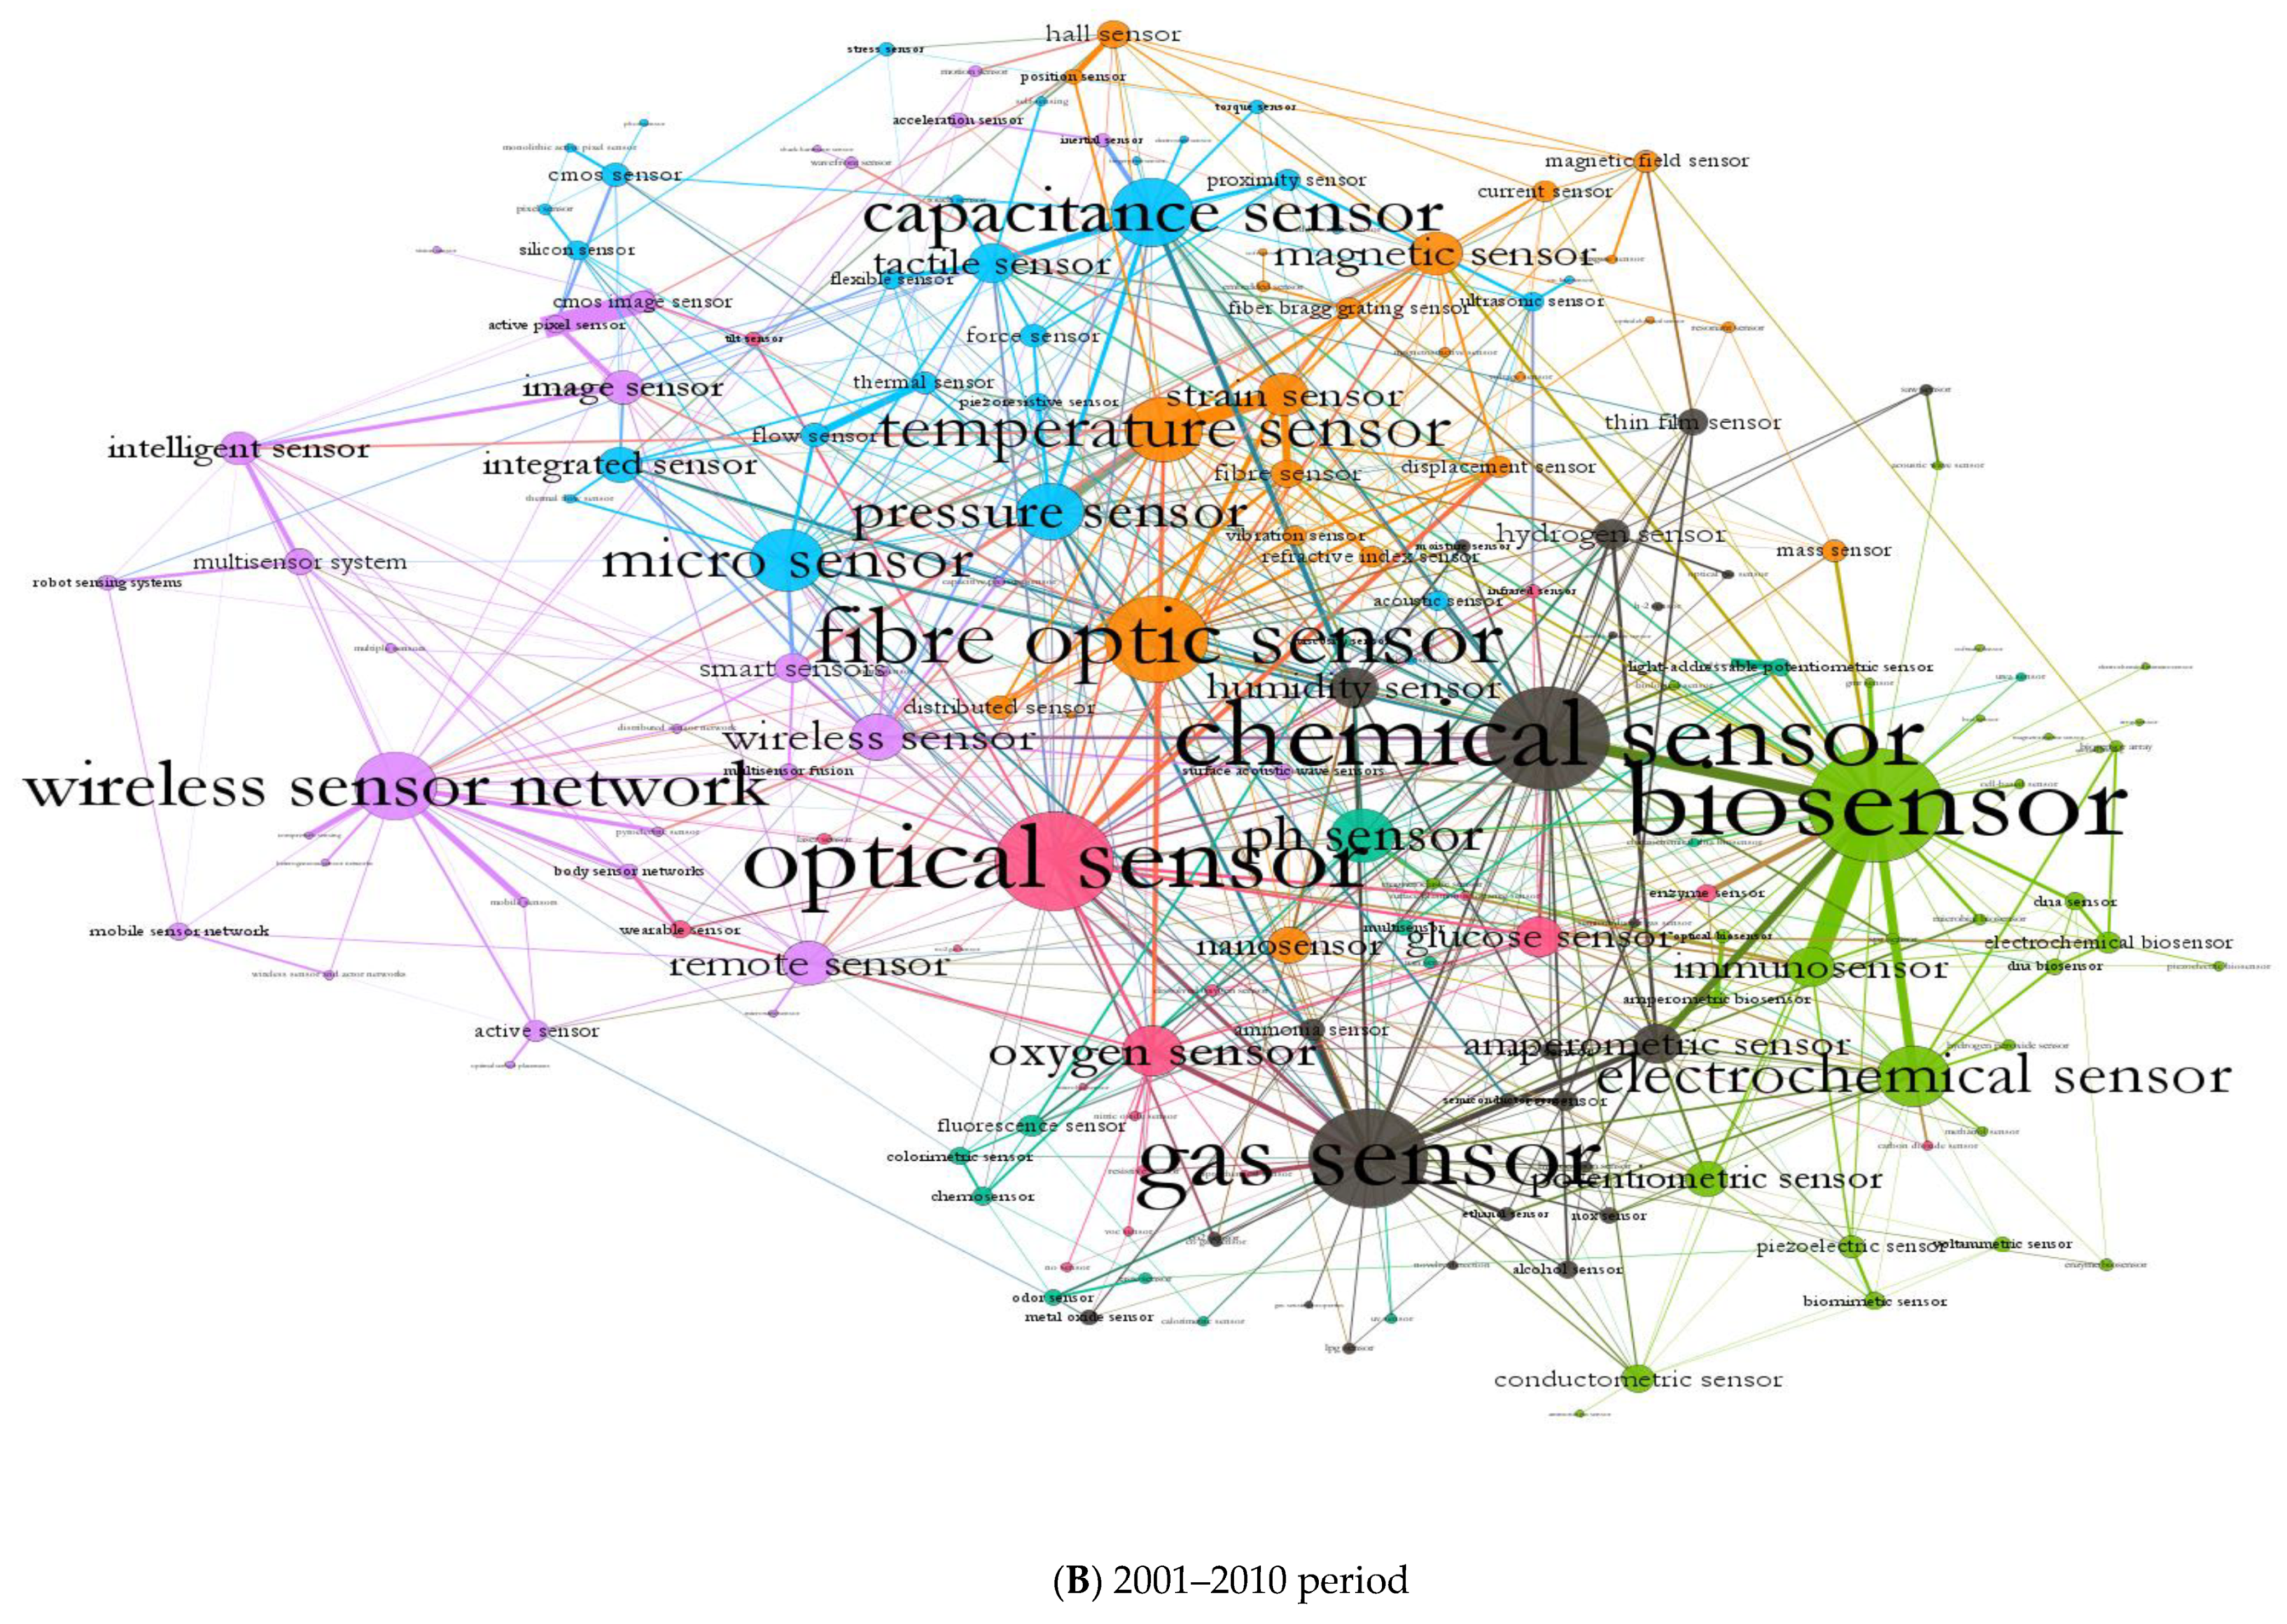
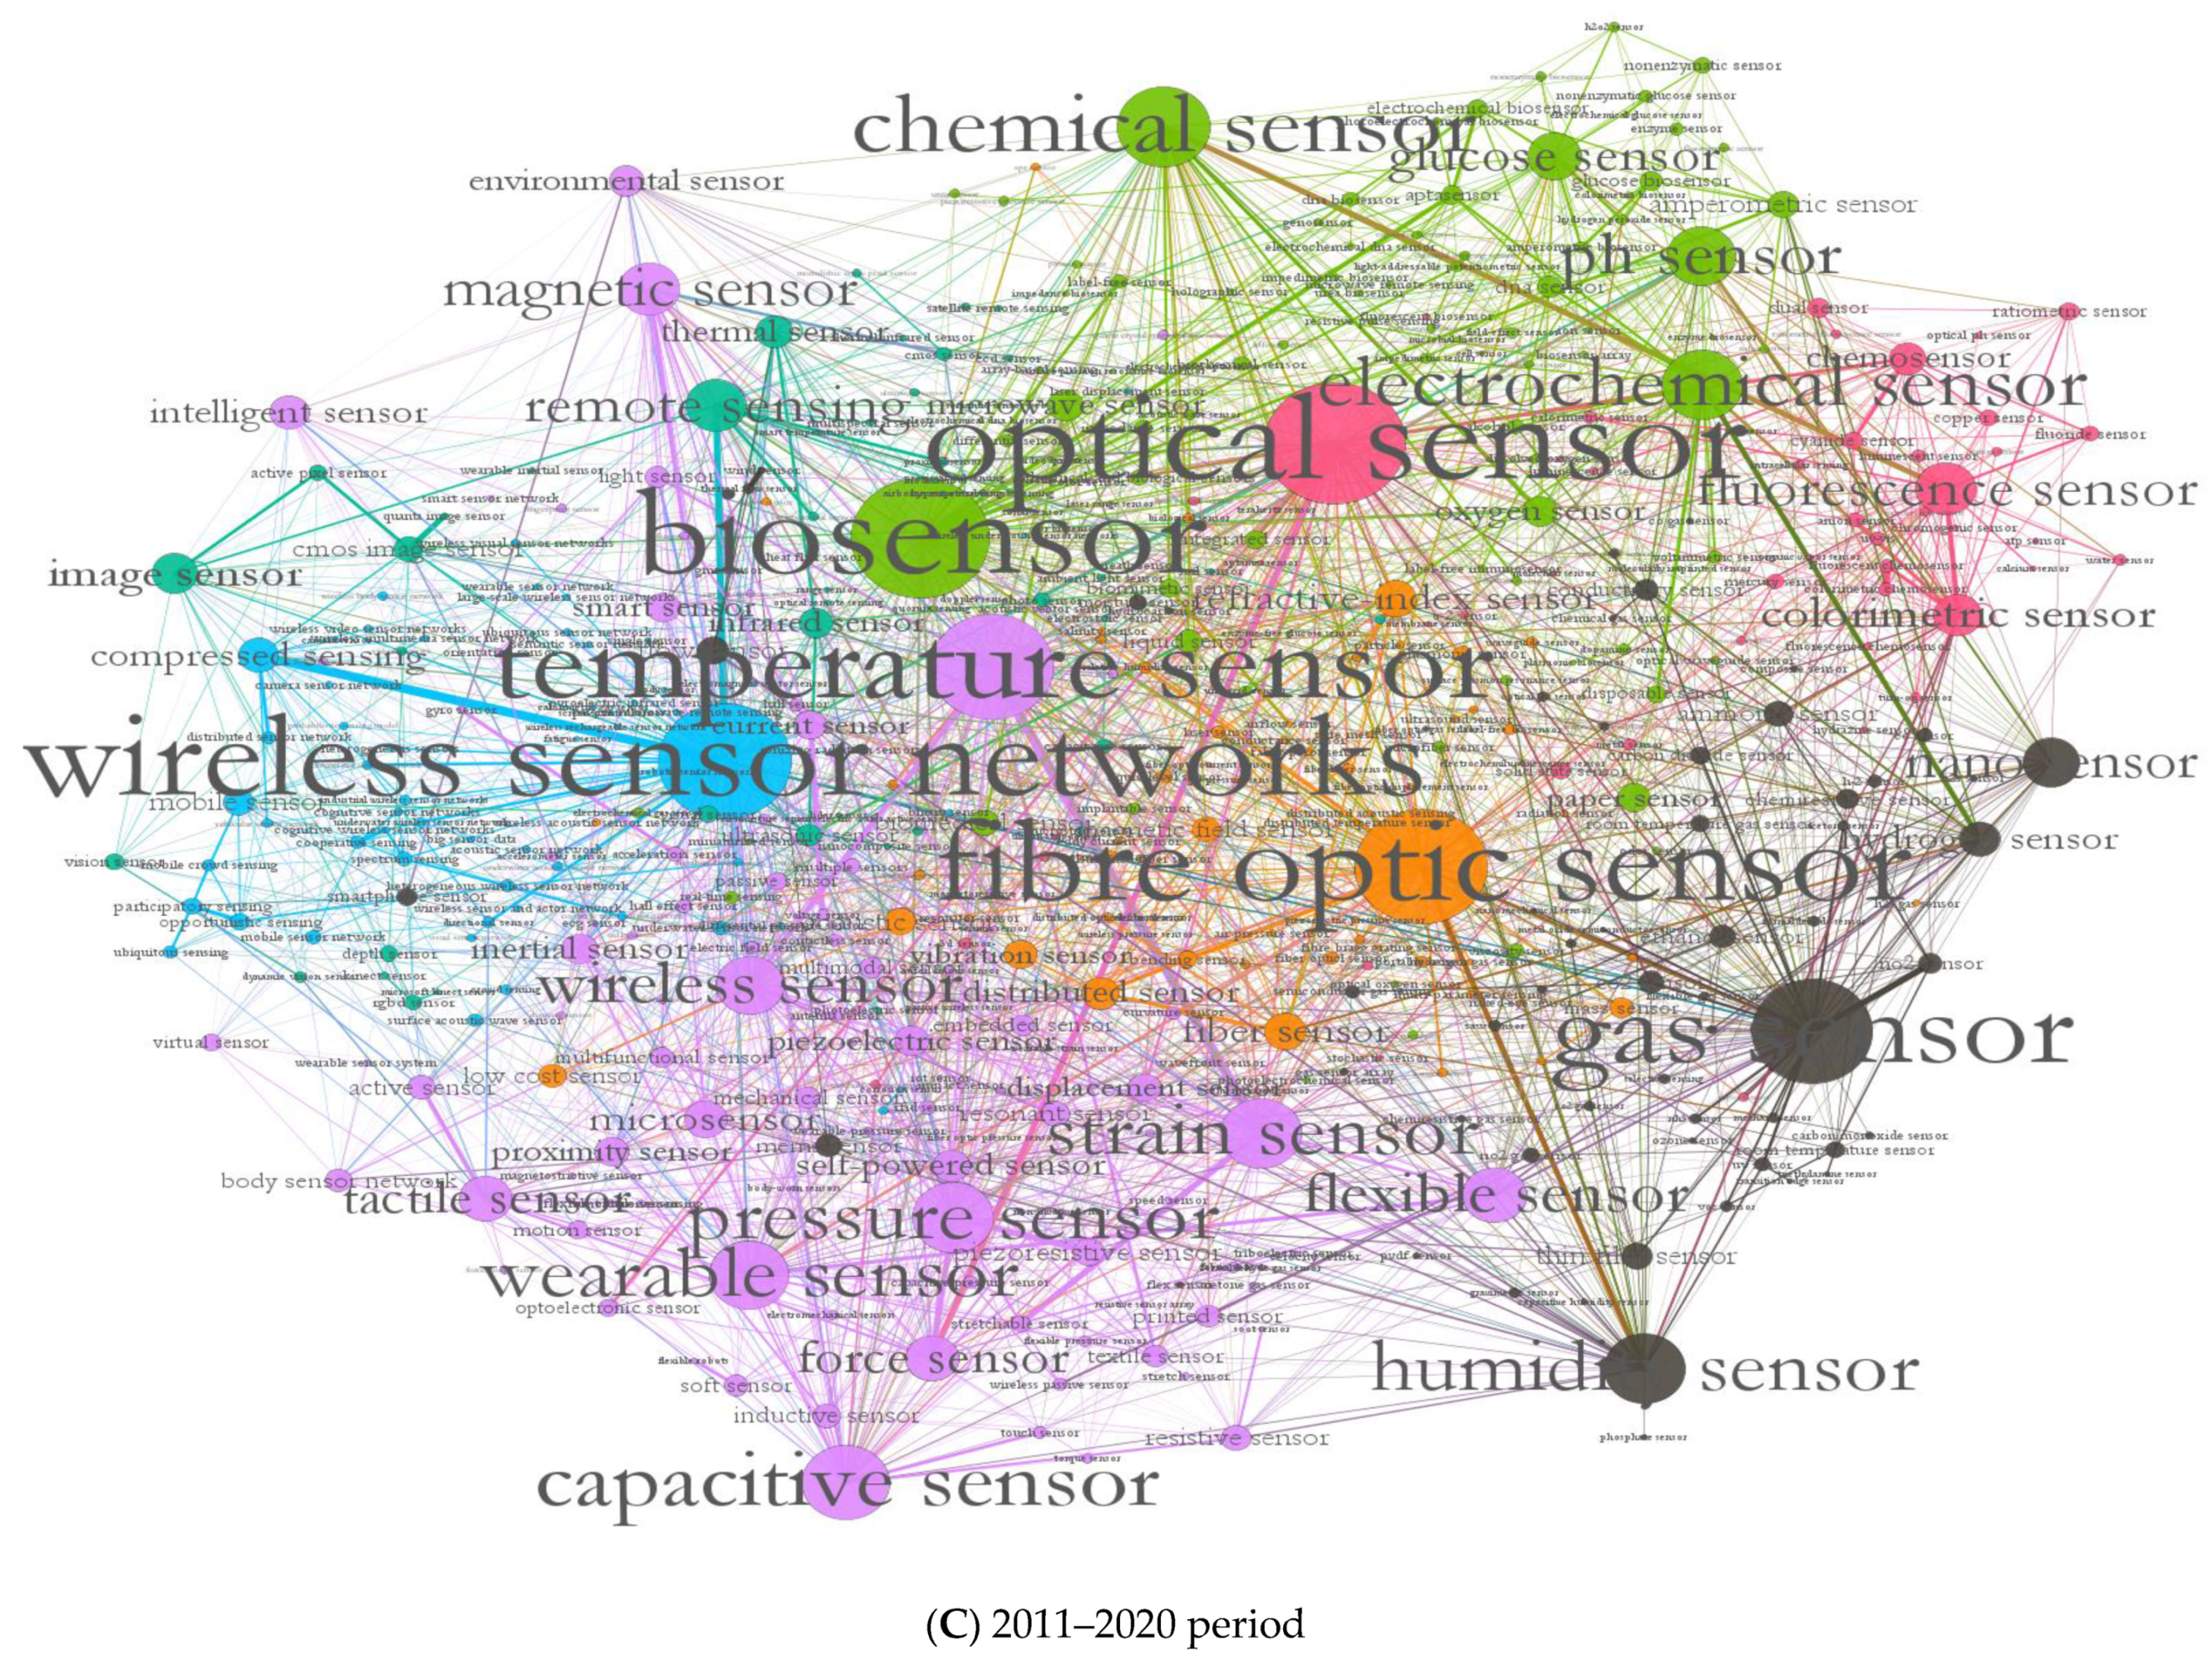
- Afterwards, we utilized Gephi software version 0.9.2 to visualize the matrix of co-occurrences and calculate the network measures [48]. The node indicates the words related to sensor research and technologies, and a link makes a connection between two words whenever they appeared in at least ten articles. To put it differently, a link means two different words co-occurred in at least ten articles. The color of nodes represents the community: when two nodes have a similar color, they are in the same community in the classification. The thickness of each edge represents the weight of co-occurrences. If more than two terms appeared in the same documents; the connected edge will be thicker.
- −
- Degree centrality (DC) indicates the number of edges a node has [50]. In the word co-occurrence networks, degree denotes the total number of words that appear with the node in the same documents. Degree centrality of node v is given by:
- −
- −
- A node’s closeness centrality (CC) is an indicator of a network centrality: it is the number of links needed to connect each node in the network with all the other nodes in the network or the average number of links required to reach all other nodes in the network from a node in the network [6].
- −
- Finally, community structure represents the categorization of technologies interconnection using the modularity algorithm to distinguish the classifications [53]. The number of communities calculated by modularity function (Q) is:
3. Results and Discussion
3.1. The Ecosystem of Sensor Research and Technologies in the 1990–2000 Period
3.2. The Ecosystem of Sensor Research and Technologies in the 2001–2010 Period
3.3. The Ecosystem of Sensor Research and Technologies in the 2011–2020 Period
3.4. General Discussion of the Evolution of Sensors, 1990–2020 Period
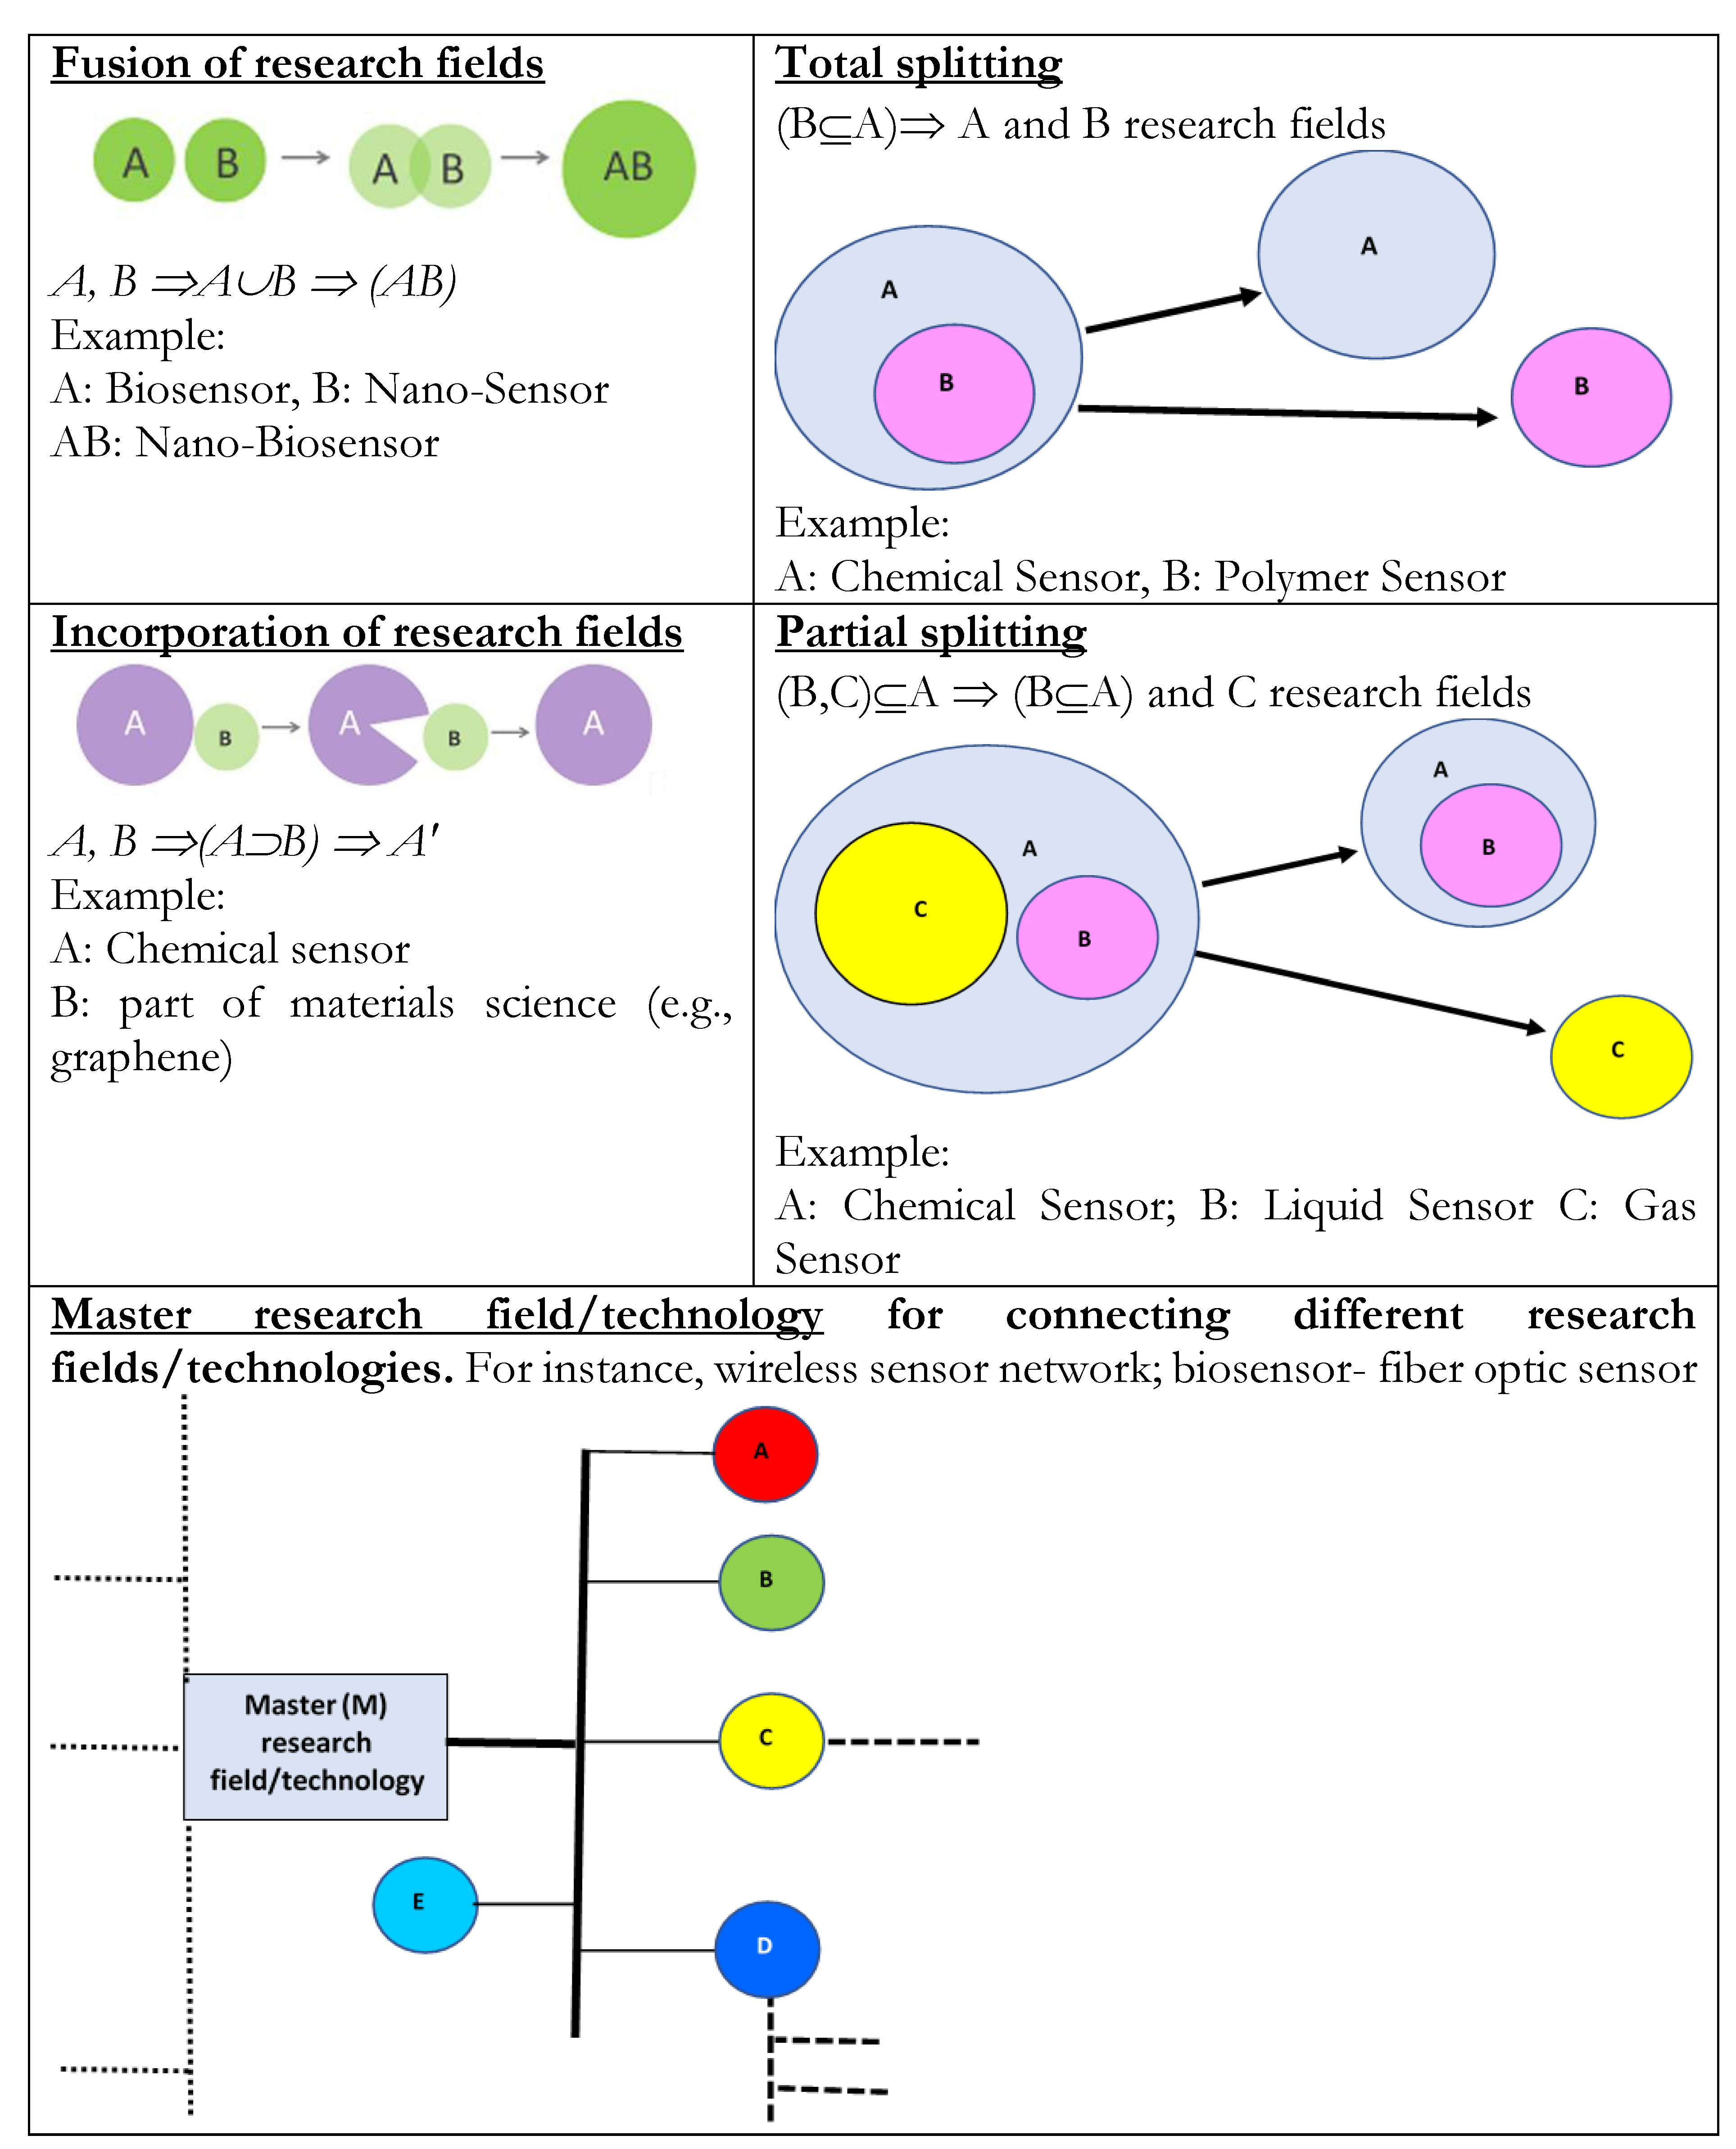
3.5. Properties of the Evolution of Networks in Sensor Research
- □
- Total fusion of research fields is when two or more research fields (e.g., A and B) merge and create a new one (i.e., AB) that evolves as a whole system. For instance, in sensor research, nano-bio sensor is a fusion of nanosensor and biosensor. In particular, the combination of these two technologies and research fields created a new potential field.
- □
- Partial fusion is, during the scientific change, the incorporation of a smaller research field (e.g., B) into a large research field (e.g., A), generating a super research field A’ (that embodies B). For instance, in sensor research, the “chemical sensor” includes areas of materials science (e.g., graphene) with the goal of generating ion/molecule sensors applied in pharmaceutical and food production.
- □
- Total splitting (total fission) is when a research field A (including a sub-research field B) splits into research fields A and B that have autonomous evolutionary trajectories. For instance, in sensor research, polymer sensor is a technology born in the chemical sensor community, which then grew up independently and created its own domain of study and evolutionary pathway.
- □
- Partial splitting (partial fission) is when research field A (containing sub-research fields B and C) develops by splitting into a research field A’’, also containing B, and a research field C that splits off from the original set A; both research fields have autonomous evolutionary trajectories. For instance, in sensor research, both gas sensors and liquid sensors dawned in the chemical sensors field; eventually, gas sensors began their evolution independently from chemical sensors and created their own domain; however, liquid sensors still cannot be considered as a dependent province of science, and its expansion is intertwined with growth of chemical sensors.
- □
- Master technologies have a connective role for other technologies with an integrated-based structure by bridging and supporting the development of other inter-related technologies, such as wireless sensor networks, biosensors, and fiber optic sensors. They play a vital role in integrating elements of the networks and connecting sensor technologies to create new paths through evolution of science and technology. Master technologies increase exponentially in ecosystem of sensor research.
4. Conclusions, Limitations, and Prospects
4.1. Contribution to Theory
- Sensor technologies evolve with increasing interactions among different research fields and innovations.
- Sensors evolve with technological trajectories directed to specialized innovations that solve problems.
- Sensor research evolves with processes of:
- −
- Total fusion of different inter-related research fields
- −
- Partial fusion with the incorporation of a smaller research field into a large research field
- −
- Total splitting (total fission) when a research field splits up in different research fields
- −
- Partial splitting (partial fission) when a research field develops by splitting part of its elements in a new research field having an autonomous trajectory of growth
- −
- Master technologies that have a connective role for other inter-related technologies, thus supporting a systemic evolution.
4.2. Management and Policy Contribution
4.3. Limitations
4.4. Future Research
Author Contributions
Funding
Institutional Review Board Statement
Informed Consent Statement
Data Availability Statement
Conflicts of Interest
References
- Andersen, P.D.; Jørgensen, B.H.; Lading, L.; Rasmussen, B. Sensor Foresight—Technology and Market. Technovation 2004, 24, 311–320. [Google Scholar] [CrossRef]
- Wilson, J.S. Sensor Technology Handbook; Elsevier: Amsterdam, The Netherlands; Boston, MA, USA, 2005; ISBN 9780750677295. [Google Scholar]
- Coccia, M.; Roshani, S.; Mosleh, M. Scientific Developments and New Technological Trajectories in Sensor Research. Sensors 2021, 21, 7803. [Google Scholar] [CrossRef] [PubMed]
- Roshani, S.; Coccia, M.; Mosleh, M. Sensor Technology for Opening New Pathways in Diagnosis and Therapeutics of Breast, Lung, Colorectal and Prostate Cancer. HighTech Innov. J. 2022, 3, 356–375. [Google Scholar] [CrossRef]
- Coccia, M. Technological Trajectories in Quantum Computing to Design a Quantum Ecosystem for Industrial Change. Technol. Anal. Strateg. Manag. 2022, 1–16. [Google Scholar] [CrossRef]
- Coccia, M.; Roshani, S.; Mosleh, M. Evolution of Quantum Computing: Theoretical and Innovation Management Implications for Emerging Quantum Industry. IEEE Trans. Eng. Manag. 2022, 1–11. [Google Scholar] [CrossRef]
- Alharbi, M.A.; Kolberg, M.; Zeeshan, M. Towards Improved Clustering and Routing Protocol for Wireless Sensor Networks. J. Wirel. Com Netw. 2021, 2021, 46. [Google Scholar] [CrossRef]
- Banerjee, A.; Maity, S.; Mastrangelo, C.H. Nanostructures for Biosensing, with a Brief Overview on Cancer Detection, IoT, and the Role of Machine Learning in Smart Biosensors. Sensors 2021, 21, 1253. [Google Scholar] [CrossRef]
- Davoli, L.; Paraskevopoulos, I.; Campanella, C.; Bauro, S.; Vio, T.; Abrardo, A.; Ferrari, G. Ultrasonic-Based Environmental Perception for Mobile 5G-Oriented XR Applications. Sensors 2021, 21, 1329. [Google Scholar] [CrossRef]
- Yaqoob, U.; Younis, M.I. Chemical Gas Sensors: Recent Developments, Challenges, and the Potential of Machine Learning—A Review. Sensors 2021, 21, 2877. [Google Scholar] [CrossRef]
- Pal, S.; Hitchens, M.; Rabehaja, T.; Mukhopadhyay, S. Security Requirements for the Internet of Things: A Systematic Approach. Sensors 2020, 20, 5897. [Google Scholar] [CrossRef]
- Seymour, I.; Narayan, T.; Creedon, N.; Kennedy, K.; Murphy, A.; Sayers, R.; Kennedy, E.; O’Connell, I.; Rohan, J.F.; O’Riordan, A. Advanced Solid State Nano-Electrochemical Sensors and System for Agri 4.0 Applications. Sensors 2021, 21, 3149. [Google Scholar] [CrossRef] [PubMed]
- Wang, G.; Liu, Y.; Chen, X.; Yan, Q.; Sui, H.; Ma, C.; Zhang, J. Power Transformer Fault Diagnosis System Based on Internet of Things. J. Wirel. Com. Netw. 2021, 2021, 21. [Google Scholar] [CrossRef]
- Elsisi, M.; Mahmoud, K.; Lehtonen, M.; Darwish, M.M.F. Reliable Industry 4.0 Based on Machine Learning and IoT for Analyzing, Monitoring, and Securing Smart Meters. Sensors 2021, 21, 487. [Google Scholar] [CrossRef] [PubMed]
- Boyack, K.W.; Börner, K.; Klavans, R. Mapping the Structure and Evolution of Chemistry Research. Scientometrics 2009, 79, 45–60. [Google Scholar] [CrossRef]
- Leydesdorff, L. Various Methods for the Mapping of Science. Scientometrics 1987, 11, 295–324. [Google Scholar] [CrossRef]
- Roshani, S.; Bagherylooieh, M.-R.; Mosleh, M.; Coccia, M. What Is the Relationship between Research Funding and Citation-Based Performance? A Comparative Analysis between Critical Disciplines. Scientometrics 2021, 126, 7859–7874. [Google Scholar] [CrossRef]
- Leydesdorff, L. Betweenness Centrality as an Indicator of the Interdisciplinarity of Scientific Journals. J. Am. Soc. Inf. Sci. 2007, 58, 1303–1319. [Google Scholar] [CrossRef]
- Klavans, R.; Boyack, K.W. Identifying a Better Measure of Relatedness for Mapping Science. J. Am. Soc. Inf. Sci. 2006, 57, 251–263. [Google Scholar] [CrossRef]
- Klavans, R.; Boyack, K.W. Quantitative Evaluation of Large Maps of Science. Scientometrics 2006, 68, 475–499. [Google Scholar] [CrossRef]
- Small, H. Visualizing Science by Citation Mapping. J. Am. Soc. Inf. Sci. 1999, 50, 799–813. [Google Scholar] [CrossRef]
- Boyack, K.W.; Klavans, R.; Börner, K. Mapping the Backbone of Science. Scientometrics 2005, 64, 351–374. [Google Scholar] [CrossRef]
- Coccia, M. The Fishbone Diagram to Identify, Systematize and Analyze the Sources of General Purpose Technologies. J. Soc. Adm. Sci. 2018, 4, 291–303. [Google Scholar] [CrossRef]
- Coccia, M. Fishbone Diagram for Technological Analysis and Foresight. IJFIP 2020, 14, 225–247. [Google Scholar] [CrossRef]
- Coccia, M. Effects of Human Progress Driven by Technological Change on Physical and Mental Health. Studi Di Sociol. 2021, 113–132. [Google Scholar] [CrossRef]
- Coccia, M. Probability of Discoveries between Research Fields to Explain Scientific and Technological Change. Technol. Soc. 2022, 68, 101874. [Google Scholar] [CrossRef]
- Coccia, M.; Bellitto, M. Human progress and its socioeconomic effects in society. J. Econ. Soc. Thought 2018, 5, 160–178. [Google Scholar] [CrossRef]
- Coccia, M. General Properties of the Evolution of Research Fields: A Scientometric Study of Human Microbiome, Evolutionary Robotics and Astrobiology. Scientometrics 2018, 117, 1265–1283. [Google Scholar] [CrossRef]
- Coccia, M. Artificial intelligence technology in cancer imaging: Clinical challenges for detection of lung and breast cancer. J. Soc. Adm. Sci. 2019, 6, 82–98. [Google Scholar] [CrossRef]
- Coccia, M. Destructive Technologies for Industrial and Corporate Change. In Global Encyclopedia of Public Administration, Public Policy, and Governance; Farazmand, A., Ed.; Springer International Publishing: Cham, Switzerland, 2020; pp. 1–7. [Google Scholar] [CrossRef]
- Coccia, M. Asymmetry of the Technological Cycle of Disruptive Innovations. Technol. Anal. Strateg. Manag. 2020, 32, 1462–1477. [Google Scholar] [CrossRef]
- Coccia, M. The Evolution of Scientific Disciplines in Applied Sciences: Dynamics and Empirical Properties of Experimental Physics. Scientometrics 2020, 124, 451–487. [Google Scholar] [CrossRef]
- Coccia, M. Technological Innovation. In The Blackwell Encyclopedia of Sociology; Ritzer, G., John, C.R., Eds.; Wiley & Sons, Ltd.: Hoboken, NJ, USA, 2007. [Google Scholar] [CrossRef]
- Coccia, M. Evolution of Technology in Replacement of Heart Valves: Transcatheter Aortic Valves, a Revolution for Management of Valvular Heart Diseases. Health Policy Technol. 2021, 10, 100512. [Google Scholar] [CrossRef]
- Coccia, M.; Finardi, U. New Technological Trajectories of Non-Thermal Plasma Technology in Medicine. IJBET 2013, 11, 337. [Google Scholar] [CrossRef]
- Moya-Anegón, F.; Vargas-Quesada, B.; Herrero-Solana, V.; Chinchilla-Rodríguez, Z.; Corera-Álvarez, E.; Munoz-Fernández, F.J. A New Technique for Building Maps of Large Scientific Domains Based on the Cocitation of Classes and Categories. Scientometrics 2004, 61, 129–145. [Google Scholar] [CrossRef]
- Cozzens, S.; Gatchair, S.; Kang, J.; Kim, K.-S.; Lee, H.J.; Ordóñez, G.; Porter, A. Emerging Technologies: Quantitative Identification and Measurement. Technol. Anal. Strateg. Manag. 2010, 22, 361–376. [Google Scholar] [CrossRef]
- Web of Science. Available online: https://www.webofscience.com/wos/woscc/basic-search (accessed on 29 August 2021).
- Uriona-Maldonado, M.; dos Santos, R.N.M.; Varvakis, G. State of the Art on the Systems of Innovation Research: A Bibliometrics Study up to 2009. Scientometrics 2012, 91, 977–996. [Google Scholar] [CrossRef]
- Jacso, P. As We May Search—Comparison of Major Features of the Web of Science, Scopus, and Google Scholar Citation-Based and Citation-Enhanced Databases. Curr. Sci. 2005, 89, 1537–1548. [Google Scholar]
- Harzing, A.-W.; Alakangas, S. Google Scholar, Scopus and the Web of Science: A Longitudinal and Cross-Disciplinary Comparison. Scientometrics 2016, 106, 787–804. [Google Scholar] [CrossRef]
- Martín-Martín, A.; Orduna-Malea, E.; Thelwall, M.; Delgado López-Cózar, E. Google Scholar, Web of Science, and Scopus: A Systematic Comparison of Citations in 252 Subject Categories. J. Informetr. 2018, 12, 1160–1177. [Google Scholar] [CrossRef]
- Rafols, I.; Meyer, M. Diversity and Network Coherence as Indicators of Interdisciplinarity: Case Studies in Bionanoscience. Scientometrics 2010, 82, 263–287. [Google Scholar] [CrossRef]
- Delecroix, B.; Epstein, R. Co-Word Analysis for the Non-Scientific Information Example of Reuters Business Briefings. Data Sci. J. 2004, 3, 80–87. [Google Scholar] [CrossRef]
- Li, T.; Bai, J.; Yang, X.; Liu, Q.; Chen, Y. Co-Occurrence Network of High-Frequency Words in the Bioinformatics Literature: Structural Characteristics and Evolution. Appl. Sci. 2018, 8, 1994. [Google Scholar] [CrossRef]
- Van Rossum, G.; Drake, F.L. Python 3 Reference Manual; CreateSpace: Scotts Valley, CA, USA, 2009. [Google Scholar]
- Pedregosa, F.; Varoquaux, G.; Gramfort, A.; Michel, V.; Thirion, B.; Grisel, O.; Blondel, M.; Prettenhofer, P.; Weiss, R.; Dubourg, V.; et al. Scikit-Learn: Machine Learning in Python. J. Mach. Learn. Res. 2011, 12, 2825–2830. [Google Scholar]
- Bastian, M.; Heymann, S.; Jacomy, M. Gephi: An Open Source Software for Exploring and Manipulating Networks. Proc. Int. AAAI Conf. Web Soc. Media 2009, 3, 361–362. [Google Scholar] [CrossRef]
- Coccia, M. Methods of Inquiry in Social Sciences: An Introduction. SSRN J. 2018. [Google Scholar] [CrossRef]
- Sharma, D.; Surolia, A. Degree Centrality. In Encyclopedia of Systems Biology; Dubitzky, W., Wolkenhauer, O., Cho, K.-H., Yokota, H., Eds.; Springer: New York, NY, USA, 2013; p. 558. ISBN 9781441998620. [Google Scholar]
- Freeman, L.C. A Set of Measures of Centrality Based on Betweenness. Sociometry 1977, 40, 35. [Google Scholar] [CrossRef]
- Wasserman, S.; Faust, K. Social Network Analysis: Methods and Applications; Structural analysis in the social sciences; Cambridge University Press: Cambridge, UK; New York, NY, USA, 1994; ISBN 9780521382694. [Google Scholar]
- Newman, M.E.J. Analysis of Weighted Networks. Phys. Rev. E 2004, 70, 056131. [Google Scholar] [CrossRef]
- Souzanchi Kashani, E.; Roshani, S. Evolution of Innovation System Literature: Intellectual Bases and Emerging Trends. Technol. Forecast. Soc. Chang. 2019, 146, 68–80. [Google Scholar] [CrossRef]
- Bravo-Arrabal, J.; Fernandez-Lozano, J.J.; Serón, J.; Gomez-Ruiz, J.A.; García-Cerezo, A. Development and Implementation of a Hybrid Wireless Sensor Network of Low Power and Long Range for Urban Environments. Sensors 2021, 21, 567. [Google Scholar] [CrossRef]
- Grasso, S.; Santonico, M.; Pennazza, G.; Zompanti, A.; Piccoli, A.; Bisogno, T.; Maccarrone, M. BIONOTE as an Innovative Biosensor for Measuring Endocannabinoid Levels. Sensors 2021, 21, 489. [Google Scholar] [CrossRef]
- Kanoun, O.; Bradai, S.; Khriji, S.; Bouattour, G.; El Houssaini, D.; Ben Ammar, M.; Naifar, S.; Bouhamed, A.; Derbel, F.; Viehweger, C. Energy-Aware System Design for Autonomous Wireless Sensor Nodes: A Comprehensive Review. Sensors 2021, 21, 548. [Google Scholar] [CrossRef]
- Jderu, A.; Soto, M.A.; Enachescu, M.; Ziegler, D. Liquid Flow Meter by Fiber-Optic Sensing of Heat Propagation. Sensors 2021, 21, 355. [Google Scholar] [CrossRef] [PubMed]
- Leonardo, S.; Toldrà, A.; Campàs, M. Biosensors Based on Isothermal DNA Amplification for Bacterial Detection in Food Safety and Environmental Monitoring. Sensors 2021, 21, 602. [Google Scholar] [CrossRef] [PubMed]
- Santana Abril, J.; Santana Sosa, G.; Sosa, J.; Bautista, T.; Montiel-Nelson, J.A. A Novel Charging Method for Underwater Batteryless Sensor Node Networks. Sensors 2021, 21, 557. [Google Scholar] [CrossRef] [PubMed]
- Yang, T.; Wang, H.; Wang, X. Strain Transfer Characteristics of Multi-Layer Optical Fiber Sensors with Temperature-Dependent Properties at Low Temperature. Sensors 2021, 21, 495. [Google Scholar] [CrossRef] [PubMed]
- Choi, J.; Yi, S.; Lee, K.C. Analysis of Keyword Networks in MIS Research and Implications for Predicting Knowledge Evolution. Inf. Manag. 2011, 48, 371–381. [Google Scholar] [CrossRef]
- Coccia, M.; Watts, J. A Theory of the Evolution of Technology: Technological Parasitism and the Implications for Innovation Magement. J. Eng. Technol. Manag. 2020, 55, 101552. [Google Scholar] [CrossRef]
- Coccia, M. A theory of classification and evolution of technologies within a Generalised Darwinism. Technol. Anal. Strat. Manag. 2019, 31, 517–531. [Google Scholar] [CrossRef]
- Coccia, M. The Theory of Technological Parasitism for the Measurement of the Evolution of Technology and Technological Forecasting. Technol. Forecast. Soc. Chang. 2019, 141, 289–304. [Google Scholar] [CrossRef]
- Coccia, M. A New Classification of Technologies 2017, Working Paper CocciaLab n. 26/2, Arizona State University (USA). Available online: http://arxiv.org/abs/1712.07711 (accessed on 22 October 2022).
- Coccia, M. Classification of innovation considering technological interaction. J. Econ. Bibliogr. 2018, 5, 76–93. [Google Scholar] [CrossRef]
- Coccia, M.; Wang, L. Evolution and Convergence of the Patterns of International Scientific Collaboration. Proc. Natl. Acad. Sci. USA 2016, 113, 2057–2061. [Google Scholar] [CrossRef]
- Farias da Costa, V.C.; Oliveira, L.; de Souza, J. Internet of Everything (IoE) Taxonomies: A Survey and a Novel Knowledge-Based Taxonomy. Sensors 2021, 21, 568. [Google Scholar] [CrossRef] [PubMed]
- Mosleh, M.; Roshani, S.; Coccia, M. Scientific Laws of Research Funding to Support Citations and Diffusion of Knowledge in Life Science. Scientometrics 2022, 127, 1931–1951. [Google Scholar] [CrossRef] [PubMed]
- Coccia, M.; Rolfo, S. Ricerca pubblica e trasferimento tecnologico: Il caso della regione Piemonte. In In-Novazione e Piccole Imprese in Piemonte; Rolfo, S., Ed.; Franco Angeli Editore: Milano, Italy, 2000; ISBN 9788846418784. [Google Scholar]
- Lee, C.; Kim, H. The Evolutionary Trajectory of an ICT Ecosystem: A Network Analysis Based on Media Users’ Data. Inf. Manag. 2018, 55, 795–805. [Google Scholar] [CrossRef]
- Sun, X.; Kaur, J.; Milojević, S.; Flammini, A.; Menczer, F. Social Dynamics of Science. Sci. Rep. 2013, 3, 1069. [Google Scholar] [CrossRef]
- Coccia, M. Sources of Technological Innovation: Radical and Incremental Innovation Problem-Driven to Support Competitive Advantage of Firms. Technol. Anal. Strateg. Manag. 2017, 29, 1048–1061. [Google Scholar] [CrossRef]
- Berelson, B. Content Analysis in Communication Research; Free Press: New York, NY, USA, 1952; p. 220. [Google Scholar]
- Holsti, O.R. Content Analysis for the Social Sciences and Humanities; Longman Higher Education: Harlow, UK, 1969; ISBN 0201029405. [Google Scholar]
- Kleinheksel, A.J.; Rockich-Winston, N.; Tawfik, H.; Wyatt, T.R. Demystifying Content Analysis. AJPE 2020, 84, 7113. [Google Scholar] [CrossRef]
- Page, M.J.; McKenzie, J.E.; Bossuyt, P.M.; Boutron, I.; Hoffmann, T.C.; Mulrow, C.D.; Shamseer, L.; Tetzlaff, J.M.; Akl, E.A.; Brennan, S.E.; et al. The PRISMA 2020 Statement: An Updated Guideline for Reporting Systematic Reviews. Syst. Rev. 2021, 10, 89. [Google Scholar] [CrossRef]
- Coccia, M. An introduction to the theories of national and regional economic development. Turk. Econ. Rev. 2018, 5, 350–358. [Google Scholar] [CrossRef]
- Coccia, M. New directions in measurement of economic growth, development and under development. J. Econ. Pol. Econ. 2017, 4, 382–395. [Google Scholar] [CrossRef]
- Coccia, M. Comparative Institutional Changes. In Global Encyclopedia of Public Administration, Public Policy, and Governance; Farazmand, A., Ed.; Springer International Publishing: Cham, Switzerland, 2019. [Google Scholar] [CrossRef]
- Coccia, M. Comparative World-Systems Theories. In Global Encyclopedia of Public Administration, Public Policy, and Governance; Farazmand, A., Ed.; Springer International Publishing: Cham, Switzerland, 2019. [Google Scholar] [CrossRef]


| 1990–2000 | 2001–2010 | 2011–2020 | ||||||
|---|---|---|---|---|---|---|---|---|
| Word | Degree Centrality | Community | Word | Degree Centrality | Community | Word | Degree Centrality | Community |
| biosensor | 23 | 3 | biosensor | 53 | 2 | optical sensor | 128 | 6 |
| gas sensor | 21 | 4 | chemical sensor | 48 | 4 | biosensor | 126 | 2 |
| optical sensor | 20 | 2 | gas sensor | 46 | 4 | wireless sensor network | 121 | 3 |
| fiber optic sensor | 20 | 2 | optical sensor | 46 | 6 | fiber optic sensor | 120 | 5 |
| pressure sensor | 18 | 1 | fiber optic sensor | 40 | 5 | temperature sensor | 111 | 1 |
| chemical sensor | 16 | 1 | wireless sensor network | 31 | 1 | gas sensor | 109 | 4 |
| micro sensor | 12 | 1 | capacitive sensor | 31 | 3 | chemical sensor | 83 | 2 |
| oxygen sensor | 12 | 3 | temperature sensor | 29 | 5 | capacitive sensor | 77 | 1 |
| humidity sensor | 11 | 4 | micro sensor | 28 | 3 | pressure sensor | 72 | 1 |
| ph. sensor | 11 | 3 | electrochemical sensor | 27 | 2 | strain sensor | 72 | 1 |
| smart sensor | 11 | 1 | pressure sensor | 25 | 3 | humidity sensor | 72 | 4 |
| thermal sensor | 11 | 1 | ph. sensor | 24 | 7 | electrochemical sensor | 71 | 2 |
| flow sensor | 10 | 1 | oxygen sensor | 22 | 6 | wearable sensor | 70 | 1 |
| temperature sensor | 10 | 2 | wireless sensor | 20 | 1 | wireless sensor | 59 | 1 |
| integrated sensor | 9 | 1 | magnetic sensor | 19 | 5 | ph. sensor | 59 | 2 |
| immunosensor | 9 | 3 | remote sensor | 19 | 1 | flexible sensor | 55 | 1 |
| capacitive sensor | 8 | 3 | strain sensor | 18 | 5 | magnetic sensor | 53 | 1 |
| potentiometric sensor | 8 | 4 | glucose sensor | 17 | 6 | fluorescent sensor | 52 | 6 |
| amperometric sensor | 8 | 4 | humidity sensor | 17 | 4 | remote sensor | 52 | 7 |
| displacement sensor | 7 | 2 | amperometric sensor | 17 | 3 | nano sensor | 49 | 4 |
| 1990–2000 | 2001–2010 | 2011–2020 | ||||||||||||
|---|---|---|---|---|---|---|---|---|---|---|---|---|---|---|
| Label | DC | BC | CC | Community | Label | DC | BC | CC | Community | Label | DC | BC | CC | Community |
| biosensor | 23 | 0.149 | 0.563 | 2 | biosensor | 53 | 0.135 | 0.562 | 1 | optical sensor | 128 | 0.122 | 0.556 | 5 |
| gas sensor | 21 | 0.128 | 0.558 | 3 | chemical sensor | 48 | 0.080 | 0.555 | 3 | biosensor | 126 | 0.137 | 0.553 | 1 |
| optical sensor | 20 | 0.131 | 0.563 | 1 | gas sensor | 46 | 0.090 | 0.538 | 3 | fiber optic sensor | 120 | 0.126 | 0.544 | 4 |
| fiber optic sensor | 20 | 0.113 | 0.553 | 1 | optical sensor | 46 | 0.067 | 0.553 | 5 | wireless sensor networks | 118 | 0.146 | 0.532 | 2 |
| pressure sensor | 18 | 0.072 | 0.525 | 0 | fiber optic sensor | 40 | 0.072 | 0.525 | 4 | temperature sensor | 111 | 0.079 | 0.543 | 0 |
| chemical sensor | 15 | 0.042 | 0.534 | 0 | wireless sensor network | 31 | 0.056 | 0.488 | 0 | gas sensor | 109 | 0.095 | 0.535 | 3 |
| microsensor | 12 | 0.063 | 0.488 | 0 | capacitive sensor | 31 | 0.045 | 0.487 | 2 | chemical sensor | 83 | 0.044 | 0.515 | 1 |
| oxygen sensor | 12 | 0.032 | 0.496 | 2 | temperature sensor | 29 | 0.017 | 0.491 | 4 | capacitive sensor | 75 | 0.035 | 0.507 | 0 |
| humidity sensor | 11 | 0.018 | 0.473 | 3 | micro sensor | 28 | 0.026 | 0.517 | 2 | strain sensor | 70 | 0.032 | 0.506 | 0 |
| ph. sensor | 11 | 0.036 | 0.484 | 2 | electrochemical sensor | 27 | 0.028 | 0.482 | 1 | pressure sensor | 72 | 0.030 | 0.488 | 0 |
| smart sensor | 11 | 0.052 | 0.462 | 0 | pressure sensor | 25 | 0.013 | 0.472 | 2 | humidity sensor | 70 | 0.029 | 0.496 | 3 |
| thermal sensor | 11 | 0.014 | 0.469 | 0 | ph. sensor | 24 | 0.021 | 0.486 | 6 | wearable sensor | 70 | 0.034 | 0.511 | 0 |
| flow sensor | 10 | 0.032 | 0.480 | 0 | oxygen sensor | 22 | 0.030 | 0.478 | 5 | electrochemical sensor | 69 | 0.049 | 0.501 | 1 |
| integrated sensors | 9 | 0.020 | 0.473 | 0 | wireless sensor | 20 | 0.013 | 0.461 | 0 | wireless sensor | 59 | 0.025 | 0.484 | 0 |
| temperature sensor | 9 | 0.016 | 0.449 | 1 | magnetic sensor | 19 | 0.021 | 0.446 | 4 | ph. sensor | 59 | 0.024 | 0.498 | 1 |
| amperometric sensor | 8 | 0.008 | 0.459 | 3 | remote sensor | 19 | 0.020 | 0.475 | 0 | flexible sensor | 55 | 0.020 | 0.471 | 0 |
| capacitive sensor | 8 | 0.013 | 0.439 | 2 | strain sensor | 18 | 0.014 | 0.469 | 4 | remote sensor | 52 | 0.038 | 0.487 | 6 |
| immunosensor | 8 | 0.010 | 0.442 | 2 | glucose sensor | 17 | 0.006 | 0.440 | 5 | magnetic sensor | 51 | 0.018 | 0.479 | 0 |
| potentiometric sensor | 8 | 0.012 | 0.427 | 3 | humidity sensor | 17 | 0.010 | 0.456 | 3 | fluorescence sensor | 50 | 0.032 | 0.458 | 5 |
| position sensor | 7 | 0.005 | 0.416 | 0 | amperometric sensor | 17 | 0.010 | 0.434 | 3 | nanosensor | 49 | 0.019 | 0.474 | 3 |
| Top 20 Terms Emerging in Sensor Research | ||||
|---|---|---|---|---|
| 2001–2010 | 2011–2020 | |||
| Rank | Label/Item | Degree Centrality | Label/Item | Degree Centrality |
| 1 | wireless sensor network | 31 | self-powered sensor | 30 |
| 2 | wireless sensor | 20 | environmental sensor | 28 |
| 3 | nano sensor | 15 | biomedical sensor | 22 |
| 4 | conductometric sensor | 11 | inductive sensor | 21 |
| 5 | distributed sensor | 9 | paper sensor | 26 |
| 6 | CMOS sensor | 9 | low-cost sensor | 21 |
| 7 | CMOS image sensor | 9 | liquid sensor | 19 |
| 8 | electrochemical biosensor | 8 | printed sensor | 19 |
| 9 | mass sensor | 8 | textile sensor | 19 |
| 10 | fiber Bragg grating sensor | 8 | body sensor network | 20 |
| 11 | refractive index sensor | 8 | light sensor | 18 |
| 12 | fluorescence sensor | 8 | mechanical sensor | 19 |
| 13 | active sensor | 8 | aptasensor | 16 |
| 14 | light-addressable potentiometric sensor | 6 | dual sensor | 16 |
| 15 | active pixel sensor | 6 | ratiometric sensor | 14 |
| 16 | colorimetric sensor | 6 | biomimetic sensor | 15 |
| 17 | flexible sensor | 6 | chemiresistive sensor | 17 |
| 18 | wearable sensor | 6 | multifunctional sensor | 17 |
| 19 | DNA sensor | 6 | visual sensor | 13 |
| 20 | biomimetic sensor | 6 | copper sensor | 13 |
| Top Emerging Sensor Technologies | ||||
|---|---|---|---|---|
| 2001–2010 | 2011–2020 | |||
| Rank | Label/Item | Degree Centrality | Label/Item | Degree Centrality |
| 1 | wireless sensor network | 31 | self-powered sensor | 30 |
| 2 | conductometric sensor | 11 | biomedical sensor | 22 |
| 3 | distributed sensor | 9 | inductive sensor | 21 |
| 4 | CMOS image sensor | 9 | paper sensor | 26 |
| 5 | electrochemical biosensor | 8 | printed sensor | 19 |
| 6 | fiber Bragg grating sensor | 8 | textile sensor | 19 |
| 7 | refractive index sensor | 8 | body sensor network | 20 |
| 8 | fluorescence sensor | 8 | aptasensor | 16 |
| 10 | light-addressable potentiometric sensor | 6 | dual sensor | 16 |
| 11 | active pixel sensor | 6 | ratiometric sensor | 14 |
| 12 | colorimetric sensor | 6 | biomimetic sensor | 15 |
| 13 | DNA sensor | 6 | chemiresistive sensor | 17 |
| 14 | biomimetic sensor | 6 | ||
Publisher’s Note: MDPI stays neutral with regard to jurisdictional claims in published maps and institutional affiliations. |
© 2022 by the authors. Licensee MDPI, Basel, Switzerland. This article is an open access article distributed under the terms and conditions of the Creative Commons Attribution (CC BY) license (https://creativecommons.org/licenses/by/4.0/).
Share and Cite
Coccia, M.; Roshani, S.; Mosleh, M. Evolution of Sensor Research for Clarifying the Dynamics and Properties of Future Directions. Sensors 2022, 22, 9419. https://doi.org/10.3390/s22239419
Coccia M, Roshani S, Mosleh M. Evolution of Sensor Research for Clarifying the Dynamics and Properties of Future Directions. Sensors. 2022; 22(23):9419. https://doi.org/10.3390/s22239419
Chicago/Turabian StyleCoccia, Mario, Saeed Roshani, and Melika Mosleh. 2022. "Evolution of Sensor Research for Clarifying the Dynamics and Properties of Future Directions" Sensors 22, no. 23: 9419. https://doi.org/10.3390/s22239419
APA StyleCoccia, M., Roshani, S., & Mosleh, M. (2022). Evolution of Sensor Research for Clarifying the Dynamics and Properties of Future Directions. Sensors, 22(23), 9419. https://doi.org/10.3390/s22239419