

A Gait-Based Real-Time Gender Classification System Using Whole Body Joints


Abstract
1. Introduction
1.1. Research Gap and Motivation
- The existing gait recognition approaches have compared limited joints of male and female during gait and less focus has been paid for complete study/analysis of joints.
1.2. Main Contributions
- Using information obtained from MS Kinect, the authors created their own data set for gender classification.
- Applying a straightforward binary logistic regression model to the challenging issue of gender classification with better accuracy.
- The suggested system provides better accuracy as compared to the state-of-the-art system using the same data set.
2. Related Work
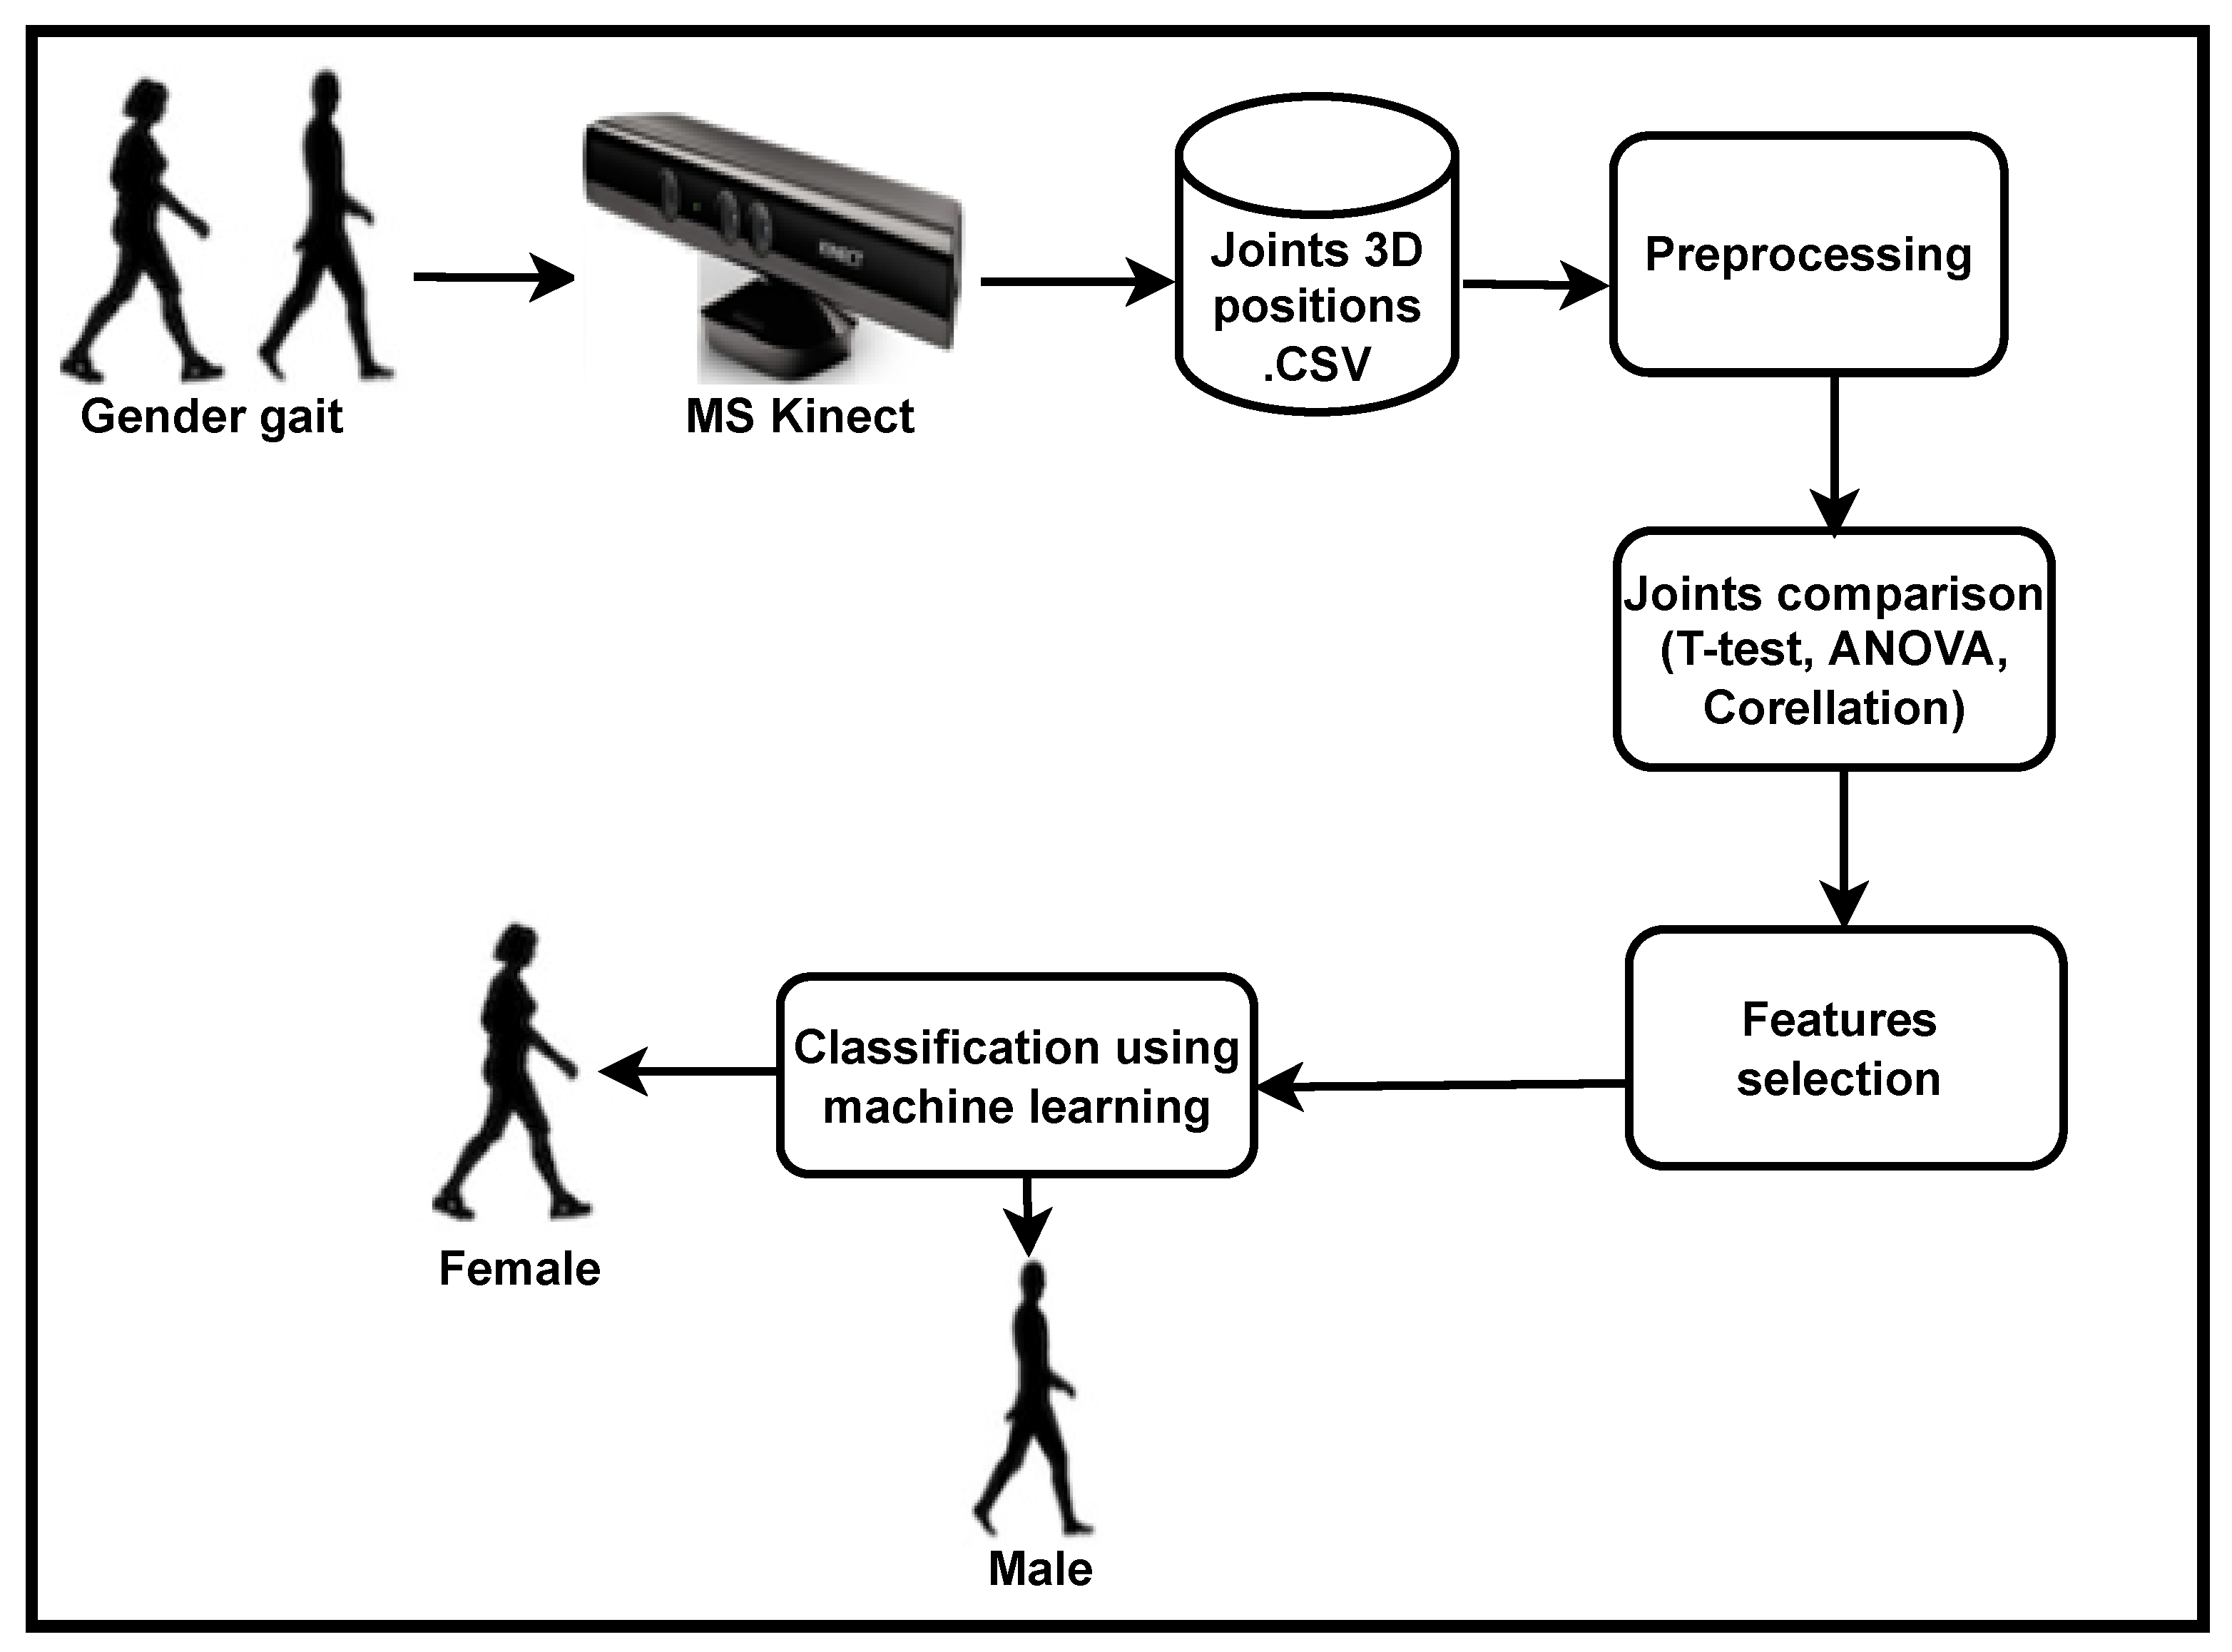
3. Proposed System
3.1. Dataset Generation
3.2. Pre-Processing of Data
3.2.1. Variance Covariance Matrix
3.2.2. Correlation Matrix
3.2.3. Variance of and Pooled Variance of Joints
3.2.4. Coefficient of Variation of Joints
3.2.5. Average Variation in Particular Joints of Human during Gait
3.3. Comparison of Male and Female Joints
3.3.1. Comparison of Male and Female Joints by Correlation
3.3.2. Comparison of Male and Female Joints Using t-test
3.3.3. Comparison of Gender Joints Based on ANOVA Technique
3.4. Feature Selection
3.5. Classification Using Machine Learning
4. Experimental Result
4.1. Classification Accuracy
4.1.1. Comparison of the Proposed System with Different Conventional Algorithms
4.1.2. Discussion
5. Conclusions and Future Work
Author Contributions
Funding
Institutional Review Board Statement
Informed Consent Statement
Data Availability Statement
Conflicts of Interest
References
- Bouchrika, I.; Goffredo, M.; Carter, J.; Nixon, M. On using gait in forensic biometrics. J. Forensic Sci. 2011, 56, 882–889. [Google Scholar] [CrossRef]
- Iwama, H.; Muramatsu, D.; Makihara, Y.; Yagi, Y. Gait verification system for criminal investigation. Inf. Media Technol. 2013, 8, 1187–1199. [Google Scholar] [CrossRef]
- Upadhyay, J.; Gonsalves, T. Robust and Lightweight System for Gait-Based Gender Classification toward Viewing Angle Variations. AI 2022, 3, 538–553. [Google Scholar] [CrossRef]
- Upadhyay, J.L.; Gonsalves, T.; Katkar, V. A Lightweight System Towards Viewing Angle and Clothing Variation in Gait Recognition. Int. J. Big Data Intell. Appl. (IJBDIA) 2021, 2, 1–18. [Google Scholar] [CrossRef]
- Saleem, F.; Khan, M.A.; Alhaisoni, M.; Tariq, U.; Armghan, A.; Alenezi, F.; Choi, J.I.; Kadry, S. Human gait recognition: A single stream optimal deep learning features fusion. Sensors 2021, 21, 7584. [Google Scholar] [CrossRef]
- Han, J.; Bhanu, B. Individual recognition using gait energy image. IEEE Trans. Pattern Anal. Mach. Intell. 2005, 28, 316–322. [Google Scholar] [CrossRef] [PubMed]
- Chtourou, I.; Fendri, E.; Hammami, M. Person re-identification based on gait via Part View Transformation Model under variable covariate conditions. J. Vis. Commun. Image Represent. 2021, 77, 103093. [Google Scholar] [CrossRef]
- Wu, Z.; Huang, Y.; Wang, L.; Wang, X.; Tan, T. A comprehensive study on cross-view gait based human identification with deep cnns. IEEE Trans. Pattern Anal. Mach. Intell. 2016, 39, 209–226. [Google Scholar] [CrossRef]
- Makihara, Y.; Suzuki, A.; Muramatsu, D.; Li, X.; Yagi, Y. Joint intensity and spatial metric learning for robust gait recognition. In Proceedings of the IEEE Conference on Computer Vision and Pattern Recognition, Honolulu, HI, USA, 21–26 July 2017; pp. 5705–5715. [Google Scholar]
- Li, X.; Makihara, Y.; Xu, C.; Yagi, Y.; Ren, M. Joint intensity transformer network for gait recognition robust against clothing and carrying status. IEEE Trans. Inf. Forensics Secur. 2019, 14, 3102–3115. [Google Scholar] [CrossRef]
- Takemura, N.; Makihara, Y.; Muramatsu, D.; Echigo, T.; Yagi, Y. On input/output architectures for convolutional neural network-based cross-view gait recognition. IEEE Trans. Circuits Syst. Video Technol. 2017, 29, 2708–2719. [Google Scholar] [CrossRef]
- Chao, H.; He, Y.; Zhang, J.; Feng, J. Gaitset: Regarding gait as a set for cross-view gait recognition. In Proceedings of the AAAI Conference on Artificial Intelligence, Honolulu, HI, USA, 27 January–1 February 2019; Volume 33, pp. 8126–8133. [Google Scholar]
- Xu, C.; Makihara, Y.; Li, X.; Yagi, Y.; Lu, J. Cross-view gait recognition using pairwise spatial transformer networks. IEEE Trans. Circuits Syst. Video Technol. 2020, 31, 260–274. [Google Scholar] [CrossRef]
- Li, X.; Makihara, Y.; Xu, C.; Yagi, Y.; Ren, M. Gait recognition via semi-supervised disentangled representation learning to identity and covariate features. In Proceedings of the IEEE/CVF Conference on Computer Vision and Pattern Recognition, Seattle, WA, USA, 13–19 June 2020; pp. 13309–13319. [Google Scholar]
- Xu, C.; Makihara, Y.; Ogi, G.; Li, X.; Yagi, Y.; Lu, J. The OU-ISIR gait database comprising the large population dataset with age and performance evaluation of age estimation. IPSJ Trans. Comput. Vis. Appl. 2017, 9, 1–14. [Google Scholar] [CrossRef]
- Preis, J.; Kessel, M.; Werner, M.; Linnhoff-Popien, C. Gait recognition with kinect. In Proceedings of the 1st International Workshop on Kinect in Pervasive Computing, New Castle, UK, 18–22 June 2012; pp. 1–4. [Google Scholar]
- Alharbi, A.; Alharbi, F.; Kamioka, E. Skeleton based gait recognition for long and baggy clothes. MATEC Web Conf. 2019, 277, 03005. [Google Scholar] [CrossRef][Green Version]
- Bei, S.; Deng, J.; Zhen, Z.; Shaojing, S. Gender recognition via fused silhouette features based on visual sensors. IEEE Sens. J. 2019, 19, 9496–9503. [Google Scholar] [CrossRef]
- Xu, C.; Makihara, Y.; Liao, R.; Niitsuma, H.; Li, X.; Yagi, Y.; Lu, J. Real-time gait-based age estimation and gender classification from a single image. In Proceedings of the IEEE/CVF Winter Conference on Applications of Computer Vision, Waikoloa, HI, USA, 3–8 January 202; pp. 3460–3470.
- Zhang, S.; Wang, Y.; Li, A. Gait-based age estimation with deep convolutional neural network. In Proceedings of the 2019 International Conference on Biometrics (ICB), Crete, Greece, 4–7 June 2019; pp. 1–8. [Google Scholar]
- Zhang, Y.; Huang, Y.; Wang, L.; Yu, S. A comprehensive study on gait biometrics using a joint CNN-based method. Pattern Recognit. 2019, 93, 228–236. [Google Scholar] [CrossRef]
- Tang, C.; Lu, J.; Liu, J. Non-contact heart rate monitoring by combining convolutional neural network skin detection and remote photoplethysmography via a low-cost camera. In Proceedings of the IEEE Conference on Computer Vision and Pattern Recognition Workshops, Salt Lake City, UT, USA, 18–22 June 2018; pp. 1309–1315. [Google Scholar]
- Kwon, B.; Lee, S. Joint swing energy for skeleton-based gender classification. IEEE Access 2021, 9, 28334–28348. [Google Scholar] [CrossRef]
- Guffanti, D.; Brunete, A.; Hernando, M. Non-invasive multi-camera gait analysis system and its application to gender classification. IEEE Access 2020, 8, 95734–95746. [Google Scholar] [CrossRef]
- Lee, M.; Lee, J.H.; Kim, D.H. Gender recognition using optimal gait feature based on recursive feature elimination in normal walking. Expert Syst. Appl. 2022, 189, 116040. [Google Scholar] [CrossRef]
- More, S.A.; Deore, P.J. Gait-based human recognition using partial wavelet coherence and phase features. J. King Saud-Univ.-Comput. Inf. Sci. 2020, 32, 375–383. [Google Scholar] [CrossRef]
- Barra, P.; Bisogni, C.; Nappi, M.; Freire-Obregón, D.; Castrillón-Santana, M. Gait analysis for gender classification in forensics. In Proceedings of the International Conference on Dependability in Sensor, Cloud, and Big Data Systems and Applications, Guangzhou, China, 12–15 November 2019; Springer: Singapore, 2019; pp. 180–190. [Google Scholar]
- Dung Do, T.; Kim, H.; Huan Nguyen, V. Real-time and robust multiple-view gender classification using gait features in video surveillance. arXiv 2019, arXiv:1905.01013. [Google Scholar]
- Russel, N.S.; Selvaraj, A. Gender discrimination, age group classification and carried object recognition from gait energy image using fusion of parallel convolutional neural network. IET Image Process. 2021, 15, 239–251. [Google Scholar] [CrossRef]
- Sudha, L.R.; Bhavani, R. Gait based gender identification using statistical pattern classifiers. Int. J. Comput. Appl. 2012, 40, 30–35. [Google Scholar] [CrossRef]
- Hu, M.; Wang, Y. A new approach for gender classification based on gait analysis. In Proceedings of the 2009 Fifth International Conference on Image and Graphics, Xi’an, China, 20–23 September 2009; pp. 869–874. [Google Scholar]
- Hassan, O.M.S.; Abdulazeez, A.M.; TİRYAKİ, V.M. Gait-based human gender classification using lifting 5/3 wavelet and principal component analysis. In Proceedings of the 2018 International Conference on Advanced Science and Engineering (ICOASE), Duhok, Iraq, 9–11 October 2018; pp. 173–178. [Google Scholar]
- Zhao, G.; Liu, G.; Li, H.; Pietikainen, M. 3D gait recognition using multiple cameras. In Proceedings of the 7th International Conference on Automatic Face and Gesture Recognition (FGR06), Southampton, UK, 10–12 April 2006; pp. 529–534. [Google Scholar]
- Yamauchi, K.; Bhanu, B.; Saito, H. Recognition of walking humans in 3D: Initial results. In Proceedings of the 2009 IEEE Computer Society Conference on Computer Vision and Pattern Recognition Workshops, Miami Beach, FL, USA, 20–25 June 2009; pp. 45–52. [Google Scholar]
- Krzeszowski, T.; Michalczuk, A.; Kwolek, B.; Switonski, A.; Josinski, H. Gait recognition based on marker-less 3D motion capture. In Proceedings of the 2013 10th IEEE International Conference on Advanced Video and Signal Based Surveillance, Krakow, Poland, 27–30 August 2013; pp. 232–237. [Google Scholar]
- Kusakunniran, W.; Wu, Q.; Zhang, J.; Li, H. Gait recognition under various viewing angles based on correlated motion regression. IEEE Trans. Circuits Syst. Video Technol. 2012, 22, 966–980. [Google Scholar] [CrossRef]
- Tsuji, A.; Makihara, Y.; Yagi, Y. Silhouette transformation based on walking speed for gait identification. In Proceedings of the 2010 IEEE Computer Society Conference on Computer Vision and Pattern Recognition, San Francisco, CA, USA, 13–18 June 2010; pp. 717–722. [Google Scholar]
- Hossain, M.A.; Makihara, Y.; Wang, J.; Yagi, Y. Clothing-invariant gait identification using part-based clothing categorization and adaptive weight control. Pattern Recognit. 2010, 43, 2281–2291. [Google Scholar] [CrossRef]
- Goffredo, M.; Bouchrika, I.; Carter, J.N.; Nixon, M.S. Self-calibrating view-invariant gait biometrics. IEEE Trans. Syst. Man, Cybern. Part B (Cybern.) 2009, 40, 997–1008. [Google Scholar] [CrossRef]
- Kale, A.; Sundaresan, A.; Rajagopalan, A.; Cuntoor, N.P.; Roy-Chowdhury, A.K.; Kruger, V.; Chellappa, R. Identification of humans using gait. IEEE Trans. Image Process. 2004, 13, 1163–1173. [Google Scholar] [CrossRef]
- Jean, F.; Bergevin, R.; Albu, A.B. Computing view-normalized body parts trajectories. In Proceedings of the Fourth Canadian Conference on Computer and Robot Vision (CRV’07), Montreal, QC, Canada, 28–30 May 2007; pp. 89–96. [Google Scholar]
- Iwama, H.; Okumura, M.; Makihara, Y.; Yagi, Y. The ou-isir gait database comprising the large population dataset and performance evaluation of gait recognition. IEEE Trans. Inf. Forensics Secur. 2012, 7, 1511–1521. [Google Scholar] [CrossRef]
- Sivapalan, S.; Chen, D.; Denman, S.; Sridharan, S.; Fookes, C. Gait energy volumes and frontal gait recognition using depth images. In Proceedings of the 2011 International Joint Conference on Biometrics (IJCB), Washington, DC, USA, 11–13 October 2011; pp. 1–6. [Google Scholar]
- Araujo, R.M.; Graña, G.; Andersson, V. Towards skeleton biometric identification using the microsoft kinect sensor. In Proceedings of the 28th Annual ACM Symposium on Applied Computing, Coimbra, Portugal, 18–22 March 2013; pp. 21–26. [Google Scholar]
- Milovanovic, M.; Minovic, M.; Starcevic, D. Walking in colors: Human gait recognition using kinect and cbir. IEEE MultiMedia 2013, 20, 28–36. [Google Scholar] [CrossRef]
- Yang, K.; Dou, Y.; Lv, S.; Zhang, F.; Lv, Q. Relative distance features for gait recognition with Kinect. J. Vis. Commun. Image Represent. 2016, 39, 209–217. [Google Scholar] [CrossRef]
- Ahmed, F.; Polash Paul, P.; Gavrilova, M.L. Kinect-based gait recognition using sequences of the most relevant joint relative angles. J. WSCG 2015, 23, 147–156. [Google Scholar]
- Kastaniotis, D.; Theodorakopoulos, I.; Theoharatos, C.; Economou, G.; Fotopoulos, S. A framework for gait-based recognition using Kinect. Pattern Recognit. Lett. 2015, 68, 327–335. [Google Scholar] [CrossRef]
- Ball, A.; Rye, D.; Ramos, F.; Velonaki, M. Unsupervised clustering of people from’skeleton’data. In Proceedings of the Seventh Annual ACM/IEEE International Conference on Human-Robot Interaction, Boston, MA, USA, 5–8 March 2012; pp. 225–226. [Google Scholar]
- Ahmed, M.; Al-Jawad, N.; Sabir, A.T. Gait recognition based on Kinect sensor. In Proceedings of the Real-Time Image and Video Processing 2014. International Society for Optics and Photonics, Brussels, Belgium, 13–17 April 2014; Volume 9139, p. 91390B. [Google Scholar]
- Eltaher, M.; Yang, Y.; Lee, J. Gait-Based Gender Classification Using Kinect Sensor. In Proceedings of the 2015 ASEE Annual Conference & Exposition, Seattle, WA, USA, 14–17 June 2015; pp. 26–808. [Google Scholar]
- Azhar, M.; Ullah, S.; Raees, M.; Rahman, K.U.; Rehman, I.U. A real-time multi view gait-based automatic gender classification system using kinect sensor. Multimed. Tools Appl. 2022, 1–24. [Google Scholar] [CrossRef]
- Sinha, A.; Chakravarty, K.; Bhowmick, B. Person identification using skeleton information from kinect. In Proceedings of the International Conference on Advances in Computer-Human Interactions, Nice, France, 24 February–1 March 2013; pp. 101–108. [Google Scholar]
- Ahmed, M.H.; Sabir, A.T. Human gender classification based on gait features using kinect sensor. In Proceedings of the 2017 3rd IEEE International Conference on Cybernetics (Cybconf), Exeter, UK, 21–23 June 2017; pp. 1–5. [Google Scholar]
- Kastaniotis, D.; Theodorakopoulos, I.; Economou, G.; Fotopoulos, S. Gait-based gender recognition using pose information for real time applications. In Proceedings of the 2013 18th International Conference on Digital Signal Processing (DSP), Fira, Greece, 1–3 July 2013; pp. 1–6. [Google Scholar]


| Male | Female | |||||
|---|---|---|---|---|---|---|
| Joints | Mean | S.D | C.V | Mean | S.D | C.V |
| Hip Center | 0.9918 | 0.1154 | 11.63 | 1.1906 | 0.1489 | 12.50 |
| SPINE | 1.0233 | 0.1154 | 11.63 | 1.1906 | 0.1489 | 12.50 |
| Shoulder Center | 1.1693 | 0.1232 | 10.53 | 1.2237 | 0.1439 | 11.76 |
| HEAD | 1.2023 | 0.1240 | 10.31 | 1.3833 | 0.1252 | 9.05 |
| Shoulder Left | 1.1382 | 0.1272 | 11.18 | 1.2883 | 0.1515 | 11.76 |
| Elbow Left | 1.0504 | 0.1266 | 12.06 | 1.2220 | 0.1785 | 14.61 |
| Wrest Left | 0.9630 | 0.1264 | 13.12 | 1.1724 | 0.1841 | 15.70 |
| Hand Left | 0.9343 | 0.1278 | 13.67 | 1.1553 | 0.1894 | 16.39 |
| Shoulder Right | 1.1114 | 0.1204 | 10.83 | 1.2981 | 0.1301 | 10.02 |
| Elbow Right | 1.0043 | 0.1190 | 11.85 | 1.2084 | 0.1448 | 11.98 |
| Wrest Right | 0.9049 | 0.1180 | 13.04 | 1.1245 | 0.1558 | 13.85 |
| Hand Right | 0.8770 | 0.1176 | 13.41 | 1.1011 | 0.1576 | 14.32 |
| HIP Left | 0.9738 | 0.1172 | 12.03 | 1.1673 | 0.1529 | 13.10 |
| Knee Left | 0.8130 | 0.1415 | 17.40 | 1.0458 | 0.1602 | 15.31 |
| Ankle Left | 0.7400 | 0.1224 | 16.53 | 0.9787 | 0.1615 | 16.50 |
| Foot Left | 0.7054 | 0.1240 | 17.58 | 0.9499 | 0.1616 | 17.01 |
| HIP Right | 0.9724 | 0.1155 | 11.88 | 1.1754 | 0.1481 | 12.60 |
| Knee Right | 0.8486 | 0.1160 | 13.67 | 1.0804 | 0.1576 | 14.59 |
| Ankle Right | 0.7607 | 0.1172 | 15.40 | 1.0120 | 0.1733 | 17.13 |
| Foot Right | 0.7217 | 0.1180 | 16.34 | 0.9827 | 0.1751 | 17.82 |
| Male | Female | |||||
|---|---|---|---|---|---|---|
| Joints | XandY | YandZ | XandZ | XandY | YandZ | XandZ |
| HIP-C | 0.84 (0.00) | 0.88 (0.00) | 0.90 (0.00) | 0.14 (0.00) | 0.20 (0.00) | 0.80 (0.00) |
| HIP-L | 0.81 (0.00) | 0.88 (0.00) | 0.94 (0.00) | 0.01 (0.79) | 0.01 (0.68) | 0.84 (0.00) |
| HIP-R | 0.82 (0.00) | 0.76 (0.00) | 0.93 (0.00) | 0.24 (0.00) | 0.19 (0.00) | 0.60 (0.00) |
| Spine | 0.86 (0.00) | 0.84 (0.00) | 0.90 (0.00) | 0.22 (0.00) | 0.16 (0.00) | 0.85 (0.00) |
| Shoulder-C | 0.65 (0.00) | 0.52 (0.00) | 0.92 (0.00) | 0.29 (0.00) | 0.16 (0.00) | 0.88 (0.00) |
| Shoulder-L | 0.60 (0.00) | 0.49 (0.00) | 0.95 (0.00) | 0.04 (0.27) | −0.04 (0.24) | 0.86 (0.00) |
| Shoulder-R | 0.57 (0.00) | 0.16 (0.00) | 0.92 (0.00) | 0.02 (0.61) | 0.31 (0.00) | 0.70 (0.00) |
| Head | 0.70 (0.00) | 0.66 (0.00) | 0.90 (0.00) | 0.32 (0.00) | 0.27 (0.00) | 0.90 (0.00) |
| Elbow-L | 0.40 (0.00) | 0.31 (0.00) | 0.95 (0.00) | 0.18 (0.00) | 0.04 (0.26) | 0.87 (0.00) |
| Elbow-R | 0.39 (0.00) | 0.54 (0.00) | 0.93 (0.00) | −0.47 (0.00) | −0.25 (0.00) | 0.82 (0.00) |
| Wrest-L | 0.16 (0.00) | 0.25 (0.00) | 0.94 (0.00) | 0.16 (0.00) | 0.52 (0.00) | 0.79 (0.00) |
| Wrest-R | 0.56 (0.00) | 0.45 (0.00) | 0.96 (0.00) | −0.75 (0.00) | −0.22 (0.00) | 0.77 (0.00) |
| Hand-L | 0.08 (0.03) | 0.15 (0.00) | 0.93 (0.00) | 0.08 (0.03) | 0.49 (0.00) | 0.72 (0.00) |
| Hand-R | 0.49 (0.00) | 0.32 (0.00) | 0.91 (0.00) | −0.72 (0.00) | −0.29 (0.00) | 0.80 (0.00) |
| Knee-L | 0.35 (0.00) | 0.49 (0.00) | 0.90 (0.00) | −0.15 (0.00) | −0.37 (0.00) | 0.90 (0.00) |
| Knee-R | 0.41 (0.00) | 0.44 (0.00) | 0.91 (0.00) | −0.06 (0.09) | −0.13 (0.00) | 0.79 (0.00) |
| Ankle-L | −0.49 (0.00) | −0.27 (0.00) | 0.94 (0.00) | −0.44 (0.00) | −0.45 (0.00) | 0.87 (0.00) |
| Ankle-R | −0.49 (0.00) | 0.03 (0.49) | 0.93 (0.00) | −0.47 (0.00) | −0.25 (0.00) | 0.82 (0.00) |
| Foot-L | −0.59 (0.00) | −0.46 (0.00) | 0.94 (0.00) | −0.54 (0.00) | −0.51 (0.00) | 0.88 (0.00) |
| Foot-R | −0.53 (0.00) | 0.03 (0.44) | 0.93 (0.00) | −0.39 (0.00) | −0.32 (0.00) | 0.88 (0.00) |
| Joints | DF | Pooled S.D | T-Value | p-Value |
|---|---|---|---|---|
| Hip Center | 70 | 0.1222 | 6.61 | 0.000 |
| SPINE | 70 | 0.1214 | −6.71 | 0.000 |
| Shoulder Center | 70 | 0.1222 | −5.83 | 0.000 |
| HEAD | 70 | 0.1225 | −6.12 | 0.000 |
| Shoulder Left | 70 | 0.1320 | 4.81 | 0.000 |
| Elbow Left | 70 | 0.1391 | −5.10 | 0.000 |
| Wrest Left | 70 | 0.1410 | 6.03 | 0.000 |
| Hand Left | 70 | 0.1437 | −6.21 | 0.000 |
| Shoulder Right | 70 | 0.1210 | 6.40 | 0.000 |
| Elbow Right | 70 | 0.1238 | −6.81 | 0.000 |
| Wrest Right | 70 | 0.1261 | −7.12 | 0.000 |
| Hand Right | 70 | 0.1262 | −7.21 | 0.000 |
| HIP Left | 70 | 0.1246 | −6.30 | 0.000 |
| Knee Left | 70 | 0.1432 | 6.63 | 0.000 |
| Ankle Left | 70 | 0.1304 | −7.38 | 0.000 |
| Foot Left | 70 | 0.1315 | 7.50 | 0.000 |
| HIP Right | 70 | 0.1220 | −6.75 | 0.000 |
| Knee Right | 70 | 0.1252 | −7.53 | 0.000 |
| Ankle Right | 70 | 0.1307 | −7.82 | 0.000 |
| Foot Right | 70 | 0.1317 | −8.03 | 0.000 |
| Source of Variation | DF | SS | MS | F-Value | p-Value |
|---|---|---|---|---|---|
| Joints | 39 | 42.1105 | 1.0798 | 64.66 | 0.000 |
| Error | 1400 | 23.3802 | 0.0167 | — | — |
| Total | 1439 | 65.4906 | — | — | — |
| Joints | Adj.Mean | Adj.SD | Cronbach’s Value |
|---|---|---|---|
| 18.941 | 2.986 | 0.9973 | |
| 18.909 | 2.986 | 0.9973 | |
| 18.801 | 3.021 | 0.9979 | |
| 18.735 | 2.994 | 0.9974 | |
| 18.807 | 2.993 | 0.9974 | |
| 18.889 | 2.982 | 0.9974 | |
| 18.967 | 2.972 | 0.9974 | |
| 18.992 | 2.968 | 0.9974 | |
| 18.824 | 2.992 | 0.9973 | |
| 18.927 | 2.984 | 0.9973 | |
| 19.022 | 2.979 | 0.9973 | |
| 19.049 | 2.977 | 0.9973 | |
| 18.960 | 2.985 | 0.9973 | |
| 19.111 | 2.968 | 0.9976 | |
| 19.182 | 2.971 | 0.9973 | |
| 19.215 | 2.969 | 0.9973 | |
| 18.959 | 2.985 | 0.9972 | |
| 19.074 | 2.976 | 0.9973 | |
| 19.158 | 2.967 | 0.9974 | |
| 19.194 | 2.964 | 0.9974 |
| Gender | 09 Joints | 12 Joints | 14 Joints | 16 Joints | 18 Joints | 20 Joints |
|---|---|---|---|---|---|---|
| Male | 92.0 | 94.0 | 90.0 | 96.0 | 98.0 | 98.0 |
| Female | 94.0 | 96.0 | 90.0 | 96.0 | 96.0 | 98.0 |
| Both | 93.0 | 95.0 | 90.0 | 96.0 | 97.0 | 98.0 |
| Predictors (Joints) | Coefficients | Standard Error | p-Value |
|---|---|---|---|
| Constant | 18.30 | 23.6511 | 0.013 |
| 20.2 | 42.1786 | 0.043 | |
| 55.5 | 36.1421 | 0.021 | |
| 45.3 | 47.0012 | 0.032 | |
| 10.75 | 55.5609 | 0.040 | |
| −12.0 | 30.9800 | 0.026 | |
| 22.7 | 19.3451 | 0.029 | |
| 33.3 | 29.6555 | 0.032 | |
| 28.9 | 42.7764 | 0.035 | |
| 36.0 | 23.2213 | 0.026 | |
| 29.1 | 49.3244 | 0.029 | |
| 50.4 | 32.9212 | 0.034 | |
| 44.6 | 40.6665 | 0.038 | |
| −11.5 | 60.6542 | 0.020 | |
| 20.8 | 55.8721 | 0.033 | |
| 26.9 | 44.8111 | 0.036 | |
| 45.2 | 34.5444 | 0.038 | |
| 52.3 | 33.2111 | 0.040 | |
| 37.8 | 35.5433 | 0.041 | |
| 39.1 | 45.4456 | 0.046 | |
| 10.6 | 22.5467 | 0.045 |
| Algorithm | Recall Male (%) | Recall Female (%) | Accuracy (%) |
|---|---|---|---|
| Naive Bayes | 80.0 | 70.0 | 75.0% |
| MLP | 84.0 | 70.0 | 77.0% |
| RF | 92.0 | 88.0 | 90.0% |
| KNN | 94.0 | 90.0 | 92.0% |
| Our | 98.0 | 98.0 | 98.0% |
| Classifier | Dataset | Accuracy (%) |
|---|---|---|
| SVM [55] | UPCVgait | 96.67% |
| Proposed Method | UPCVgait | 98.5% |
Publisher’s Note: MDPI stays neutral with regard to jurisdictional claims in published maps and institutional affiliations. |
© 2022 by the authors. Licensee MDPI, Basel, Switzerland. This article is an open access article distributed under the terms and conditions of the Creative Commons Attribution (CC BY) license (https://creativecommons.org/licenses/by/4.0/).
Share and Cite
Azhar, M.; Ullah, S.; Ullah, K.; Syed, I.; Choi, J. A Gait-Based Real-Time Gender Classification System Using Whole Body Joints. Sensors 2022, 22, 9113. https://doi.org/10.3390/s22239113
Azhar M, Ullah S, Ullah K, Syed I, Choi J. A Gait-Based Real-Time Gender Classification System Using Whole Body Joints. Sensors. 2022; 22(23):9113. https://doi.org/10.3390/s22239113
Chicago/Turabian StyleAzhar, Muhammad, Sehat Ullah, Khalil Ullah, Ikram Syed, and Jaehyuk Choi. 2022. "A Gait-Based Real-Time Gender Classification System Using Whole Body Joints" Sensors 22, no. 23: 9113. https://doi.org/10.3390/s22239113
APA StyleAzhar, M., Ullah, S., Ullah, K., Syed, I., & Choi, J. (2022). A Gait-Based Real-Time Gender Classification System Using Whole Body Joints. Sensors, 22(23), 9113. https://doi.org/10.3390/s22239113