

SA-FEM: Combined Feature Selection and Feature Fusion for Students’ Performance Prediction
 , ,
, ,  , and
, and
Abstract
1. Introduction
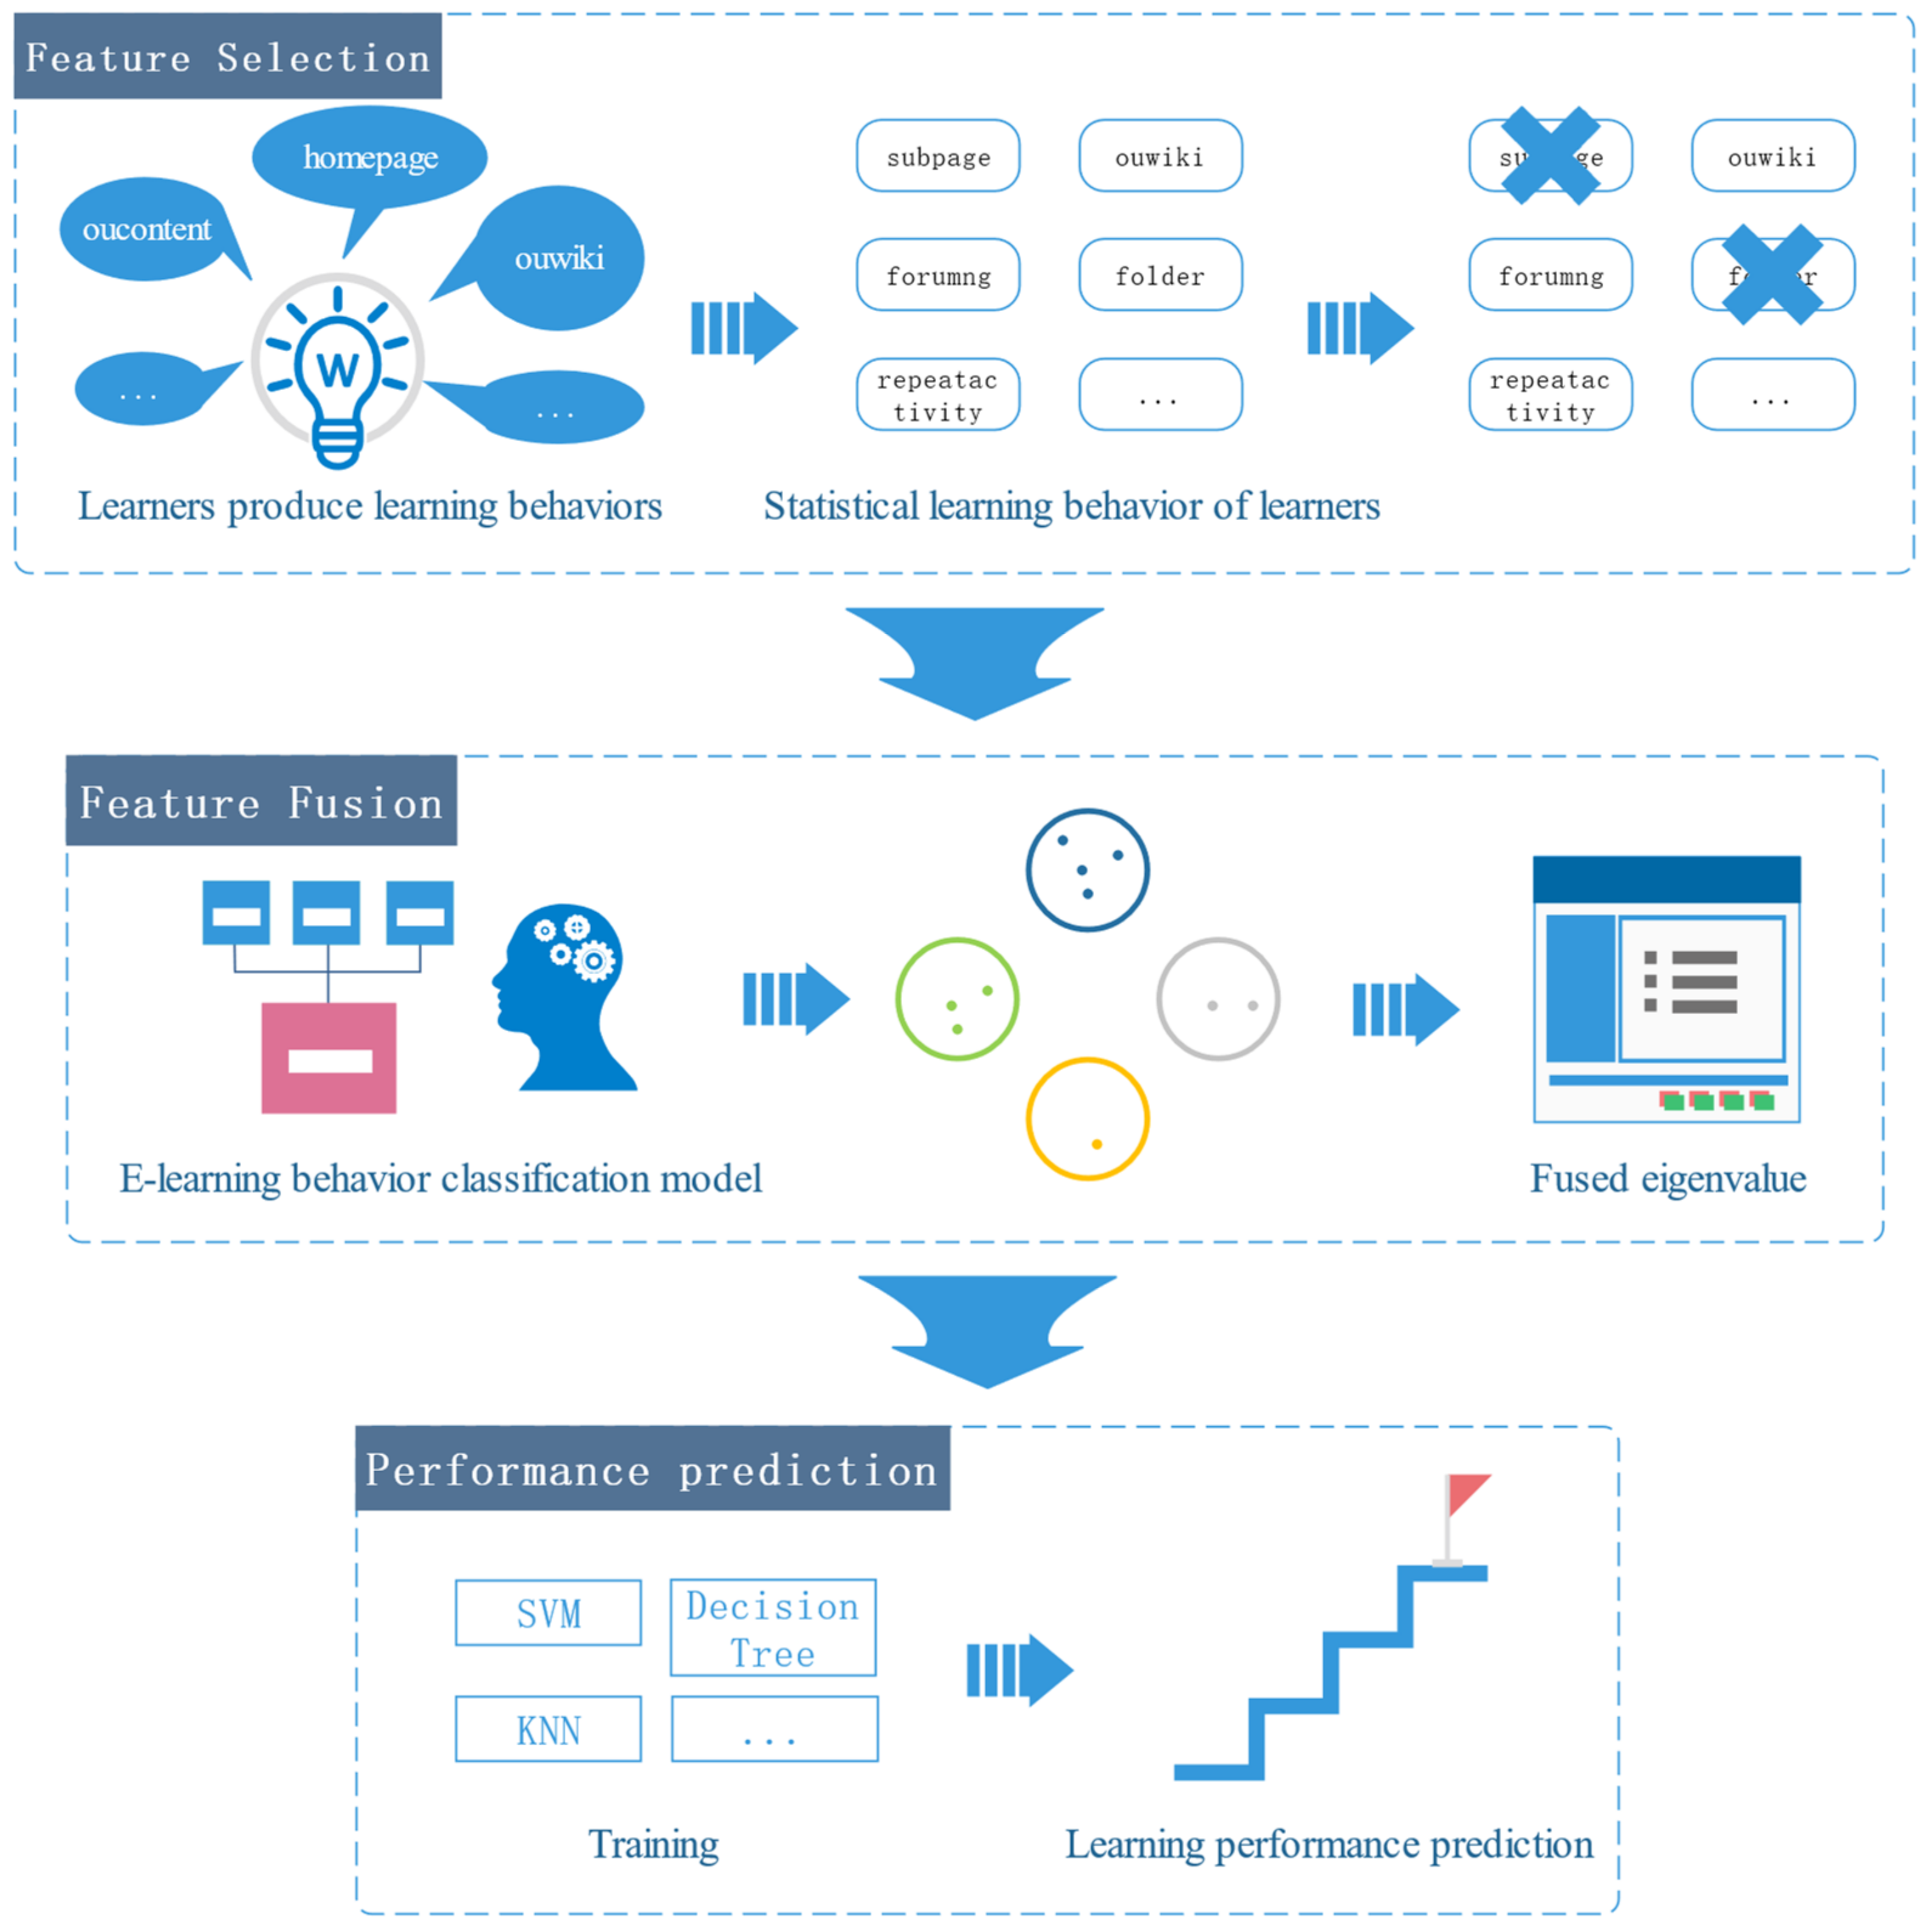
- This paper proposes an end-to-end learning performance prediction model. First, we construct a wrapper method using differential evolution algorithms as an evaluation function to implement feature selection. Second, we further use the e-learning behavior classification model to fuse the preliminary selected features with finer granularity. While reducing the computational load of the model, the feature fusion based on the learning process behavior classification model takes into account the correlation between the behavior features and fuses the same category of features as the input of the prediction model, which greatly enhances the interpretability of the model;
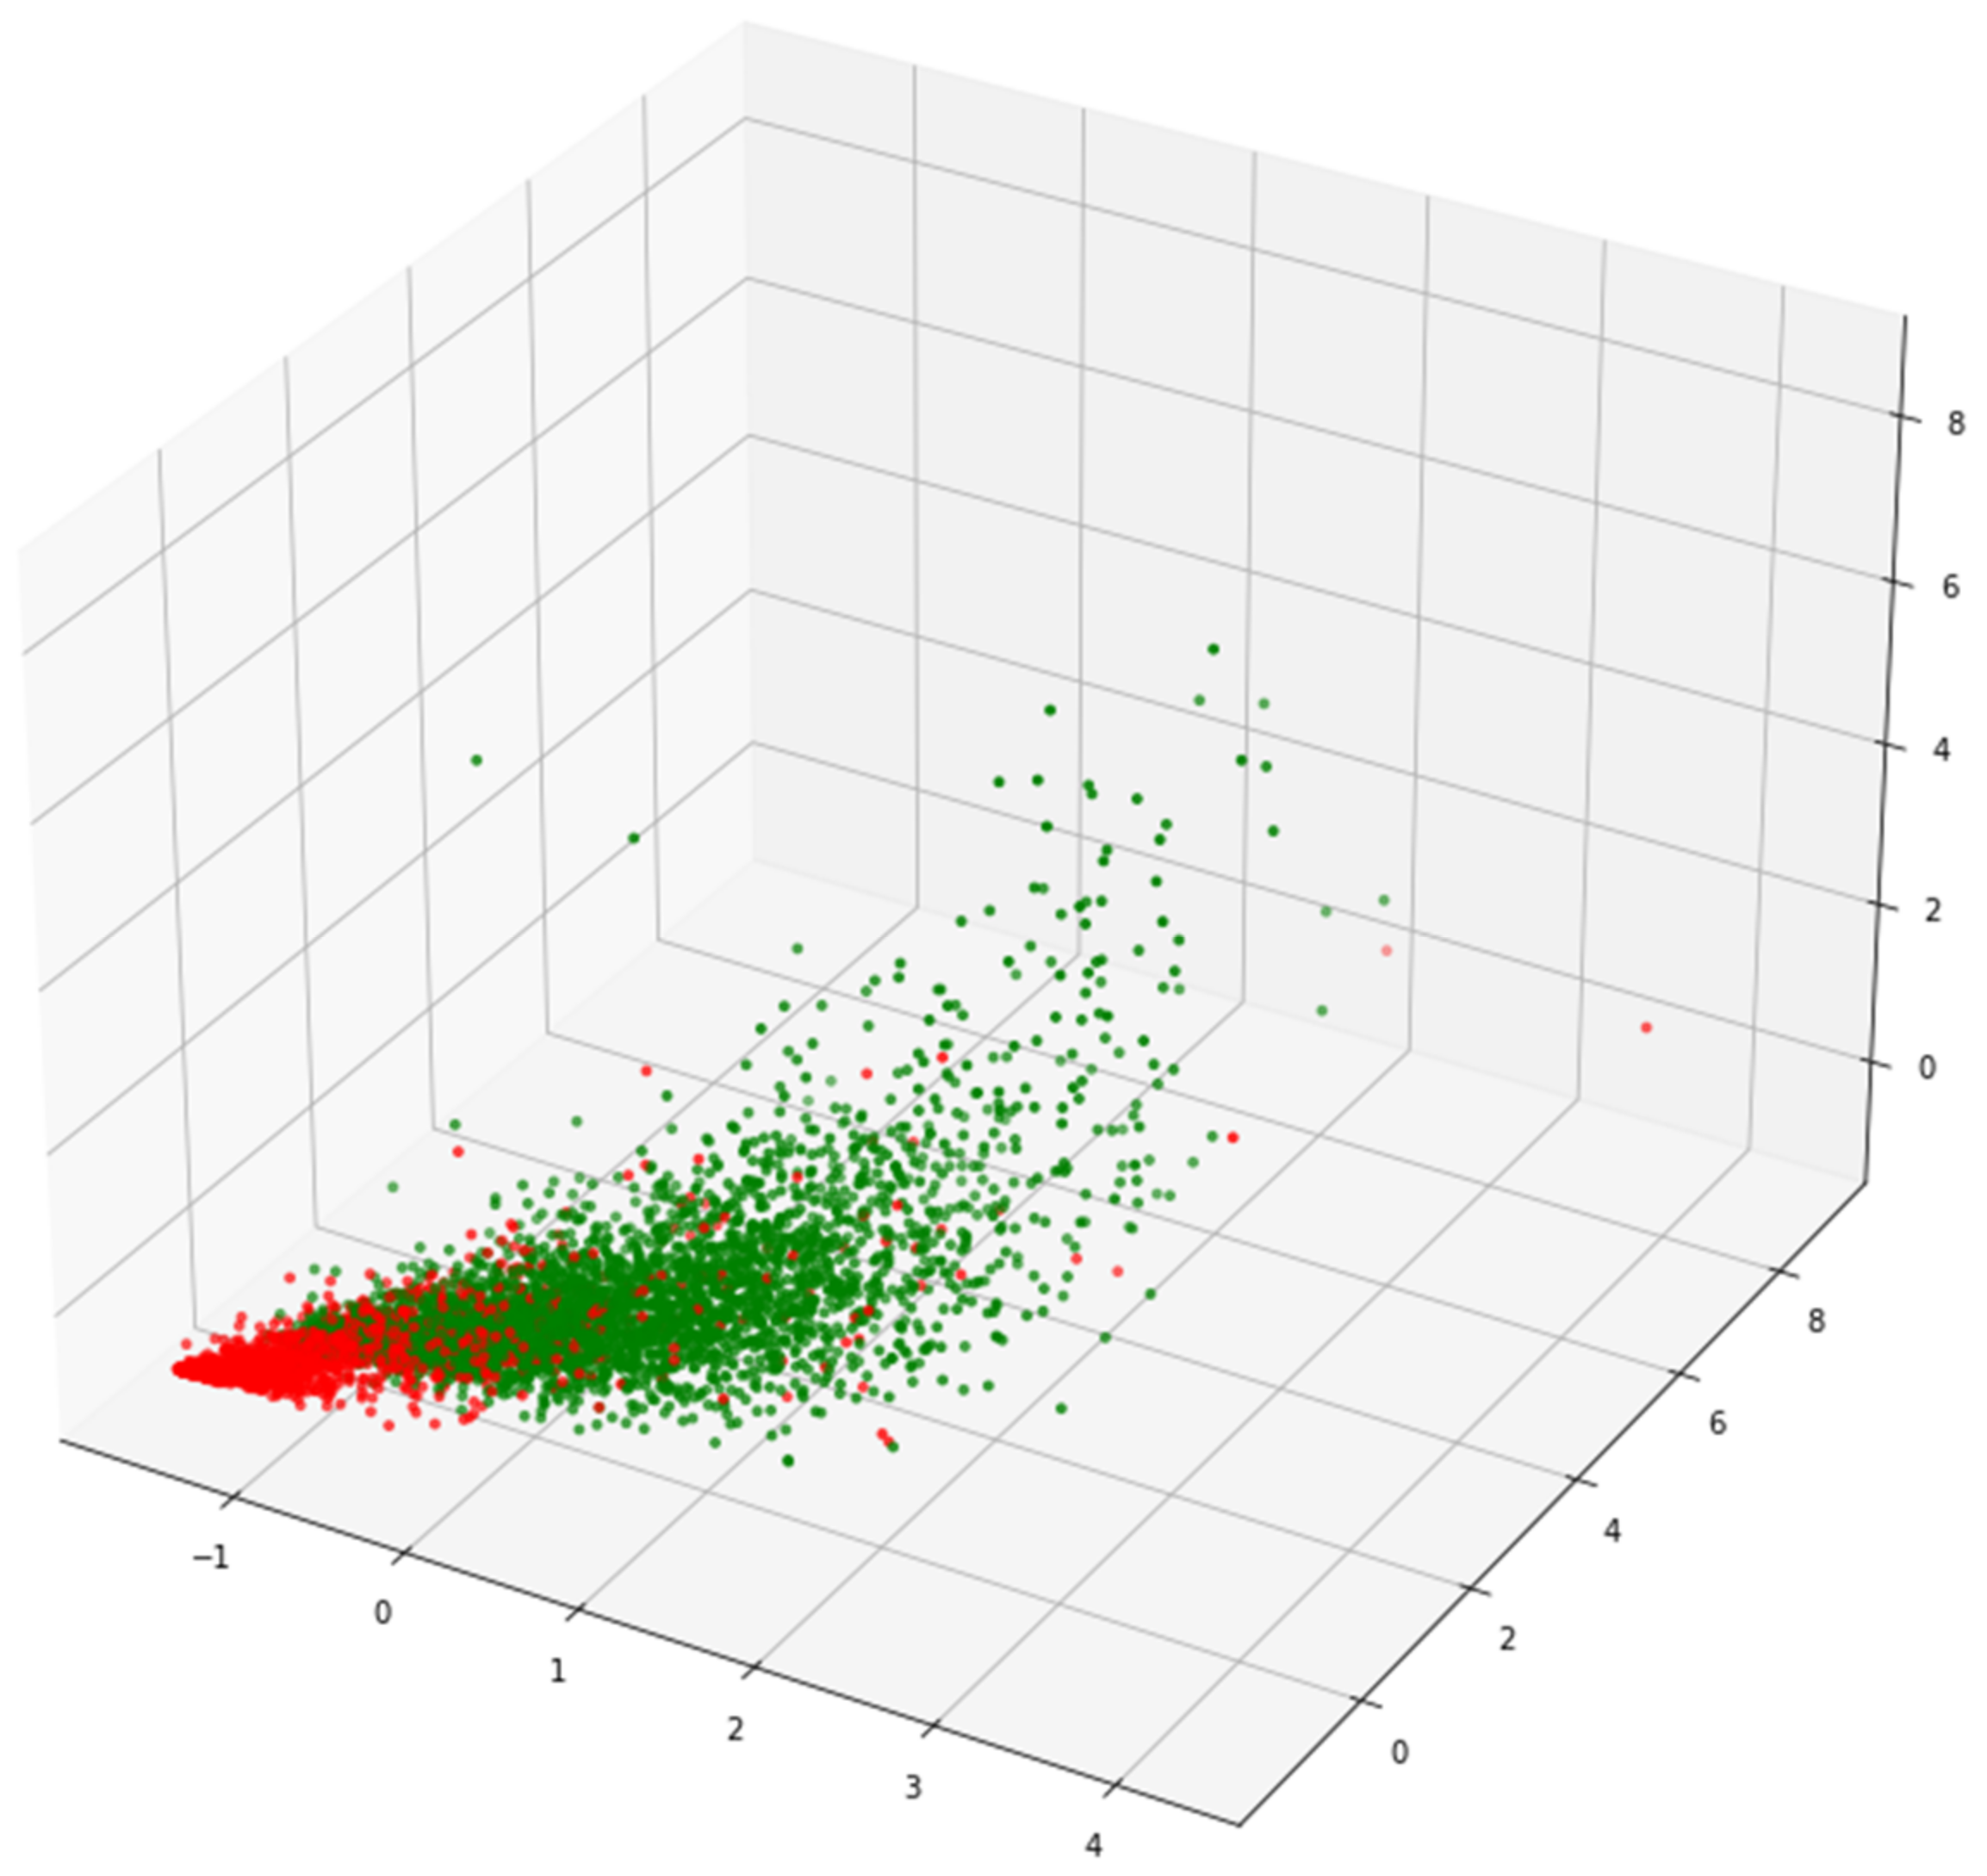
- This paper presents an adaptive feature fusion method. Firstly, through data visualization, the distribution rules of different types of learners are observed. Secondly, according to the discreteness of each learner’s distribution, different feature fusion strategies are formulated. Finally, the cluster similarity is used to identify the learner categories, and the corresponding feature fusion strategies are selected adaptively;
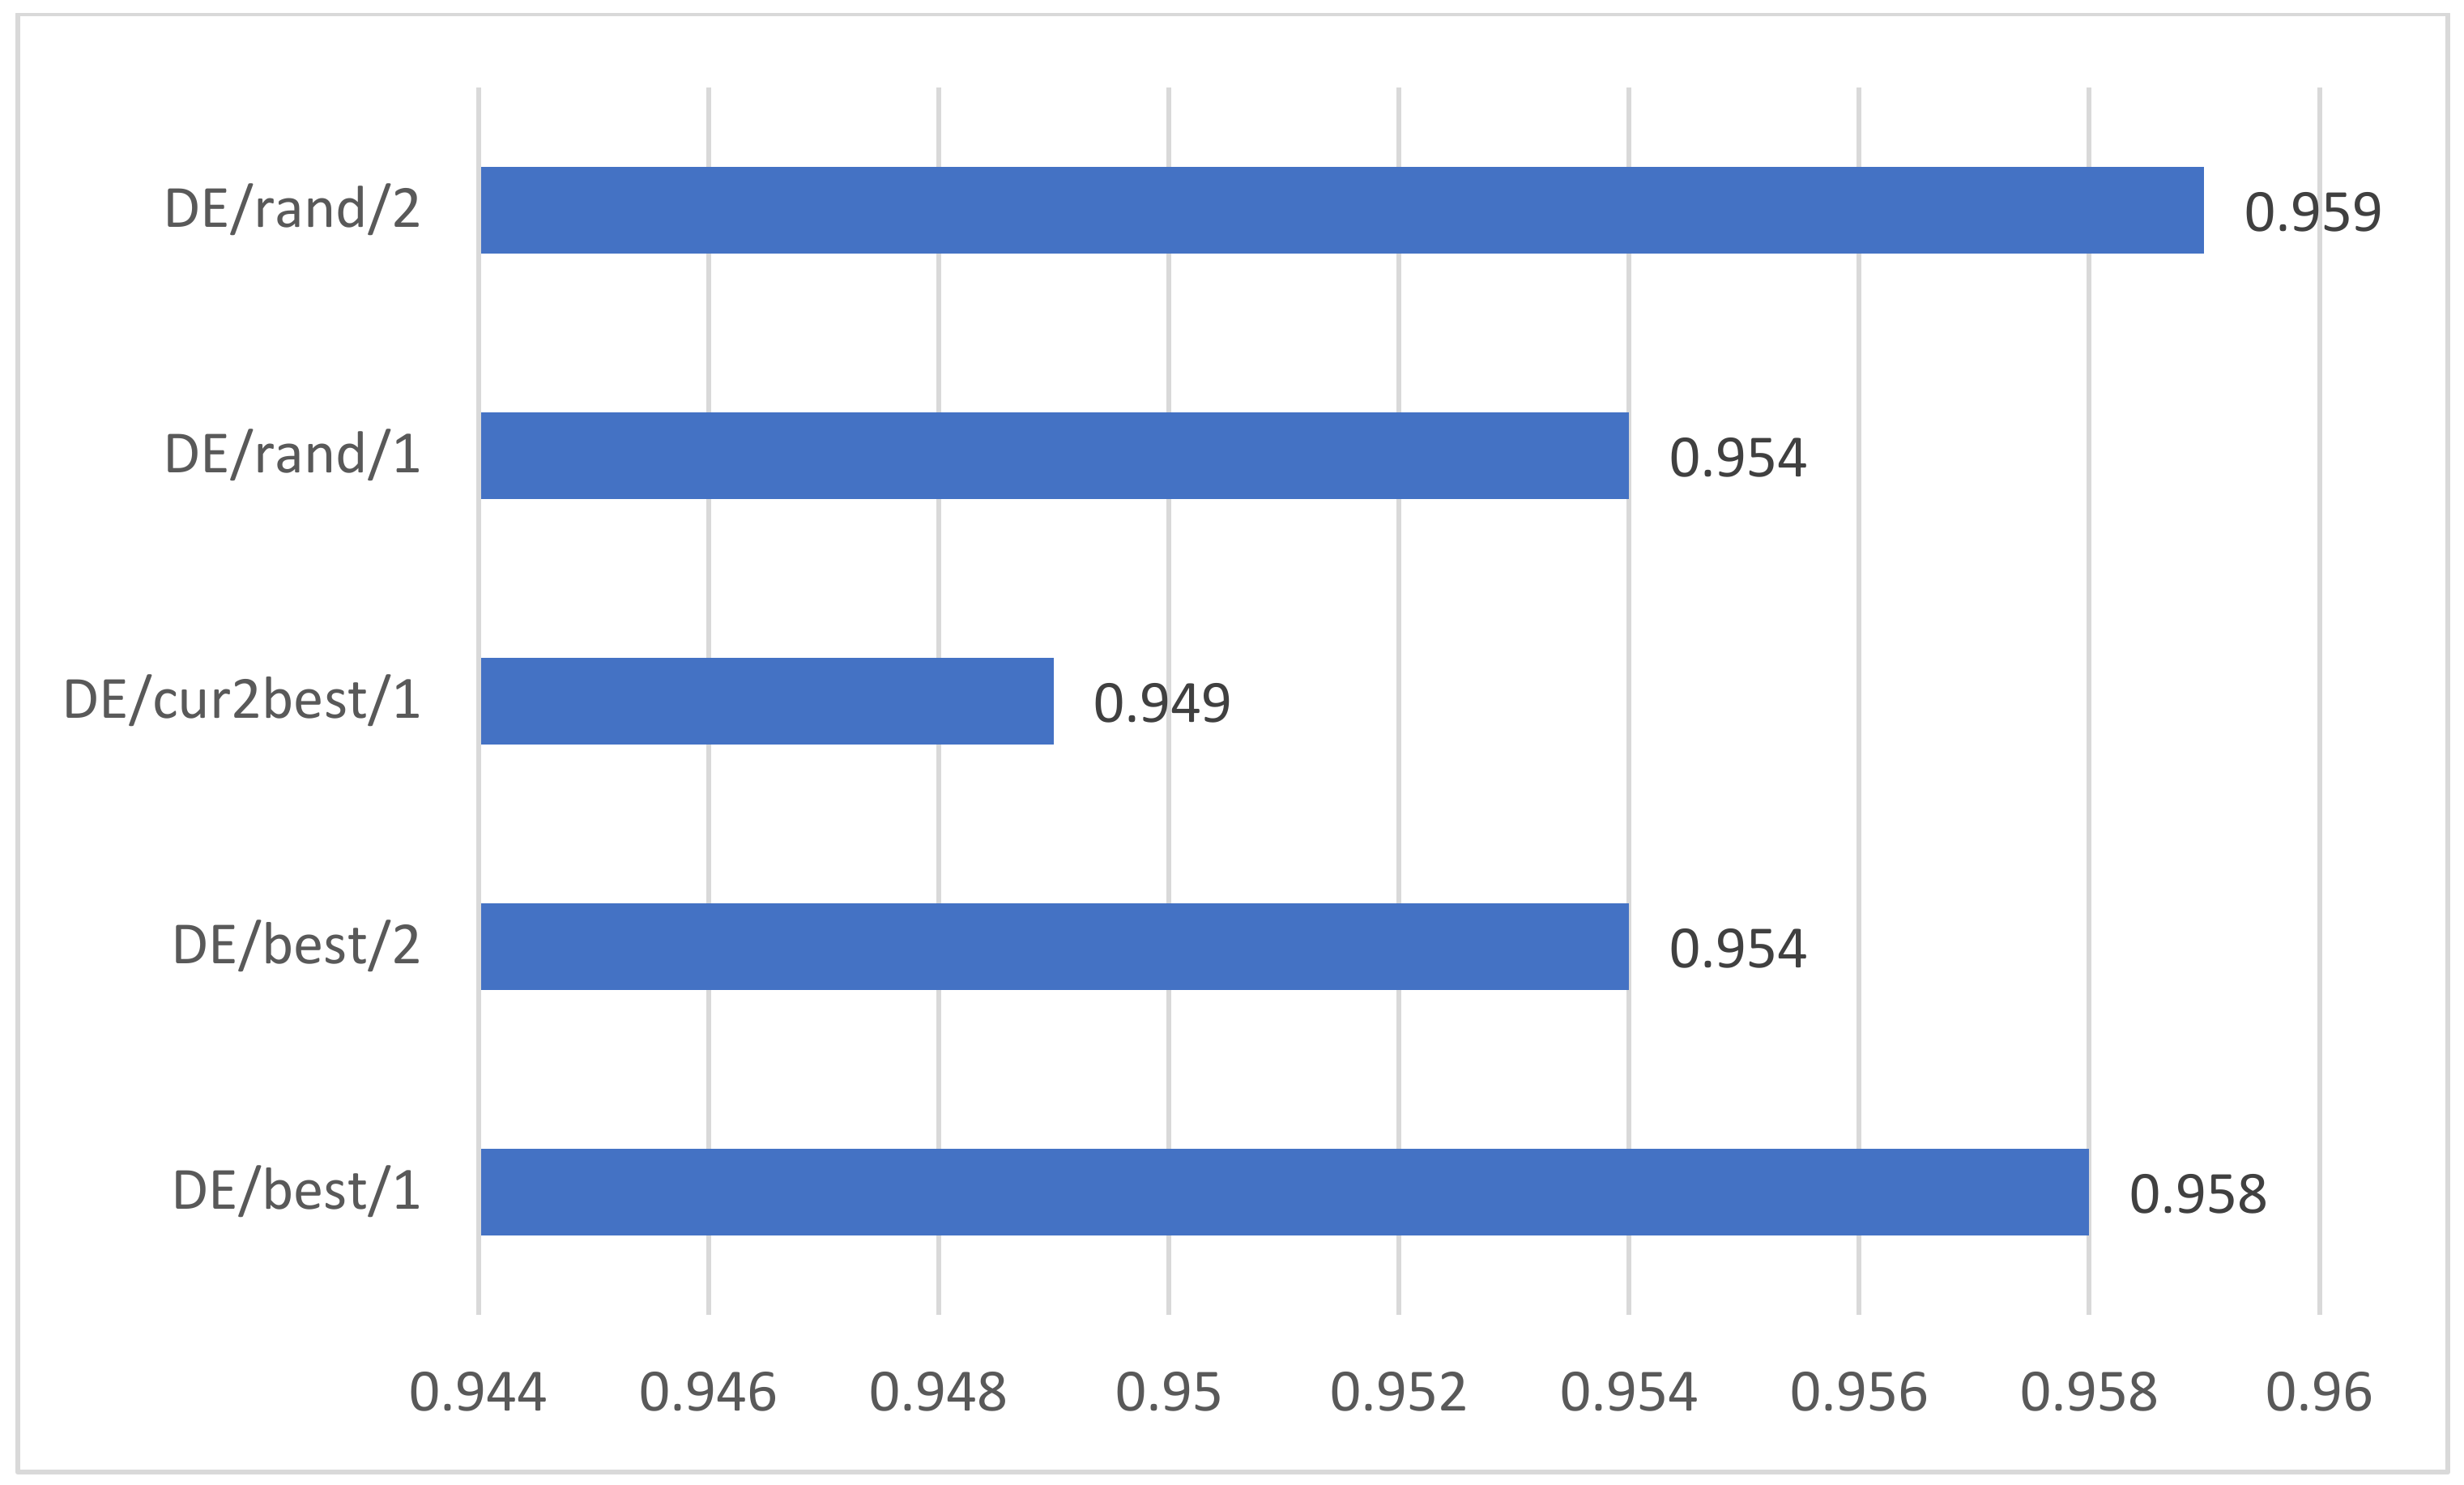
- In the aspect of advanced validation of mechanism construction, through a large number of experimental comparisons, it is found that the ablation experiments of feature fusion show that the performance and efficiency of the model can be effectively improved after feature fusion. Comparative experiments of the different mutation strategies show the advancement of our differential evolution algorithm.
- In terms of validation of algorithm advancement, an experimental analysis on the course FFF of the Open University Learning Analytics Dataset (OULAD) demonstrates the validity of the SA-FEM proposed in this paper, and it is superior to the benchmark method in model performance, such as accuracy, F1 score, etc.
2. Related Work
2.1. E-Learning Performance Features
2.2. E-Learning Performance Prediction Methods
3. Method
3.1. Problem Description
3.2. E-Learning Behavior Classification Model (EBC Model)
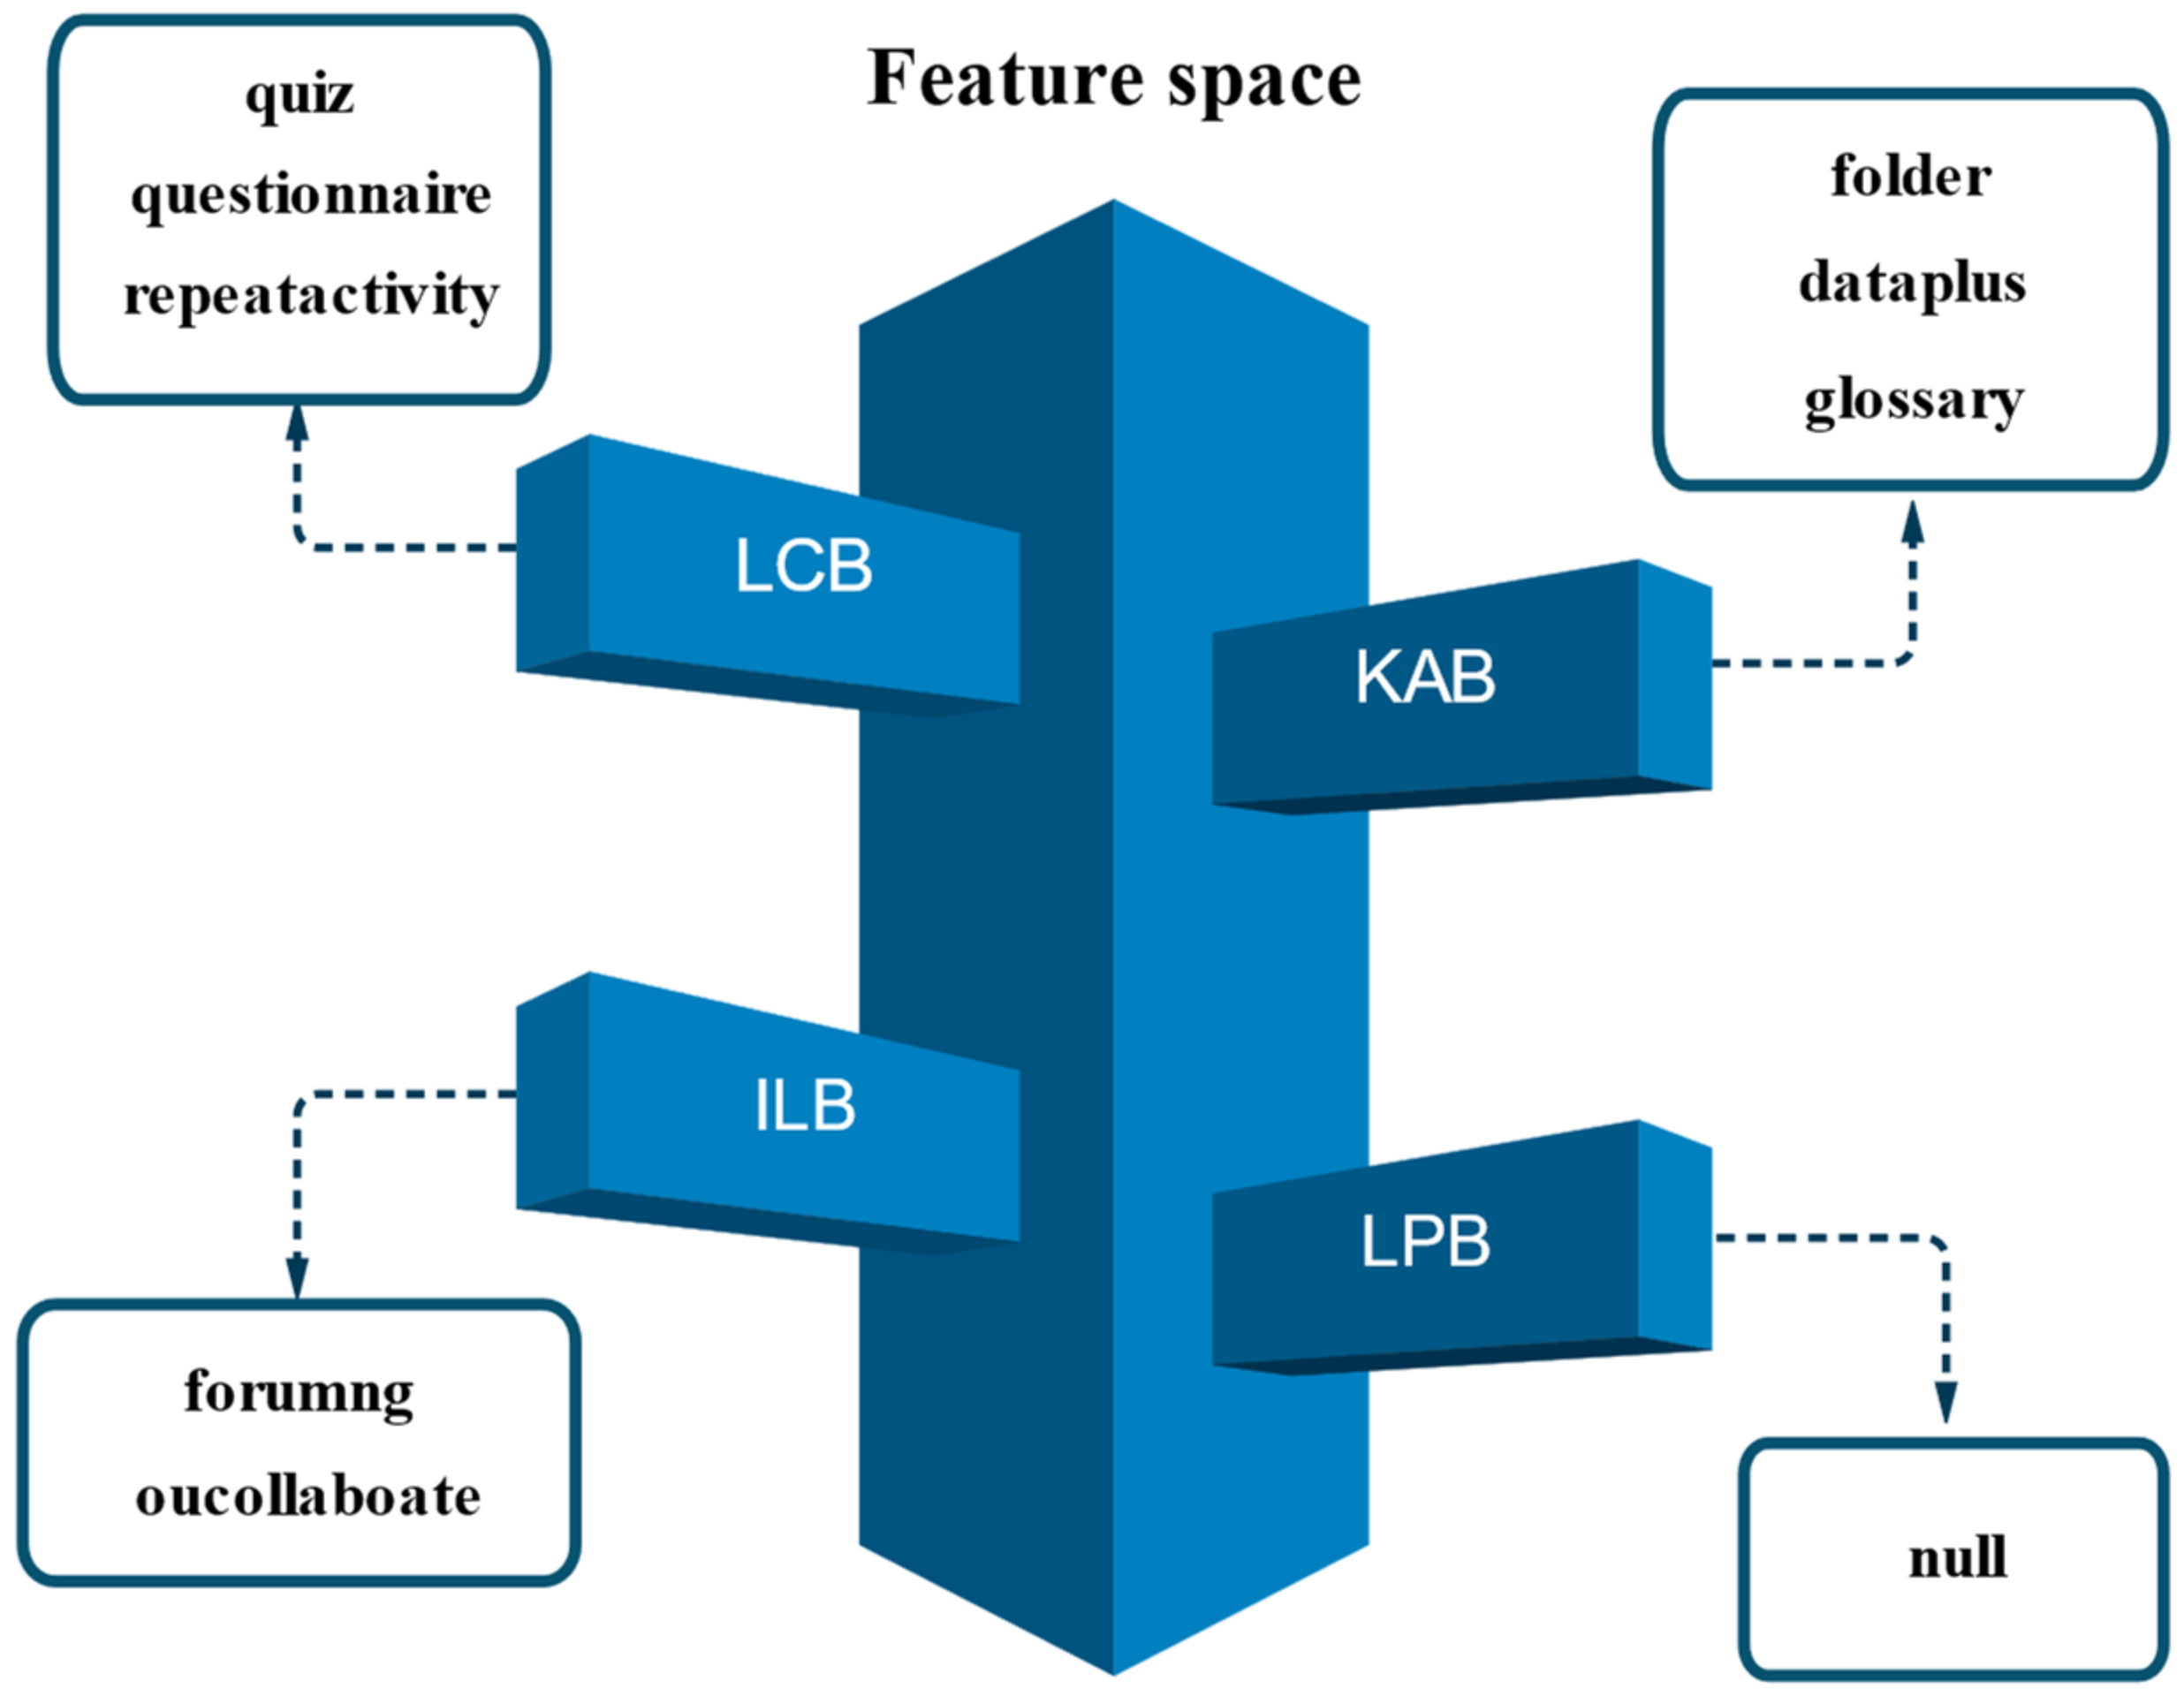
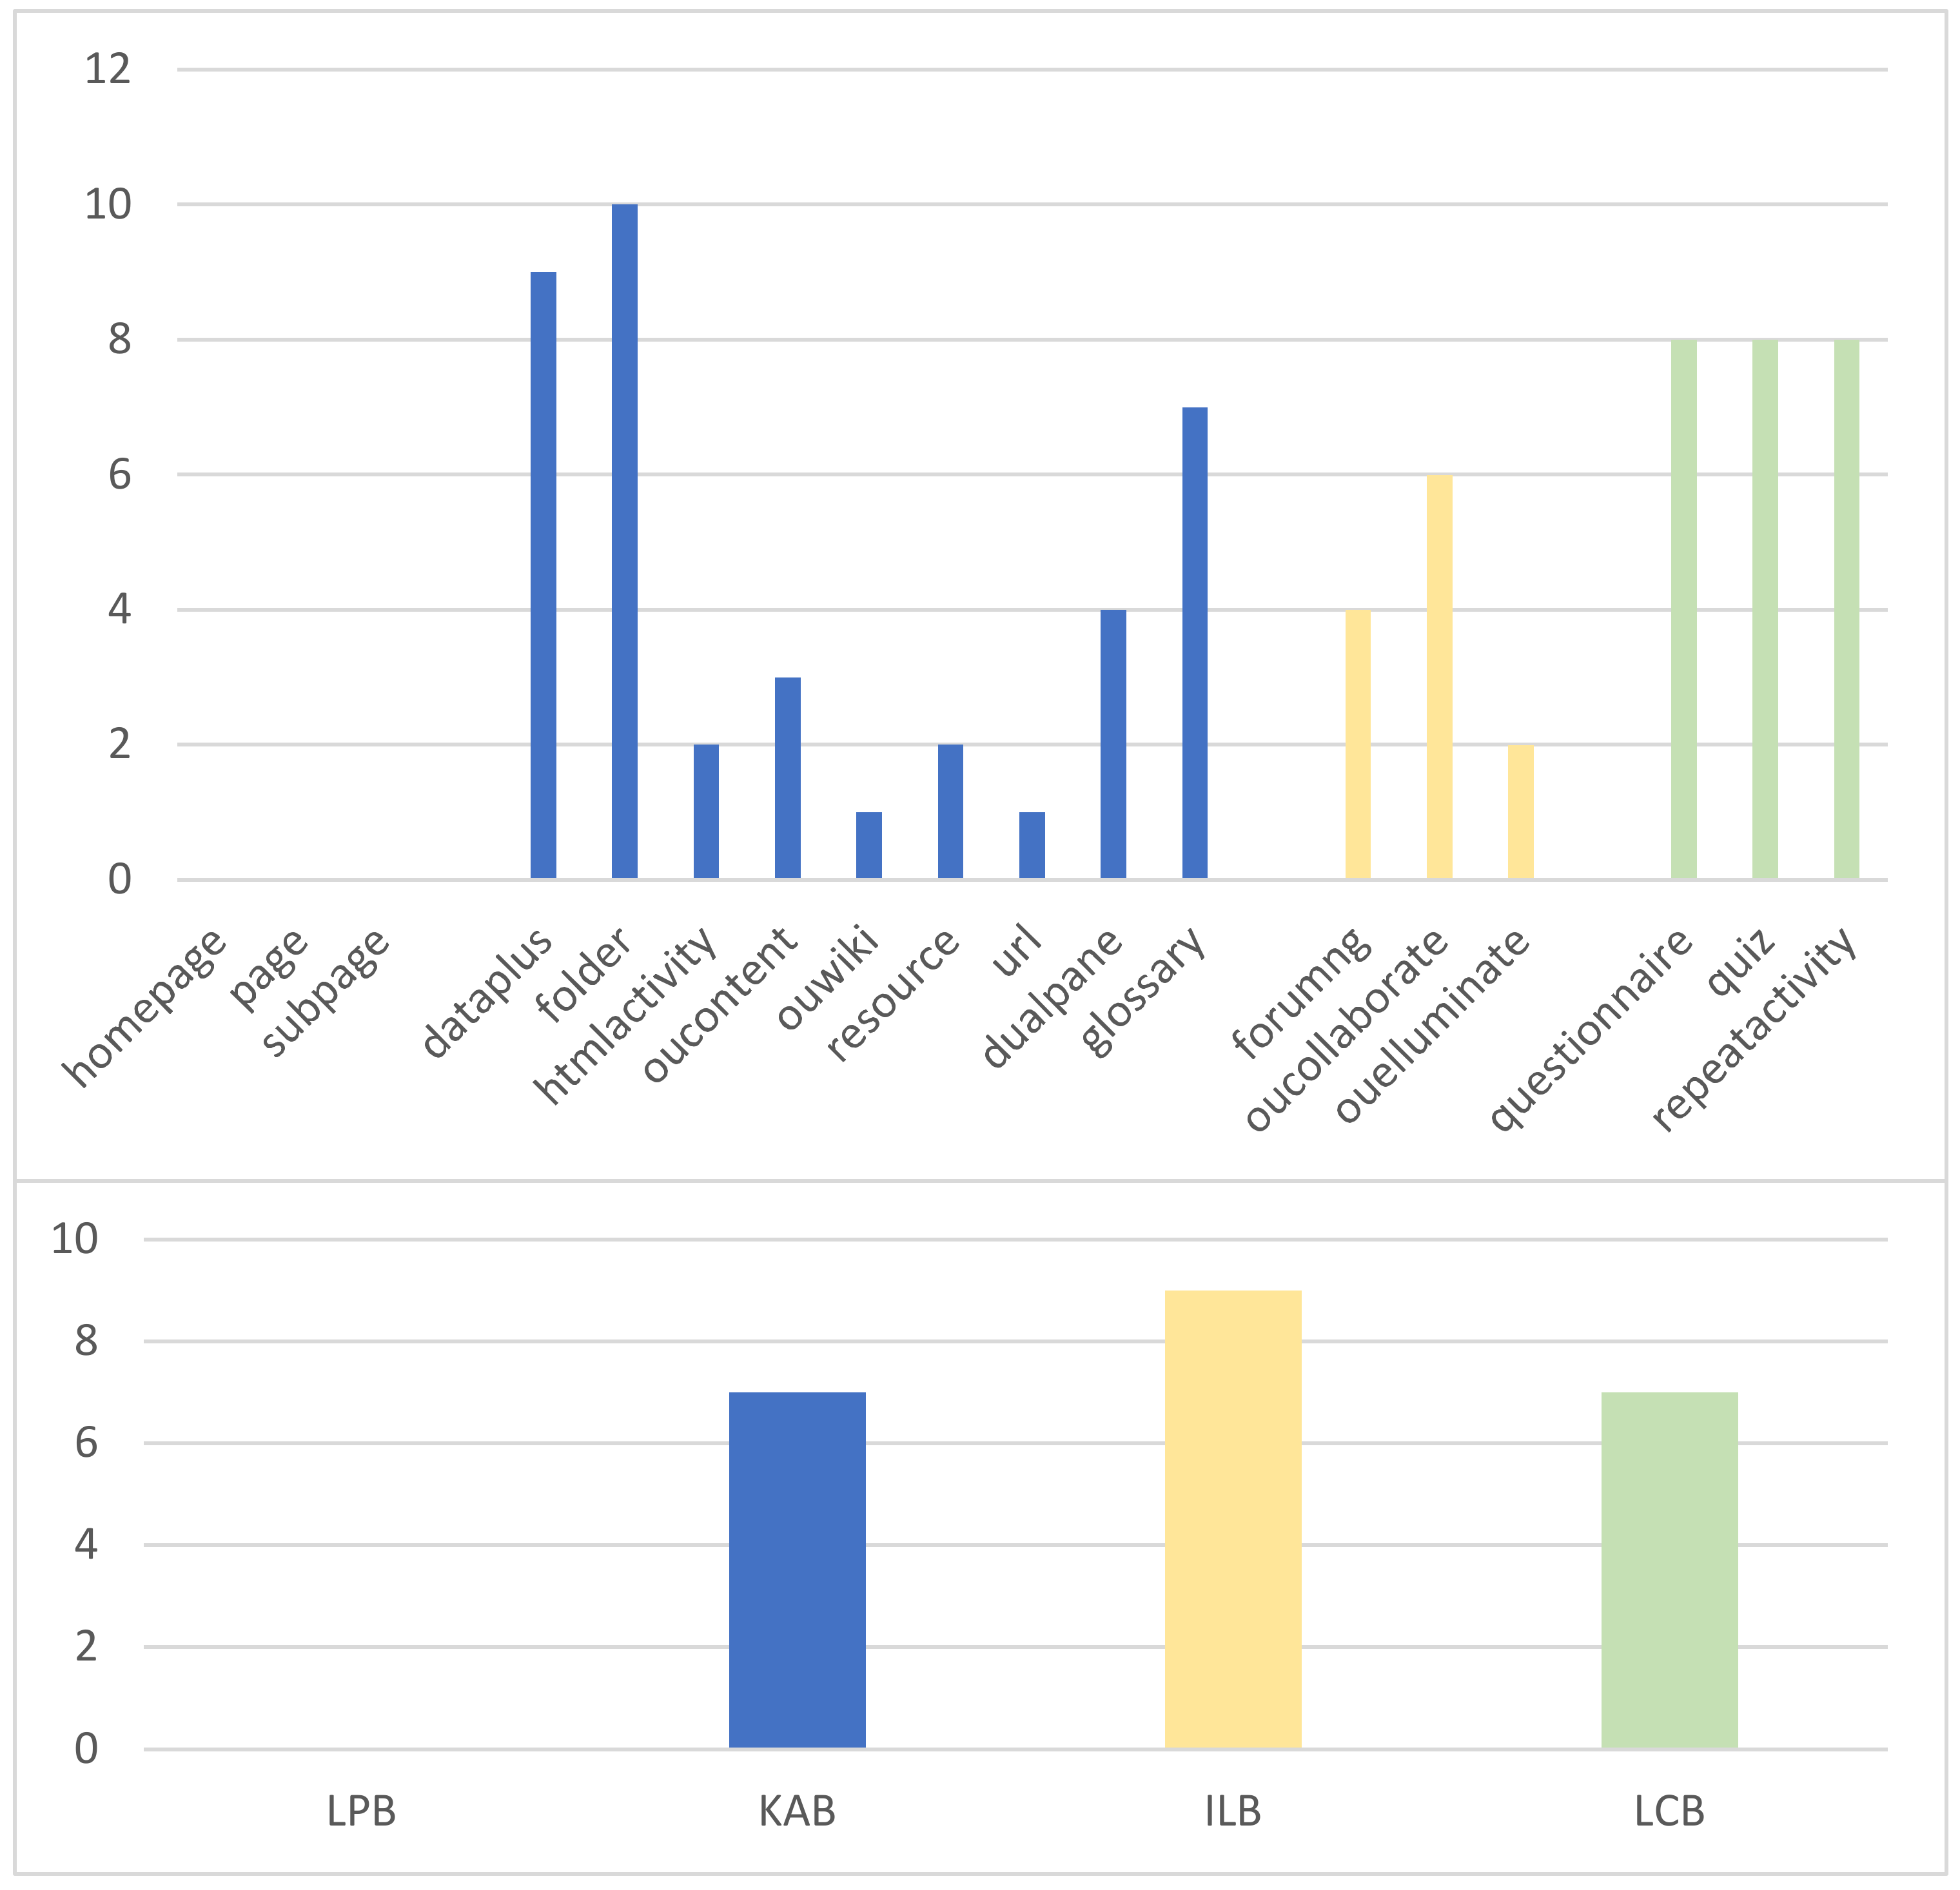
- Learning preparation behavior (LPB): The most fundamental learning behavior, which takes place throughout the learning preparation stage. This involves signing in to the learning platform, visiting the course page, examining the interface for the course activities, etc.;
- Knowledge acquisition behavior (KAB): The behavior of online learners in acquiring knowledge directly, which occurs in the knowledge acquisition stage. It mainly includes participating in course activities, browsing course content resources, watching course videos, and visiting resource links;
- Interactive learning behavior (ILB): It occurs during the interactive reflection stage and is one of the key learning behaviors in e-learning, which has been proven to have a positive effect on the continuity and effectiveness of e-learning [32]. It is manifested by participating in seminars, posting on forums, replying to forums, asking the teacher questions, etc.;
- Learning consolidation behavior (LCB): Occurs during the learning consolidation stage and refers to the behavior of learners to reinforce their knowledge, mainly through post-lecture reflections and completion of post-lecture tests.
3.3. Self-Adaptive E-Learning Performance Prediction Model (SA-FEM)
| Algorithm 1: FGDEM: Fine-grained differential evolution Model |
| Input: Population P; Dimension D; Generation T Output: the best vector solutions of feature fusion
|
| Algorithm 2: Self Adptive Fine-grained Feature Enginnering Model |
| Input: Population P; Dimension D; Generation T Output: the best vector solutions of feature fusion
|
3.3.1. Data Pre-Processing
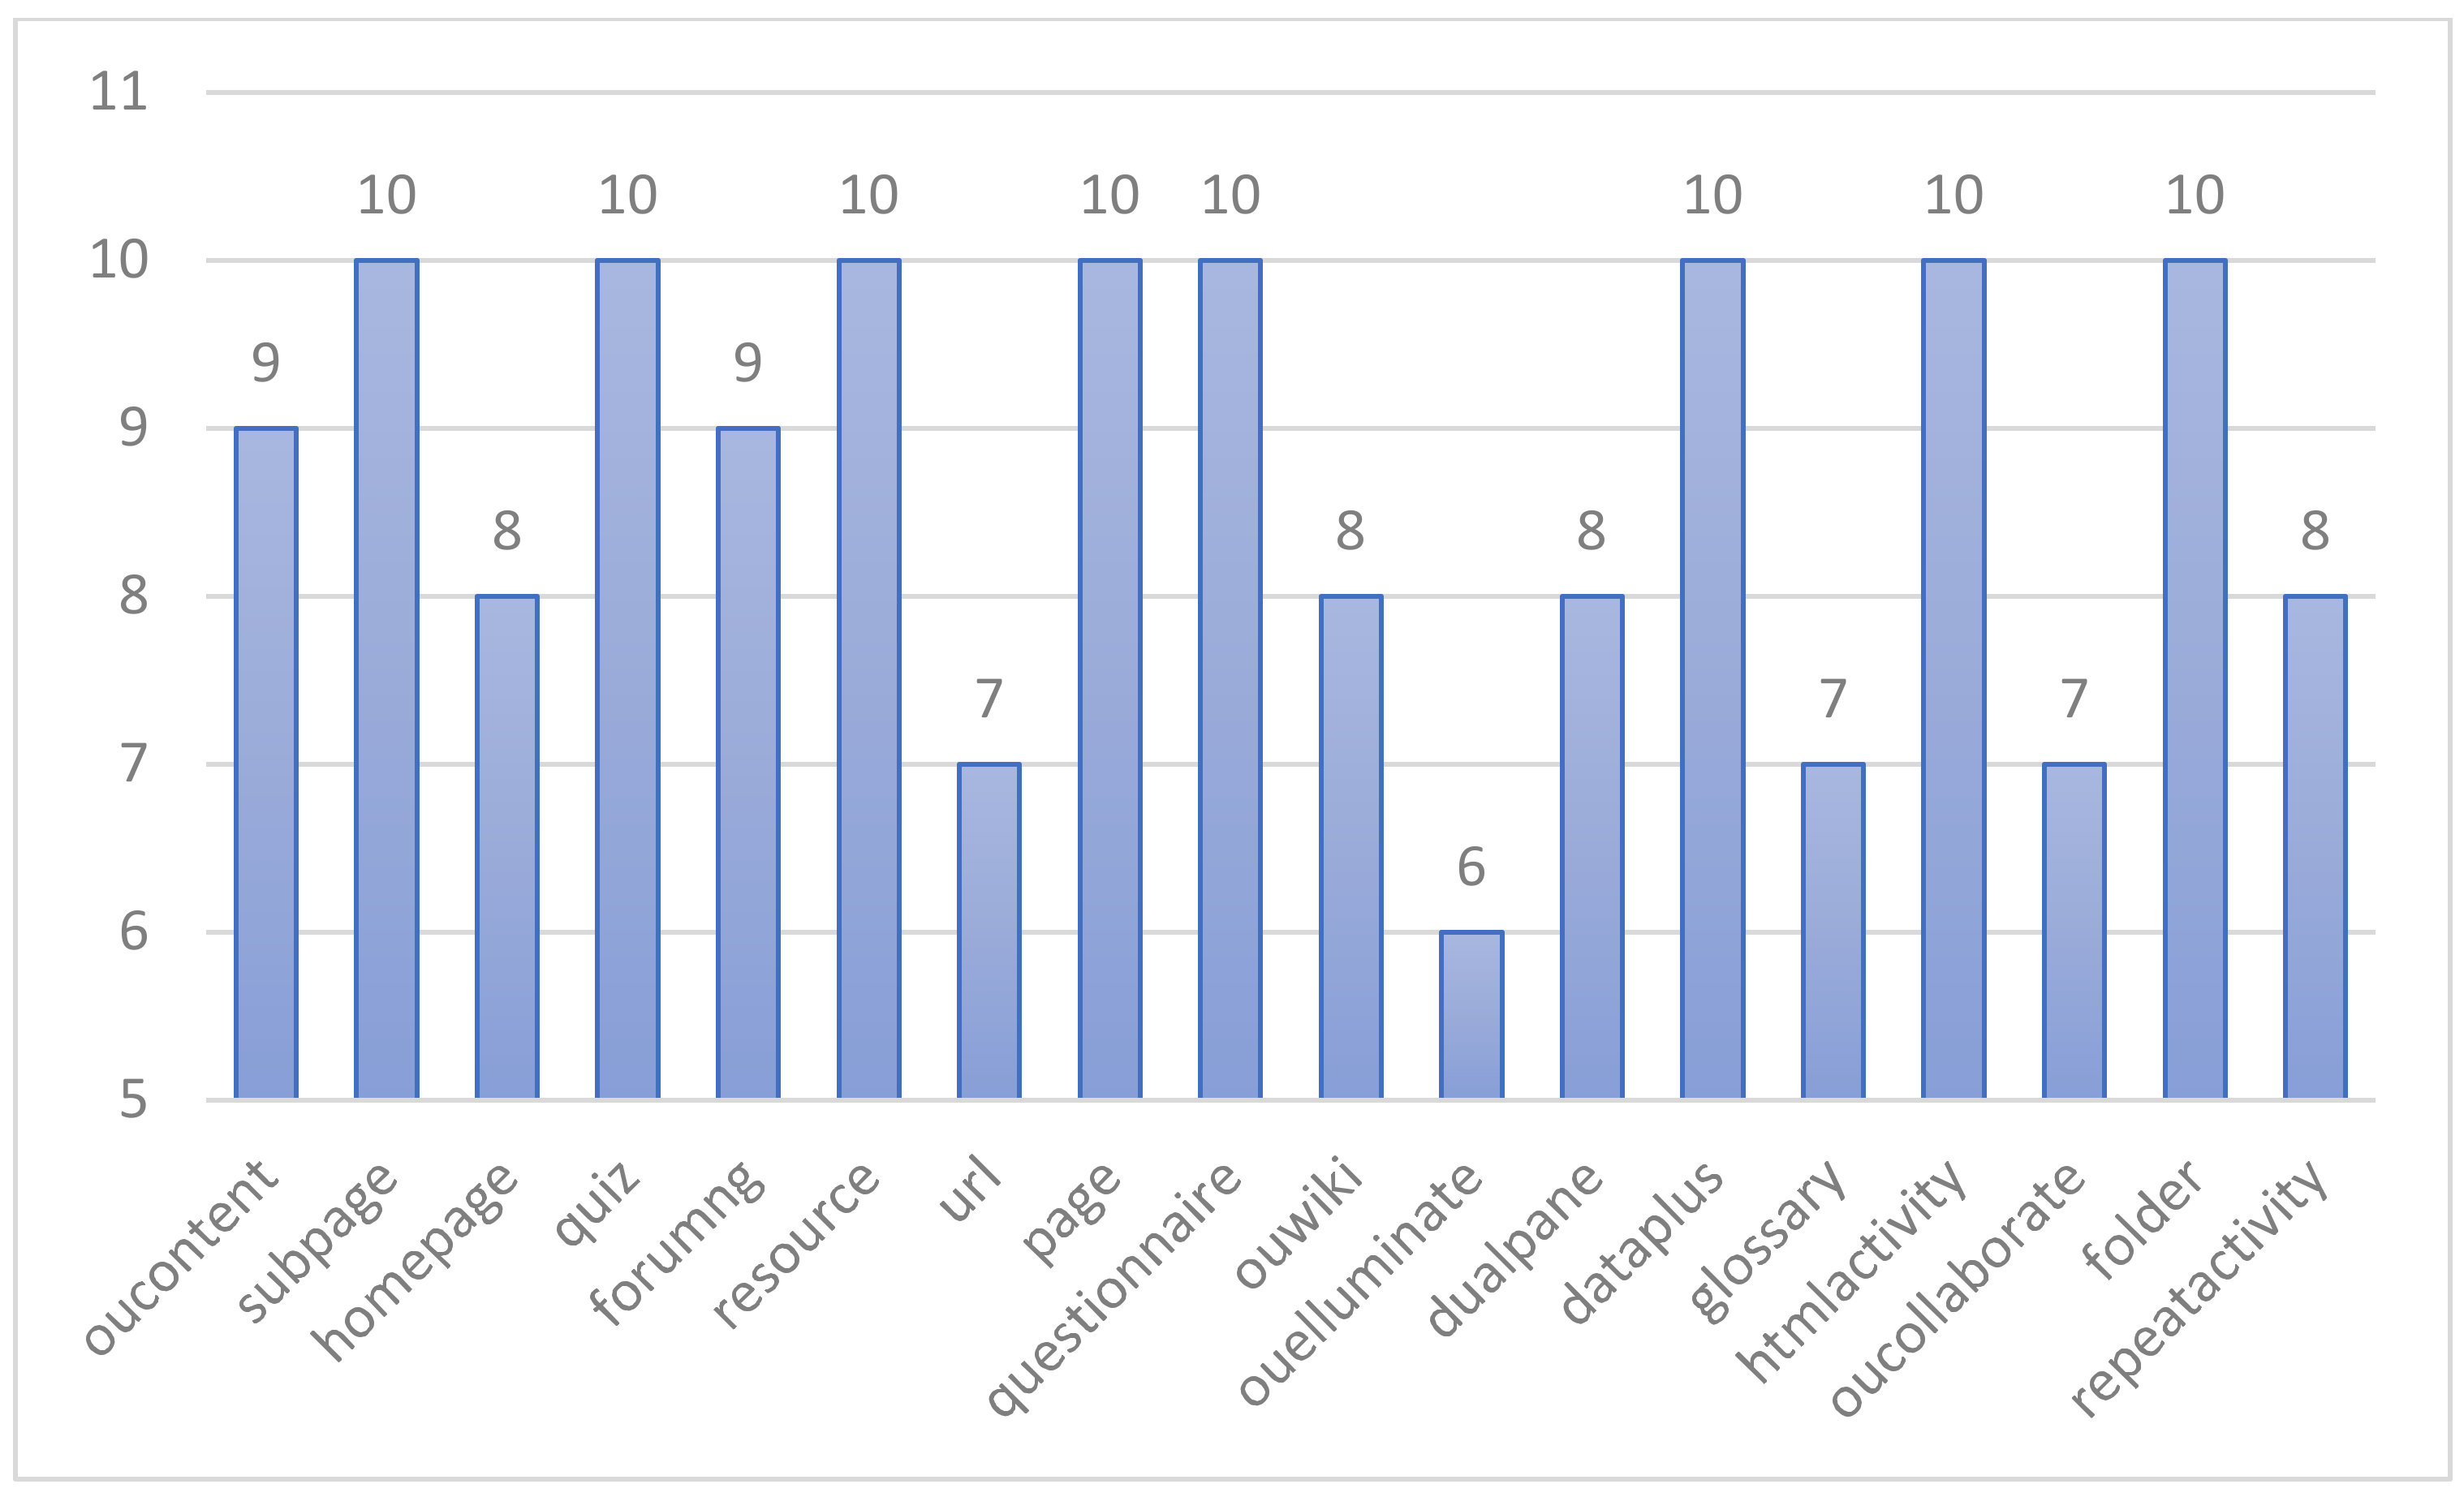
3.3.2. Feature Selection
3.3.3. Feature Fusion
3.3.4. Model Training
4. Experimental Design
4.1. Data Sources
4.2. Experimental Design for Validation of SA-FEM
- Experimental scheme
- 2.
- Feature selection
- 3.
- Feature fusion
- 4.
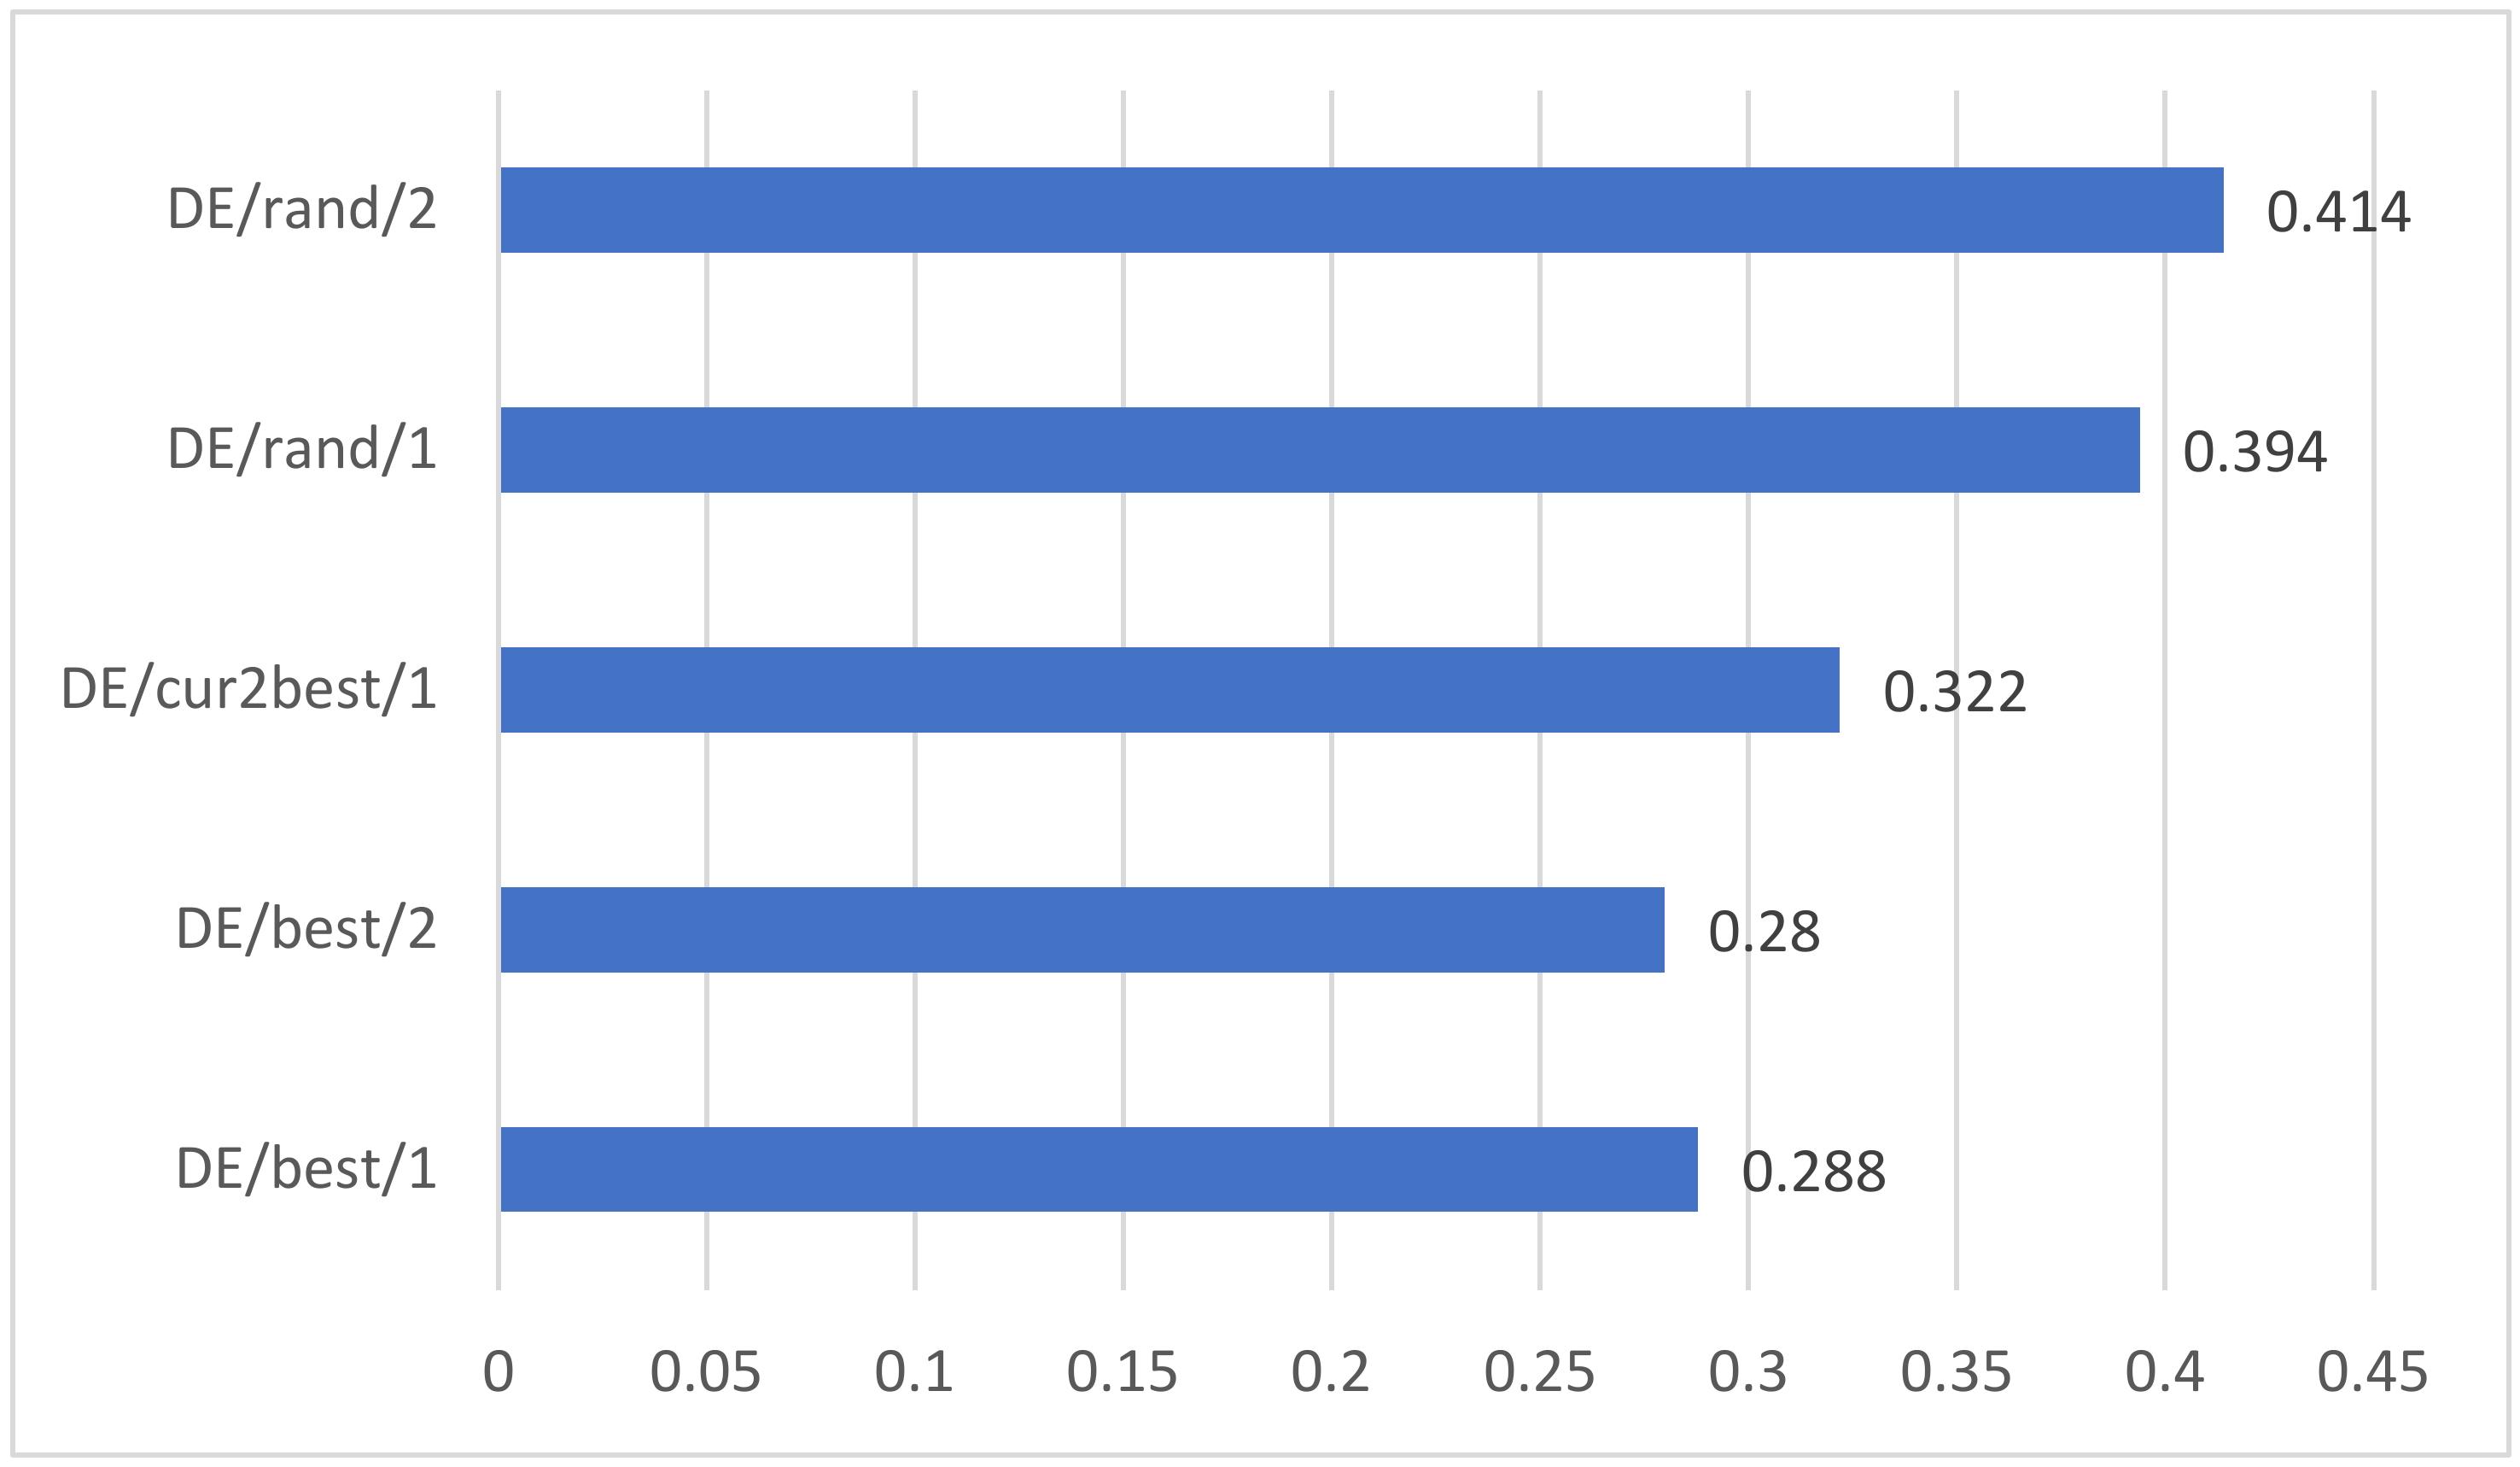
- Mutation Strategy
5. Experimental Results and Analysis
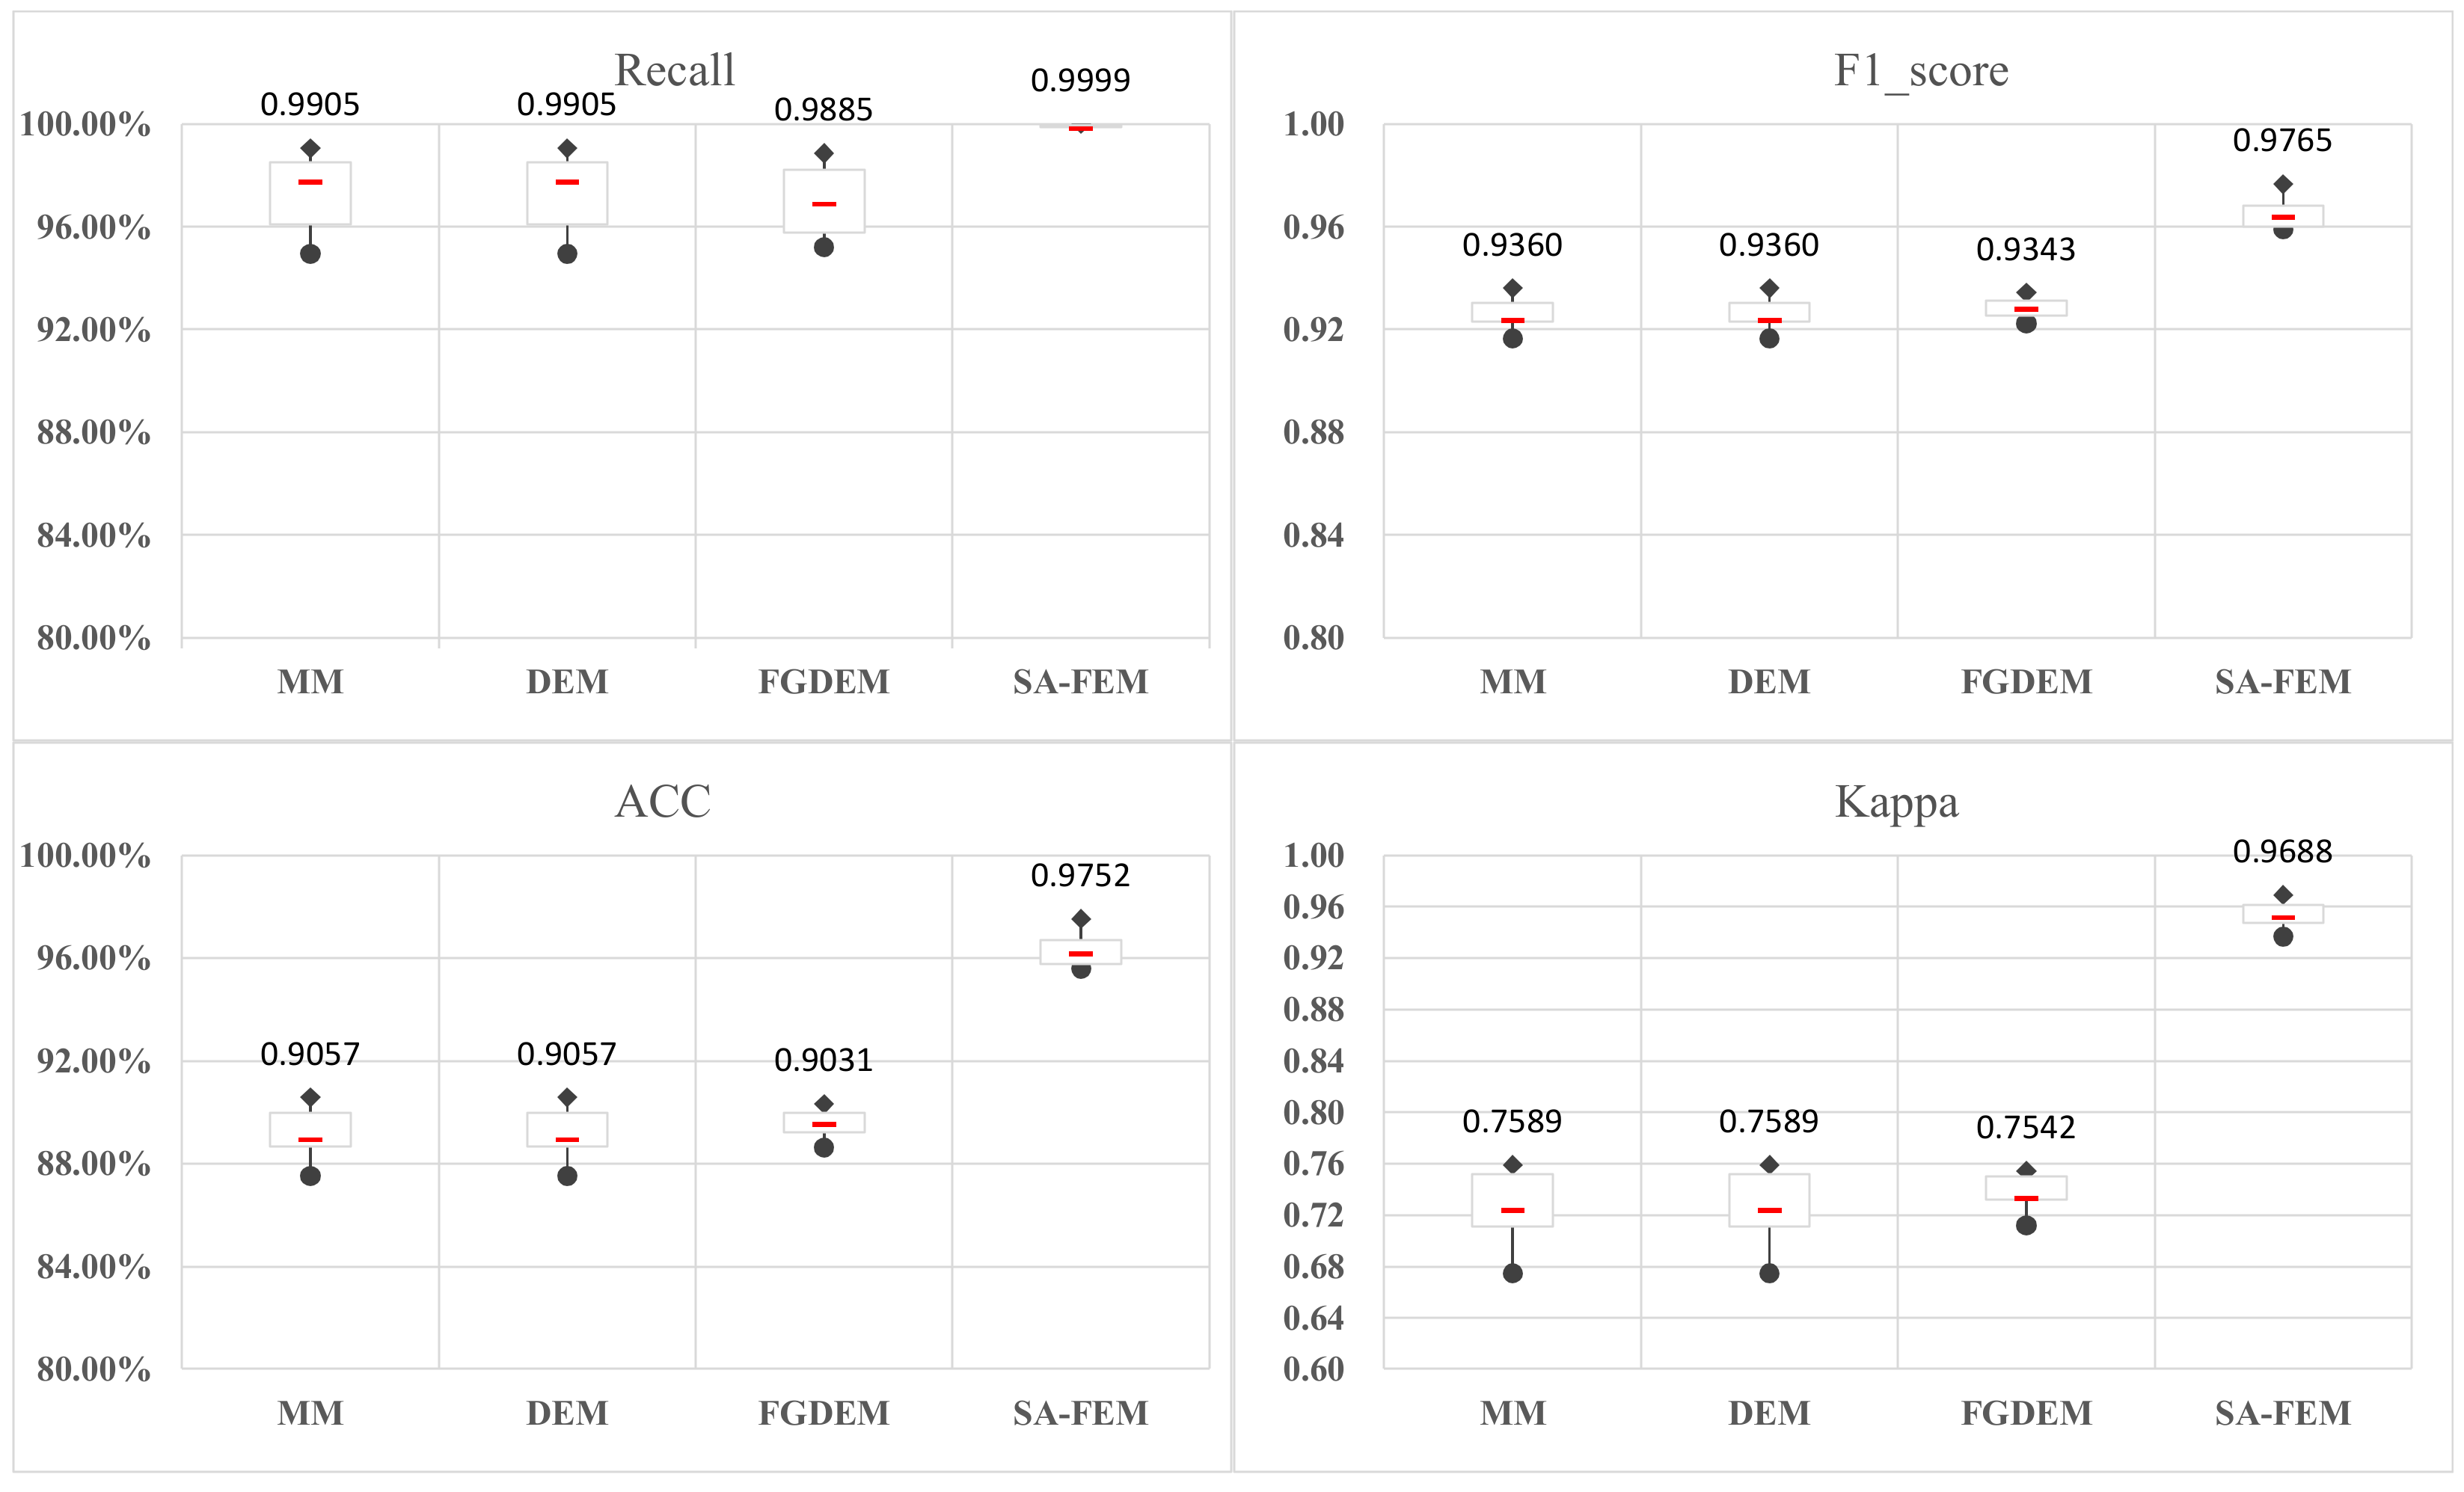
5.1. Validation of SA-FEM
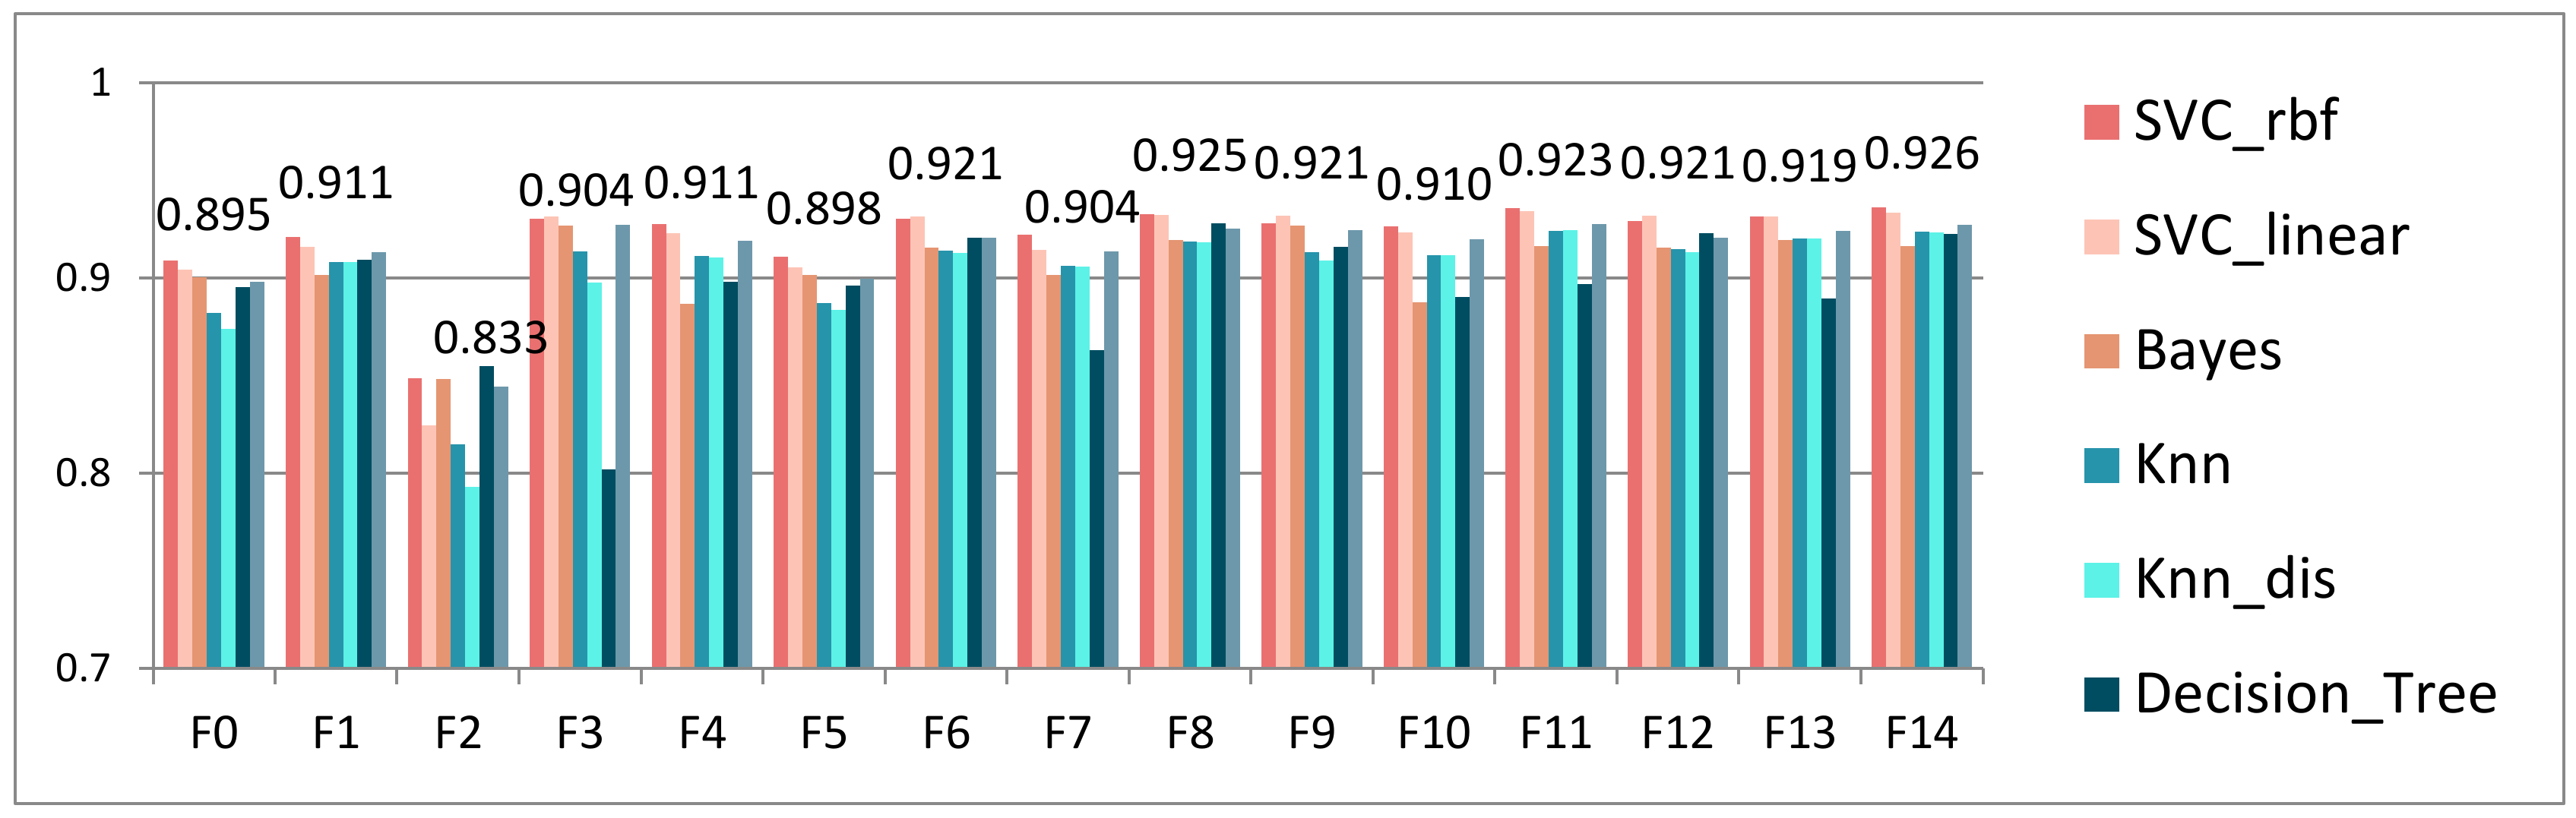
5.2. Overall Evaluation of Wrapper Method with Differential Evolution Algorithm as an Evaluation Function
5.3. Comprehensive Analysis of Different Mutation Strategies
6. Conclusions
Author Contributions
Funding
Institutional Review Board Statement
Informed Consent Statement
Data Availability Statement
Conflicts of Interest
References
- Adedoyin, O.B.; Soykan, E. COVID-19 pandemic and online learning: The challenges and opportunities. Interactive Learn. Environ. 2020, 1–13. Available online: https://www.tandfonline.com/toc/nile20/0/0 (accessed on 18 October 2022). [CrossRef]
- Xiang, L.; Stillwell, J.; Burns, L.; Heppenstall, A. Measuring and assessing regional education inequalities in China under changing policy regimes. Appl. Spat. Anal. Policy 2020, 13, 91–112. [Google Scholar] [CrossRef]
- Feng, W.; Tang, J.; Liu, T.X. Understanding dropouts in MOOCs. In Proceedings of the AAAI Conference on Artificial Intelligence, Honolulu, HI, USA, 27 January–1 February 2019; pp. 517–524. [Google Scholar]
- Marras, M.; Vignoud, J.T.T.; Kaser, T. Can feature predictive power generalize? benchmarking early predictors of student success across flipped and online courses. In Proceedings of the 14th International Conference on Educational Data Mining, Paris, France, 29 June–2 July 2021; pp. 150–160. [Google Scholar]
- He, Y.; Chen, R.; Li, X.; Hao, C.; Liu, S.; Zhang, G.; Jiang, B. Online at-risk student identification using RNN-GRU joint neural networks. Information 2020, 11, 474. [Google Scholar] [CrossRef]
- Hao, J.; Gan, J.; Zhu, L. MOOC performance prediction and personal performance improvement via Bayesian network. Educ. Inf. Technol. 2022, 27, 7303–7326. [Google Scholar] [CrossRef]
- Wang, C. Analysis of students’ behavior in english online education based on data mining. Mob. Inf. Syst. 2021, 2021, 1856690. [Google Scholar] [CrossRef]
- Mai, T.T.; Bezbradica, M.; Crane, M. Learning behaviours data in programming education: Community analysis and outcome prediction with cleaned data. Future Gener. Comput. Syst. 2022, 127, 42–55. [Google Scholar] [CrossRef]
- Fan, Y.; Wang, Q. Prediction of academic performance and risk: A review of literature on predicative indicators in learning analytics. Distance Educ. China 2018, 1, 5–15. [Google Scholar]
- Espinoza, A.M.; Taut, S. Gender and psychological variables as key factors in mathematics learning: A study of seventh graders in Chile. Int. J. Educ. Res. 2020, 103, 101611. [Google Scholar] [CrossRef]
- Erickson, V.L. Data-driven models to predict student performance and improve advising in computer science. In Proceedings of the International Conference on Frontiers in Education: Computer Science and Computer Engineering (FECS), Las Vegas, NV, USA, 29 July–1 August 2019; pp. 3–9. [Google Scholar]
- Zafari, M.; Sadeghi-Niaraki, A.; Choi, S.-M.; Esmaeily, A. A Practical Model for the Evaluation of High School Student Performance Based on Machine Learning. Appl. Sci. 2021, 11, 11534. [Google Scholar] [CrossRef]
- Yu, C.-H.; Wu, J.; Liu, A.-C. Predicting learning outcomes with MOOC clickstreams. Educ. Sci. 2019, 9, 104. [Google Scholar] [CrossRef]
- Loginova, E.; Benoit, D.F. Embedding Navigation Patterns for Student Performance Prediction. In Proceedings of the 14th International Conference on Educational Data Mining, Paris, France, 29 June–2 July 2021; pp. 391–399. [Google Scholar]
- Yoo, J.E.; Rho, M. LMS Log Data Analysis from Fully-Online Flipped Classrooms: An Exploratory Case Study via Regularization. In Proceedings of the 14th International Conference on Educational Data Mining, Paris, France, 29 June–2 July 2021; pp. 793–798. [Google Scholar]
- Zheng, Y.; Gao, Z.; Wang, Y.; Fu, Q. MOOC dropout prediction using FWTS-CNN model based on fused feature weighting and time series. IEEE Access 2020, 8, 225324–225335. [Google Scholar] [CrossRef]
- Wen, Y.; Tian, Y.; Wen, B.; Zhou, Q.; Cai, G.; Liu, S. Consideration of the local correlation of learning behaviors to predict dropouts from MOOCs. Tsinghua Sci. Technol. 2019, 25, 336–347. [Google Scholar] [CrossRef]
- Akram, A.; Fu, C.; Li, Y.; Javed, M.Y.; Lin, R.; Jiang, Y.; Tang, Y. Predicting students’ academic procrastination in blended learning course using homework submission data. IEEE Access 2019, 7, 102487–102498. [Google Scholar] [CrossRef]
- Khan, A.; Ghosh, S.K.; Ghosh, D.; Chattopadhyay, S. Random wheel: An algorithm for early classification of student performance with confidence. Eng. Appl. Artif. Intell. 2021, 102, 104270. [Google Scholar] [CrossRef]
- Abidi, S.M.R.; Zhang, W.; Haidery, S.A.; Rizvi, S.S.; Riaz, R.; Ding, H.; Kwon, S.J. Educational sustainability through big data assimilation to quantify academic procrastination using ensemble classifiers. Sustainability 2020, 12, 6074. [Google Scholar] [CrossRef]
- Hooshyar, D.; Pedaste, M.; Yang, Y. Mining educational data to predict students’ performance through procrastination behavior. Entropy 2019, 22, 12. [Google Scholar] [CrossRef]
- Figueroa-Cañas, J.; Sancho-Vinuesa, T. Early prediction of dropout and final exam performance in an online statistics course. IEEE Rev. Iberoam. Tecnol. Aprendiz. 2020, 15, 86–94. [Google Scholar] [CrossRef]
- Esteban, A.; Romero, C.; Zafra, A. Assignments as Influential Factor to Improve the Prediction of Student Performance in Online Courses. Appl. Sci. 2021, 11, 10145. [Google Scholar] [CrossRef]
- Aydoğdu, Ş. Predicting student final performance using artificial neural networks in online learning environments. Educ. Inf. Technol. 2020, 25, 1913–1927. [Google Scholar] [CrossRef]
- Mubarak, A.A.; Cao, H.; Zhang, W.; Zhang, W. Visual analytics of video-clickstream data and prediction of learners’ performance using deep learning models in MOOCs’ courses. Comput. Appl. Eng. Educ. 2021, 29, 710–732. [Google Scholar] [CrossRef]
- Song, X.; Li, J.; Sun, S.; Yin, H.; Dawson, P.; Doss, R.R.M. SEPN: A sequential engagement based academic performance prediction model. IEEE Intell. Syst. 2020, 36, 46–53. [Google Scholar] [CrossRef]
- Hasan, R.; Palaniappan, S.; Mahmood, S.; Abbas, A.; Sarker, K.U.; Sattar, M.U. Predicting student performance in higher educational institutions using video learning analytics and data mining techniques. Appl. Sci. 2020, 10, 3894. [Google Scholar] [CrossRef]
- Bujang, S.D.A.; Selamat, A.; Ibrahim, R.; Krejcar, O.; Herrera-Viedma, E.; Fujita, H.; Ghani, N.A.M. Multiclass prediction model for student grade prediction using machine learning. IEEE Access 2021, 9, 95608–95621. [Google Scholar] [CrossRef]
- Keser, S.B.; Aghalarova, S. HELA: A novel hybrid ensemble learning algorithm for predicting academic performance of students. Educ. Inf. Technol. 2022, 27, 4521–4552. [Google Scholar] [CrossRef]
- Qiu, F.; Zhang, G.; Sheng, X.; Jiang, L.; Zhu, L.; Xiang, Q.; Jiang, B.; Chen, P.-k. Predicting students’ performance in e-learning using learning process and behaviour data. Sci. Rep. 2022, 12, 453. [Google Scholar] [CrossRef] [PubMed]
- Yueya, S. Characteristics of online learning behavior of Distance learners in the Open University. China Educ. Technol. 2015, 08, 64–71. [Google Scholar]
- Yu, H.; Harper, S.; Vigo, M. Modeling micro-interactions in self-regulated learning: A data-driven methodology. Int. J. Hum.-Comput. Stud. 2021, 151, 102625. [Google Scholar] [CrossRef]
- Parouha, R.P.; Verma, P. A systematic overview of developments in differential evolution and particle swarm optimization with their advanced suggestion. Appl. Intell. 2022, 52, 10448–10492. [Google Scholar] [CrossRef]
- Kuzilek, J.; Hlosta, M.; Zdrahal, Z. Open university learning analytics dataset. Sci. Data 2017, 4, 170171. [Google Scholar] [CrossRef]
- Ahmad, M.F.; Isa, N.A.M.; Lim, W.H.; Ang, K.M. Differential evolution: A recent review based on state-of-the-art works. Alex. Eng. J. 2021, 61, 3831–3872. [Google Scholar] [CrossRef]
- Onan, A. Sentiment analysis on massive open online course evaluations: A text mining and deep learning approach. Comput. Appl. Eng. Educ. 2021, 29, 572–589. [Google Scholar] [CrossRef]


| Behavior Sets | Behavior Codes | E-Learning Behavior | Behavior Interpretation | |
|---|---|---|---|---|
| 1 | LPB | HP | homepage | Access the homepage |
| 2 | PG | page | Enter the course interface | |
| 3 | SP | subpage | Enter the course subinterface | |
| 4 | KAB | DA | dataplus | Supplementary materials |
| 5 | FD | folder | Open the folder | |
| 6 | HA | htmlactivity | Web activity | |
| 7 | CT | oucontent | Download platform resources | |
| 8 | WK | ouwiki | Search on Wikipedia | |
| 9 | RS | resource | Search platform resources | |
| 10 | UR | url | Access the link | |
| 11 | DU | dualpane | Access to double Windows | |
| 12 | GS | glossary | Access to the glossary | |
| 13 | ILB | FU | forumng | BBS discussion |
| 14 | CA | oucollaborate | Collaborative communication | |
| 15 | EM | ouelluminate | Simulation Seminar | |
| 16 | LCB | QN | questionnaire | Participate in questionnaire feedback |
| 17 | QZ | quiz | Quiz | |
| 18 | RP | repeatactivity | Repeat activities |
| Input Indicator Number | Behavior Set Number |
|---|---|
| F0 | LPB |
| F1 | KAB |
| F2 | ILB |
| F3 | LCB |
| F4 | LPB, KAB |
| F5 | LPB, ILB |
| F6 | LPB, LCB |
| F7 | KAB, ILB |
| F8 | KAB, LCB |
| F9 | ILB, LCB |
| F10 | LPB, KAB, ILB |
| F11 | LPB, KAB, LCB |
| F12 | LPB, ILB, LCB |
| F13 | KAB, ILB, LCB |
| F14 | LPB, KAB, ILB, LCB |
| Method | Precision | Recall | Accuracy | F1 Score | Kappa | Feature Space | Behavior Classes |
|---|---|---|---|---|---|---|---|
| SVC_rbf | 0.886 | 0.989 | 0.904 | 0.935 | 0.753 | HP, PG, SP, DA, FD, HA, CT, WK, RS, UR, DU, GS, FU, CA, EM, QN, QZ, RP | LPB, KAB, ILB, LCB |
| SVC linear | 0.895 | 0.974 | 0.903 | 0.933 | 0.755 | ||
| Bayes | 0.858 | 0.983 | 0.875 | 0.916 | 0.674 | ||
| Knn | 0.890 | 0.958 | 0.888 | 0.922 | 0.721 | ||
| Knn_dis | 0.890 | 0.958 | 0.888 | 0.922 | 0.721 | ||
| Decision Tree | 0.858 | 0.976 | 0.870 | 0.913 | 0.661 | ||
| Softmax | 0.906 | 0.946 | 0.895 | 0.926 | 0.743 |
| Method | Precision | Recall | Accuracy | F1 Score | Kappa | Feature Space | Behavior Classes |
|---|---|---|---|---|---|---|---|
| SVC_rbf | 0.902 | 0.986 | 0.914 | 0.942 | 0.774 | CT, SP, HP, QZ, RS, PG, QN, EM, DU, DA, HA, FD, RP | LPB(part), KAB(part), ILB(part), LCB |
| SVC linear | 0.909 | 0.973 | 0.911 | 0.940 | 0.771 | ||
| Bayes | 0.875 | 0.982 | 0.887 | 0.926 | 0.698 | ||
| Knn | 0.904 | 0.953 | 0.894 | 0.928 | 0.731 | ||
| Knn_dis | 0.904 | 0.953 | 0.894 | 0.928 | 0.731 | ||
| Decision Tree | 0.877 | 0.970 | 0.882 | 0.921 | 0.687 | ||
| Softmax | 0.921 | 0.944 | 0.902 | 0.932 | 0.757 |
| Method | Precision | Recall | Accuracy | F1 Score | Kappa | Feature Space | Behavior Classes |
|---|---|---|---|---|---|---|---|
| SVC_rbf | 0.960 | 1.000 | 0.962 | 0.964 | 0.951 | DA, FD, GS, FU, CA, QN, QZ, RP | KAB(part) ILB(part) LCB |
| SVC linear | 0.956 | 1.000 | 0.958 | 0.960 | 0.945 | ||
| Bayes | 0.974 | 1.000 | 0.975 | 0.977 | 0.969 | ||
| Knn | 0.970 | 0.998 | 0.970 | 0.971 | 0.964 | ||
| Knn_dis | 0.960 | 0.996 | 0.958 | 0.959 | 0.950 | ||
| Decision Tree | 0.953 | 1.000 | 0.956 | 0.960 | 0.937 | ||
| Softmax | 0.963 | 1.000 | 0.964 | 0.965 | 0.959 |
| Precision | Recall | Accuracy | F1_Score | Kappa | |
|---|---|---|---|---|---|
| 1 | 0.891 | 0.969 | 0.896 | 0.928 | 0.738 |
| 2 | 0.888 | 0.975 | 0.896 | 0.929 | 0.737 |
| 3 | 0.891 | 0.972 | 0.897 | 0.929 | 0.742 |
| 4 | 0.888 | 0.973 | 0.896 | 0.929 | 0.737 |
| 5 | 0.892 | 0.971 | 0.897 | 0.929 | 0.743 |
| 6 | 0.891 | 0.970 | 0.896 | 0.929 | 0.740 |
| 7 | 0.890 | 0.972 | 0.897 | 0.929 | 0.740 |
| 8 | 0.889 | 0.971 | 0.895 | 0.928 | 0.736 |
| 9 | 0.890 | 0.971 | 0.896 | 0.929 | 0.739 |
| 10 | 0.890 | 0.971 | 0.896 | 0.929 | 0.739 |
| Var |
| Precision | Recall | Accuracy | F1_Score | Kappa | |
|---|---|---|---|---|---|
| 1 | 0.9599 | 0.9990 | 0.9603 | 0.9618 | 0.9524 |
| 2 | 0.9666 | 0.9992 | 0.9671 | 0.9685 | 0.9599 |
| 3 | 0.9714 | 0.9992 | 0.9723 | 0.9742 | 0.9626 |
| 4 | 0.9595 | 0.9983 | 0.9598 | 0.9622 | 0.9478 |
| 5 | 0.9590 | 0.9750 | 0.9423 | 0.9510 | 0.8985 |
| 6 | 0.9657 | 0.9986 | 0.9677 | 0.9717 | 0.9469 |
| 7 | 0.9568 | 0.9992 | 0.9576 | 0.9593 | 0.9491 |
| 8 | 0.9577 | 0.9781 | 0.9547 | 0.9519 | 0.9028 |
| 9 | 0.9596 | 0.9994 | 0.9609 | 0.9629 | 0.9508 |
| 10 | 0.9686 | 0.9975 | 0.9681 | 0.9704 | 0.9563 |
| avg | 0.9625 | 0.9944 | 0.9611 | 0.9634 | 0.9427 |
| Var | 0.000008 | 0.000089 | 0.000068 | 0.00003 | 0.000484 |
| Accuracy | |
|---|---|
| He | 80.00% |
| Zheng | 87% |
| Aurora | 90.37% (avg) |
| Naif | 95.23% |
| Qiu | 95.4% (avg) |
| Ours | 95.80% |
Publisher’s Note: MDPI stays neutral with regard to jurisdictional claims in published maps and institutional affiliations. |
© 2022 by the authors. Licensee MDPI, Basel, Switzerland. This article is an open access article distributed under the terms and conditions of the Creative Commons Attribution (CC BY) license (https://creativecommons.org/licenses/by/4.0/).
Share and Cite
Ye, M.; Sheng, X.; Lu, Y.; Zhang, G.; Chen, H.; Jiang, B.; Zou, S.; Dai, L. SA-FEM: Combined Feature Selection and Feature Fusion for Students’ Performance Prediction. Sensors 2022, 22, 8838. https://doi.org/10.3390/s22228838
Ye M, Sheng X, Lu Y, Zhang G, Chen H, Jiang B, Zou S, Dai L. SA-FEM: Combined Feature Selection and Feature Fusion for Students’ Performance Prediction. Sensors. 2022; 22(22):8838. https://doi.org/10.3390/s22228838
Chicago/Turabian StyleYe, Mingtao, Xin Sheng, Yanjie Lu, Guodao Zhang, Huiling Chen, Bo Jiang, Senhao Zou, and Liting Dai. 2022. "SA-FEM: Combined Feature Selection and Feature Fusion for Students’ Performance Prediction" Sensors 22, no. 22: 8838. https://doi.org/10.3390/s22228838
APA StyleYe, M., Sheng, X., Lu, Y., Zhang, G., Chen, H., Jiang, B., Zou, S., & Dai, L. (2022). SA-FEM: Combined Feature Selection and Feature Fusion for Students’ Performance Prediction. Sensors, 22(22), 8838. https://doi.org/10.3390/s22228838