
Predicting Axial Impairment in Parkinson’s Disease through a Single Inertial Sensor

 ,
,  ,
,  ,
,  ,
,  and
and 
Abstract
:1. Introduction
2. Materials and Methods
2.1. Subjects
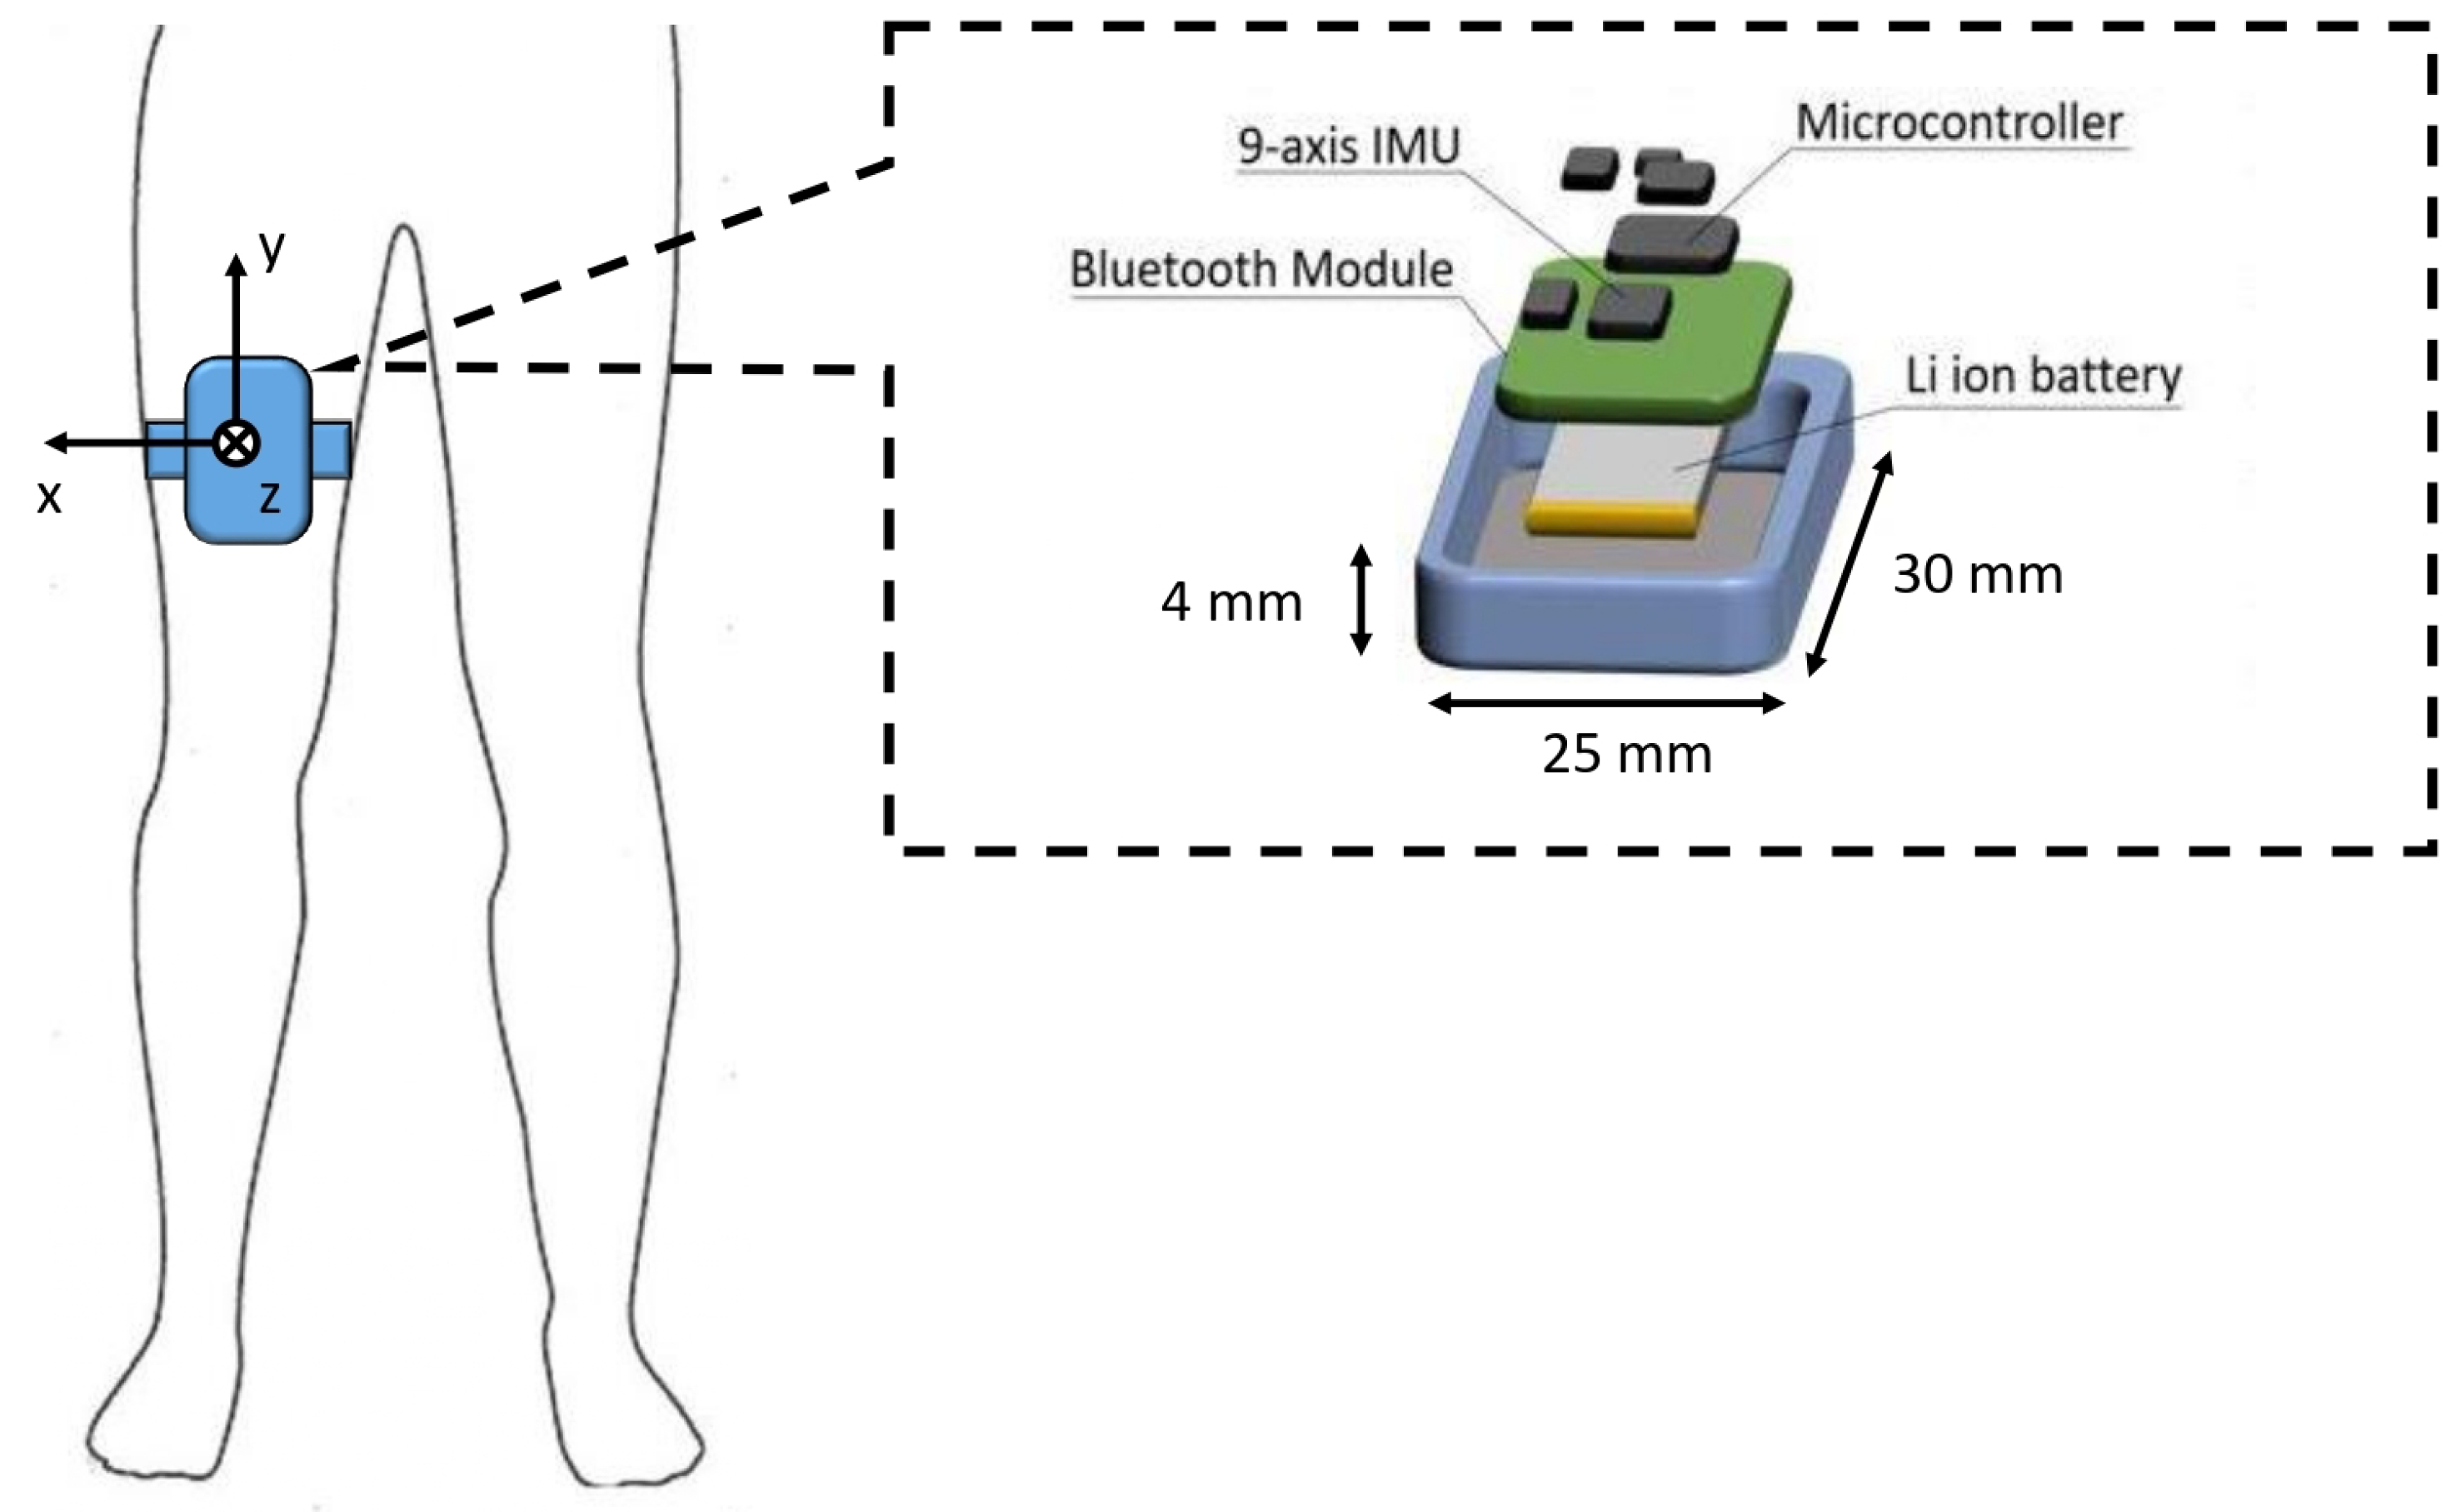
2.2. Experimental Protocol and Data Acquisition
2.3. Preprocessing
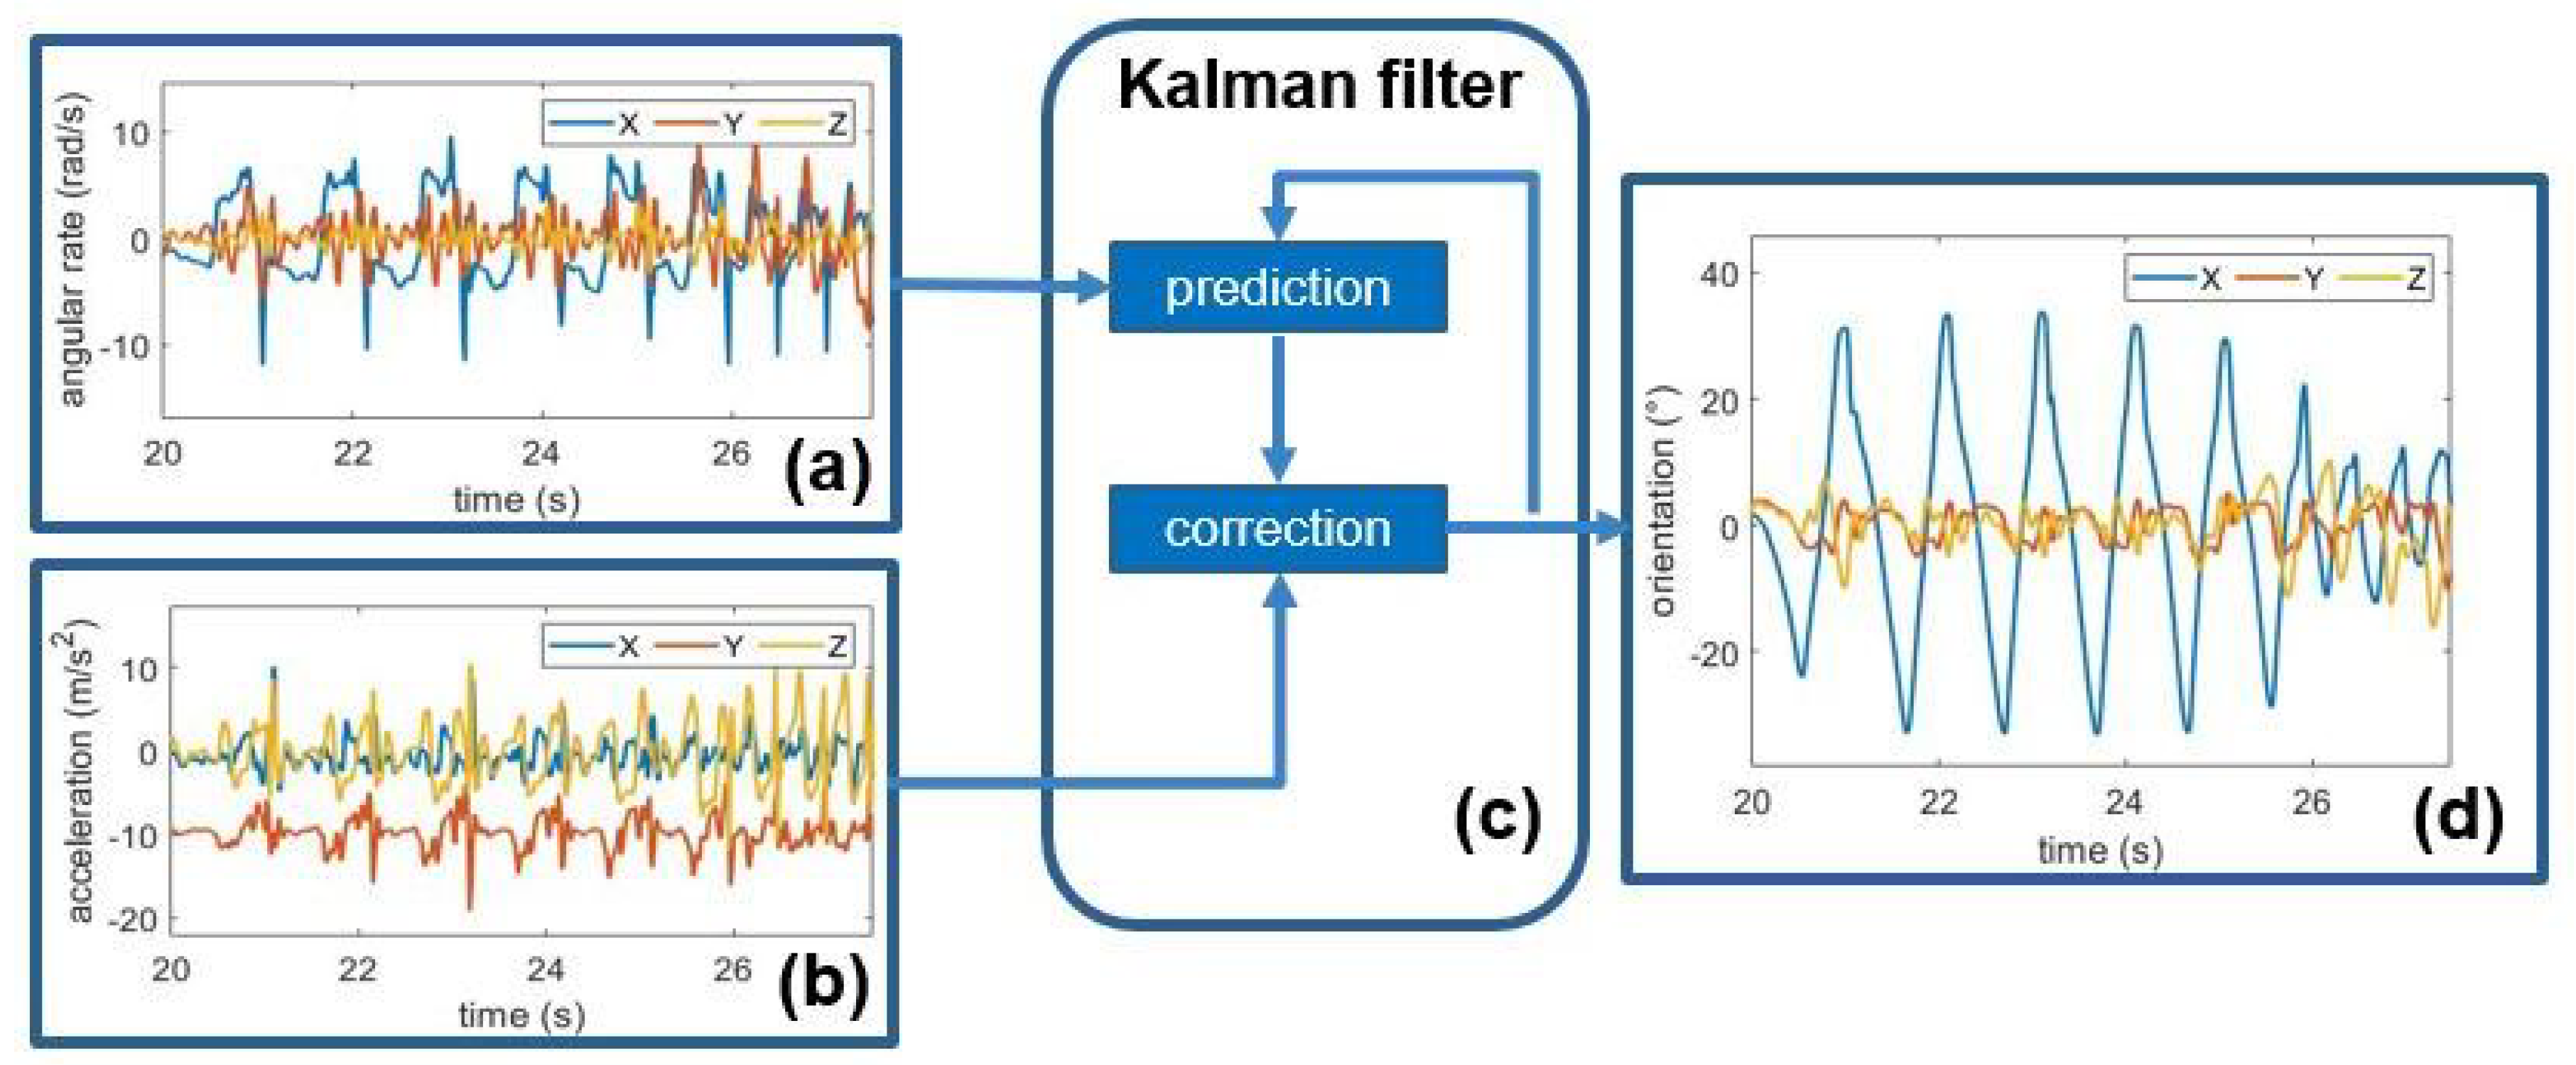
2.3.1. Orientation Estimation
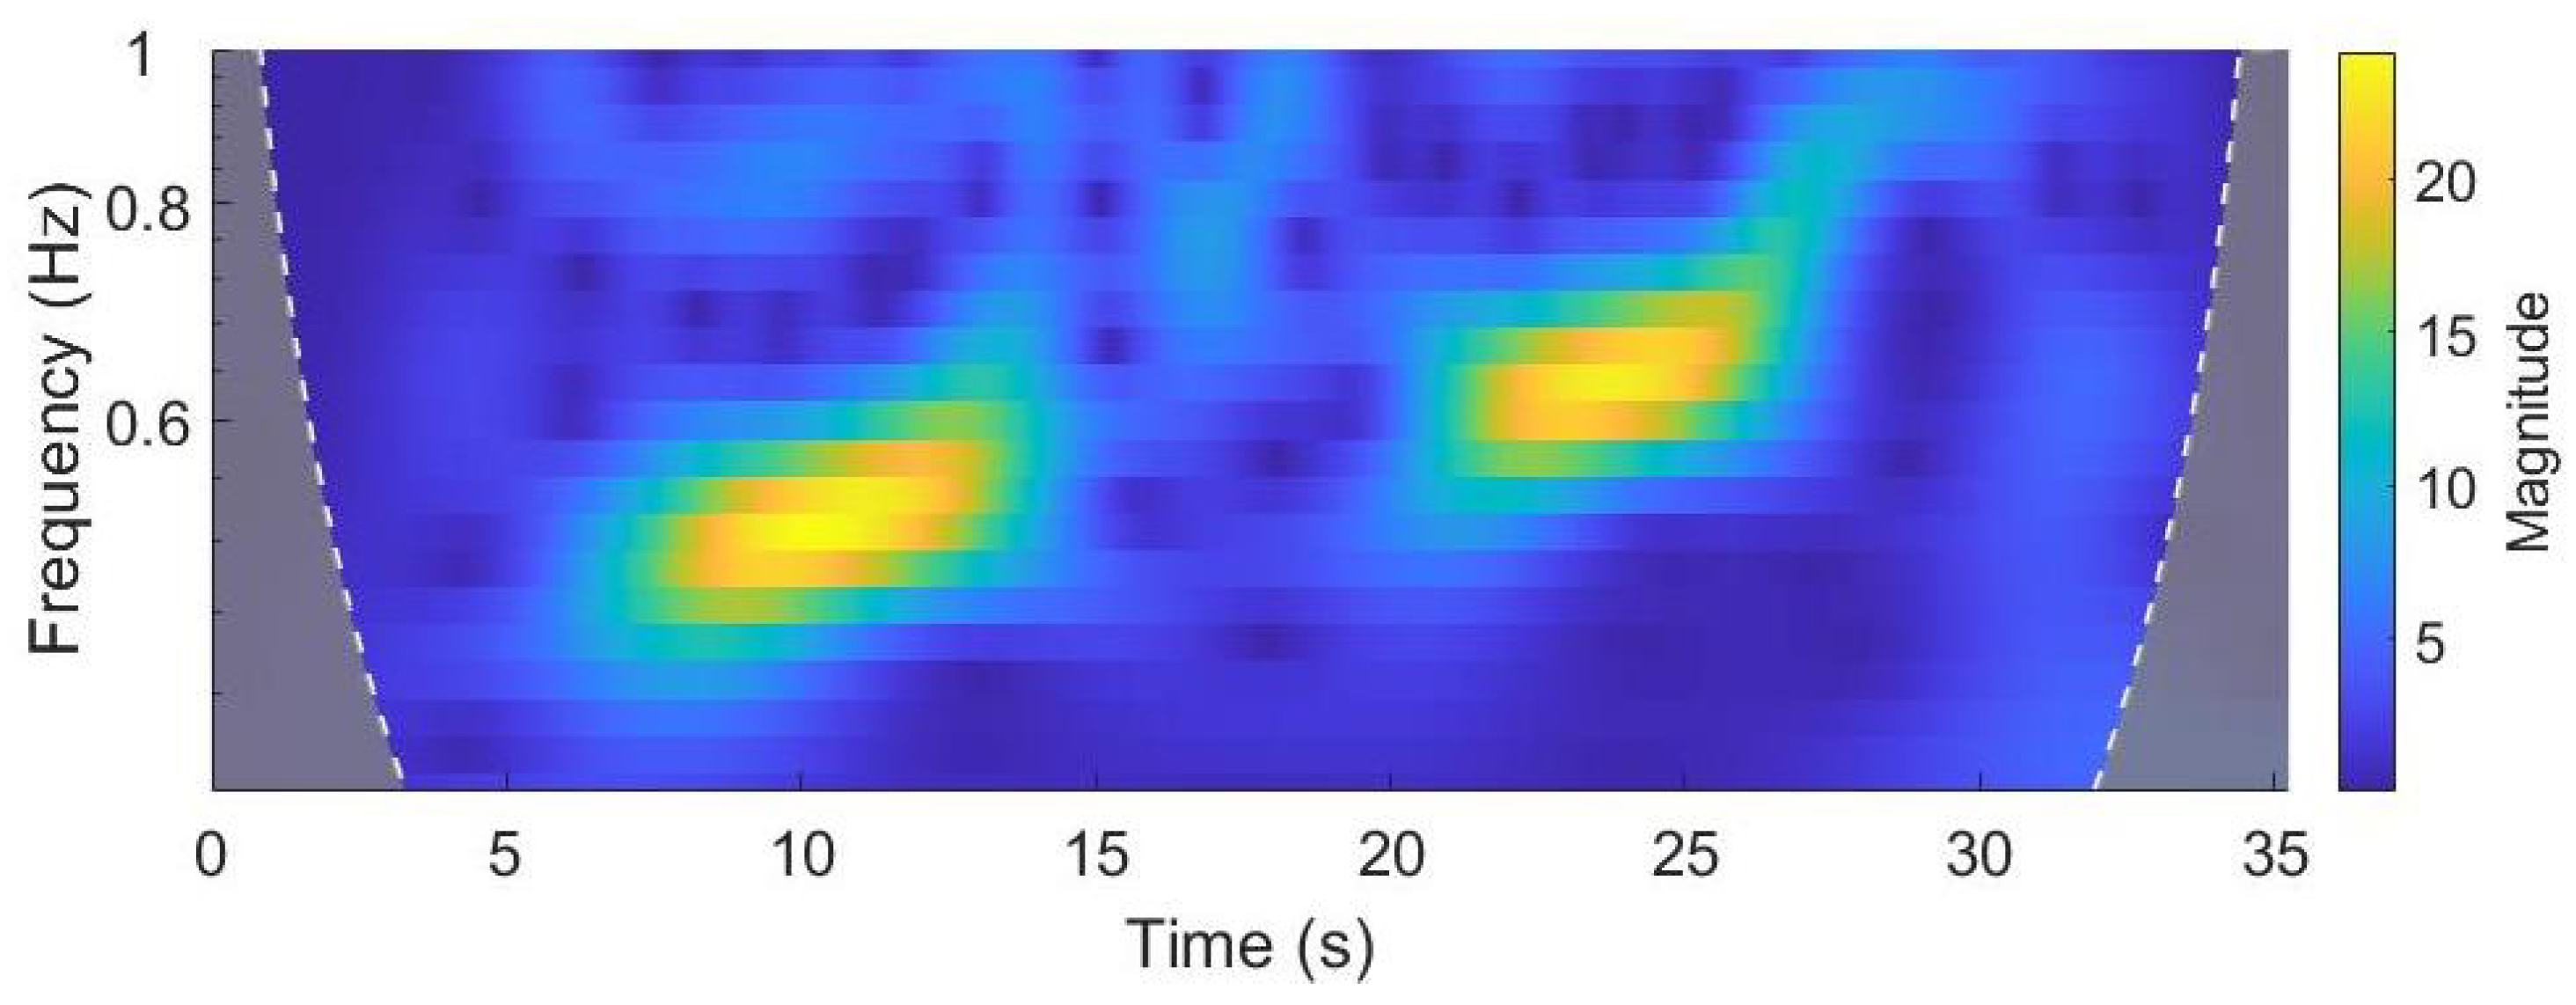
2.3.2. Walking Bouts Detection
2.3.3. Segmentation and Feature Extraction
2.4. PIGD Prediction
2.4.1. PIGD Score Regression
| Algorithm 1 Algorithm for model optimization, validation and test performance evaluation | |
| procedure optimizedModel, performance | ▹ |
| for to N do | ▹ Perform N times test procedure |
| data from all subjects except for ith | ▹ |
| data from ith subject | ▹ |
| for do | ▹ tune kernel function |
| for do | ▹ tune kernel scale |
| for do | ▹ tune cost parameter |
| for to do | ▹ Perform times validation procedure |
| data from except for jth subject | ▹ |
| data from jth subject | ▹ |
| ▹ train model | |
| ▹ predict | |
| end for | |
| ▹ | |
| end for | |
| end for | |
| end for | |
| ▹ | |
| model() | |
| predict()) | ▹ prediction on test set |
| end for | |
| [r,RMSE,MAE]()] | ▹ test performance |
| return | ▹ |
| end procedure | |
2.4.2. The Effect of L-DOPA
2.4.3. The Effect of Freezing of Gait
3. Results
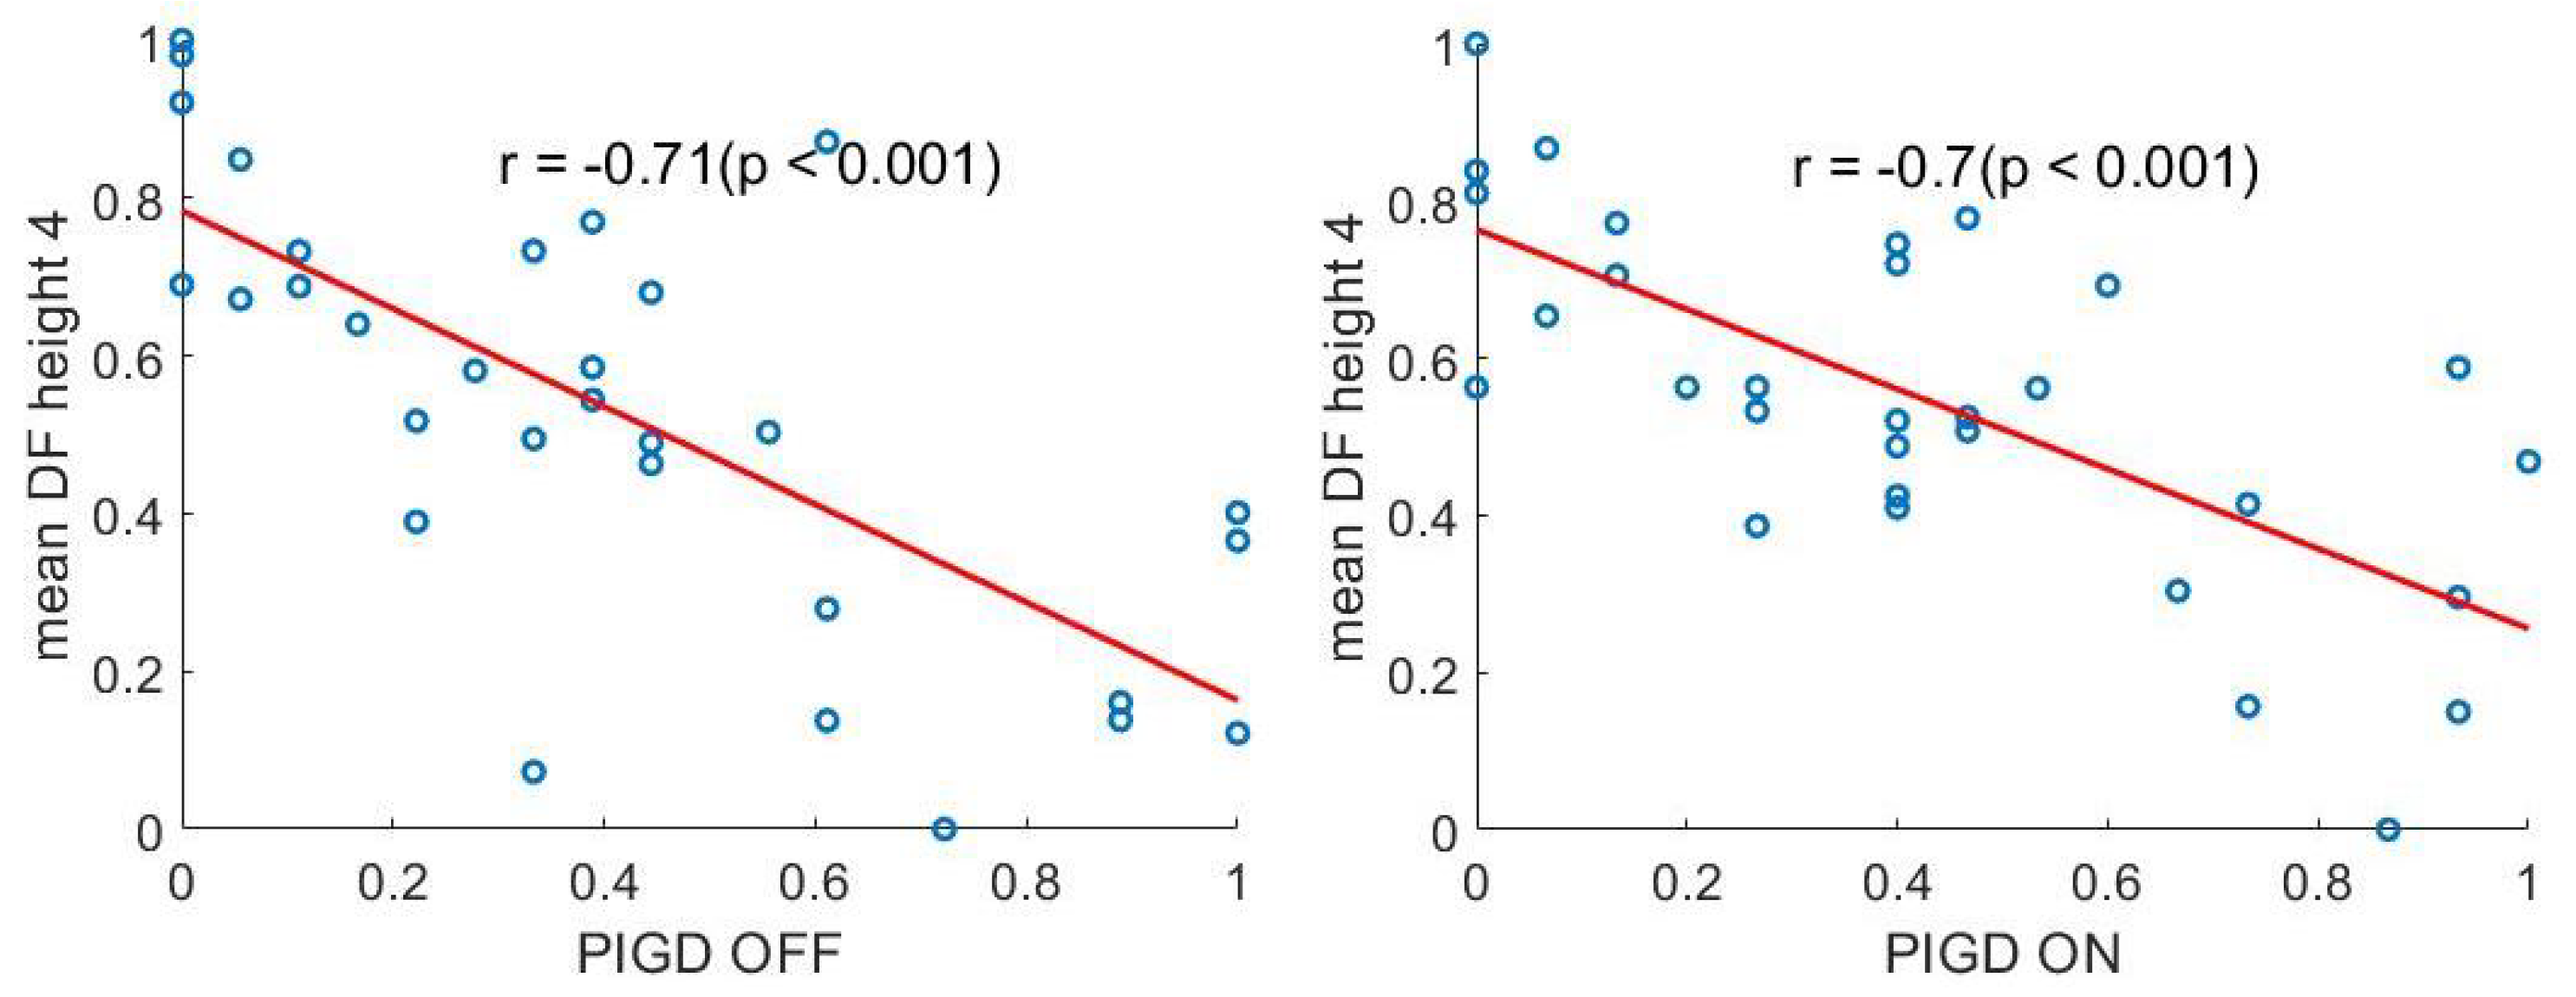
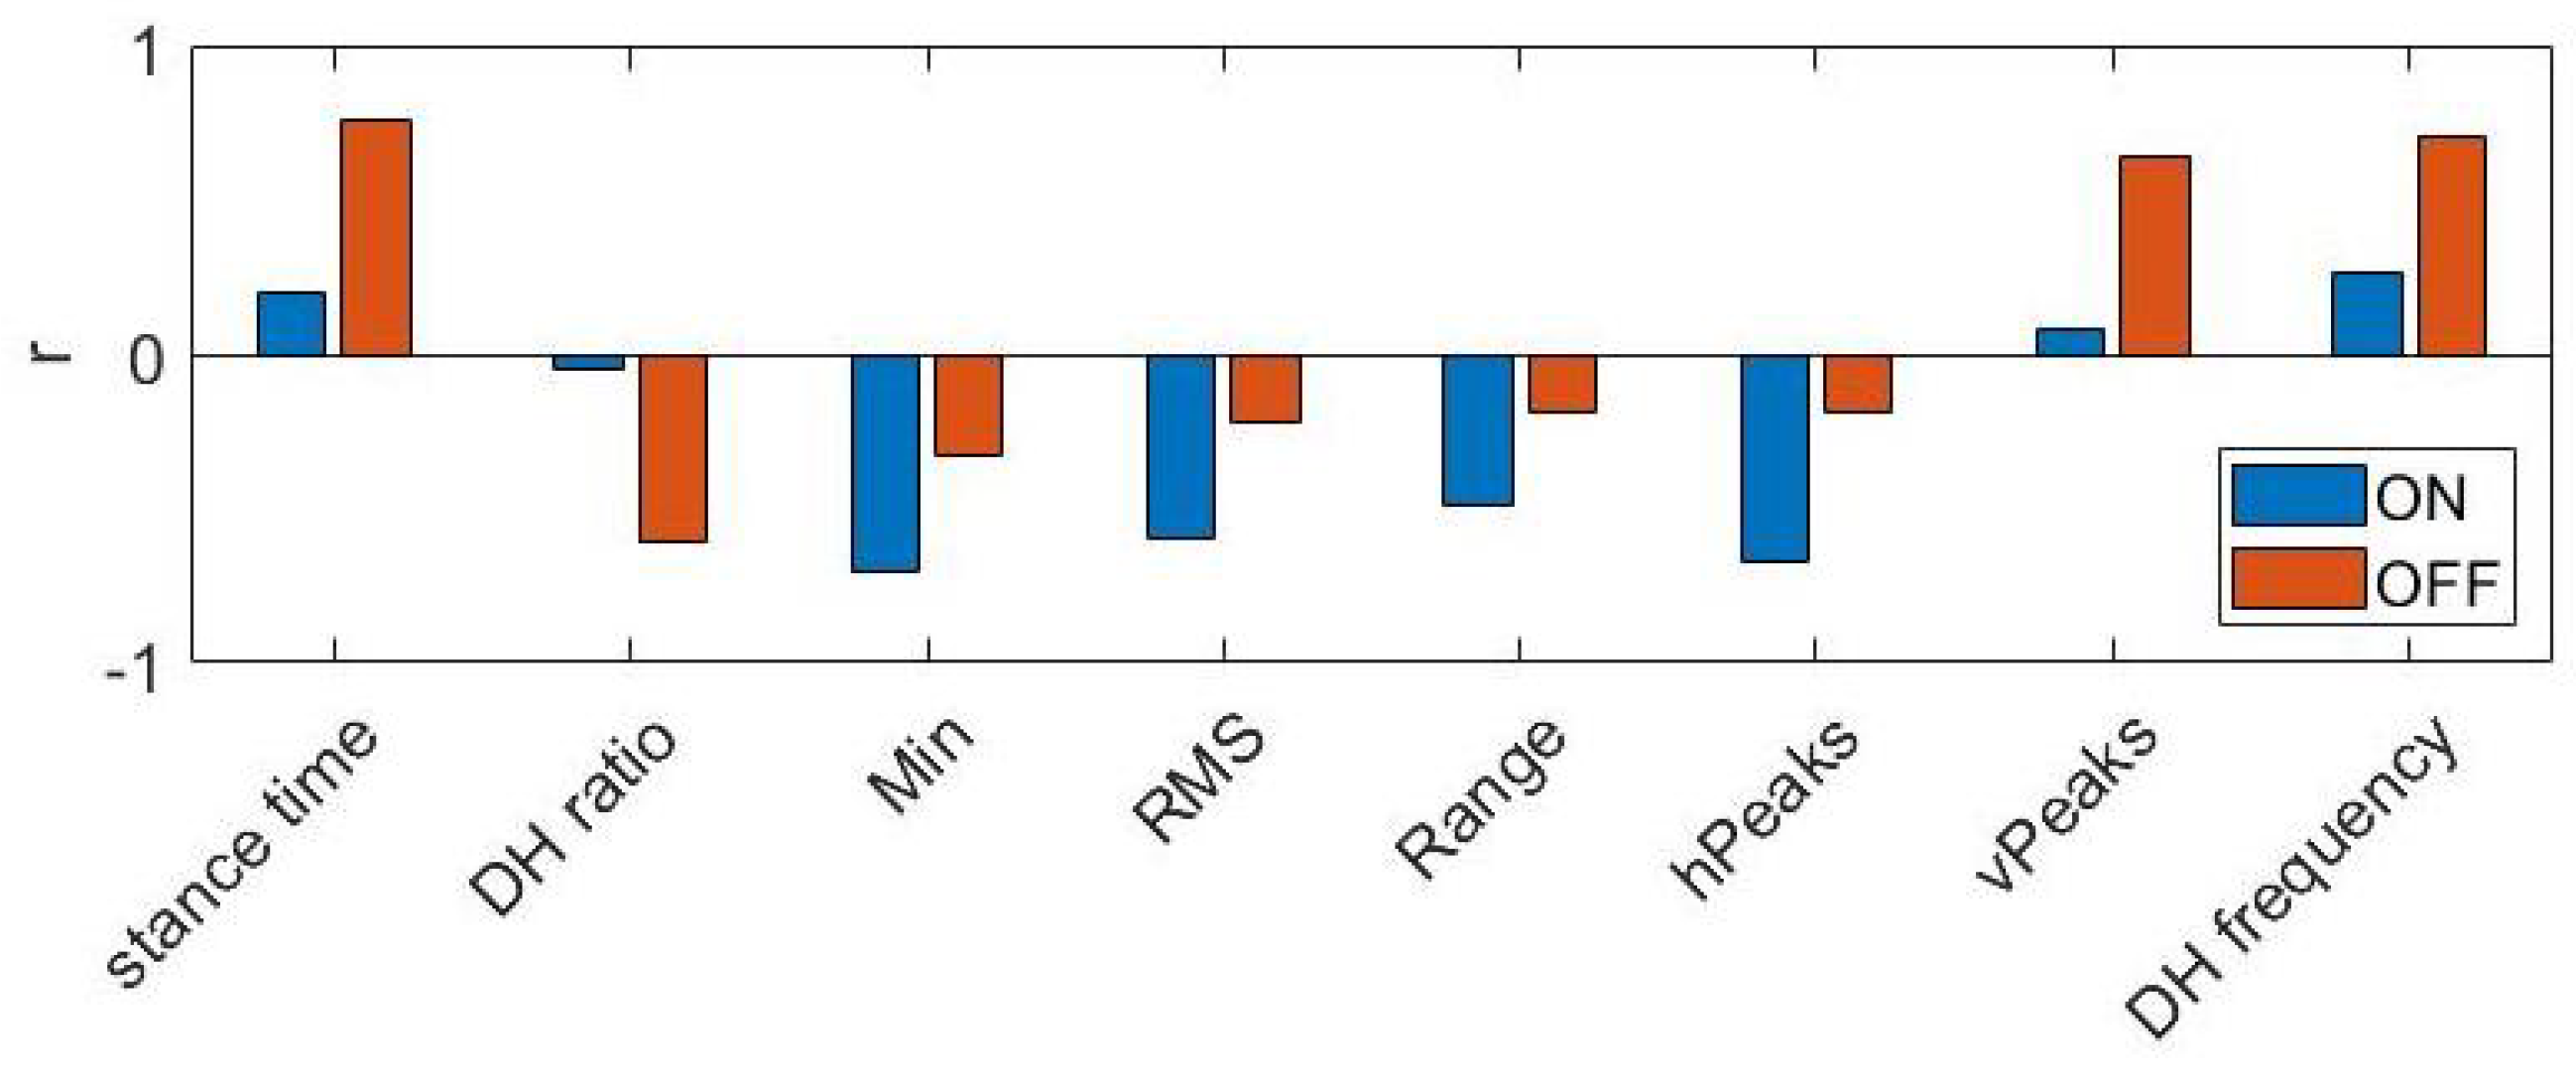
3.1. Clinical-Behavioural Correlations
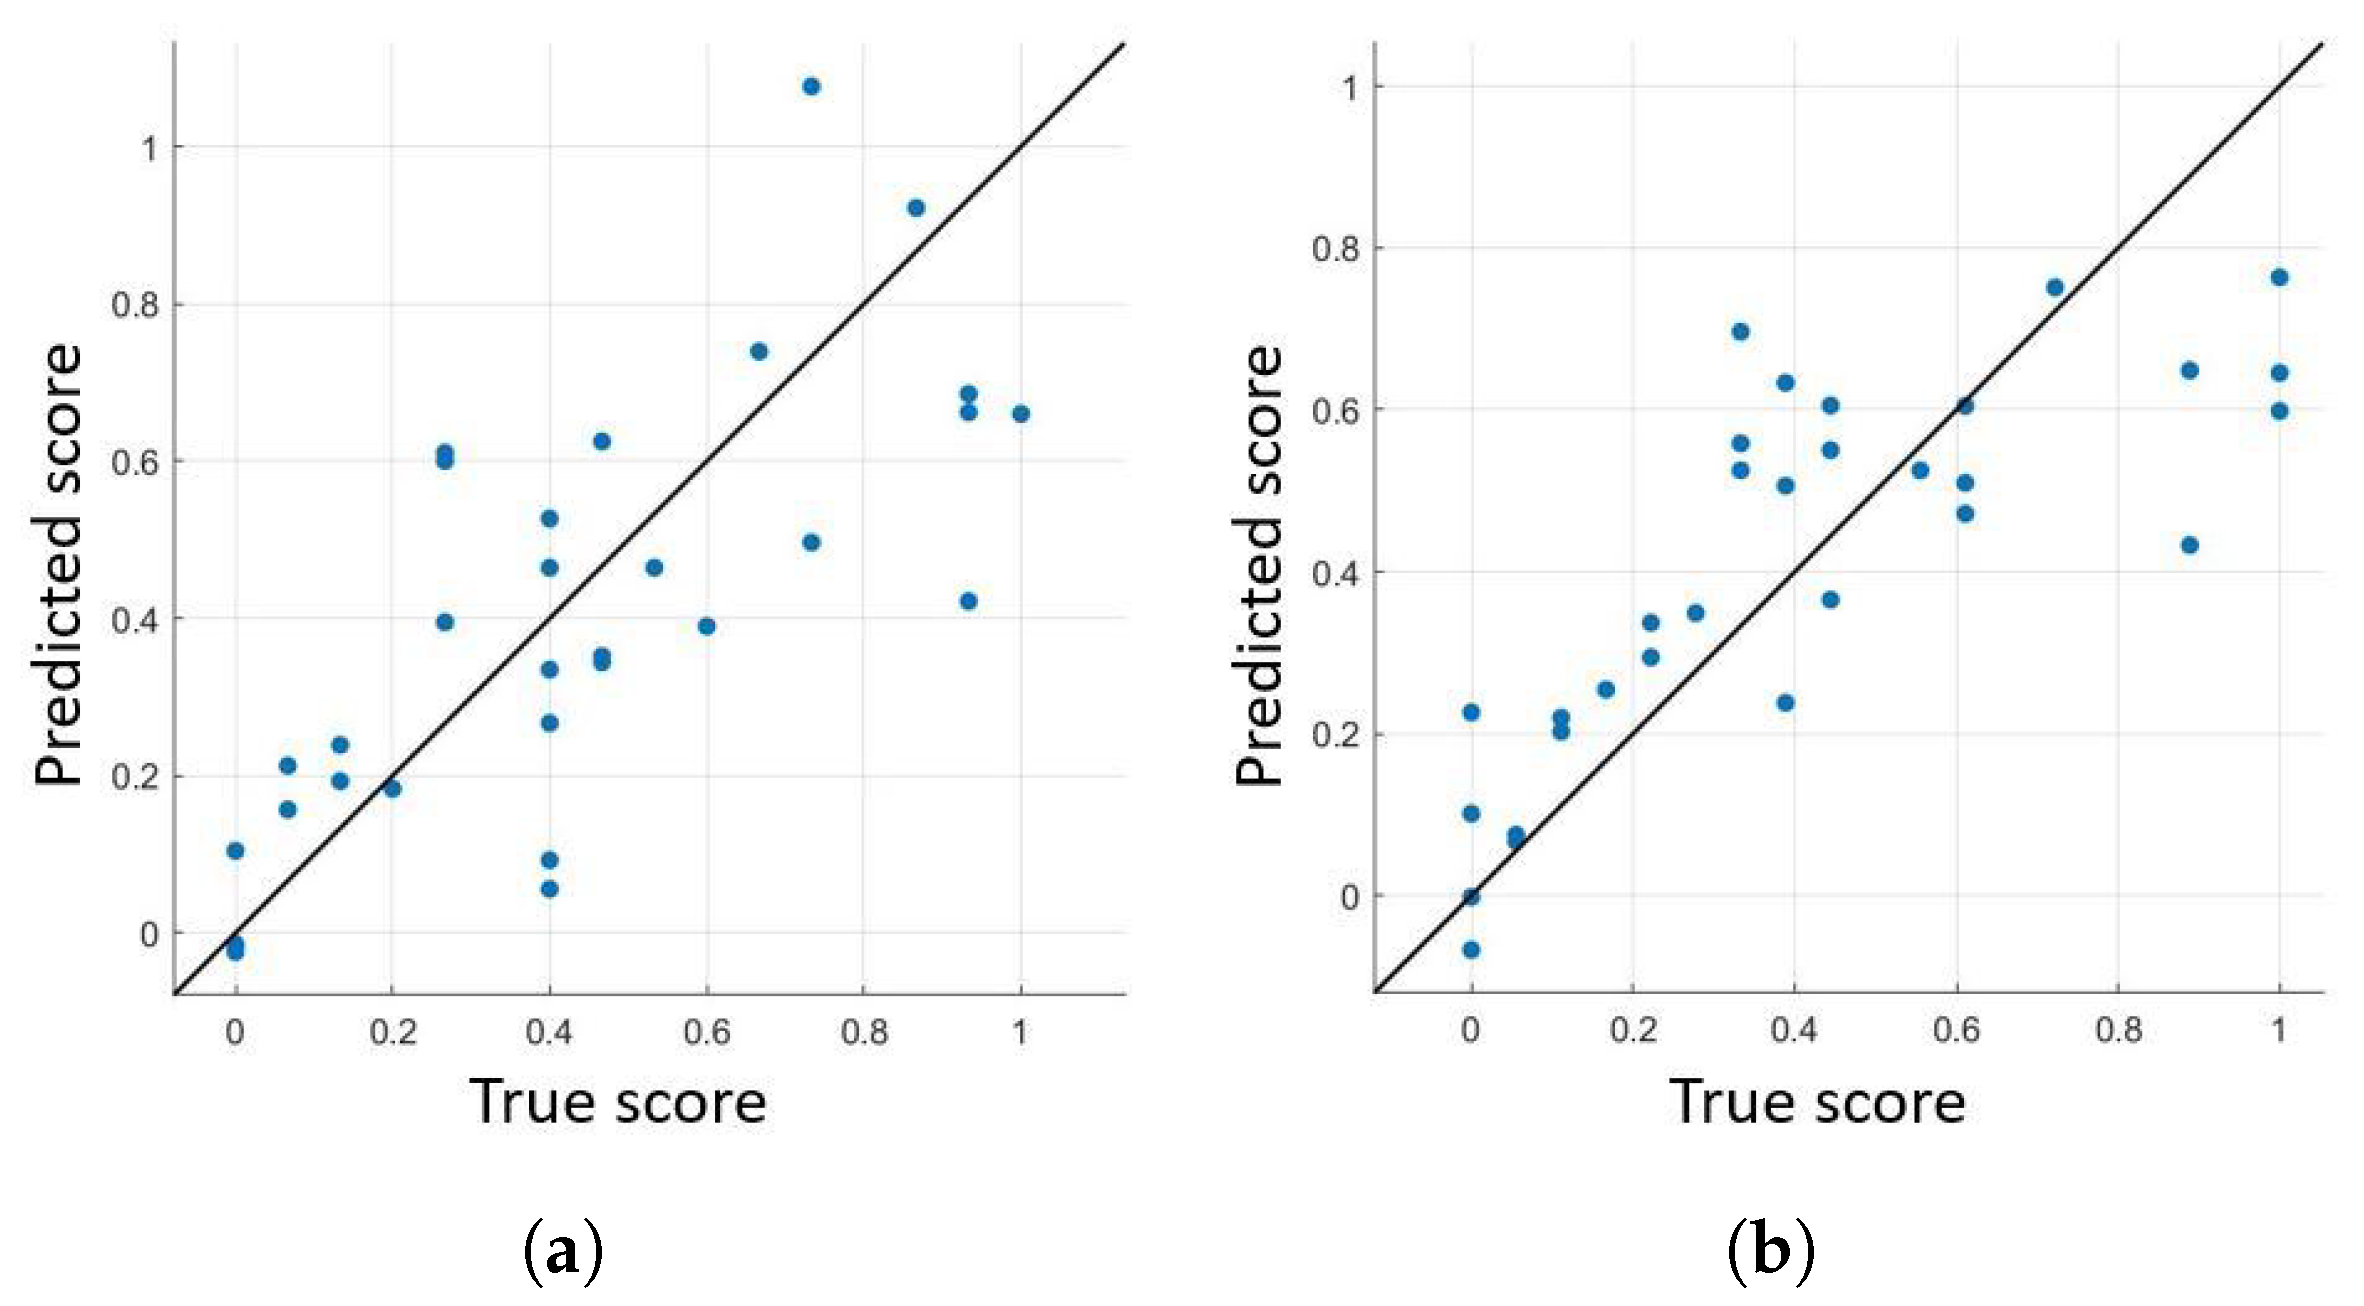
3.2. PIGD Score Regression
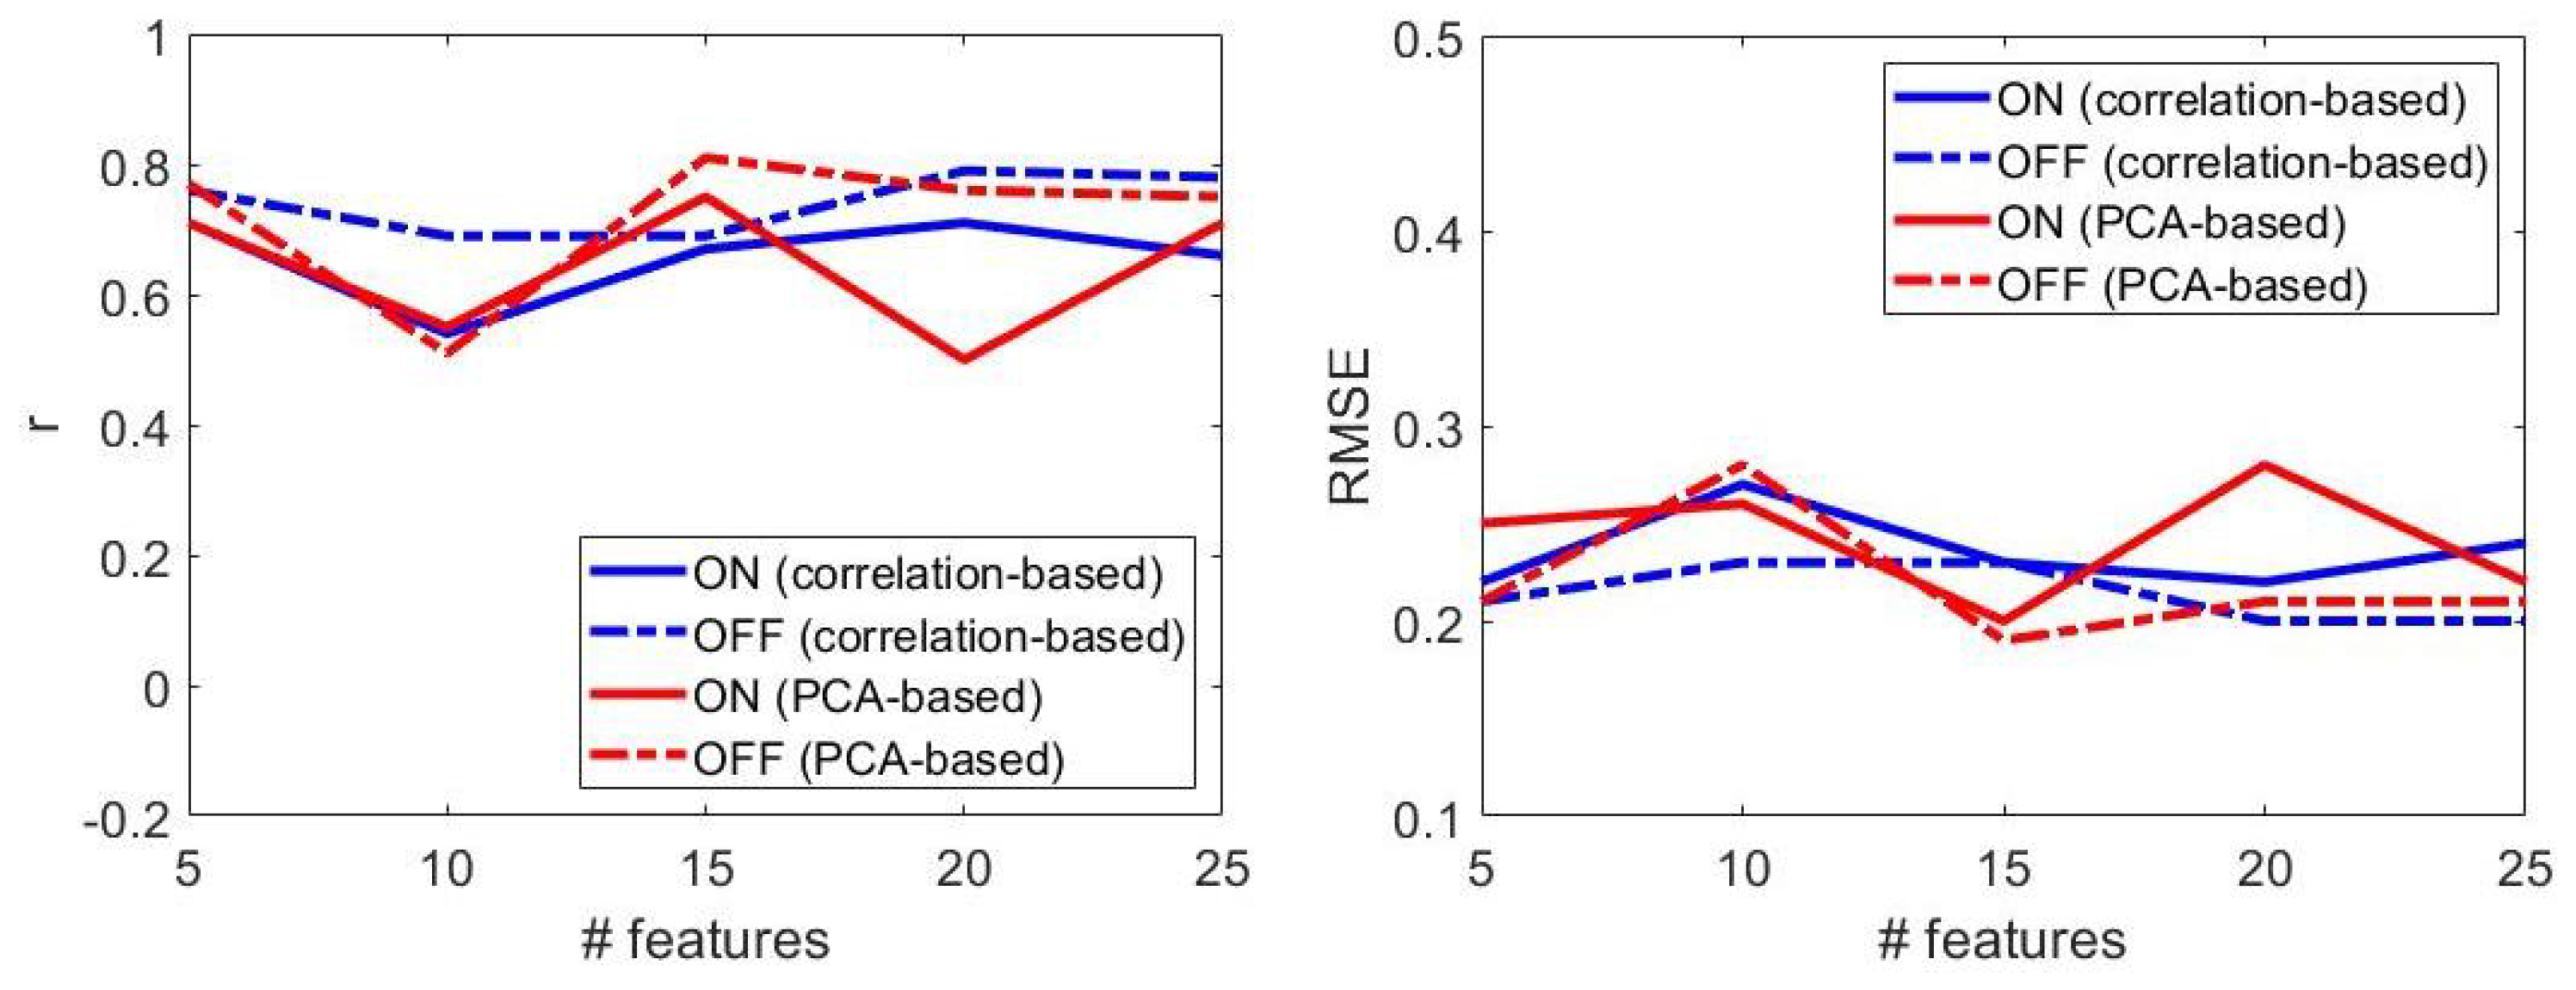
3.3. The Effect of L-DOPA
- Model: SVR with linear kernel is selected in 85% of cases; top performances were obtained with linear kernel and small values of box-constraint parameter (i.e., <0.009).
- Number of features: increasing the feature set size did not ensure progressively better performances (Figure 7). Best results were obtained with n = 15 features, both for patients OFF and ON therapy.
- Dimensionality reduction: for larger feature set size (i.e., # features > 15), PCA-based dimensionality reduction always implied better results, compared to those attained with correlation-based feature selection (Figure 7). PCA-based dimensionality reduction method led to the best results both for patients OFF and ON therapy.
- Performance: regression models provided better performances in patients OFF than those ON therapy.
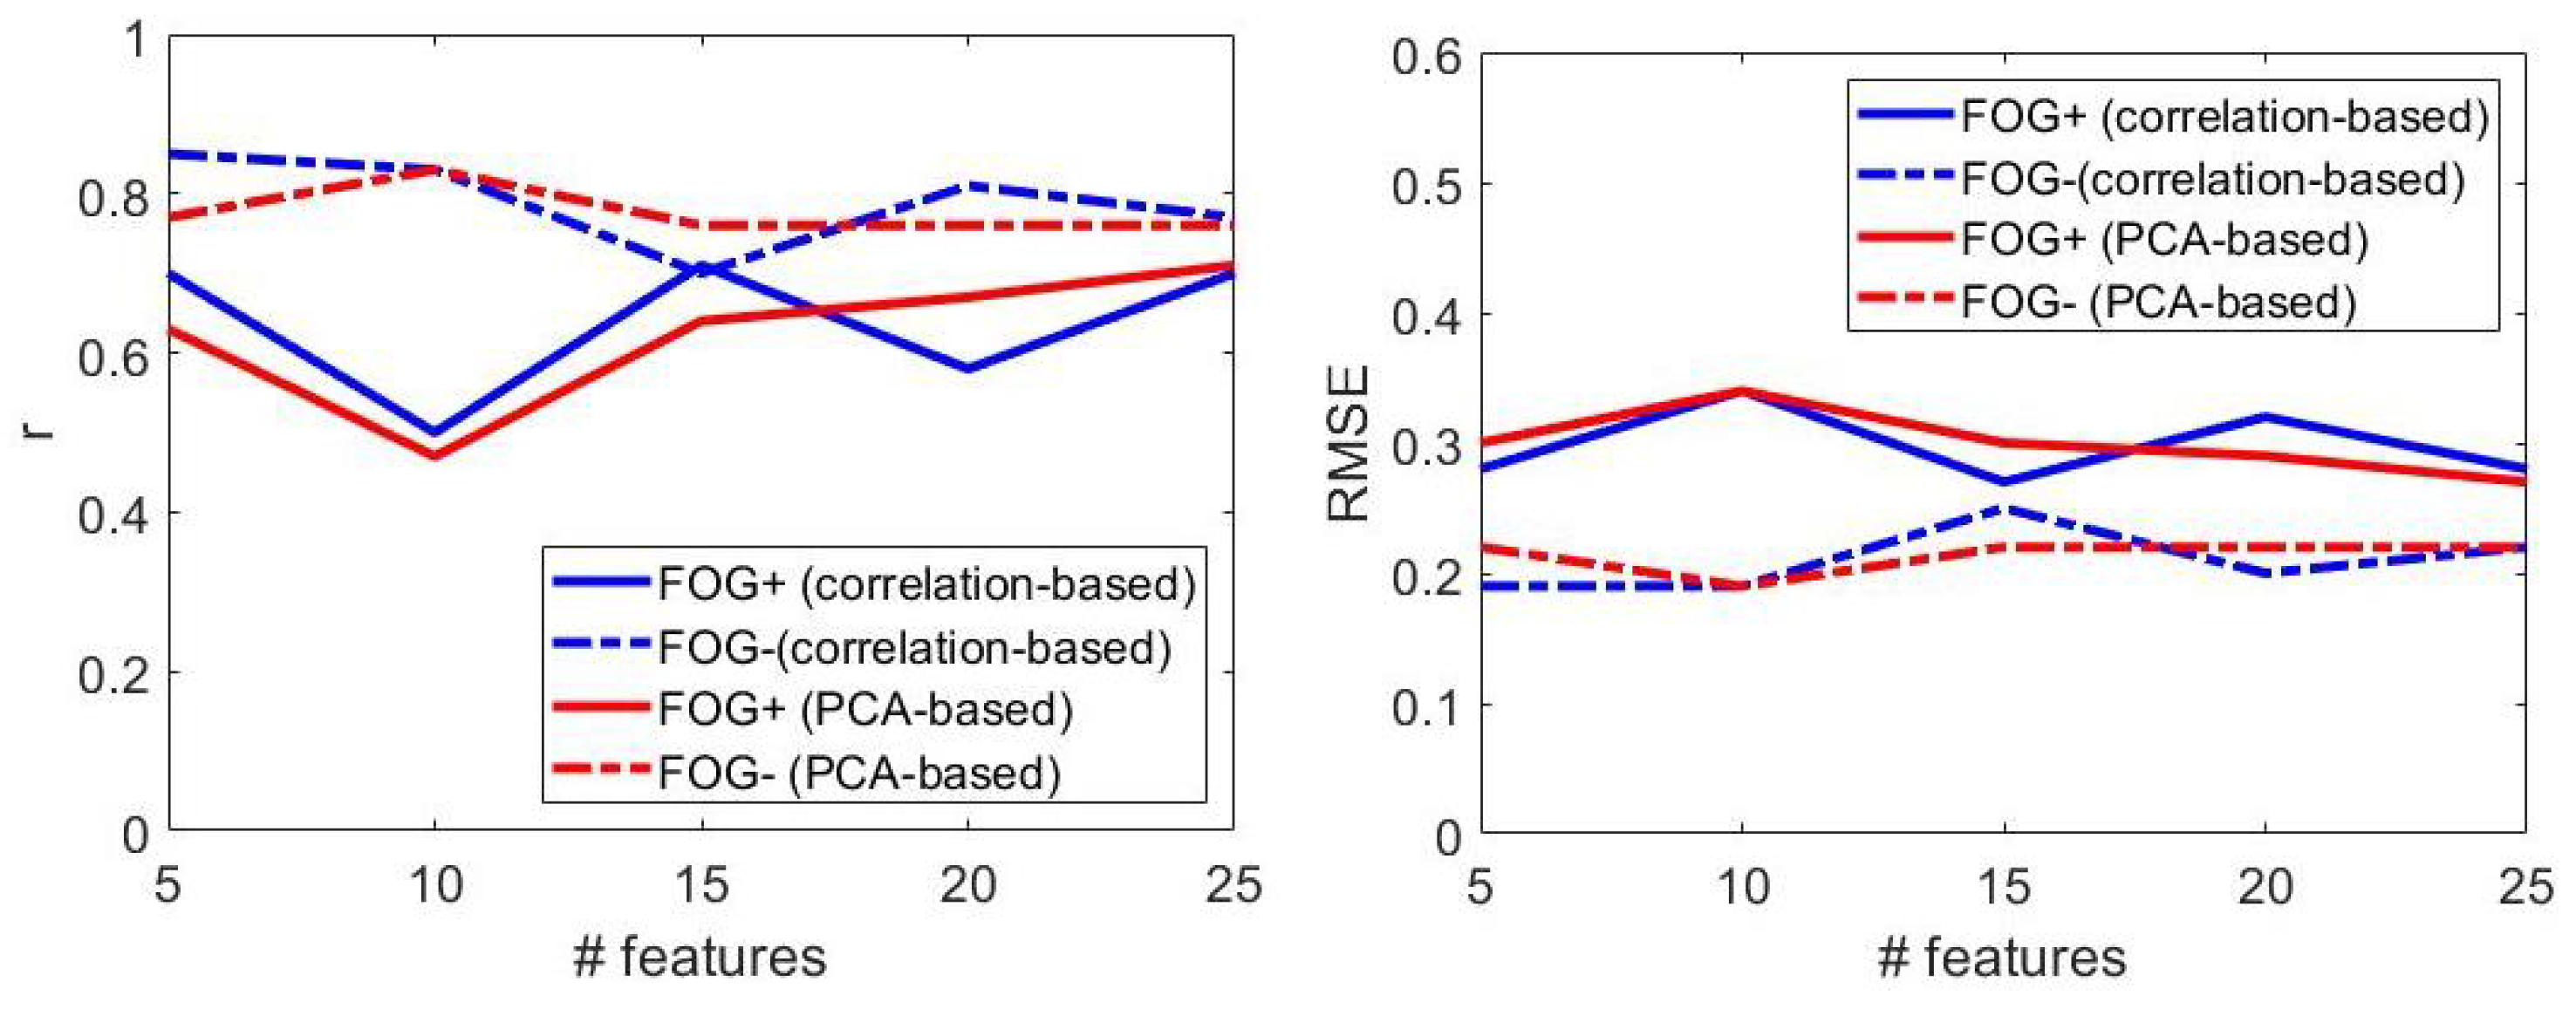
3.4. The Effect of Freezing of Gait
- Model: SVR with linear kernel is selected in 95% of cases; top performances were obtained with linear kernel and small values of box-constraint parameter (i.e., <0.51).
- Number of features: increasing the feature set size did not ensure progressively better performances (Figure 9). Best results were obtained with n = 15 (n = 5) features in patients with (without) FOG.
- Dimensionality reduction: correlation-based and PCA-based dimensionality reduction methods provided similar results, regardless of the feature set size (Figure 7).
- Correlation-based dimensionality reduction method led to the best results both for FOG+ and FOG− patients.
- Performance: regression models provided better performances in FOG− patients, as evident from larger values of r and lower values of the RMSE (Figure 9).
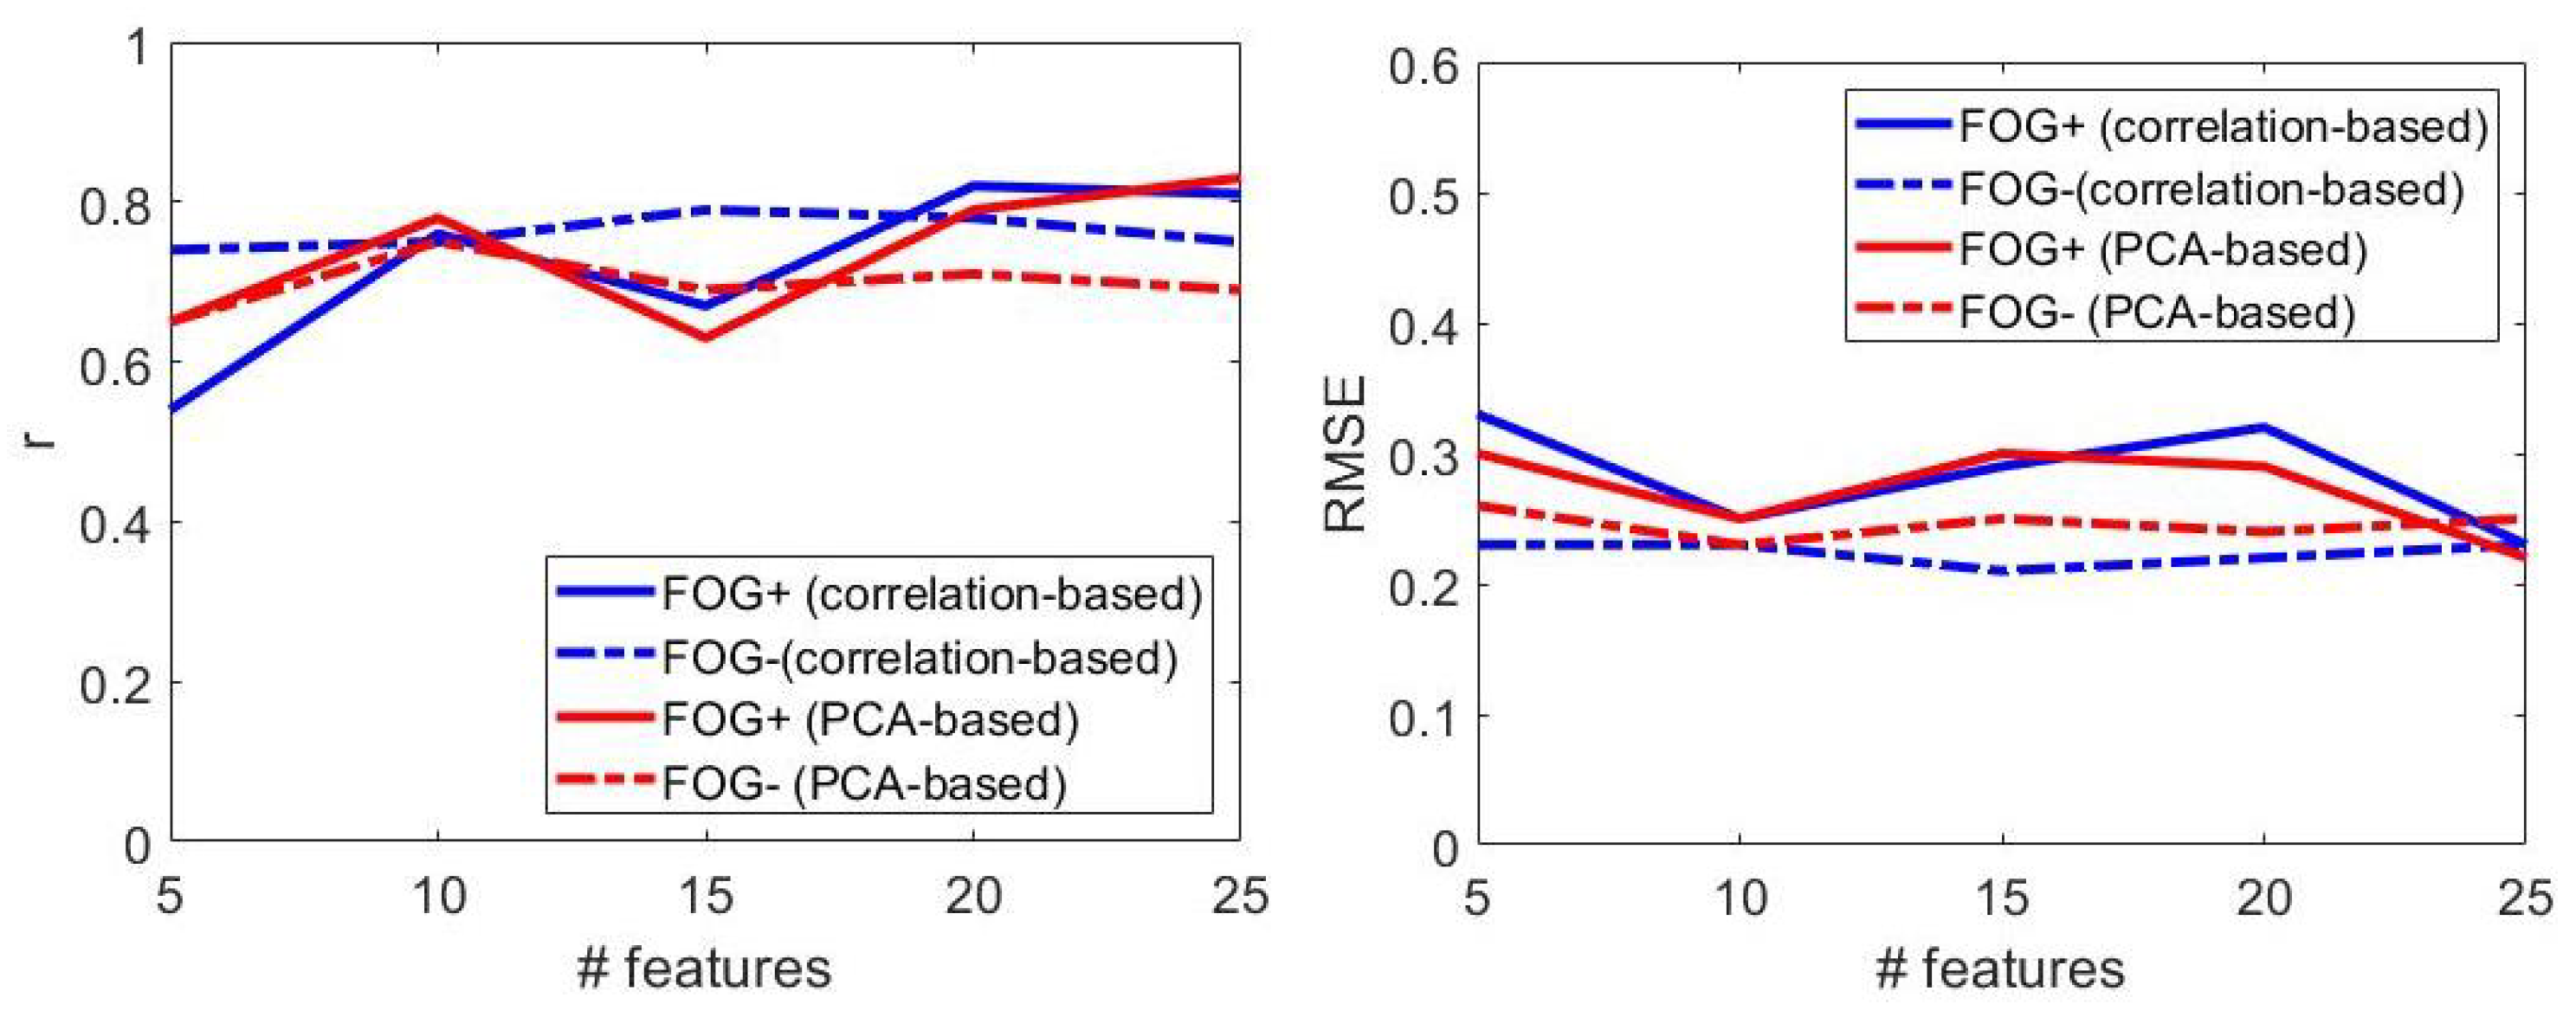
- Model: SVR with linear kernel is selected in 95% of cases; top performances were obtained with linear kernel both in patients with and without freezing of gait.
- Number of features: increasing the feature set size did not ensure progressively better performances (Figure 10). Best results were obtained with n = 25 (n = 15) features in patients with (without) freezing of gait.
- Dimensionality reduction: PCA-based (correlation-based) dimensionality reduction was selected for patients with (without) FOG.
4. Discussion
5. Conclusions
Author Contributions
Funding
Institutional Review Board Statement
Informed Consent Statement
Data Availability Statement
Acknowledgments
Conflicts of Interest
Abbreviations
| BAI | Beck Anxiety Inventory |
| CWT | Continuous Wavelet Transform |
| FAB | Frontal Assessment Battery |
| FFT | Fast Fourier Transform |
| FOG | Freezing of Gait |
| FOG-Q | Freezing of Gait Questionnaire |
| FOG+ | patients with Freezing of Gait |
| FOG− | patients without Freezing of Gait |
| HAM-D | Hamilton Depression rating scale |
| H&Y | Hoehn and Yahr scale |
| IMU | Inertial Measurement Unit |
| LEDD | Levodopa Equivalent Daily Dose |
| LOSO | Leave-One-Subject-Out |
| LSB | Least Significant Bit |
| ML | Machine Learning |
| MAE | Mean Square Error |
| MDS-UPDRS | Movement Disorder Society—Unified Parkinson’s Disease Rating Scale |
| MMSE | Mini-Mental State Examination |
| ON | under dopaminergic therapy |
| OFF | not under dopaminergic therapy |
| PIGD | Postural Instability and Gait Difficulty |
| PD | Parkinson’s Disease |
| PDPs | Patients with Parkinson’s Disease |
| RMSE | Root Mean Square Error |
| TUG | Timed Up and GO |
References
- Armstrong, M.; Okun, M. Diagnosis and Treatment of Parkinson Disease: A Review. JAMA 2020, 60, 323–548. [Google Scholar] [CrossRef]
- Boonstra, T.; van der Kooij, H.; Munneke, M.; Bloem, B. Gait disorders and balance disturbances in Parkinson’s disease: Clinical update and pathophysiology. Curr. Opin. Neurol. 2008, 21, 461–471. [Google Scholar] [CrossRef]
- Fasano, A.; Canning, C.; Hausdorff, J.; Lord, S.; Rochester, L. Falls in Parkinson’s disease: A complex and evolving picture. Mov. Disord. 2017, 32, 1524–1536. [Google Scholar] [CrossRef] [PubMed]
- Goetz, C.G.; Poewe, W.; Rascol, O.; Sampaio, C.; Stebbins, G.T.; Counsell, C.; Giladi, N.; Holloway, R.G.; Moore, C.G.; Wenning, G.K.; et al. Movement Disorder Society Task Force report on the Hoehn and Yahr staging scale: Status and recommendations. Mov. Disord. 2004, 19, 1020–1028. [Google Scholar] [CrossRef] [PubMed]
- Van der Heeden, J.; Marinus, J.; Martinez-Martin, P.; Rodriguez-Blazquez, C.; Geraedts, V.; van Hilten, J. Postural instability and gait are associated with severity and prognosis of Parkinson disease. Neurology 2016, 86, 2243–2250. [Google Scholar] [CrossRef]
- Horak, F.; Mancini, M. Objective biomarkers of balance and gait for Parkinson’s disease using body-worn sensors. Mov. Disord. 2013, 11, 1544–1551. [Google Scholar] [CrossRef] [Green Version]
- Zampogna, A.; Mileti, I.; Martelli, F.; Paoloni, M.; Del Prete, Z.; Palermo, E. Early balance impairment in Parkinson’s Disease: Evidence from Robot-assisted axial rotations. Clin. Neurophysiol. 2021, 132, 2422–2430. [Google Scholar] [CrossRef]
- Suppa, A.; Kita, A.; Leodori, G.; Zampogna, A.; Nicolini, E.; Lorenzi, P.; Rao, R.; Irrera, F. L-DOPA and freezing of gait in Parkinson’s disease: Objective assessment through a wearable wireless system. Front. Neurol. 2017, 8, 406. [Google Scholar] [CrossRef]
- Zampogna, A.; Mileti, I.; Palermo, E.; Celletti, C.; Paoloni, M.; Manoni, A. Fifteen Years of Wireless Sensors for Balance Assessment in Neurological Disorders. Sensors 2020, 20, 3247. [Google Scholar] [CrossRef] [PubMed]
- Di Biase, L.; Di Santo, A.; Caminiti, M.; De Liso, A.; Shah, S.; Ricci, L.; Vincenzo, D.L. Gait Analysis in Parkinson’s Disease: An Overview of the Most Accurate Markers for Diagnosis and Symptoms Monitoring. Sensors 2020, 20, 3529. [Google Scholar] [CrossRef] [PubMed]
- Borzì, L.; Fornara, S.; Amato, F.; Olmo, G.; Artusi, C.A.; Lopiano, L. Smartphone-based evaluation of postural stability in Parkinson’s disease patients during quiet stance. Electronics 2020, 9, 919. [Google Scholar] [CrossRef]
- Emmanouil, A.; Rousanoglou, E.; Georgaki, A.; Boudolos, K. Concurrent Validity of Inertially Sensed Measures during Voluntary Body Sway in Silence and while Exposed to a Rhythmic Acoustic Stimulus: A Pilot Study. Digit. Biomark. 2021, 5, 65–73. [Google Scholar] [CrossRef]
- Weiss, A.; Herman, T.; Mirelman, A.; Shiratzky, S.S.; Giladi, N.; Barnes, L.L.; Bennett, D.A.; Buchman, A.S.; Hausdorff, J.M. The transition between turning and sitting in patients with Parkinson’s disease: A wearable device detects an unexpected sequence of events. Gait Posture 2019, 67, 224–229. [Google Scholar] [CrossRef]
- Atrsaei, A.; Paraschiv-Ionescu, A.; Krief, H.; Henchoz, Y.; Santos-Eggimann, B.; Büla, C.; Aminian, K. Instrumented 5-Time Sit-To-Stand Test: Parameters Predicting Serious Falls beyond the Duration of the Test. Gerontology 2021, 1–14. [Google Scholar] [CrossRef]
- Castiglia, S.F.; Tatarelli, A.; Trabassi, D.; De Icco, R.; Grillo, V.; Ranavolo, A.; Varrecchia, T.; Magnifica, F.; Di Lenola, D.; Coppola, G.; et al. Ability of a set of trunk inertial indexes of gait to identify gait instability and recurrent fallers in parkinson’s disease. Sensors 2021, 21, 3449. [Google Scholar] [CrossRef]
- Bizovska, L.; Svoboda, Z.; Janura, M.; Bisi, M.C.; Vuillerme, N. Local dynamic stability during gait for predicting falls in elderly people: A one-year prospective study. PLoS ONE 2018, 13, e0197091. [Google Scholar] [CrossRef] [Green Version]
- Mazzetta, I.; Zampogna, A.; Suppa, A.; Gumiero, A.; Pessione, M.; Irrera, F. Wearable sensors system for an improved analysis of freezing of gait in Parkinson’s disease using electromyography and inertial signals. Sensors 2019, 19, 948. [Google Scholar] [CrossRef] [Green Version]
- Mitchell, T.; Conradsson, D.; Paquette, C. Gait and trunk kinematics during prolonged turning in Parkinson’s disease with freezing of gait. Park. Relat. Disord. 2019, 64, 188–193. [Google Scholar] [CrossRef]
- Borzì, L.; Varrecchia, M.; Olmo, G.; Artusi, C.A.; Fabbri, M.; Rizzone, M.G.; Romagnolo, A.; Zibetti, M.; Lopiano, L. A new index to assess turning quality and postural stability in patients with Parkinson ’ s disease. Biomed. Signal Process. Control 2020, 62, 1–7. [Google Scholar] [CrossRef]
- Zhan, A.; Mohan, S.; Tarolli, C.; Schneider, R.B.; Adams, J.L.; Sharma, S.; Elson, M.J.; Spear, K.L.; Glidden, A.M.; Little, M.A.; et al. Using Smartphones and Machine Learning to Quantify Parkinson Disease Severity: The Mobile Parkinson Disease Score. JAMA Neurol. 2018, 75, 876–880. [Google Scholar] [CrossRef]
- Landolfi, A.; Ricciardi, C.; Donisi, L.; Cesarelli, G.; Troisi, J.; Vitale, C.; Barone, P.; Amboni, M. Machine Learning Approaches in Parkinson’s Disease. Curr. Med. Chem. 2021, 28, 6548–6568. [Google Scholar] [CrossRef] [PubMed]
- Rodríguez-Molinero, A.; Samà, A.; Pérez-López, C.; Rodríguez-Martín, D.; Alcaine, S.; Mestre, B.; Quispe, P.; Giuliani, B.; Vainstein, G.; Browne, P.; et al. Analysis of correlation between an accelerometer-Based algorithm for Detecting Parkinsonian gait and UPDRS subscales. Front. Neurol. 2017, 8, 1–6. [Google Scholar] [CrossRef] [Green Version]
- Safarpour, D.; Dale, M.L.; Shah, V.V.; Talman, L.; Carlson-Kuhta, P.; Horak, F.B.; Mancini, M. Surrogates for rigidity and PIGD MDS-UPDRS subscores using wearable sensors. Gait Posture 2021, 91, 186–191. [Google Scholar] [CrossRef] [PubMed]
- Kubota, K.; Chen, J.; Little, M.A. Machine learning for large-scale wearable sensor data in Parkinson’s disease: Concepts, promises, pitfalls, and futures. Mov. Disord. 2016, 9, 1314–1326. [Google Scholar] [CrossRef]
- Rajkomar, A.; Dean, J.; Kohane, I. Machine Learning in Medicine. New Engl. J. Med. 2019, 380, 1347–1358. [Google Scholar] [CrossRef]
- Tomlinson, C.L.; Stowe, R.; Patel, S.; Rick, C.; Gray, R.; Clarke, C.E. Systematic review of levodopa dose equivalency reporting in Parkinson’s disease. Mov. Disord. 2010, 25, 2649–2653. [Google Scholar] [CrossRef]
- Comotti, D.; Galizzi, M.; Vitali, A. neMEMSi: One step forward in wireless attitude and heading reference systems. In Proceedings of the 2014 International Symposium on Inertial Sensors and Systems (ISISS), Laguna Beach, CA, USA, 25–26 February 2014; pp. 1–4. [Google Scholar] [CrossRef]
- Vargas-Valencia, L.S.; Elías, A.; Frizera Neto, A.; Rocón, E. Body to sensor calibration procedure for lower limb joint angle estimation applied to imu-based gait analysis. In Proceedings of the XXIV Brazilian Congress on Biomedical Engineering (CBEB 2014), Uberlandia, Brazil, 13–17 October 2014; pp. 777–780. Available online: https://digital.csic.es/bitstream/10261/130403/1/2014-Body_To_Sensor_Calibration_Procedure_for_Lower_Limb_Joint_Angle_Estimation_Applied_To_Imu-Based_Gait_Analysis.pdf (accessed on 16 November 2021).
- Sijobert, B.; Benoussaad, M.; Denys, J.; Pissard-Gibollet, R.; Geny, C.; Coste, C.A. Implementation and validation of a stride length estimation algorithm, using a single basic inertial sensor on healthy subjects and patients suffering from Parkinson’s disease. Health 2015, 7, 704–714. [Google Scholar] [CrossRef] [Green Version]
- Roetenberg, D.; Luinge, H.J.; Baten, C.T.; Veltink, P.H. Compensation of magnetic disturbances improves inertial and magnetic sensing of human body segment orientation. IEEE Trans. Neural Syst. Rehabil. Eng. 2005, 13, 395–405. [Google Scholar] [CrossRef] [Green Version]
- Caruso, M.; Sabatini, A.M.; Laidig, D.; Seel, T.; Knaflitz, M.; Croce, U.D.; Cereatti, A. Analysis of the Accuracy of Ten Algorithms for Orientation Estimation Using Inertial and Magnetic Sensing under Optimal Conditions: One Size Does Not Fit All. Sensors 2021, 21, 2543. [Google Scholar] [CrossRef]
- Barralon, P.; Vuillerme, N.; Noury, N. Walk Detection With a Kinematic Sensor: Frequency and Wavelet Comparison. In Proceedings of the 2006 International Conference of the IEEE Engineering in Medicine and Biology Society, New York, NY, USA, 30 August–3 September 2006; pp. 1711–1714. [Google Scholar] [CrossRef]
- Pham Minh, H.; Elshehabi, M.; Haertner, L.; Del Din, S.; Srulijes, K.; Heger, T.; Synofzik, M.; Hobert, M.A.; Faber, G.S.; Hansen, C.; et al. Validation of a Step Detection Algorithm during Straight Walking and Turning in Patients with Parkinson’s Disease and Older Adults Using an Inertial Measurement Unit at the Lower Back. Front. Neurol. 2017, 8, 457. [Google Scholar] [CrossRef] [Green Version]
- Huijben, B. The effect of walking speed on quality of gait in older adults Gait & Posture The e ff ect of walking speed on quality of gait in older adults. Gait Posture 2018, 65, 112–116. [Google Scholar] [CrossRef] [Green Version]
- Bouça-Machado, R.; Jalles, C.; Guerreiro, D.; Pona-Ferreira, F.; Branco, D.; Guerreiro, T.; Matias, R.; Ferreira, J.J. Gait Kinematic Parameters in Parkinson’s Disease: A Systematic Review. J. Park. Dis. 2020, 10, 843–853. [Google Scholar] [CrossRef]
- Abhayasinghe, N.; Murray, I. Human gait phase recognition based on thigh movement computed using IMUs. In Proceedings of the IEEE ISSNIP 2014—2014 IEEE 9th International Conference on Intelligent Sensors, Sensor Networks and Information Processing, Singapore, 21–24 April 2014. [Google Scholar] [CrossRef] [Green Version]
- Smola, A.; Schölkopf, B. A tutorial on support vector regression. JAMA 2004, 14, 199–222. [Google Scholar] [CrossRef] [Green Version]
- Mangasarian, O.; Musicant, D. Robust linear and support vector regression. IEEE Trans. Pattern Anal. Mach. Intell. 2000, 22, 950–955. [Google Scholar] [CrossRef]
- Terashi, H.; Taguchi, T.; Ueta, Y.; Yoshihiko, O.; Hiroshi, M.; Hitoshi, A. Analysis of non-invasive gait recording under free-living conditions in patients with Parkinson’s disease: Relationship with global cognitive function and motor abnormalities. BMC Neurol. 2020, 161. [Google Scholar] [CrossRef] [PubMed]
- Wu, Z.; Zhong, M.; Jiang, X.; Shen, B.; Zhu, J.; Pan, Y.; Dong, J.; Yan, J.; Xu, P.; Zhang, W.; et al. Can Quantitative Gait Analysis Be Used to Guide Treatment of Patients with Different Subtypes of Parkinson’s Disease? Neuropsychiatr. Dis. Treat. 2020, 9, 2335–2341. [Google Scholar] [CrossRef] [PubMed]
- Borzì, L.; Mazzetta, I.; Zampogna, A.; Suppa, A.; Olmo, G.; Irrera, F. Prediction of freezing of gait in parkinson’s disease using wearables and machine learning. Sensors 2021, 21, 614. [Google Scholar] [CrossRef] [PubMed]
- Curtze, C.; Nutt, J.; Carlson-Kuhta, P.; Mancini, M.; Horak, F. Levodopa Is a Double-Edged Sword for Balance and Gait in People With Parkinson’s Disease. Mov. Disord. 2015, 30, 1361–1370. [Google Scholar] [CrossRef]
- De Kam, D.; Nonnekes, J.; Oude Nijhuis, L.; Geurts, A.C.H.; Bloem, B.R.; Weerdesteyn, V. Dopaminergic medication does not improve stepping responses following backward and forward balance perturbations in patients with Parkinson’s disease. J. Neurol. 2014, 261, 2330–2337. [Google Scholar] [CrossRef]
- Di Giulio, I.; St George, R.; Kalliolia, E.; Peters, A.; Limousin, P.; Day, B. Maintaining balance against force perturbations: Impaired mechanisms unresponsive to levodopa in Parkinson’s disease. J. Neurophysiol. 2016, 116, 493–502. [Google Scholar] [CrossRef] [Green Version]
- Barbe, M.; Amarell, M.; Snijders, A.; Florin, E.; Quatuor, E.; Schönau, E.; Fink, G.; Bloem, B.; Timmermann, L. Gait and upper limb variability in Parkinson’s disease patients with and without freezing of gait. J. Neurol. 2014, 261, 330–342. [Google Scholar] [CrossRef] [PubMed]
- Plotnik, M.; Giladi, N.; Balash, Y.; Peretz, C.; Hausdorff, J. Is freezing of gait in Parkinson’s disease related to asymmetric motor function? Ann. Neurol. 2005, 57, 656–663. [Google Scholar] [CrossRef] [PubMed]
- Lorenzi, P.; Rao, R.; Romano, G.; Kita, A.; Serpa, M.; Filesi, F.; Parisi, R.; Supp, A.; Bologn, M.; Berardelli, A.; et al. Smart Sensing Systems for the Detection of Human Motion Disorders. Procedia Eng. 2015, 120, 324–327. [Google Scholar] [CrossRef] [Green Version]
- Montesinos, L.; Castaldo, R.; Pecchia, L. Wearable inertial sensors for fall risk assessment and prediction in older adults: A systematic review and meta-analysis. IEEE Trans. Neural Syst. Rehabil. Eng. 2018, 26, 573–582. [Google Scholar] [CrossRef] [PubMed] [Green Version]
- Brognara, L.; Palumbo, P.; Grimm, B.; Palmerini, L. Assessing Gait in Parkinson’s Disease Using Wearable Motion Sensors: A Systematic Review. Diseases 2019, 7, 18. [Google Scholar] [CrossRef] [PubMed] [Green Version]
- Zanardi, A.P.J.; da Silva, E.S.; Costa, R.R.; Passos-Monteiro, E.; dos Santos, I.O.; Kruel, L.F.M.; Peyré-Tartaruga, L.A. Gait parameters of Parkinson’s disease compared with healthy controls: A systematic review and meta-analysis. Sci. Rep. 2021, 11, 752. [Google Scholar] [CrossRef] [PubMed]
- Del Din, S.; Kirk, C.; Yarnall, A.J.; Rochester, L.; Hausdorff, J.M. Body-Worn Sensors for Remote Monitoring of Parkinson’s Disease Motor Symptoms: Vision, State of the Art, and Challenges Ahead. J. Park. Dis. 2021, 11, 35–47. [Google Scholar] [CrossRef] [PubMed]


| # Patients (Male) | Age (Years) | Disease Duration (Years) | H&Y |
|---|---|---|---|
| 31 (23) | 71.9 ± 6.9 | 10.9 ± 5.9 | 2.4 ± 0.8 |
| MMSE | FAB | HAM-D | BAI | LEDD (mg) | MDS-UPDRS-III OFF (ON) | PIGD OFF (ON) |
|---|---|---|---|---|---|---|
| 28.1 ± 1.9 | 14.7 ± 2.8 | 12.9 ± 6.8 | 11.8 ± 7.5 | 819 ± 406 | 35.9 ± 13.9 (27.9 ± 13.7) | 7.3 ± 5.7 (6.3 ± 4.6) |
| Sensor | Range | Sensitivity | Sample Rate |
|---|---|---|---|
| Accelerometer | ±2 g | 61 g/LSB | 60 Hz |
| Gyroscope | ±245 dps | 8.75 mdps/digit | 60 Hz |
| ID | Feature | Component | Number | Equation | Explanation |
|---|---|---|---|---|---|
| 1 | Min | 4 | - | minimum value | |
| 2 | Max | 4 | - | maximum value | |
| 3 | Mean | 4 | average value | ||
| 4 | Std | 4 | standard deviation | ||
| 5 | RMS | 4 | root mean square value | ||
| 6 | Range | 4 | = | range of values | |
| 7 | Entropy | 4 | Shannon signal entropy | ||
| 8 | nPeaks | 4 | - | number of peaks higher than Std | |
| 9 | hPeaks | 4 | - | average height of nPeaks | |
| 10 | vPeaks | 4 | - | standard deviation of hPeaks | |
| 11 | Zc | 4 | - | zero-crossing rate | |
| 12 | Corr | 7 | correlation between axis pair |
| ID | Feature | Component | Number | Equation | Explanation |
|---|---|---|---|---|---|
| 13 | DH frequency | 4 | - | frequency of the principal harmonic | |
| 14 | DH height | 4 | - | amplitude of the principal harmonic | |
| 15 | DH width | 4 | - | width of the principal harmonic | |
| 16 | 4 | total signal energy | |||
| 17 | DH ratio | 4 | - | ratio between the energy of the principal harmonic and | |
| 18 | sEntropy | 4 | Shannon entropy of the signal FFT | ||
| 19 | binEnergy | 24 | - | ratio between energy in specific frequency bands and |
| Feature | Component | Pearson Correlation Coefficient (p-Value) | |
|---|---|---|---|
| PIGD OFF | PIGD ON | ||
| Min | 0.54 (0.002) | 0.58 (<0.001) | |
| Mean | 0.64 (<0.001) | 0.54 (0.002) | |
| RMS | −0.67 (<0.001), −0.74 (<0.001) | −0.57 (0.002), −0.72 (<0.001) | |
| hPeaks | −0.70 (<0.001), −0.74 (<0.001) | −0.58 (<0.001), −0.60 (<0.001) | |
| DH height | −0.59 (<0.001), −0.71 (<0.001), −0.69 (<0.001) | −0.57 (<0.001), −0.70 (<0.001), −0.65 (<0.001) | |
| # Features | Therapy | Dimensionality Reduction | SVR Parameters | Performance | |||||
|---|---|---|---|---|---|---|---|---|---|
| Method | Value | Kernel | Kernel Scale | Box Constraint | r | RMSE | MAE | ||
| 5 | ON | r (min–max) | 0.65–0.72 | linear | - | 10.9 | 0.71 | 0.22 | 0.18 |
| var (%) | 82.9 | linear | - | 0.09 | 0.71 | 0.25 | 0.20 | ||
| OFF | r (min–max) | 0.76–0.77 | gaussian | 1.41 | 2.67 | 0.76 | 0.21 | 0.18 | |
| var (%) | 77.3 | linear | - | 0.006 | 0.77 | 0.21 | 0.16 | ||
| 10 | ON | r (min–max) | 0.58–0.72 | linear | - | 378.6 | 0.54 | 0.27 | 0.22 |
| var (%) | 93.0 | linear | - | 0.07 | 0.55 | 0.26 | 0.20 | ||
| OFF | r (min–max) | 0.74–0.77 | linear | - | 0.35 | 0.69 | 0.23 | 0.19 | |
| var (%) | 88.7 | linear | - | 1.91 | 0.51 | 0.28 | 0.23 | ||
| 15 | ON | r (min–max) | 0.56–0.72 | linear | - | 0.003 | 0.67 | 0.23 | 0.19 |
| var (%) | 97.5 | linear | - | 0.009 | 0.75 | 0.20 | 0.16 | ||
| OFF | r (min–max) | 0.68–0.77 | gaussian | 449.69 | 253.51 | 0.69 | 0.23 | 0.19 | |
| var (%) | 94.7 | linear | - | 0.001 | 0.79 | 0.19 | 0.15 | ||
| 20 | ON | r (min–max) | 0.55–0.72 | linear | - | 0.002 | 0.71 | 0.22 | 0.16 |
| var (%) | 99.2 | linear | - | 641.6 | 0.5 | 0.28 | 0.24 | ||
| OFF | r (min–max) | 0.66–0.77 | linear | - | 0.004 | 0.79 | 0.20 | 0.15 | |
| var (%) | 97.9 | gaussian | 40.06 | 0.87 | 0.76 | 0.21 | 0.15 | ||
| 25 | ON | r (min–max) | 0.52–0.72 | linear | - | 0.005 | 0.66 | 0.24 | 0.19 |
| var (%) | 99.8 | linear | - | 0.003 | 0.71 | 0.22 | 0.16 | ||
| OFF | r (min–max) | 0.62–0.72 | linear | - | 0.004 | 0.78 | 0.20 | 0.15 | |
| var (%) | 99.5 | cubic | - | 0.19 | 0.75 | 0.21 | 0.16 | ||
| Group | # Patients (Male) | Age (Years) | MDS-UPDRS-III OFF (ON) | PIGD OFF (ON) |
|---|---|---|---|---|
| FOG+ | 17 (13) | 72.0 ± 7.6 | 40.9 ± 13.2 (32.9 ± 14.1) | 11.2 ± 4.5 (9.6 ± 3.4) |
| FOG− | 14 (10) | 71.8 ± 6.4 | 29.7 ± 12.3 (21.9 ± 10.8) | 2.6 ± 2.5 (2.4 ± 2.3) |
| p | 0.353 (0.531) | 0.811 | 0.054 (0.030) | <0.001 (<0.001) |
| # Features | Group | Dimensionality Reduction | SVM Parameters | Performance | |||||
|---|---|---|---|---|---|---|---|---|---|
| Method | Value | Kernel | Kernel Scale | Box Constraint | r | RMSE | MAE | ||
| 5 | FOG+ | r (min–max) | 0.58–0.69 | linear | - | 0.007 | 0.7 | 0.28 | 0.22 |
| var (%) | 85.2 | linear | - | 0.02 | 0.63 | 0.30 | 0.25 | ||
| FOG− | r (min–max) | 0.77–0.84 | linear | - | 0.07 | 0.85 | 0.19 | 0.13 | |
| var (%) | 82.1 | linear | - | 0.007 | 0.77 | 0.22 | 0.15 | ||
| 10 | FOG+ | r (min–max) | 0.55–0.69 | linear | - | 1.69 | 0.5 | 0.34 | 0.26 |
| var (%) | 96.6 | linear | - | 0.03 | 0.47 | 0.34 | 0.29 | ||
| FOG− | r (min–max) | 0.69–0.84 | linear | - | 0.02 | 0.83 | 0.19 | 0.15 | |
| var (%) | 96.5 | linear | - | 0.004 | 0.83 | 0.19 | 0.15 | ||
| 15 | FOG+ | r (min–max) | 0.53–0.69 | linear | - | 0.51 | 0.71 | 0.27 | 0.21 |
| var (%) | 99.8 | linear | - | 0.06 | 0.64 | 0.30 | 0.24 | ||
| FOG− | r (min–max) | 0.66–0.84 | quadratic | - | 0.019 | 0.7 | 0.25 | 0.20 | |
| var (%) | 99.8 | linear | - | 0.15 | 0.76 | 0.22 | 0.18 | ||
| 20 | FOG+ | r (min–max) | 0.50–0.69 | linear | - | 0.007 | 0.58 | 0.32 | 0.28 |
| var (%) | 99.9 | linear | - | 0.46 | 0.67 | 0.29 | 0.23 | ||
| FOG− | r (min–max) | 0.64–0.84 | linear | - | 0.004 | 0.81 | 0.20 | 0.25 | |
| var (%) | 99.9 | linear | - | 0.01 | 0.76 | 0.22 | 0.17 | ||
| 25 | FOG+ | r (min–max) | 0.46–0.69 | linear | - | 0.014 | 0.7 | 0.28 | 0.24 |
| var (%) | 99.9 | linear | - | 4.02 | 0.71 | 0.27 | 0.22 | ||
| FOG− | r (min–max) | 0.62–0.84 | linear | - | 0.02 | 0.77 | 0.22 | 0.19 | |
| var (%) | 99.95 | linear | - | 85.9 | 0.76 | 0.22 | 0.18 | ||
| # Features | Group | Dimensionality Reduction | SVM Parameters | Performance | |||||
|---|---|---|---|---|---|---|---|---|---|
| Method | Value | Kernel | Kernel Scale | Box Constraint | r | RMSE | MAE | ||
| 5 | FOG+ | r (min–max) | 0.58–0.65 | linear | - | 2.7 | 0.54 | 0.33 | 0.29 |
| var (%) | 83.1 | gaussian | 69.3 | 2.3 | 0.65 | 0.30 | 0.25 | ||
| FOG− | r (min–max) | 0.70–0.76 | linear | - | 0.01 | 0.74 | 0.23 | 0.16 | |
| var (%) | 83.5 | linear | - | 0.06 | 0.65 | 0.26 | 0.20 | ||
| 10 | FOG+ | r (min–max) | 0.55–0.65 | linear | - | 0.93 | 0.76 | 0.25 | 0.18 |
| var (%) | 95.7 | linear | - | 0.004 | 0.78 | 0.25 | 0.22 | ||
| FOG− | r (min–max) | 0.69–0.76 | linear | - | 83.9 | 0.75 | 0.23 | 0.18 | |
| var (%) | 97.2 | linear | - | 0.003 | 0.75 | 0.23 | 0.15 | ||
| 15 | FOG+ | r (min–max) | 0.52–0.65 | linear | - | 0.03 | 0.67 | 0.29 | 0.24 |
| var (%) | 99.7 | linear | - | 118.5 | 0.63 | 0.30 | 0.26 | ||
| FOG− | r (min–max) | 0.63–0.76 | linear | - | 0.006 | 0.79 | 0.21 | 0.15 | |
| var (%) | 99.6 | linear | - | 0.002 | 0.69 | 0.25 | 0.16 | ||
| 20 | FOG+ | r (min–max) | 0.50–0.65 | linear | - | 0.37 | 0.82 | 0.22 | 0.19 |
| var (%) | 99.8 | linear | - | 0.05 | 0.79 | 0.24 | 0.21 | ||
| FOG− | r (min–max) | 0.61–0.76 | linear | - | 0.009 | 0.78 | 0.22 | 0.14 | |
| var (%) | 99.8 | linear | - | 0.002 | 0.71 | 0.24 | 0.16 | ||
| 25 | FOG+ | r (min–max) | 0.48–0.65 | linear | - | 621.2 | 0.81 | 0.23 | 0.19 |
| var (%) | 99.9 | linear | - | 24.2 | 0.83 | 0.22 | 0.19 | ||
| FOG− | r (min–max) | 0.59–0.76 | linear | - | 0.69 | 0.75 | 0.23 | 0.16 | |
| var (%) | 99.9 | linear | - | 0.12 | 0.69 | 0.25 | 0.17 | ||
| Therapy | FOG | Performance | ||
|---|---|---|---|---|
| r | RMSE | MAE | ||
| All | All | 0.64 | 0.22 | 0.17 |
| ON | All | 0.75 | 0.20 | 0.16 |
| FOG+ | 0.71 | 0.27 | 0.21 | |
| FOG− | 0.85 | 0.19 | 0.13 | |
| OFF | All | 0.79 | 0.19 | 0.15 |
| FOG+ | 0.83 | 0.22 | 0.19 | |
| FOG− | 0.79 | 0.21 | 0.15 | |
| Training Sample | Testing Sample | Performance | ||
|---|---|---|---|---|
| r | RMSE | MAE | ||
| ON | OFF | 0.70 | 0.57 | 0.47 |
| OFF | ON | 0.67 | 0.42 | 0.15 |
| FOG+ (ON) | FOG− (ON) | 0.34 | 0.43 | 0.37 |
| FOG− (ON) | FOG+ (ON) | 0.40 | 0.39 | 0.35 |
| FOG+ (OFF) | FOG− (OFF) | 0.73 | 0.36 | 0.25 |
| FOG− (OFF) | FOG+ (OFF) | 0.69 | 0.33 | 0.25 |
Publisher’s Note: MDPI stays neutral with regard to jurisdictional claims in published maps and institutional affiliations. |
© 2022 by the authors. Licensee MDPI, Basel, Switzerland. This article is an open access article distributed under the terms and conditions of the Creative Commons Attribution (CC BY) license (https://creativecommons.org/licenses/by/4.0/).
Share and Cite
Borzì, L.; Mazzetta, I.; Zampogna, A.; Suppa, A.; Irrera, F.; Olmo, G. Predicting Axial Impairment in Parkinson’s Disease through a Single Inertial Sensor. Sensors 2022, 22, 412. https://doi.org/10.3390/s22020412
Borzì L, Mazzetta I, Zampogna A, Suppa A, Irrera F, Olmo G. Predicting Axial Impairment in Parkinson’s Disease through a Single Inertial Sensor. Sensors. 2022; 22(2):412. https://doi.org/10.3390/s22020412
Chicago/Turabian StyleBorzì, Luigi, Ivan Mazzetta, Alessandro Zampogna, Antonio Suppa, Fernanda Irrera, and Gabriella Olmo. 2022. "Predicting Axial Impairment in Parkinson’s Disease through a Single Inertial Sensor" Sensors 22, no. 2: 412. https://doi.org/10.3390/s22020412
APA StyleBorzì, L., Mazzetta, I., Zampogna, A., Suppa, A., Irrera, F., & Olmo, G. (2022). Predicting Axial Impairment in Parkinson’s Disease through a Single Inertial Sensor. Sensors, 22(2), 412. https://doi.org/10.3390/s22020412