
Assessing Electroencephalography as a Stress Indicator: A VR High-Altitude Scenario Monitored through EEG and ECG

 ,
, 
 ,
,  ,
,  ,
, 
Abstract
:1. Introduction
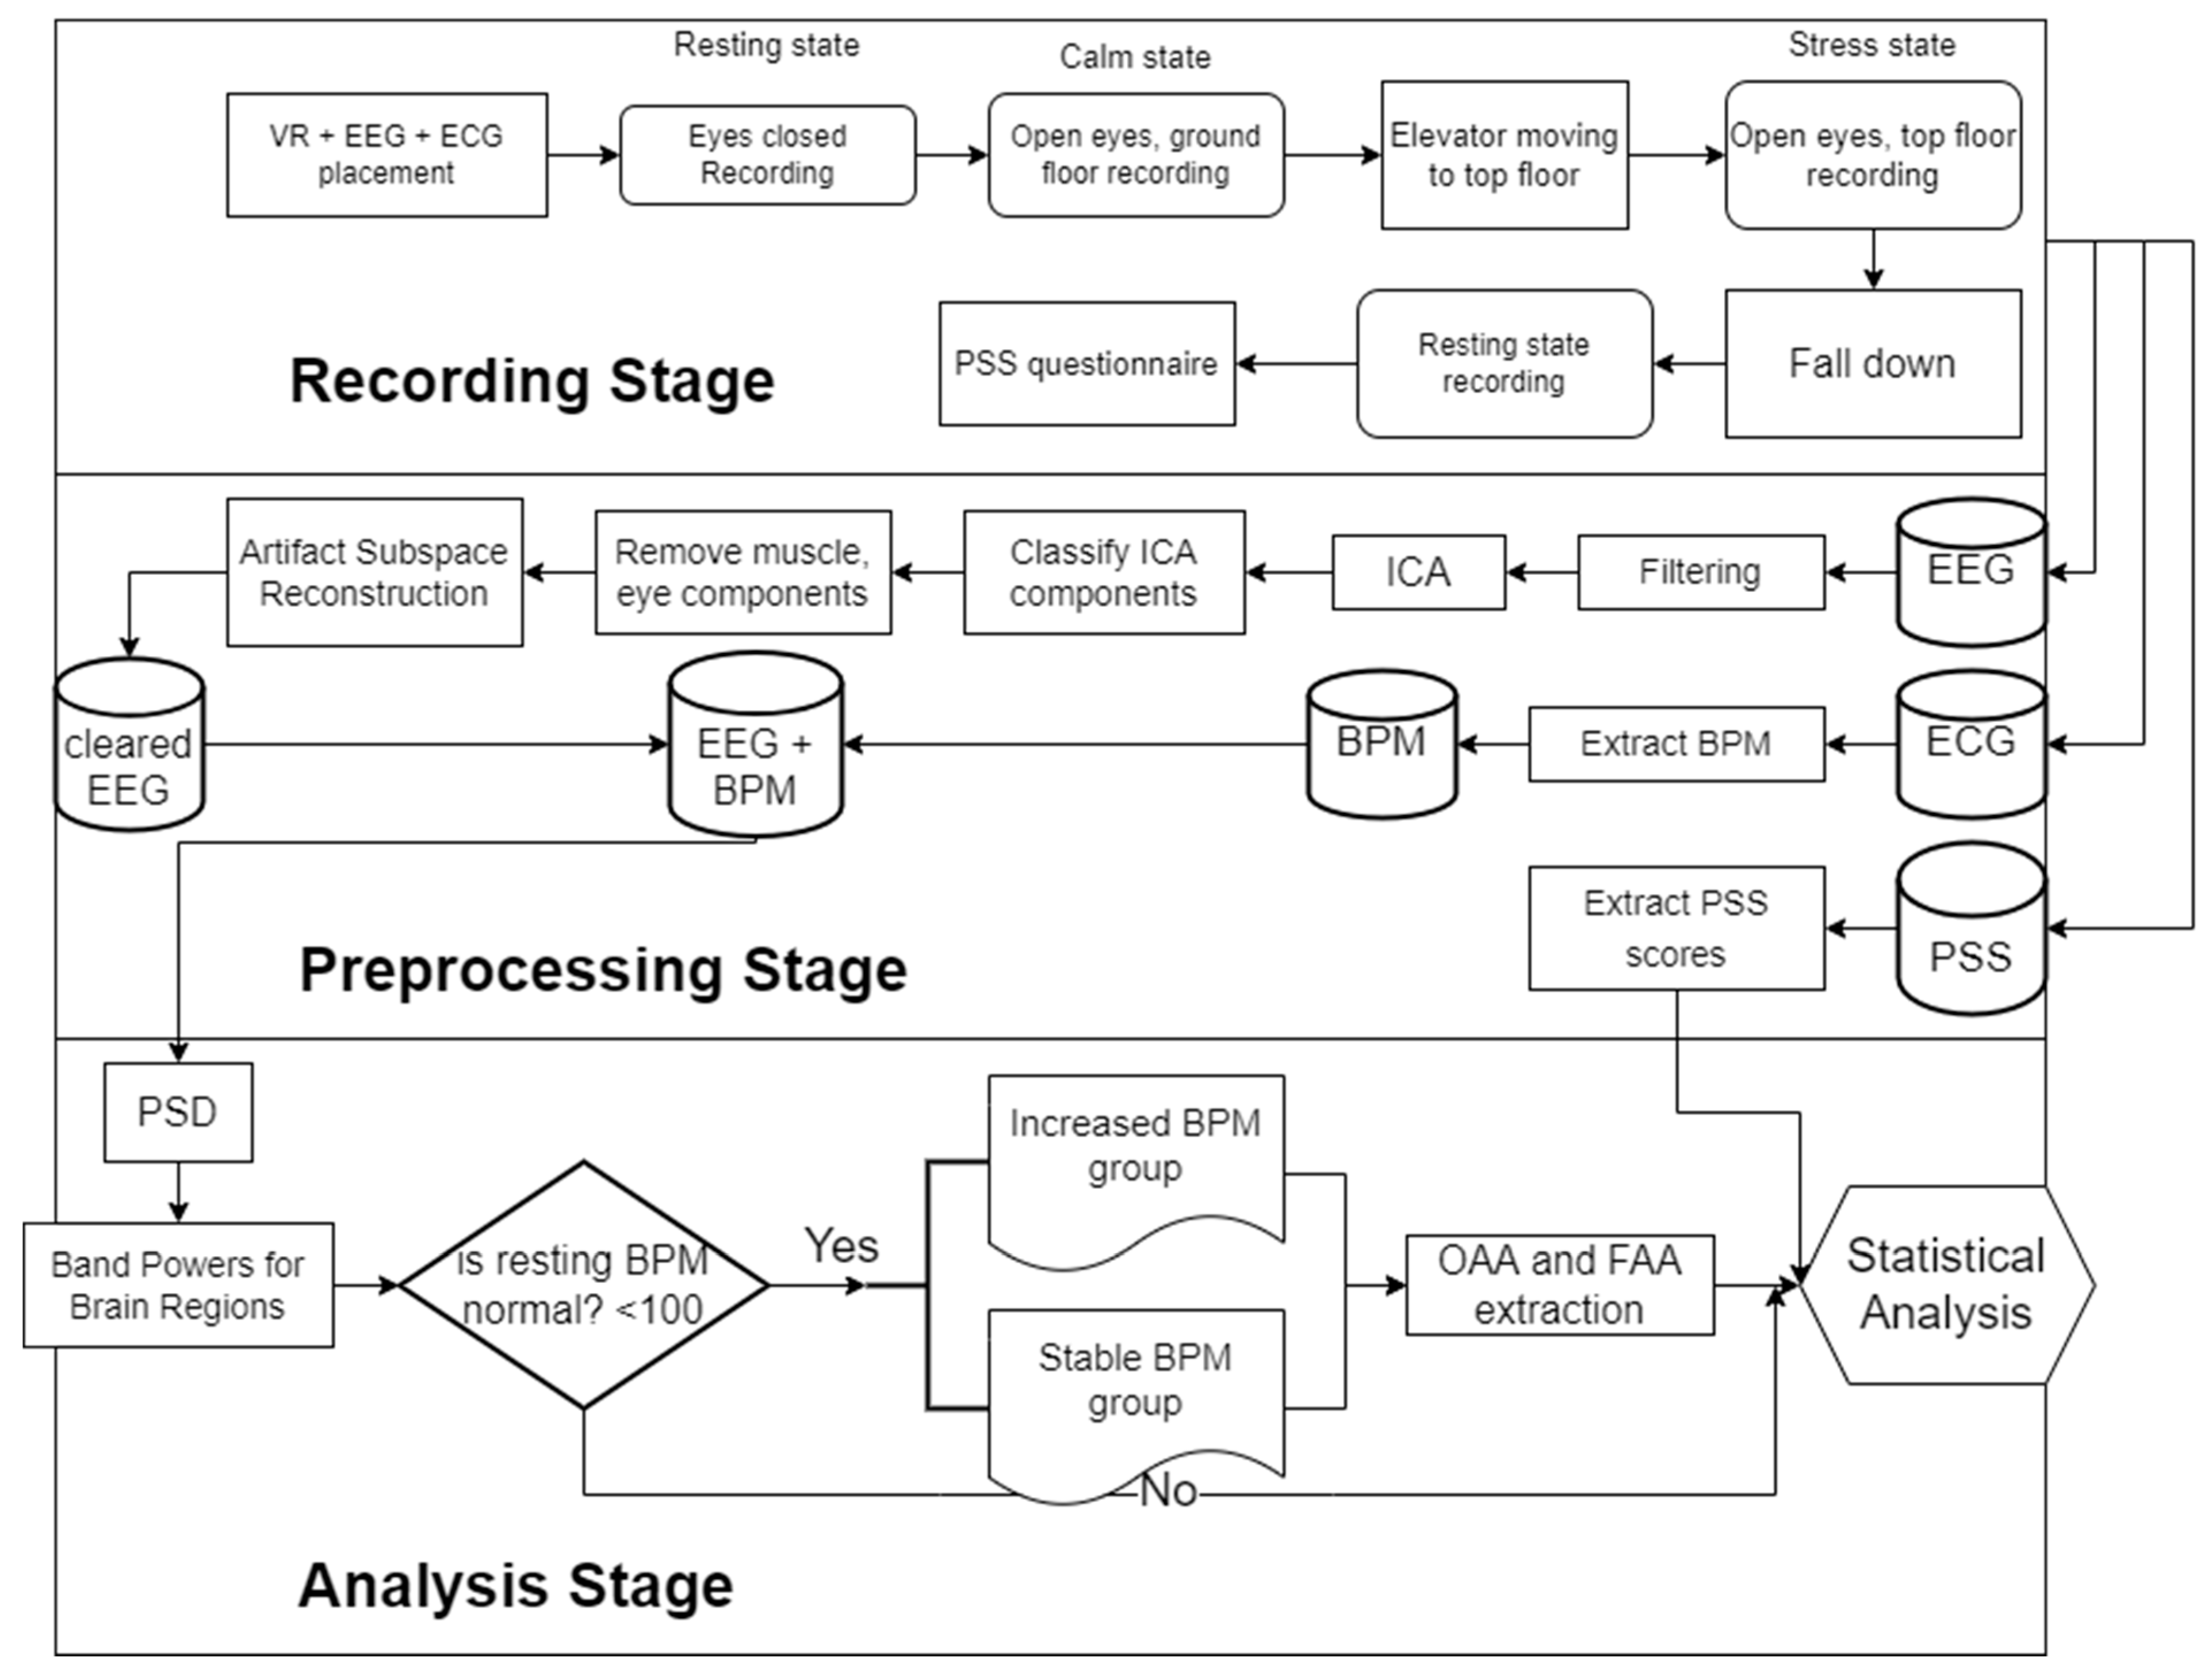
2. Materials and Methods
2.1. Subjects
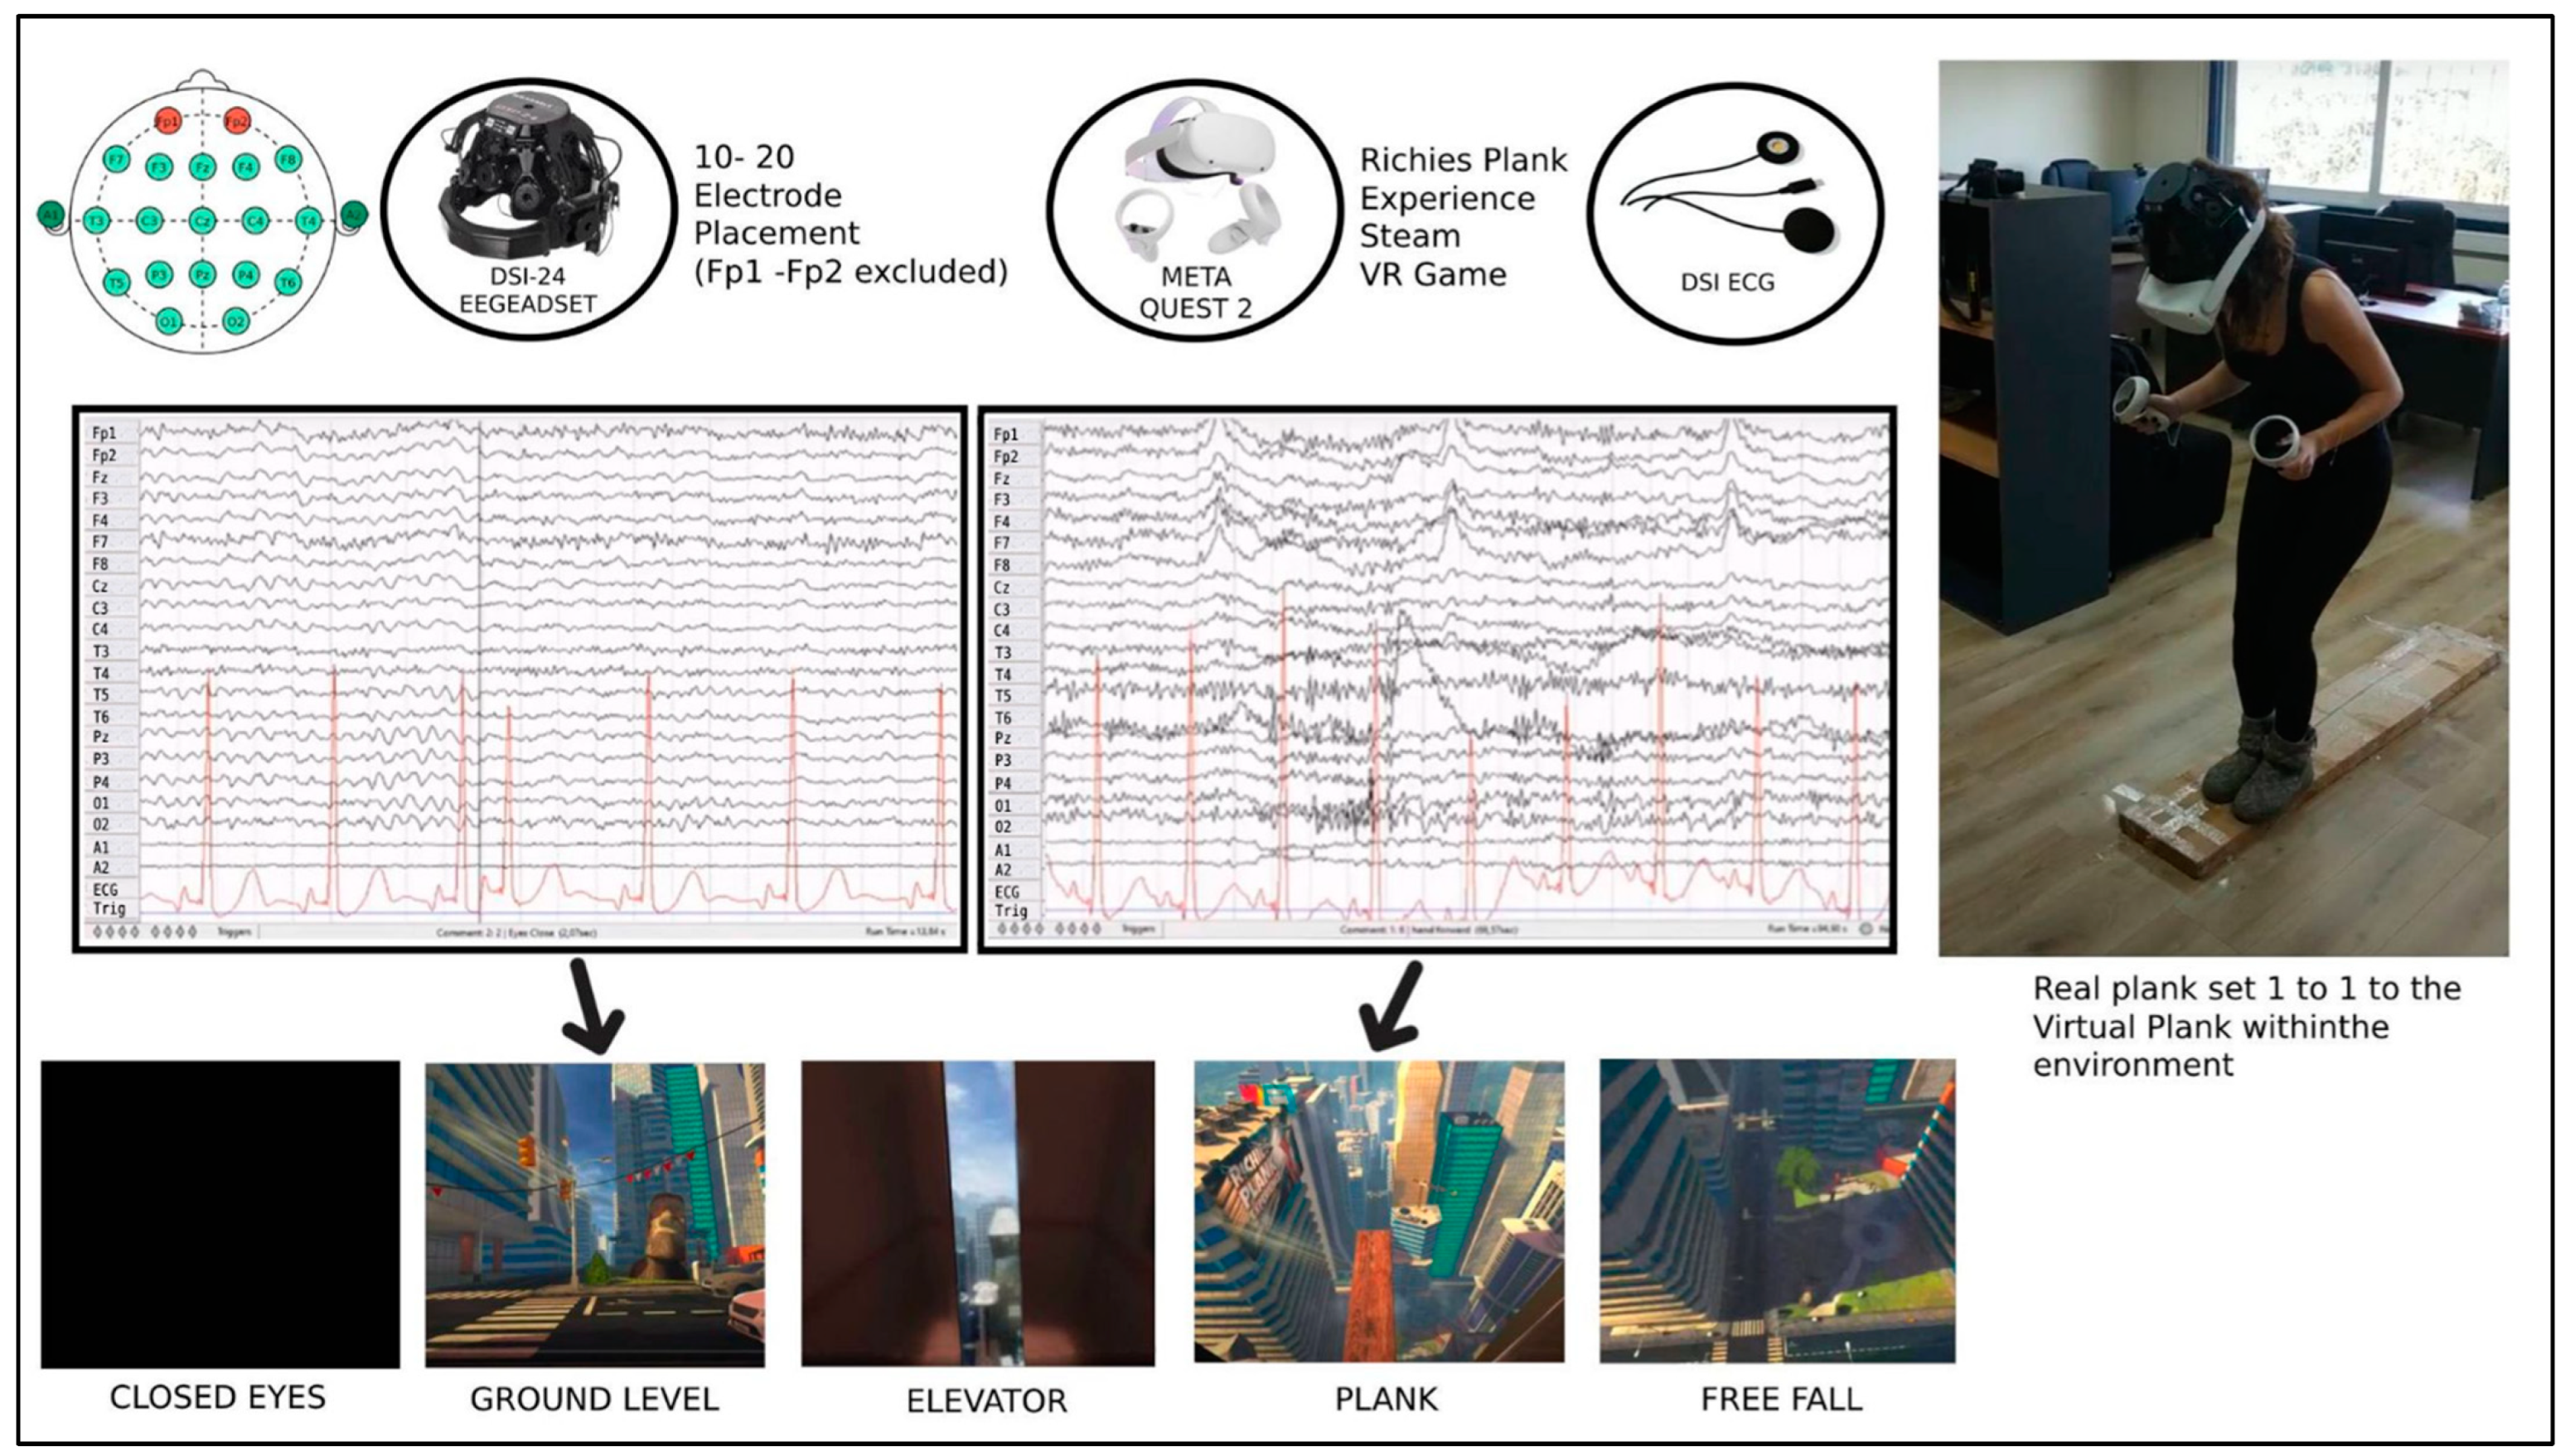
2.2. Experimental Protocol and Data Acquisition
Perceived Stress Scale Questionnaire
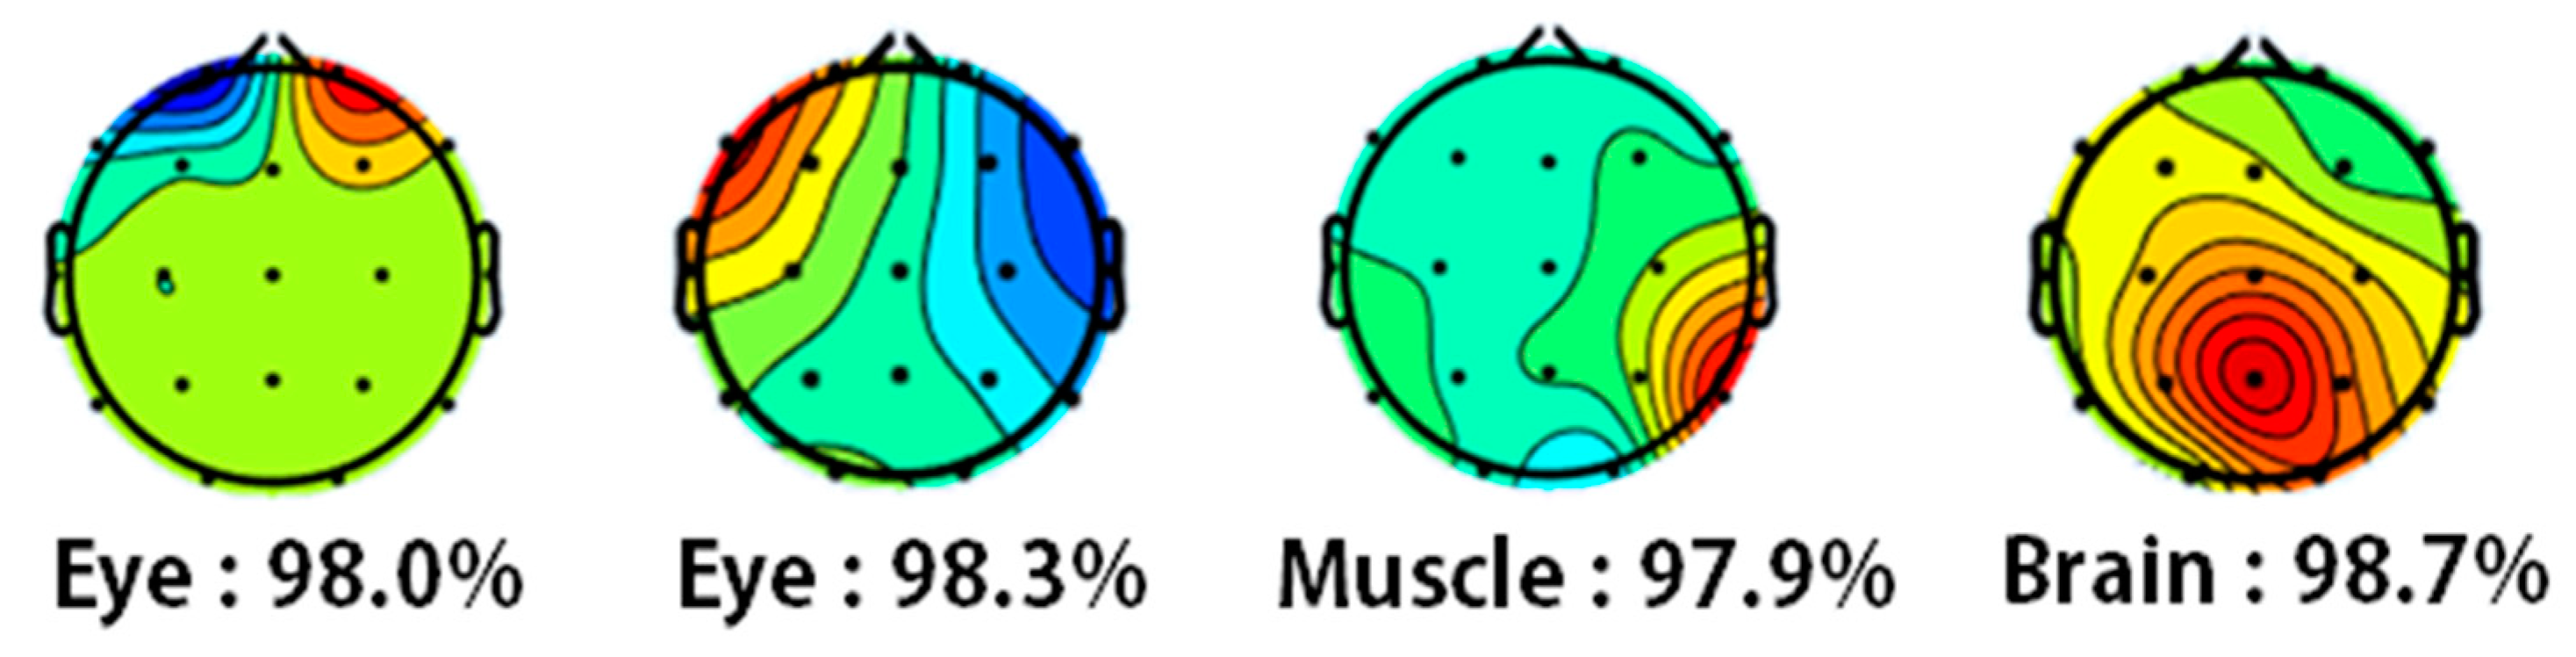
2.3. Data Preprocessing
- Delta: 0.5–4 Hz
- Theta: 4–8 Hz
- Alpha 8–13 Hz
- Beta: 13–25 Hz
- Gamma: 25–45 Hz
2.4. Feature Extraction
2.4.1. Brain Region Power
- Occipital = {O1,O2}
- Temporal = {T3, T5, T6, T4}
- Parietal = {C3, Cz, C4, P3, Pz, P4}
- Frontal = { F7, F3, F4, F8}
2.4.2. Asymmetry Measures
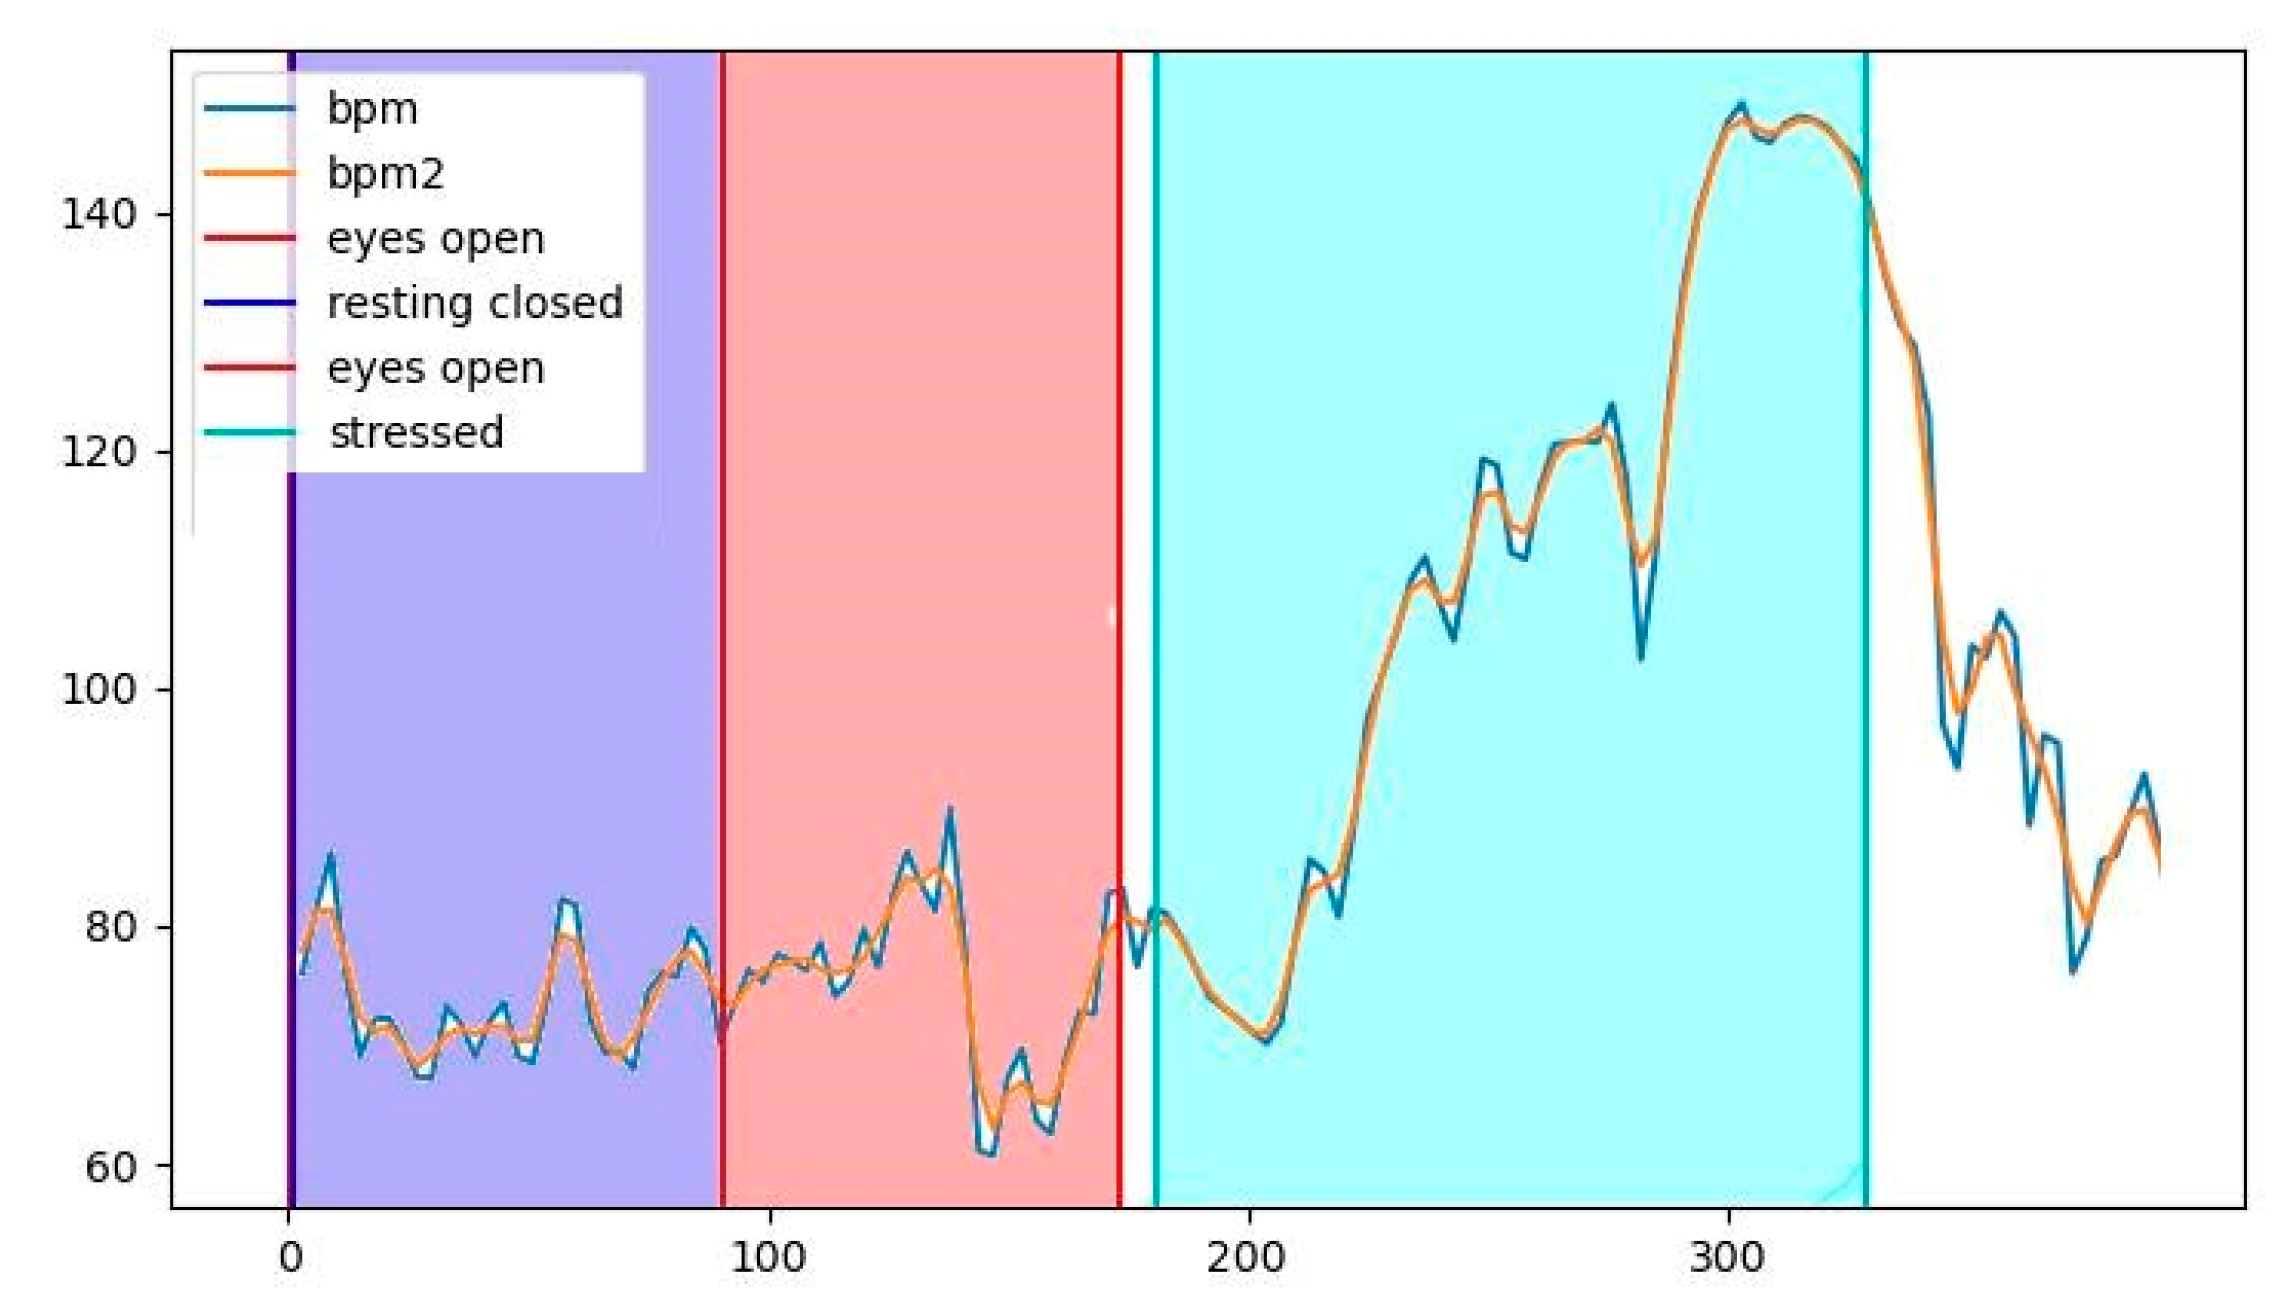
2.4.3. Heart Rate Measures
2.5. Statistical Analysis
3. Results
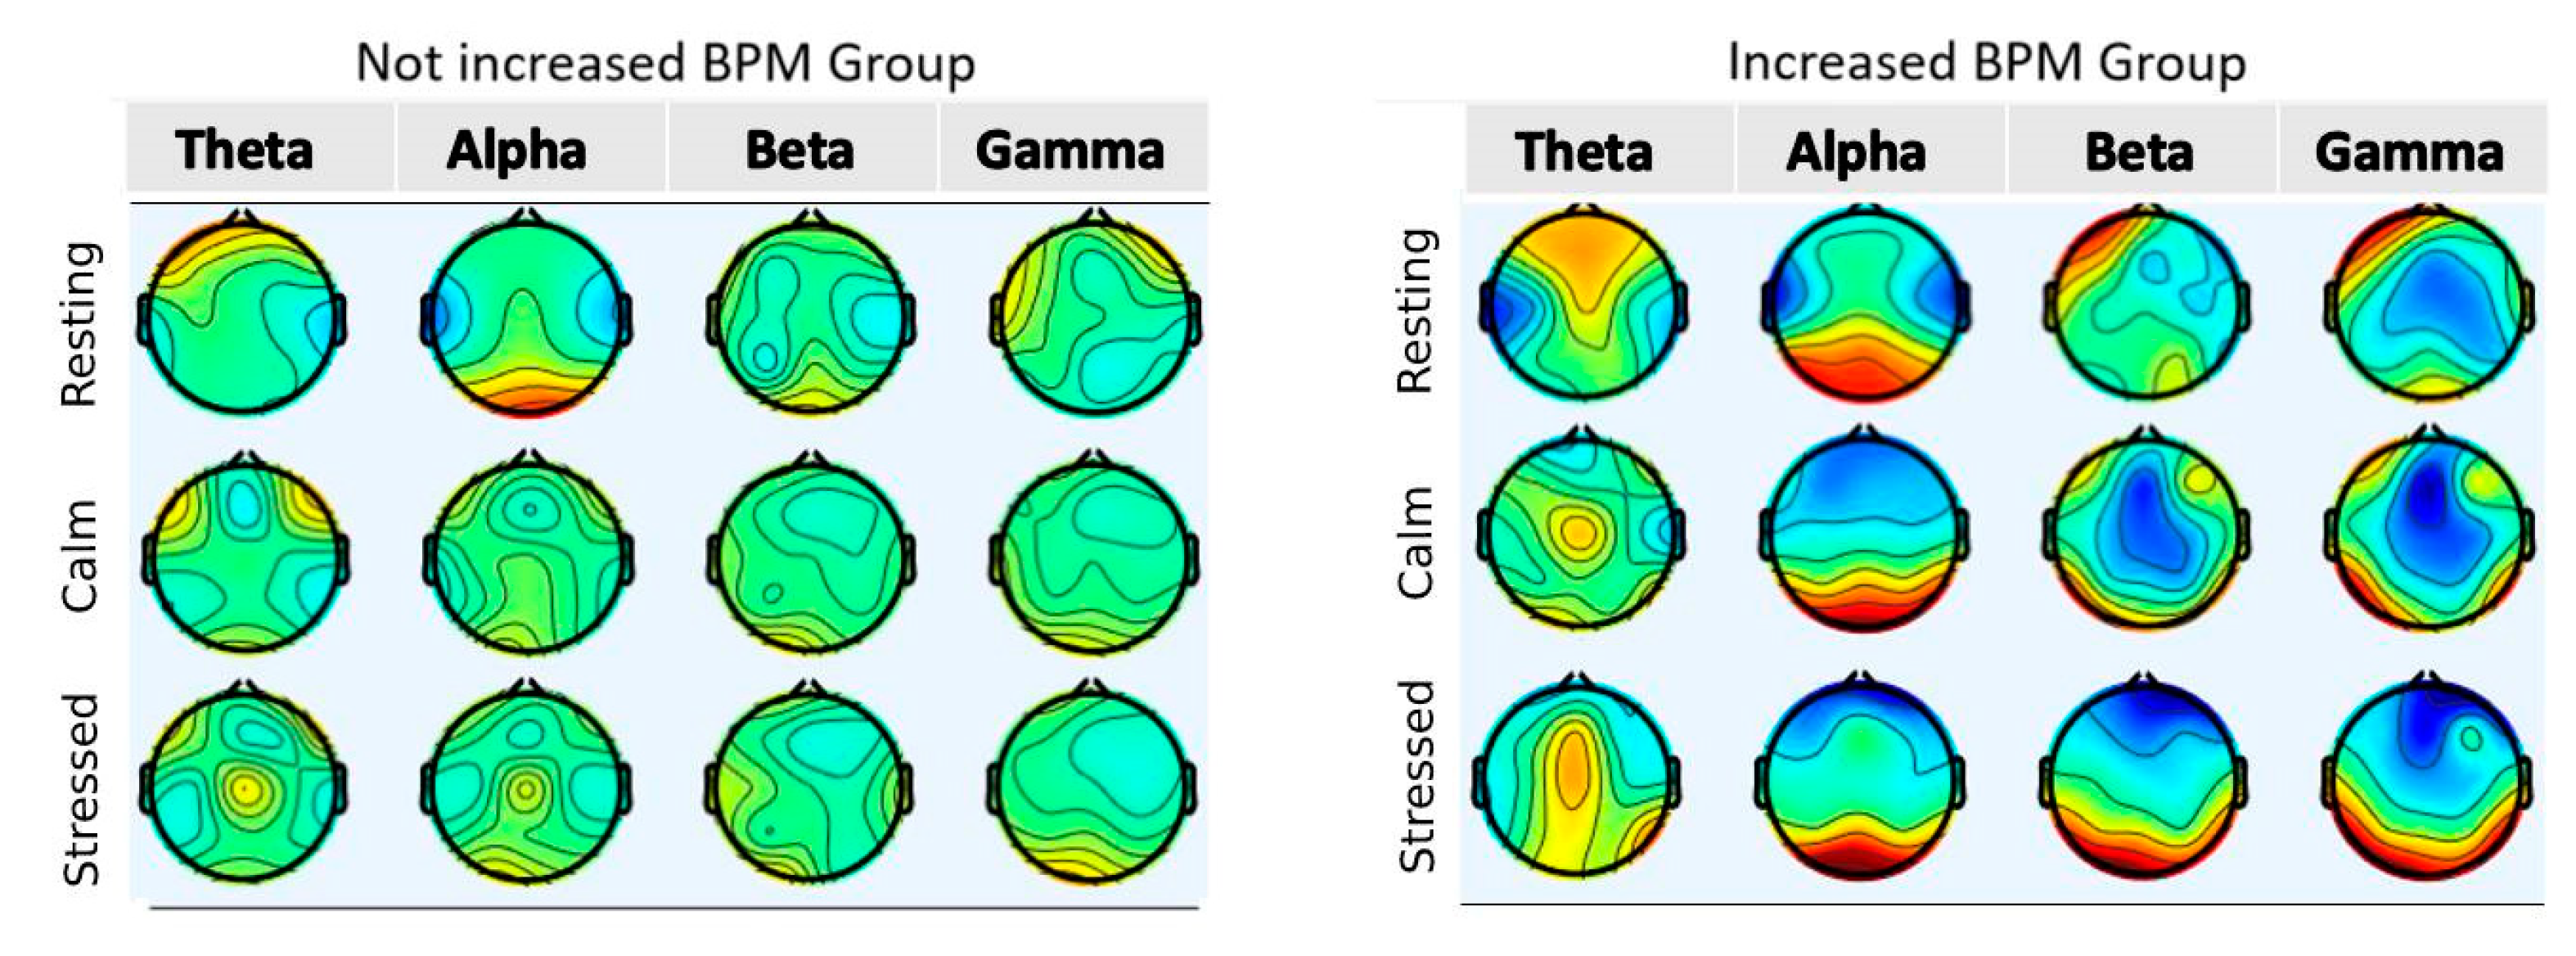
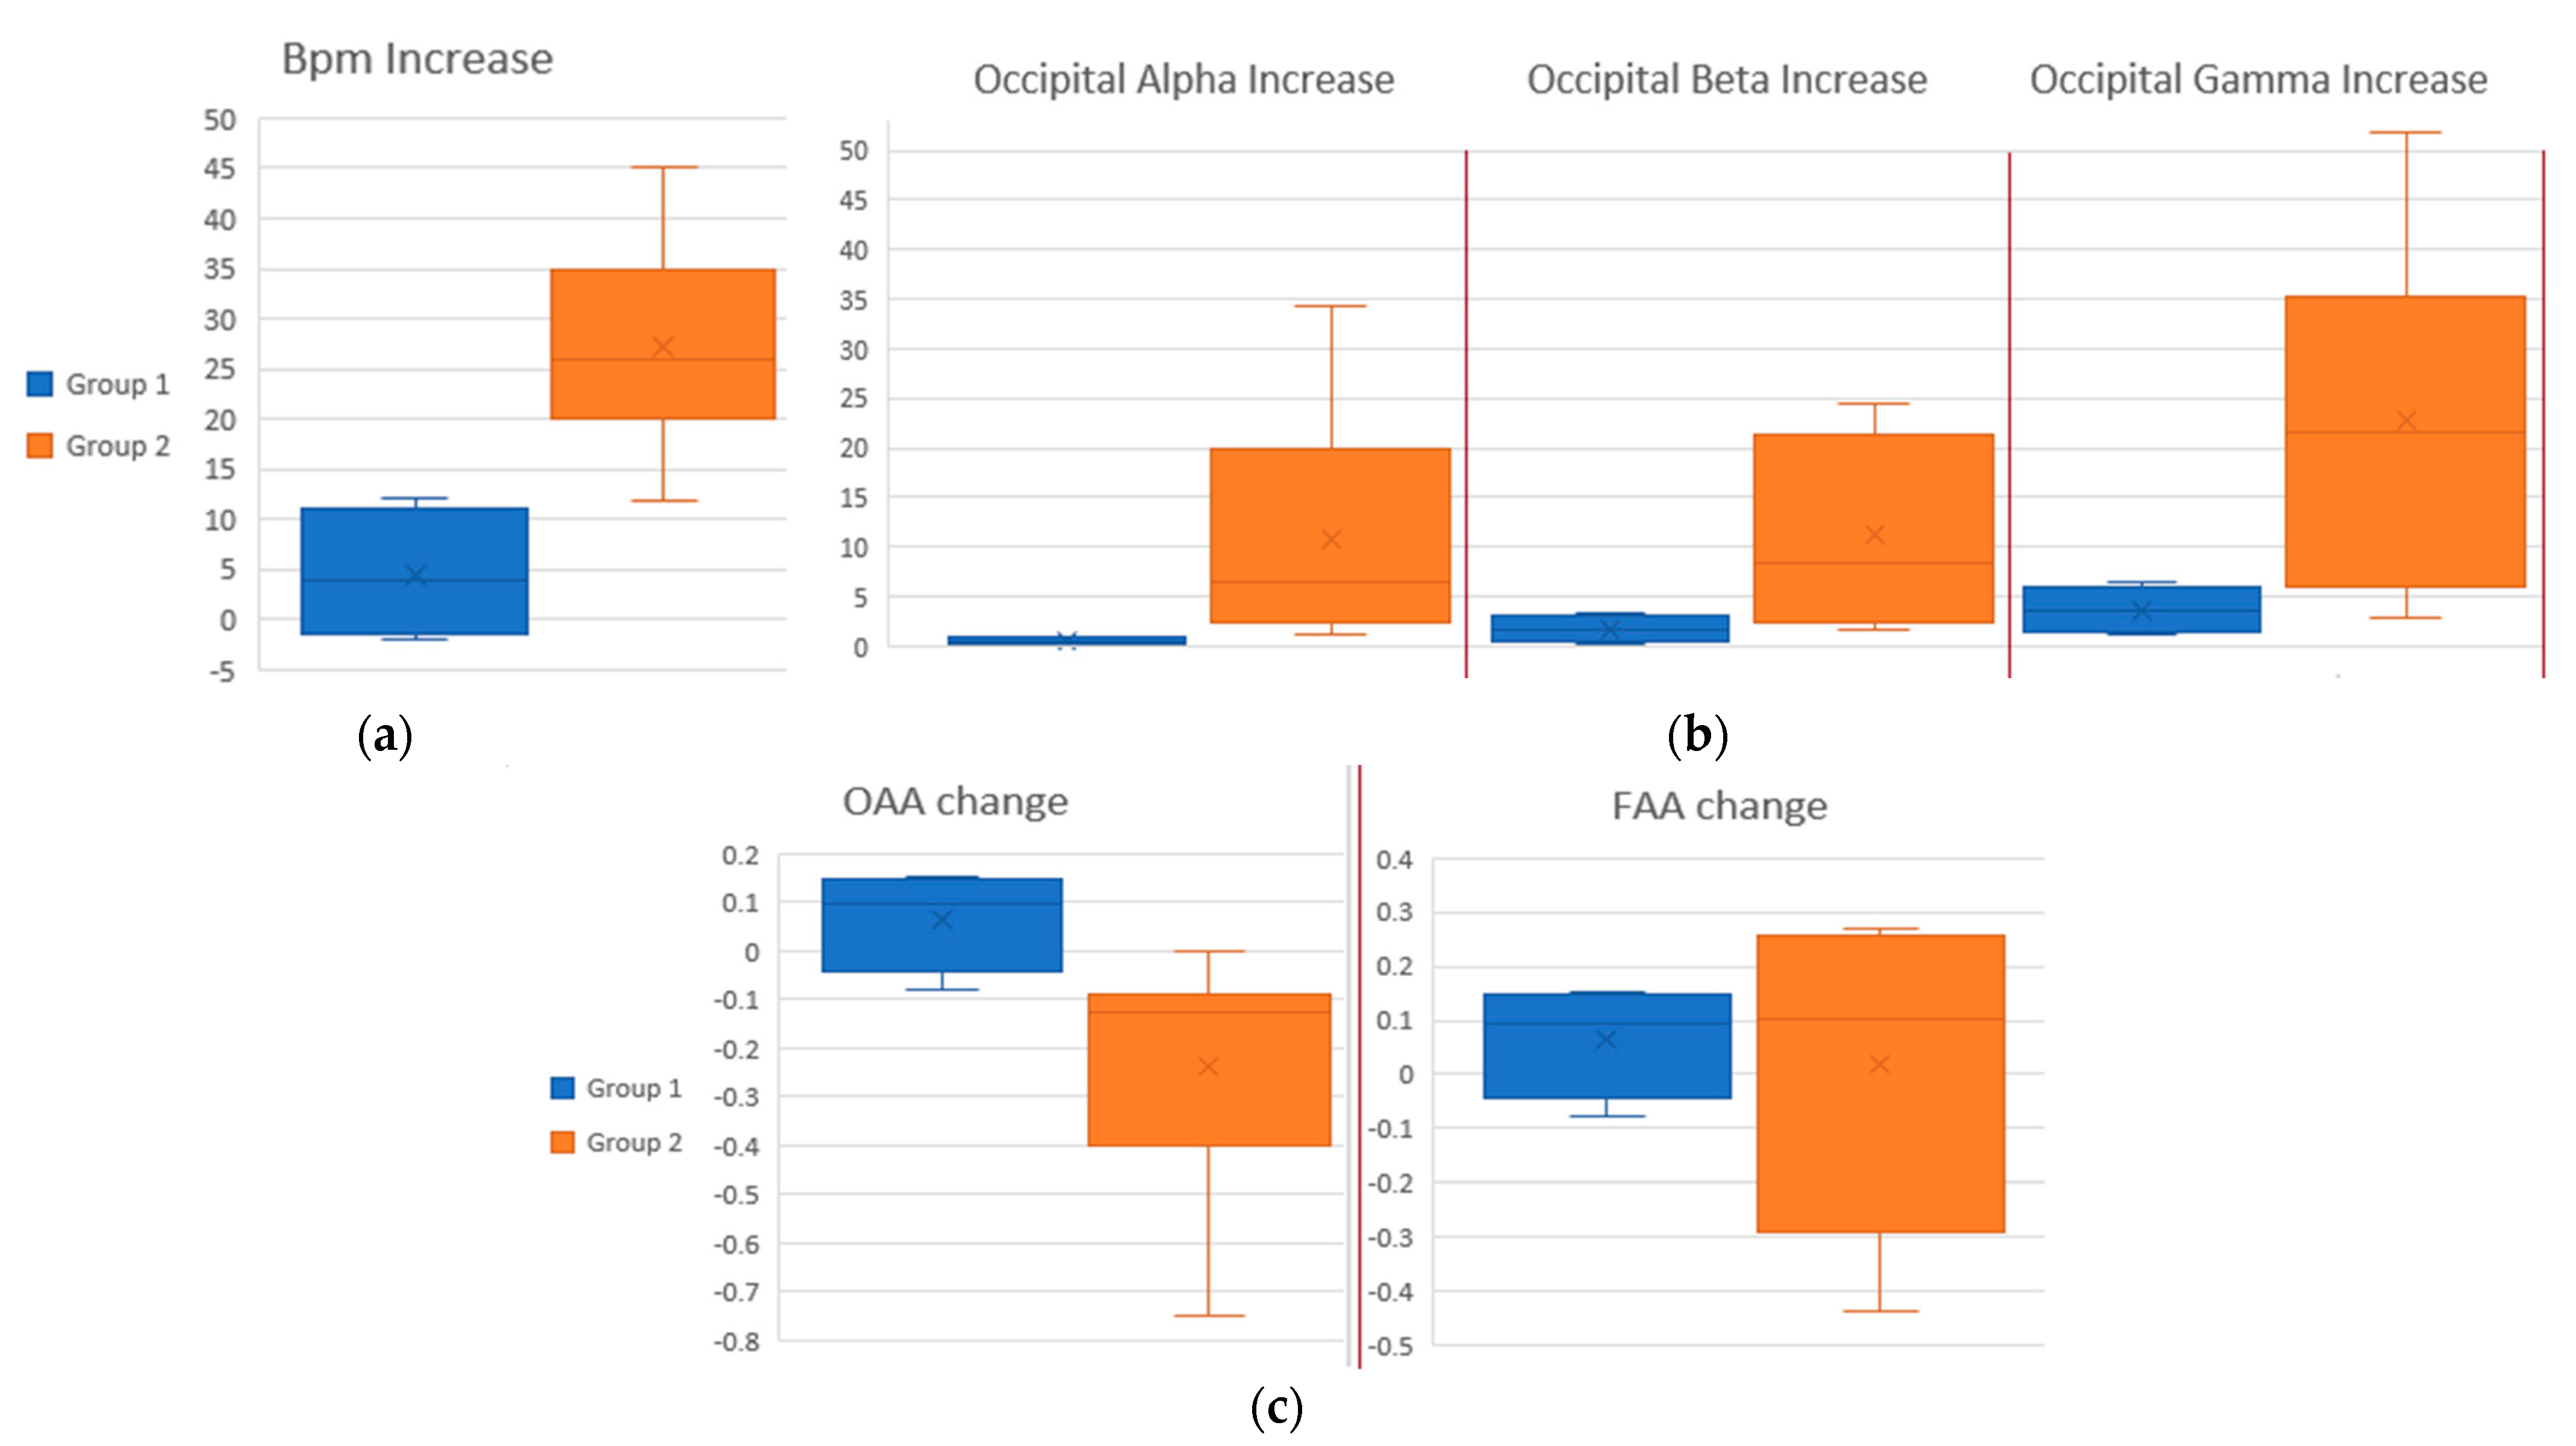
3.1. Group Analysis
3.2. Correlation Analysis
4. Discussion
5. Conclusions
Author Contributions
Funding
Institutional Review Board Statement
Informed Consent Statement
Data Availability Statement
Acknowledgments
Conflicts of Interest
Appendix A

| ID | Gender | Age | PSS Score | VR Experience |
|---|---|---|---|---|
| 1 | F | 19 | 12 | 0 |
| 2 | M | 19 | 18 | 0 |
| 3 | M | 19 | 9 | 0 |
| 4 | M | 19 | 19 | 2 |
| 5 | F | 19 | 24 | 0 |
| 6 | F | 19 | 19 | 1 |
| 7 | M | 19 | 18 | 0 |
| 8 | F | 21 | 20 | 0 |
| 9 | M | 20 | 19 | 0 |
| 10 | M | 19 | 7 | 0 |
| 11 | F | 22 | 19 | 0 |
| 12 | M | 27 | 7 | 0 |
| 13 | M | 23 | 16 | 0 |
| 14 | F | 19 | 16 | 0 |
| 15 | M | 19 | 11 | 0 |
| 16 | M | 29 | 11 | 0 |
| 17 | F | 19 | 14 | 0 |
| 18 | M | 27 | 10 | 0 |
| 19 | F | 25 | 19 | 0 |
| 20 | F | 22 | 23 | 0 |
| 21 | M | 21 | 21 | 0 |
References
- Koolhaas, J.M.; Bartolomucci, A.; Buwalda, B.; de Boer, S.F.; Flügge, G.; Korte, S.M.; Meerlo, P.; Murison, R.; Olivier, B.; Palanza, P.; et al. Stress Revisited: A Critical Evaluation of the Stress Concept. Neurosci. Biobehav. Rev. 2011, 35, 1291–1301. [Google Scholar] [CrossRef] [PubMed]
- Tavakoli, M. A Positive Approach to Stress, Resistance, and Organizational Change. Procedia-Soc. Behav. Sci. 2010, 5, 1794–1798. [Google Scholar] [CrossRef] [Green Version]
- Yaribeygi, H.; Panahi, Y.; Sahraei, H.; Johnston, T.P.; Sahebkar, A. The Impact of Stress on Body Function: A Review. EXCLI J. 2017, 16, 1057–1072. [Google Scholar] [PubMed]
- Katmah, R.; Al-Shargie, F.; Tariq, U.; Babiloni, F.; Al-Mughairbi, F.; Al-Nashash, H. A Review on Mental Stress Assessment Methods Using EEG Signals. Sensors 2021, 21, 5043. [Google Scholar] [CrossRef] [PubMed]
- Giannakakis, G.; Grigoriadis, D.; Giannakaki, K.; Simantiraki, O.; Roniotis, A.; Tsiknakis, M. Review on Psychological Stress Detection Using Biosignals. IEEE Trans. Affect. Comput. 2022, 13, 440–460. [Google Scholar] [CrossRef]
- Frisch, J.U.; Häusser, J.A.; Mojzisch, A. The Trier Social Stress Test as a Paradigm to Study How People Respond to Threat in Social Interactions. Front. Psychol. 2015, 6, 14. [Google Scholar] [CrossRef] [PubMed]
- Shilton, A.L.; Laycock, R.; Crewther, S.G. The Maastricht Acute Stress Test (MAST): Physiological and Subjective Responses in Anticipation, and Post-Stress. Front. Psychol. 2017, 8, 567. [Google Scholar] [CrossRef] [Green Version]
- Bali, A.; Jaggi, A.S. Clinical Experimental Stress Studies: Methods and Assessment. Rev. Neurosci. 2015, 26, 555–579. [Google Scholar] [CrossRef]
- van Dammen, L.; Finseth, T.T.; McCurdy, B.H.; Barnett, N.P.; Conrady, R.A.; Leach, A.G.; Deick, A.F.; van Steenis, A.L.; Gardner, R.; Smith, B.L.; et al. Evoking Stress Reactivity in Virtual Reality: A Systematic Review and Meta-analysis. Neurosci. Biobehav. Rev. 2022, 138, 104709. [Google Scholar] [CrossRef] [PubMed]
- Krupić, D.; Žuro, B.; Corr, P.J. Anxiety and Threat Magnification in Subjective and Physiological Responses of Fear of Heights Induced by Virtual Reality. Personal. Individ. Differ. 2021, 169, 109720. [Google Scholar] [CrossRef]
- de Kloet, E.R.; Joëls, M.; Holsboer, F. Stress and the Brain: From Adaptation to Disease. Nat. Rev. Neurosci. 2005, 6, 463–475. [Google Scholar] [CrossRef] [PubMed]
- Miltiadous, A.; Tzimourta, K.D.; Giannakeas, N.; Tsipouras, M.G.; Afrantou, T.; Ioannidis, P.; Tzallas, A.T. Alzheimer’s Disease and Frontotemporal Dementia: A Robust Classification Method of EEG Signals and a Comparison of Validation Methods. Diagnostics 2021, 11, 1437. [Google Scholar] [CrossRef] [PubMed]
- Christodoulides, P.; Miltiadous, A.; Tzimourta, K.D.; Peschos, D.; Ntritsos, G.; Zakopoulou, V.; Giannakeas, N.; Astrakas, L.G.; Tsipouras, M.G.; Tsamis, K.I.; et al. Classification of EEG Signals from Young Adults with Dyslexia Combining a Brain Computer Interface Device and an Interactive Linguistic Software Tool. Biomed. Signal Process. Control 2022, 76, 103646. [Google Scholar] [CrossRef]
- Aspiotis, V.; Peschos, D.; Tzimourta, K.D.; Tsipouras, M.G.; Abosaleh, A.H.S.; Antoniou, E.; Giannakeas, N.; Tzallas, A.T.; Glavas, E. Active Touch Classification Using EEG Signals. In Proceedings of the 2021 6th South-East Europe Design Automation, Computer Engineering, Computer Networks and Social Media Conference (SEEDA-CECNSM), Preveza, Greece, 24–26 September 2021; IEEE: New York, NY, USA, 2021; pp. 1–5. [Google Scholar]
- Nath, R.K.; Thapliyal, H. Smart Wristband-Based Stress Detection Framework for Older Adults with Cortisol as Stress Biomarker. IEEE Trans. Consum. Electron. 2021, 67, 30–39. [Google Scholar] [CrossRef]
- Cao, J.; Zhao, Y.; Shan, X.; Wei, H.; Guo, Y.; Chen, L.; Erkoyuncu, J.A.; Sarrigiannis, P.G. Brain Functional and Effective Connectivity Based on Electroencephalography Recordings: A Review. Hum. Brain Mapp. 2022, 43, 860–879. [Google Scholar] [CrossRef] [PubMed]
- Zhang, X.; Bachmann, P.; Schilling, T.M.; Naumann, E.; Schächinger, H.; Larra, M.F. Emotional Stress Regulation: The Role of Relative Frontal Alpha Asymmetry in Shaping the Stress Response. Biol. Psychol. 2018, 138, 231–239. [Google Scholar] [CrossRef]
- Alyan, E.; Saad, N.M.; Kamel, N.; Yusoff, M.Z.; Zakariya, M.A.; Rahman, M.A.; Guillet, C.; Merienne, F. Frontal Electroencephalogram Alpha Asymmetry during Mental Stress Related to Workplace Noise. Sensors 2021, 21, 1968. [Google Scholar] [CrossRef] [PubMed]
- Quaedflieg, C.W.E.M.; Meyer, T.; Smulders, F.T.Y.; Smeets, T. The Functional Role of Individual-Alpha Based Frontal Asymmetry in Stress Responding. Biol. Psychol. 2015, 104, 75–81. [Google Scholar] [CrossRef] [PubMed]
- Marín-Morales, J.; Llinares, C.; Guixeres, J.; Alcañiz, M. Emotion Recognition in Immersive Virtual Reality: From Statistics to Affective Computing. Sensors 2020, 20, 5163. [Google Scholar] [CrossRef] [PubMed]
- Stolz, C.; Endres, D.; Mueller, E.M. Threat-conditioned Contexts Modulate the Late Positive Potential to Faces—A Mobile EEG/Virtual Reality Study. Psychophysiology 2018, 56, e13308. [Google Scholar] [CrossRef]
- Fadeev, K.A.; Smirnov, A.S.; Zhigalova, O.P.; Bazhina, P.S.; Tumialis, A.V.; Golokhvast, K.S. Too Real to Be Virtual: Autonomic and EEG Responses to Extreme Stress Scenarios in Virtual Reality. Behav. Neurol. 2020, 2020, 5758038. [Google Scholar] [CrossRef] [PubMed]
- Wang, H.; Wang, Q.; Hu, F. Are You Afraid of Heights and Suitable for Working at Height? Biomed. Signal Process. Control 2019, 52, 23–31. [Google Scholar] [CrossRef]
- Pratiher, S.; Radhakrishnan, A.; Sahoo, K.P.; Alam, S.; Kerick, S.E.; Banerjee, N.; Ghosh, N.; Patra, A. Classification of VR-Gaming Difficulty Induced Stress Levels Using Physiological (EEG & ECG) Signals and Machine Learning. UMBC Stud. 2021. [Google Scholar] [CrossRef]
- Athif, M.; Rathnayake, B.L.K.; Nagahapitiya, S.M.D.B.S.; Samarasinghe, S.A.D.A.K.; Samaratunga, P.S.; Peiris, R.L.; de Silva, A.C. Using Biosignals for Objective Measurement of Presence in Virtual Reality Environments. In Proceedings of the 2020 42nd Annual International Conference of the IEEE Engineering in Medicine & Biology Society (EMBC), Virtual, 20–24 July 2020; IEEE: New York, NY, USA, 2020; pp. 3035–3039. [Google Scholar]
- Cohen, S.; Kamarck, T.; Mermelstein, R. A Global Measure of Perceived Stress. J. Health Soc. Behav. 1983, 24, 385. [Google Scholar] [CrossRef] [PubMed]
- Delorme, A.; Makeig, S. EEGLAB: An Open Source Toolbox for Analysis of Single-Trial EEG Dynamics Including Independent Component Analysis. J. Neurosci. Methods 2004, 134, 9–21. [Google Scholar] [CrossRef] [PubMed] [Green Version]
- Hyvärinen, A.; Oja, E. Independent Component Analysis: Algorithms and Applications. Neural Netw. 2000, 13, 411–430. [Google Scholar] [CrossRef] [Green Version]
- Solomon, J.O.M. PSD Computations Using Welch’s Method. [Power Spectral Density (PSD)]; Sandia National Laboratories: Albuquerque, NM, USA; Livermore, CA, USA, 1991. [Google Scholar]
- Zhao, L.; He, Y. Power Spectrum Estimation of the Welch Method Based on Imagery EEG. Appl. Mech. Mater. 2013, 278–280, 1260–1264. [Google Scholar] [CrossRef]
- Berretz, G.; Packheiser, J.; Wolf, O.T.; Ocklenburg, S. Acute Stress Increases Left Hemispheric Activity Measured via Changes in Frontal Alpha Asymmetries. iScience 2022, 25, 103841. [Google Scholar] [CrossRef] [PubMed]
- Torpy, J.M.; Burke, A.E.; Glass, R.M. Acute Emotional Stress and the Heart. JAMA 2007, 298, 360. [Google Scholar] [CrossRef]
- Knight, W.E.J.; Rickard, N.S. Relaxing Music Prevents Stress-Induced Increases in Subjective Anxiety, Systolic Blood Pressure, and Heart Rate in Healthy Males and Females. J. Music Ther. 2001, 38, 254–272. [Google Scholar] [CrossRef] [PubMed]
- Steiner, H.; Ryst, E.; Berkowitz, J.; Gschwendt, M.A.; Koopman, C. Boys’ and Girls’ Responses to Stress: Affect and Heart Rate during a Speech Task. J. Adolesc. Health 2002, 30, 14–21. [Google Scholar] [CrossRef]
- Taelman, J.; Vandeput, S.; Spaepen, A.; van Huffel, S. Influence of Mental Stress on Heart Rate and Heart Rate Variability. In Proceedings of the 4th European Conference of the International Federation for Medical and Biological Engineering, Antwerp, Belgium, 23–27 November 2008; pp. 1366–1369. [Google Scholar]
- Corrigan, S.L.; Roberts, S.; Warmington, S.; Drain, J.; Main, L.C. Monitoring Stress and Allostatic Load in First Responders and Tactical Operators Using Heart Rate Variability: A Systematic Review. BMC Public Health 2021, 21, 1701. [Google Scholar] [CrossRef] [PubMed]
- Sahoo, K.P.; Radhakrishnan, A.; Pratiher, S.; Alam, S.; Kerick, S.; Ghosh, N.; Chhan, D.; Banerjee, N.; Patra, A. Alterations in Multi-Channel EEG Dynamics During a Stressful Shooting Task in Virtual Reality Systems. In Proceedings of the 2021 43rd Annual International Conference of the IEEE Engineering in Medicine & Biology Society (EMBC), Virtual, 1–5 November 2021; IEEE: New York, NY, USA, 2021; pp. 6207–6210. [Google Scholar]
- Stoeve, M.; Wirth, M.; Farlock, R.; Antunovic, A.; Müller, V.; Eskofier, B.M. Eye Tracking-Based Stress Classification of Athletes in Virtual Reality. Proc. ACM Comput. Graph. Interact. Tech. 2022, 5, 1–17. [Google Scholar] [CrossRef]
- Sanchez, D.R.; Weiner, E.; van Zelderen, A. Virtual Reality Assessments (VRAs): Exploring the Reliability and Validity of Evaluations in VR. Int. J. Sel. Assess. 2022, 30, 103–125. [Google Scholar] [CrossRef]
- Kalatzis, A.; Stanley, L.; Prabhu, V.G. Affective State Classification in Virtual Reality Environments Using Electrocardiogram and Respiration Signals. In Proceedings of the 2021 IEEE International Conference on Artificial Intelligence and Virtual Reality (AIVR), Taichung, Taiwan, 15–17 November 2021; IEEE: New York, NY, USA, 2021; pp. 160–167. [Google Scholar]
- Hu, F.; Wang, H.; Chen, J.; Gong, J. Research on the Characteristics of Acrophobia in Virtual Altitude Environment. In Proceedings of the 2018 IEEE International Conference on Intelligence and Safety for Robotics (ISR), Shenyang, China, 24–27 August 2018; IEEE: New York, NY, USA, 2018; pp. 238–243. [Google Scholar]
- Vanhollebeke, G.; de Smet, S.; de Raedt, R.; Baeken, C.; van Mierlo, P.; Vanderhasselt, M.-A. The Neural Correlates of Psychosocial Stress: A Systematic Review and Meta-Analysis of Spectral Analysis EEG Studies. Neurobiol. Stress 2022, 18, 100452. [Google Scholar] [CrossRef] [PubMed]
- Paszkiel, S.; Dobrakowski, P.; Łysiak, A. The Impact of Different Sounds on Stress Level in the Context of EEG, Cardiac Measures and Subjective Stress Level: A Pilot Study. Brain Sci. 2020, 10, 728. [Google Scholar] [CrossRef] [PubMed]
- Reznik, S.J.; Allen, J.J.B. Frontal Asymmetry as a Mediator and Moderator of Emotion: An Updated Review. Psychophysiology 2018, 55, e12965. [Google Scholar] [CrossRef]
- Meyer, T.; Smeets, T.; Giesbrecht, T.; Quaedflieg, C.W.E.M.; Smulders, F.T.Y.; Meijer, E.H.; Merckelbach, H.L.G.J. The Role of Frontal EEG Asymmetry in Post-Traumatic Stress Disorder. Biol. Psychol. 2015, 108, 62–77. [Google Scholar] [CrossRef]
- Schneider, M.; Chau, L.; Mohamadpour, M.; Stephens, N.; Arya, K.; Grant, A. EEG Asymmetry and BIS/BAS among Healthy Adolescents. Biol. Psychol. 2016, 120, 142–148. [Google Scholar] [CrossRef] [Green Version]
- Thayer, J.F.; Åhs, F.; Fredrikson, M.; Sollers, J.J.; Wager, T.D. A Meta-Analysis of Heart Rate Variability and Neuroimaging Studies: Implications for Heart Rate Variability as a Marker of Stress and Health. Neurosci. Biobehav. Rev. 2012, 36, 747–756. [Google Scholar] [CrossRef]
- Hamid, N.H.A.; Sulaiman, N.; Murat, Z.H.; Taib, M.N. Brainwaves Stress Pattern Based on Perceived Stress Scale Test. In Proceedings of the 2015 IEEE 6th Control and System Graduate Research Colloquium (ICSGRC), Shah Alam, Malaysia, 10–11 August 2015; IEEE: New York, NY, USA, 2015; pp. 135–140. [Google Scholar]

| Calm-Stress | t | One-Sided p | Two-Sided p | |
|---|---|---|---|---|
| Frontal | Alpha | −2.036 | 0.030 * | 0.060 |
| Beta | −1.890 | 0.039 * | 0.078 | |
| Gamma | −1.239 | 0.117 | 0.234 | |
| Parietal | Alpha | −3.620 | 0.001 * | 0.003 * |
| Beta | −4.265 | 0.000 * | 0.001 * | |
| Gamma | −4.359 | 0.000 * | 0.001 * | |
| Temporal | Alpha | −3.807 | 0.001 * | 0.002 * |
| Beta | −3.315 | 0.002 * | 0.005 * | |
| Gamma | −3.039 | 0.004 * | 0.008 * | |
| Occipital | Alpha | −2.701 | 0.008 * | 0.016 * |
| Beta | −3.823 | 0.001 * | 0.002 * | |
| Gamma | −4.506 | 0.000 * | 0.000 * | |
| BPM | −4.327 | 0.000 * | 0.001 * | |
| FAA | −0.599 | 0.279 | 0.557 | |
| OAA | 1.008 | 0.164 | 0.328 |
| OAA Calm–Stressed | FAA Calm–Stressed | |||||
|---|---|---|---|---|---|---|
| t | One-Sided p | Two-Sided p | t | One-Sided p | Two-Sided p | |
| Group 2 | 2.733 | 0.015 * | 0.029 * | −0.203 | 0.422 | 0.845 |
| Group 1 | −1.971 | 0.072 | 0.143 | −1.269 | 0.147 | 0.294 |
| PSS Score | t-Test Significance | Mann–Whitney U-Test | |||||||||
|---|---|---|---|---|---|---|---|---|---|---|---|
| Mean | Std. Dev | One-Sided p | Two-Sided p | Sum of Ranks | Expected Sum of Ranks | Mean of Ranks | Expected Mean of Ranks | U-Value | Expected U-Value | Critical U-Value at p < 0.05 | |
| Group 1 | 13.42 | 4.03 | 0.208 | 0.416 | 84 | 76.5 | 9.33 | 8.5 | 24 | 31.5 | 12 |
| Group 2 | 15.55 | 6.08 | 52 | 59.5 | 7.43 | 8.5 | 39 | 31.5 | |||
| Frontal | ||||
|---|---|---|---|---|
| Delta | Theta | Alpha | Beta | Gamma |
| 0.16 | 0.18 | 0.37 | 0.23 | 0.24 |
| Temporal | ||||
| Delta | Theta | Alpha | Beta | Gamma |
| 0 | 0.26 | 0.47 | 0.32 | 0.31 |
| Parietal | ||||
| Delta | Theta | Alpha | Beta | Gamma |
| 0.17 | 0.079 | 0.44 | 0.31 | 0.22 |
| Occipital | ||||
| Delta | Theta | Alpha | Beta | Gamma |
| 0.64 * | 0.5 * | 0.55 * | 0.44 | 0.43 |
| Frontal | ||||
|---|---|---|---|---|
| Delta | Theta | Alpha | Beta | Gamma |
| 0.22 | 0.41 | 0.39 | 0.5 * | 0.52 * |
| Parietal | ||||
| Delta | Theta | Alpha | Beta | Gamma |
| 0.31 | 0.22 | 0.38 | 0.56 * | 0.71 ** |
| Temporal | ||||
| Delta | Theta | Alpha | Beta | Gamma |
| 0.35 | 0.48 | 0.38 | 0.7 ** | 0.6 * |
| Occipital | ||||
| Delta | Theta | Alpha | Beta | Gamma |
| 0.11 | −0.15 | 0.32 | 0.53 * | 0.56 * |
| BPM | ||||
| 0.058 | ||||
Publisher’s Note: MDPI stays neutral with regard to jurisdictional claims in published maps and institutional affiliations. |
© 2022 by the authors. Licensee MDPI, Basel, Switzerland. This article is an open access article distributed under the terms and conditions of the Creative Commons Attribution (CC BY) license (https://creativecommons.org/licenses/by/4.0/).
Share and Cite
Aspiotis, V.; Miltiadous, A.; Kalafatakis, K.; Tzimourta, K.D.; Giannakeas, N.; Tsipouras, M.G.; Peschos, D.; Glavas, E.; Tzallas, A.T. Assessing Electroencephalography as a Stress Indicator: A VR High-Altitude Scenario Monitored through EEG and ECG. Sensors 2022, 22, 5792. https://doi.org/10.3390/s22155792
Aspiotis V, Miltiadous A, Kalafatakis K, Tzimourta KD, Giannakeas N, Tsipouras MG, Peschos D, Glavas E, Tzallas AT. Assessing Electroencephalography as a Stress Indicator: A VR High-Altitude Scenario Monitored through EEG and ECG. Sensors. 2022; 22(15):5792. https://doi.org/10.3390/s22155792
Chicago/Turabian StyleAspiotis, Vasileios, Andreas Miltiadous, Konstantinos Kalafatakis, Katerina D. Tzimourta, Nikolaos Giannakeas, Markos G. Tsipouras, Dimitrios Peschos, Euripidis Glavas, and Alexandros T. Tzallas. 2022. "Assessing Electroencephalography as a Stress Indicator: A VR High-Altitude Scenario Monitored through EEG and ECG" Sensors 22, no. 15: 5792. https://doi.org/10.3390/s22155792
APA StyleAspiotis, V., Miltiadous, A., Kalafatakis, K., Tzimourta, K. D., Giannakeas, N., Tsipouras, M. G., Peschos, D., Glavas, E., & Tzallas, A. T. (2022). Assessing Electroencephalography as a Stress Indicator: A VR High-Altitude Scenario Monitored through EEG and ECG. Sensors, 22(15), 5792. https://doi.org/10.3390/s22155792