
Estimation of Head Accelerations in Crashes Using Neural Networks and Sensors Embedded in the Protective Helmet


Abstract
1. Introduction
2. Materials and Methods
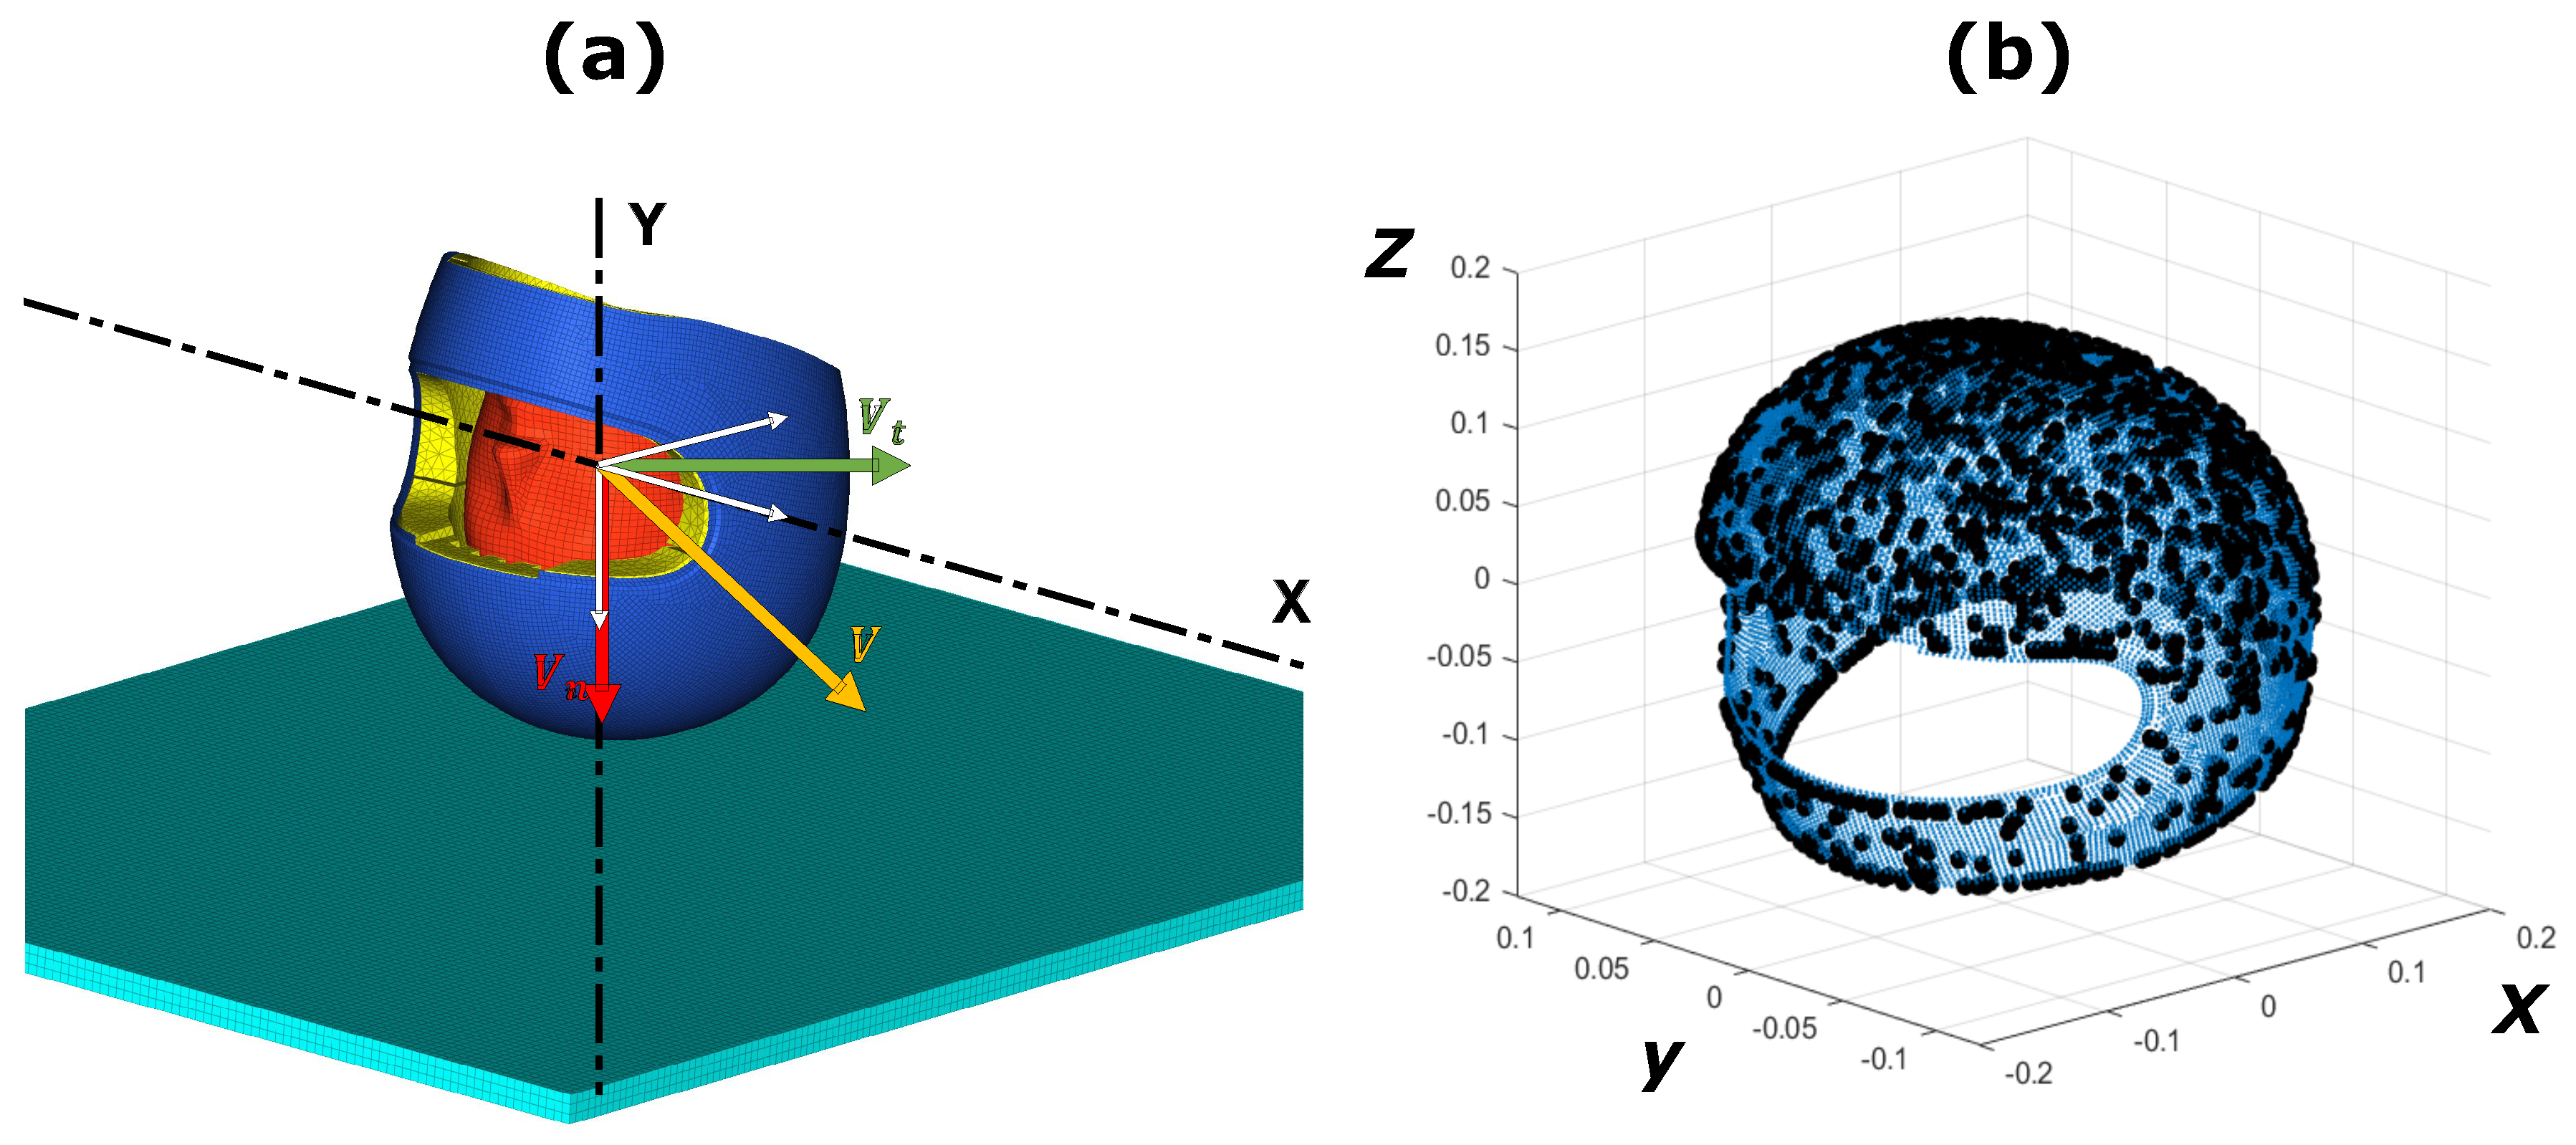
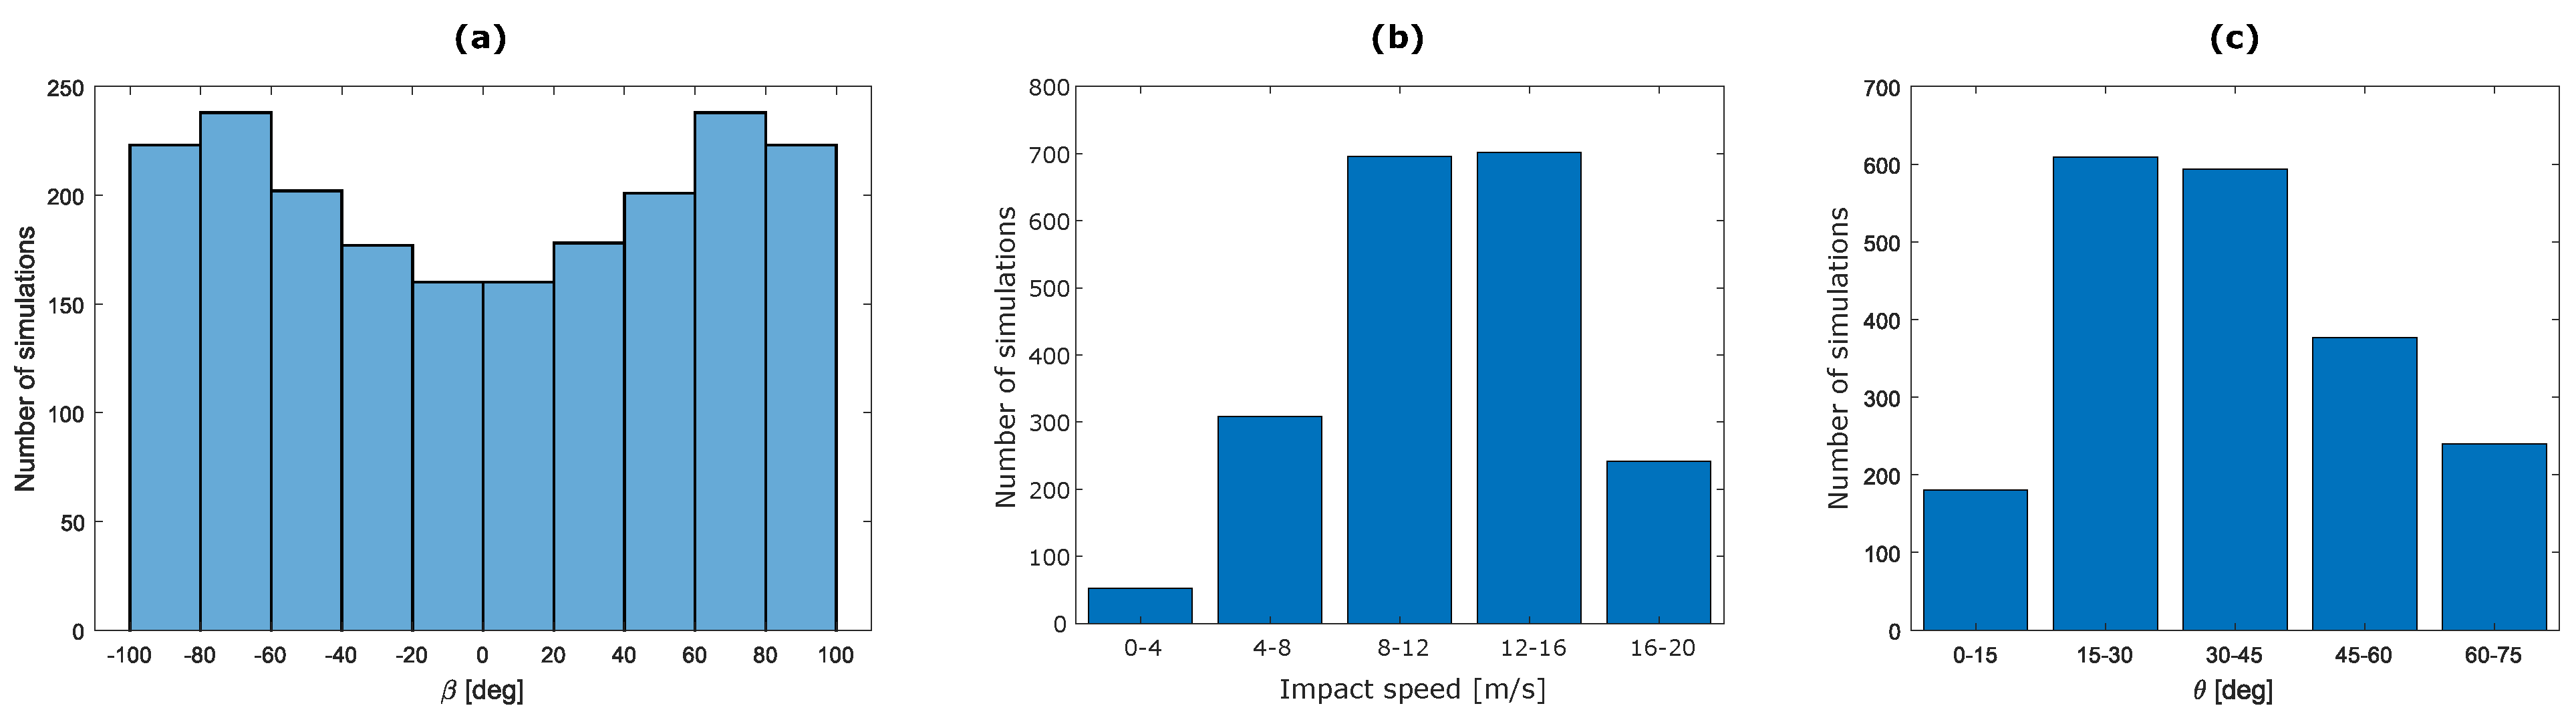
2.1. Head Impact Scenarios
2.2. Finite Element Head and Helmet Model
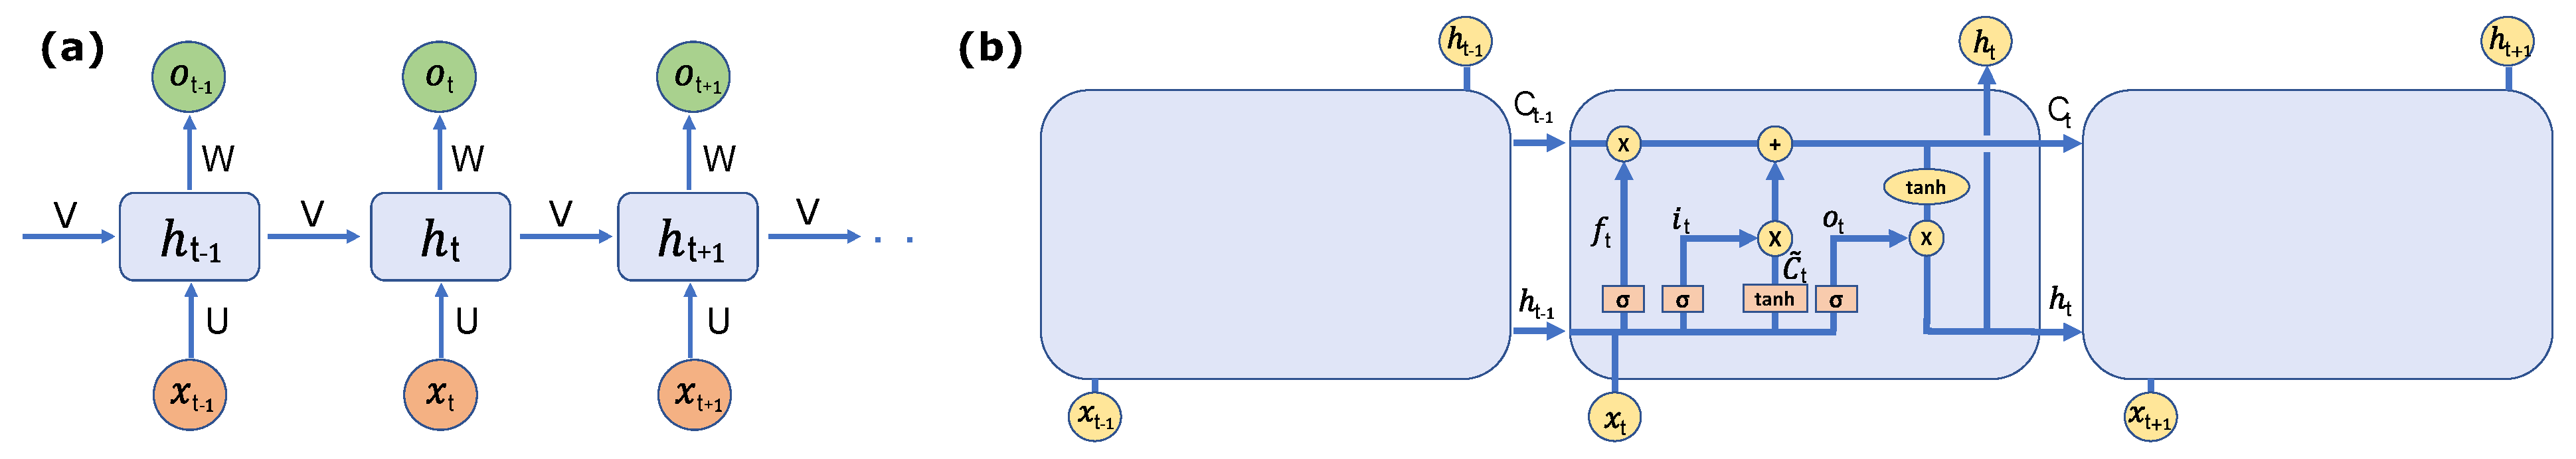
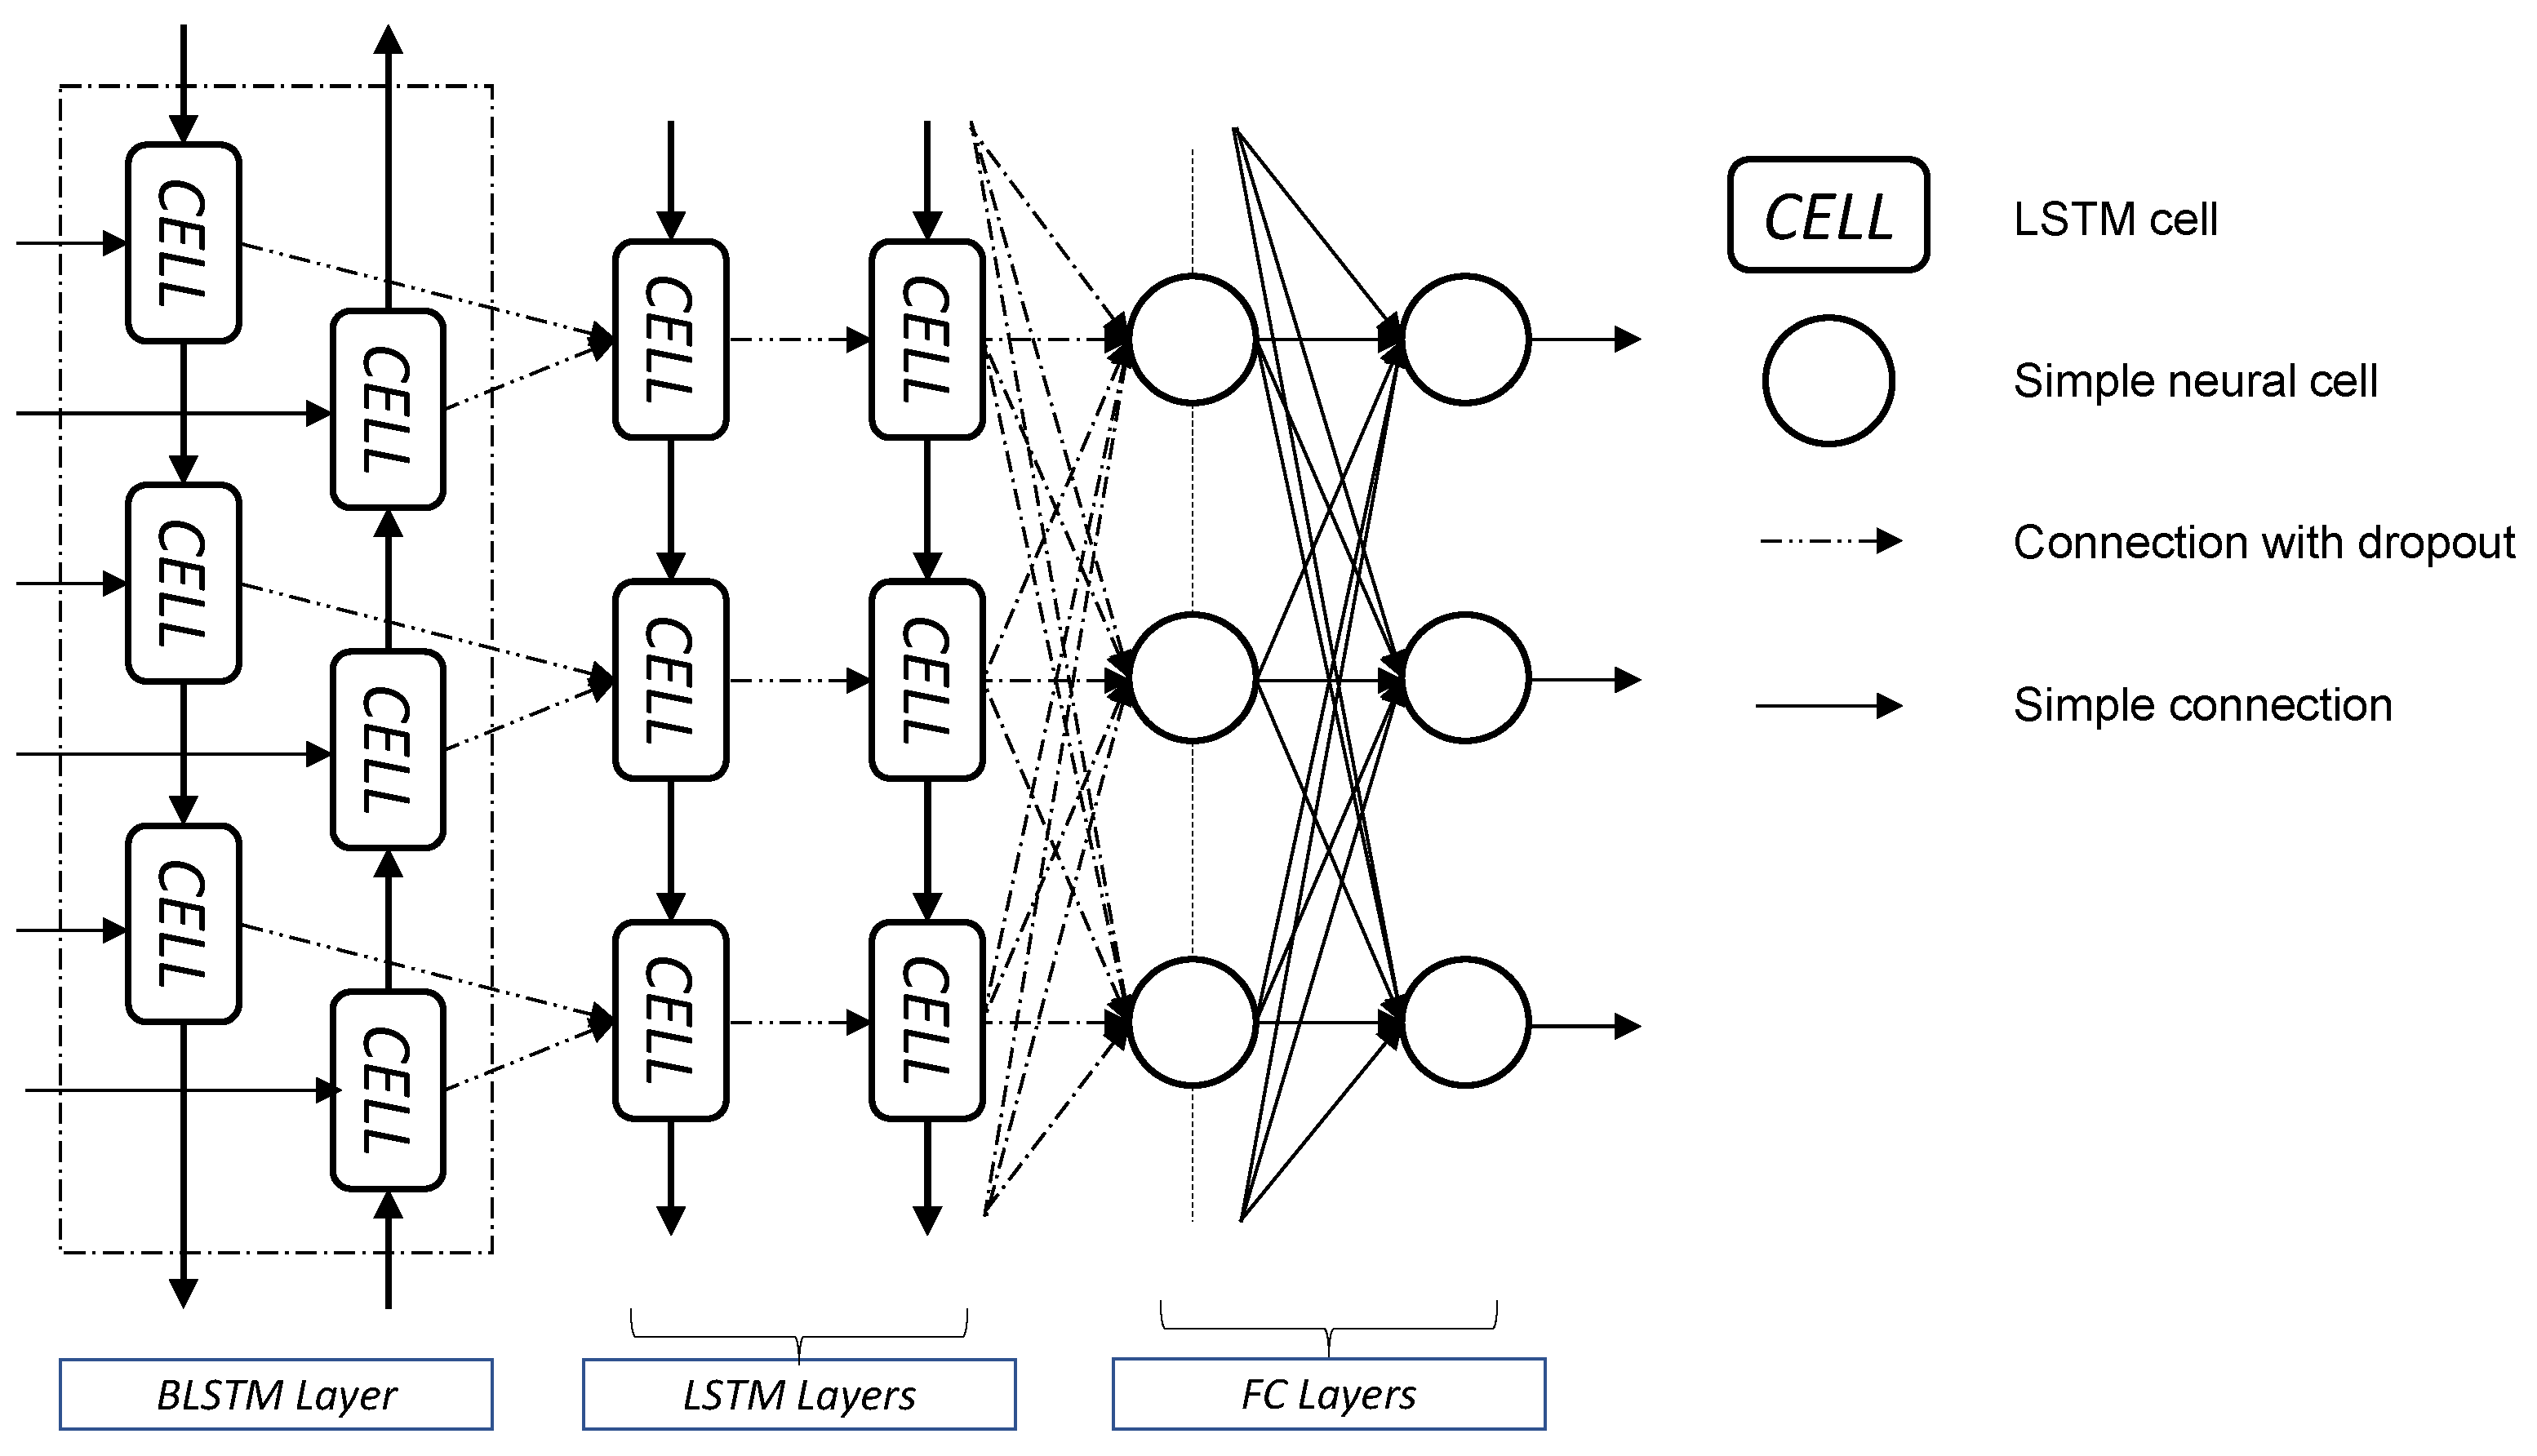
2.3. Neural Networks
3. Identification Steps
4. Results
4.1. Training Dataset
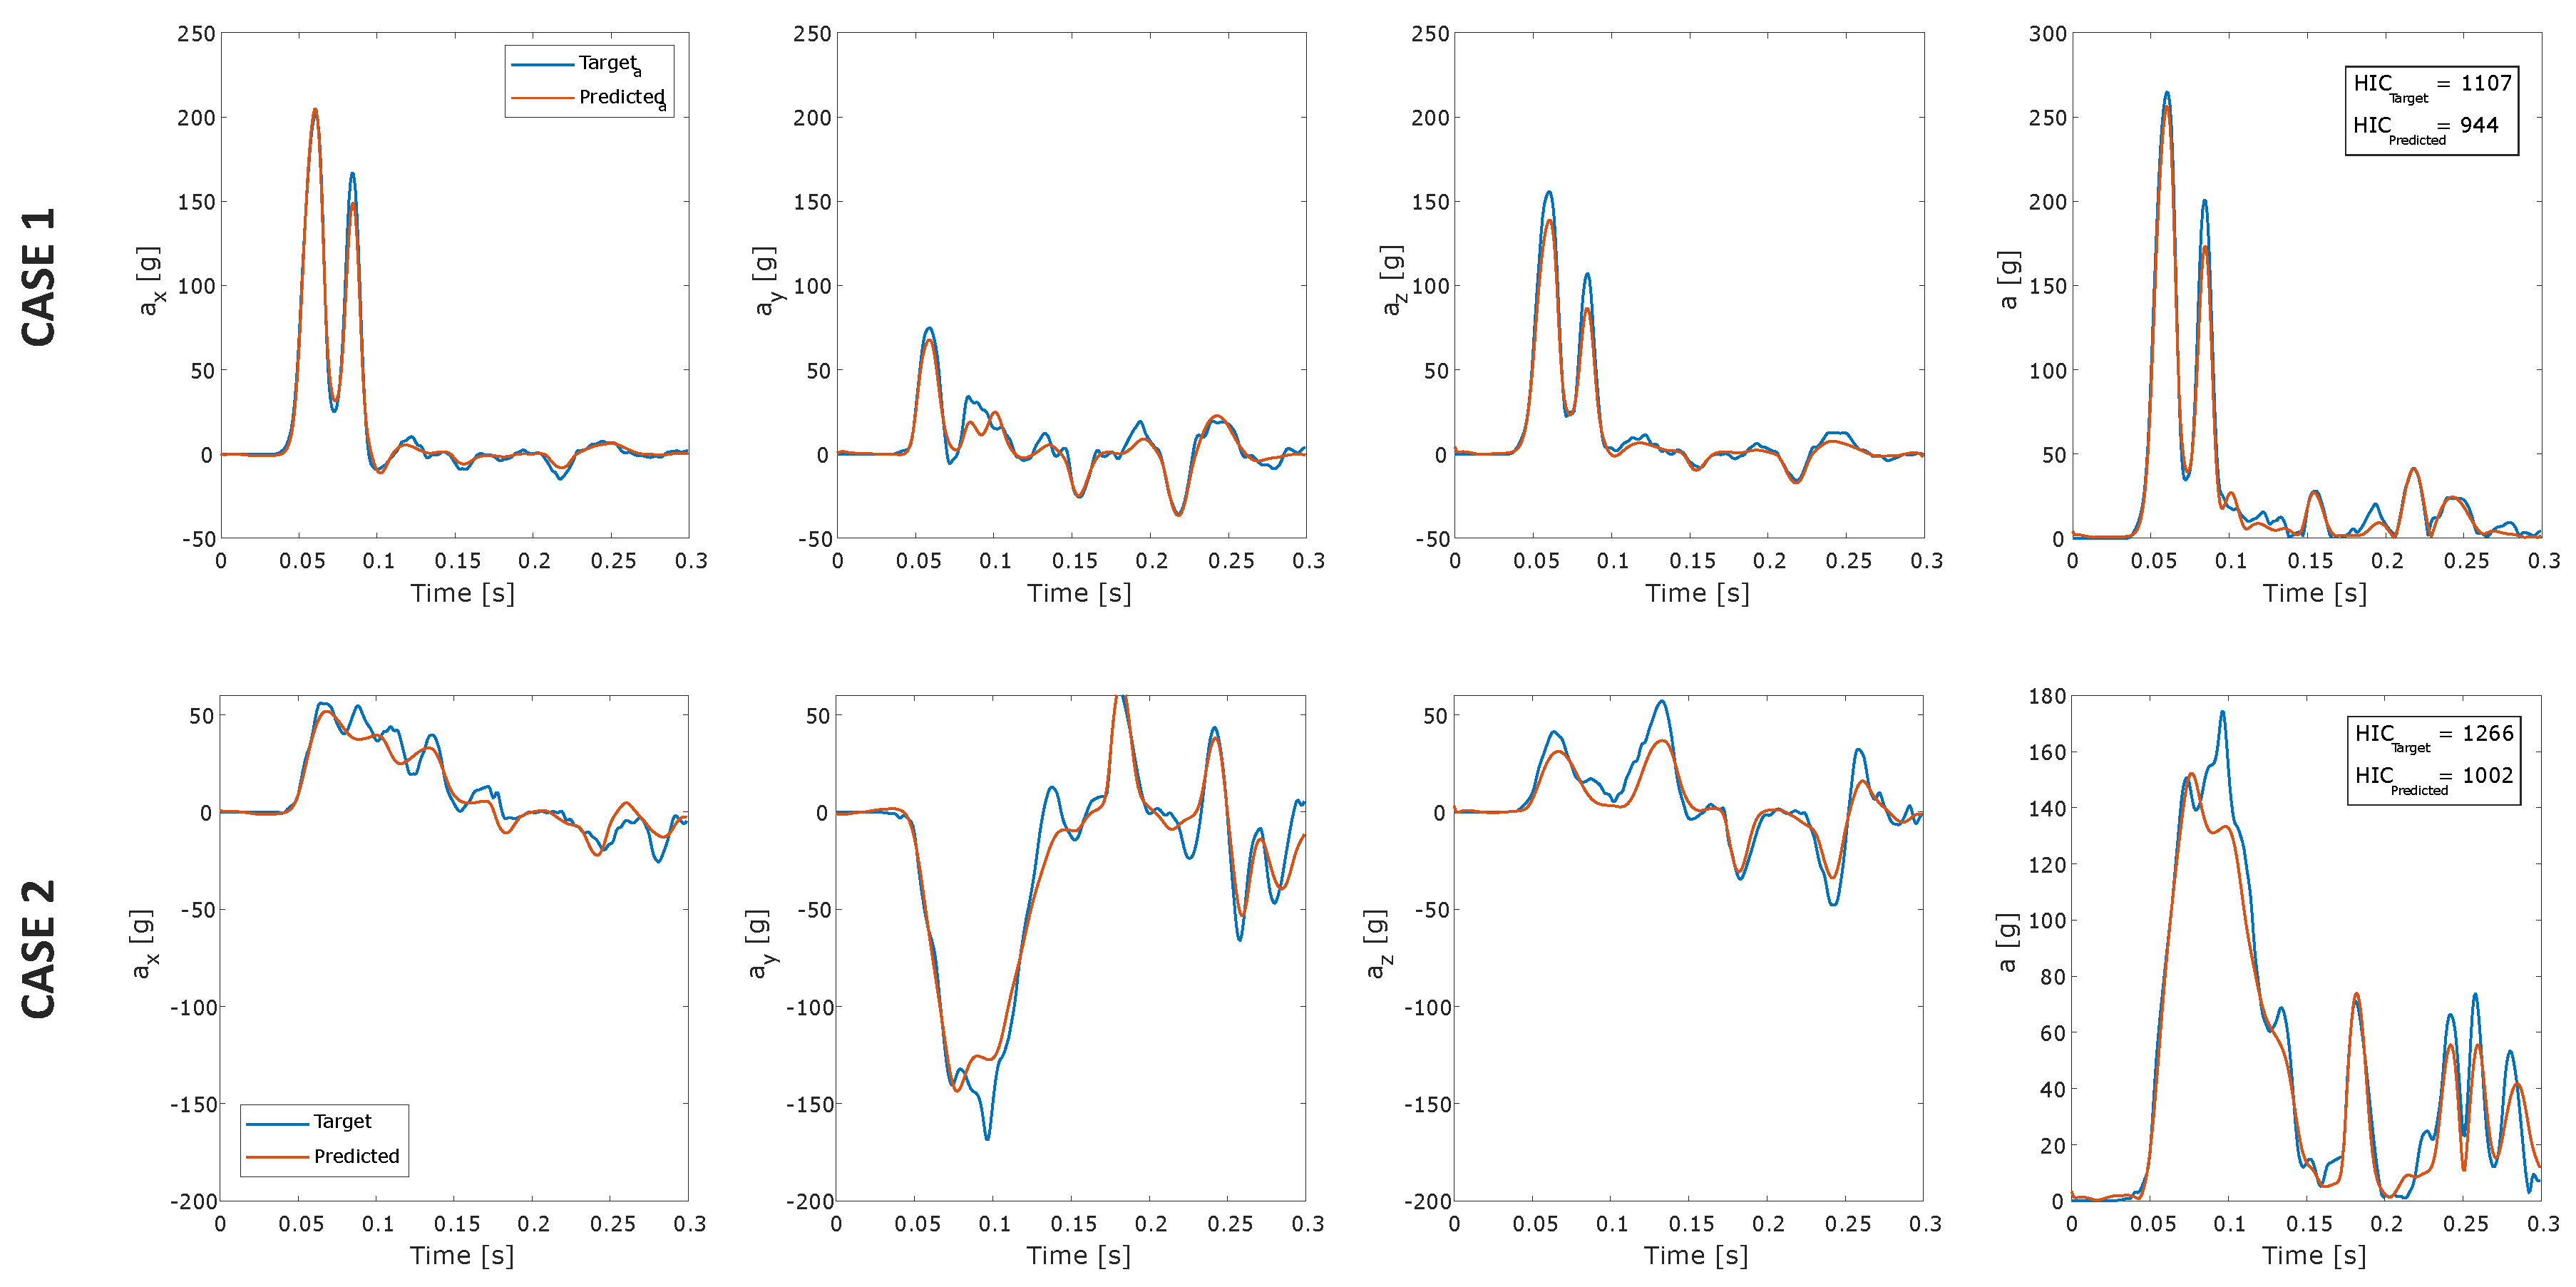
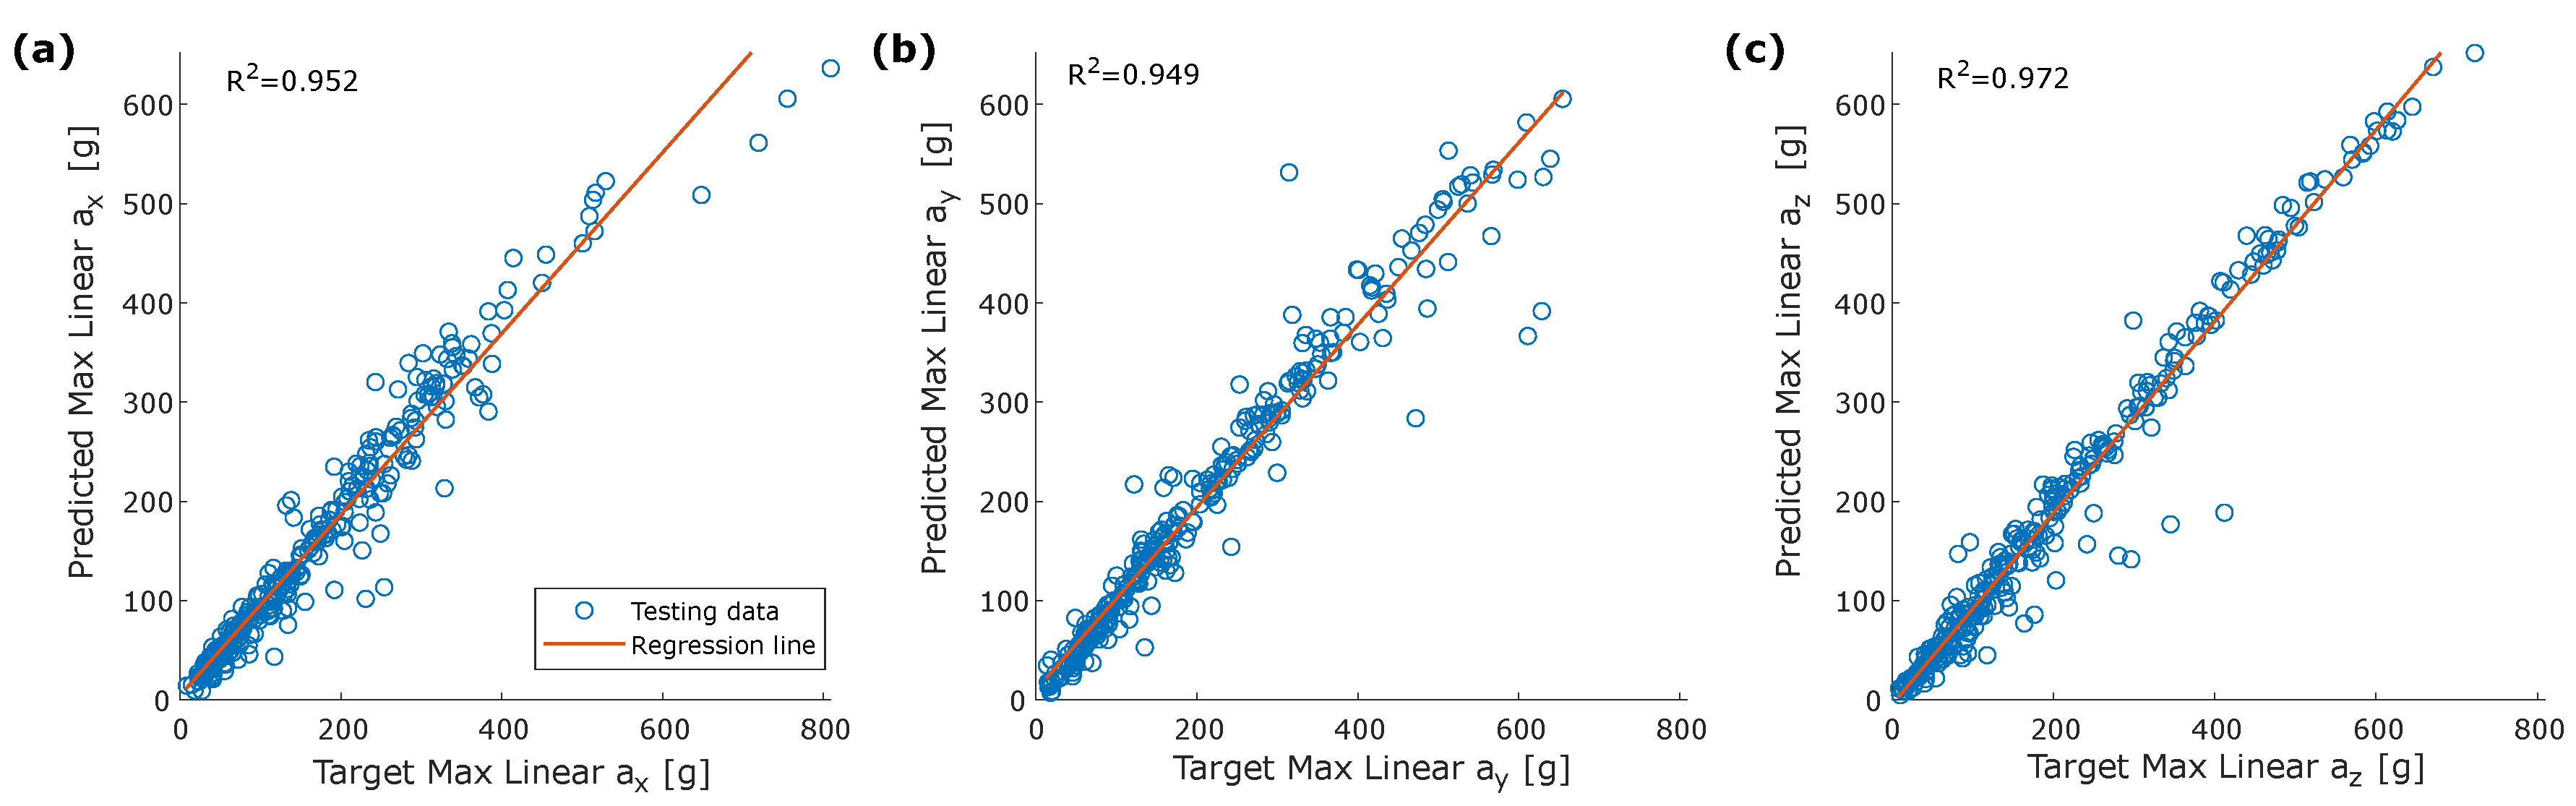
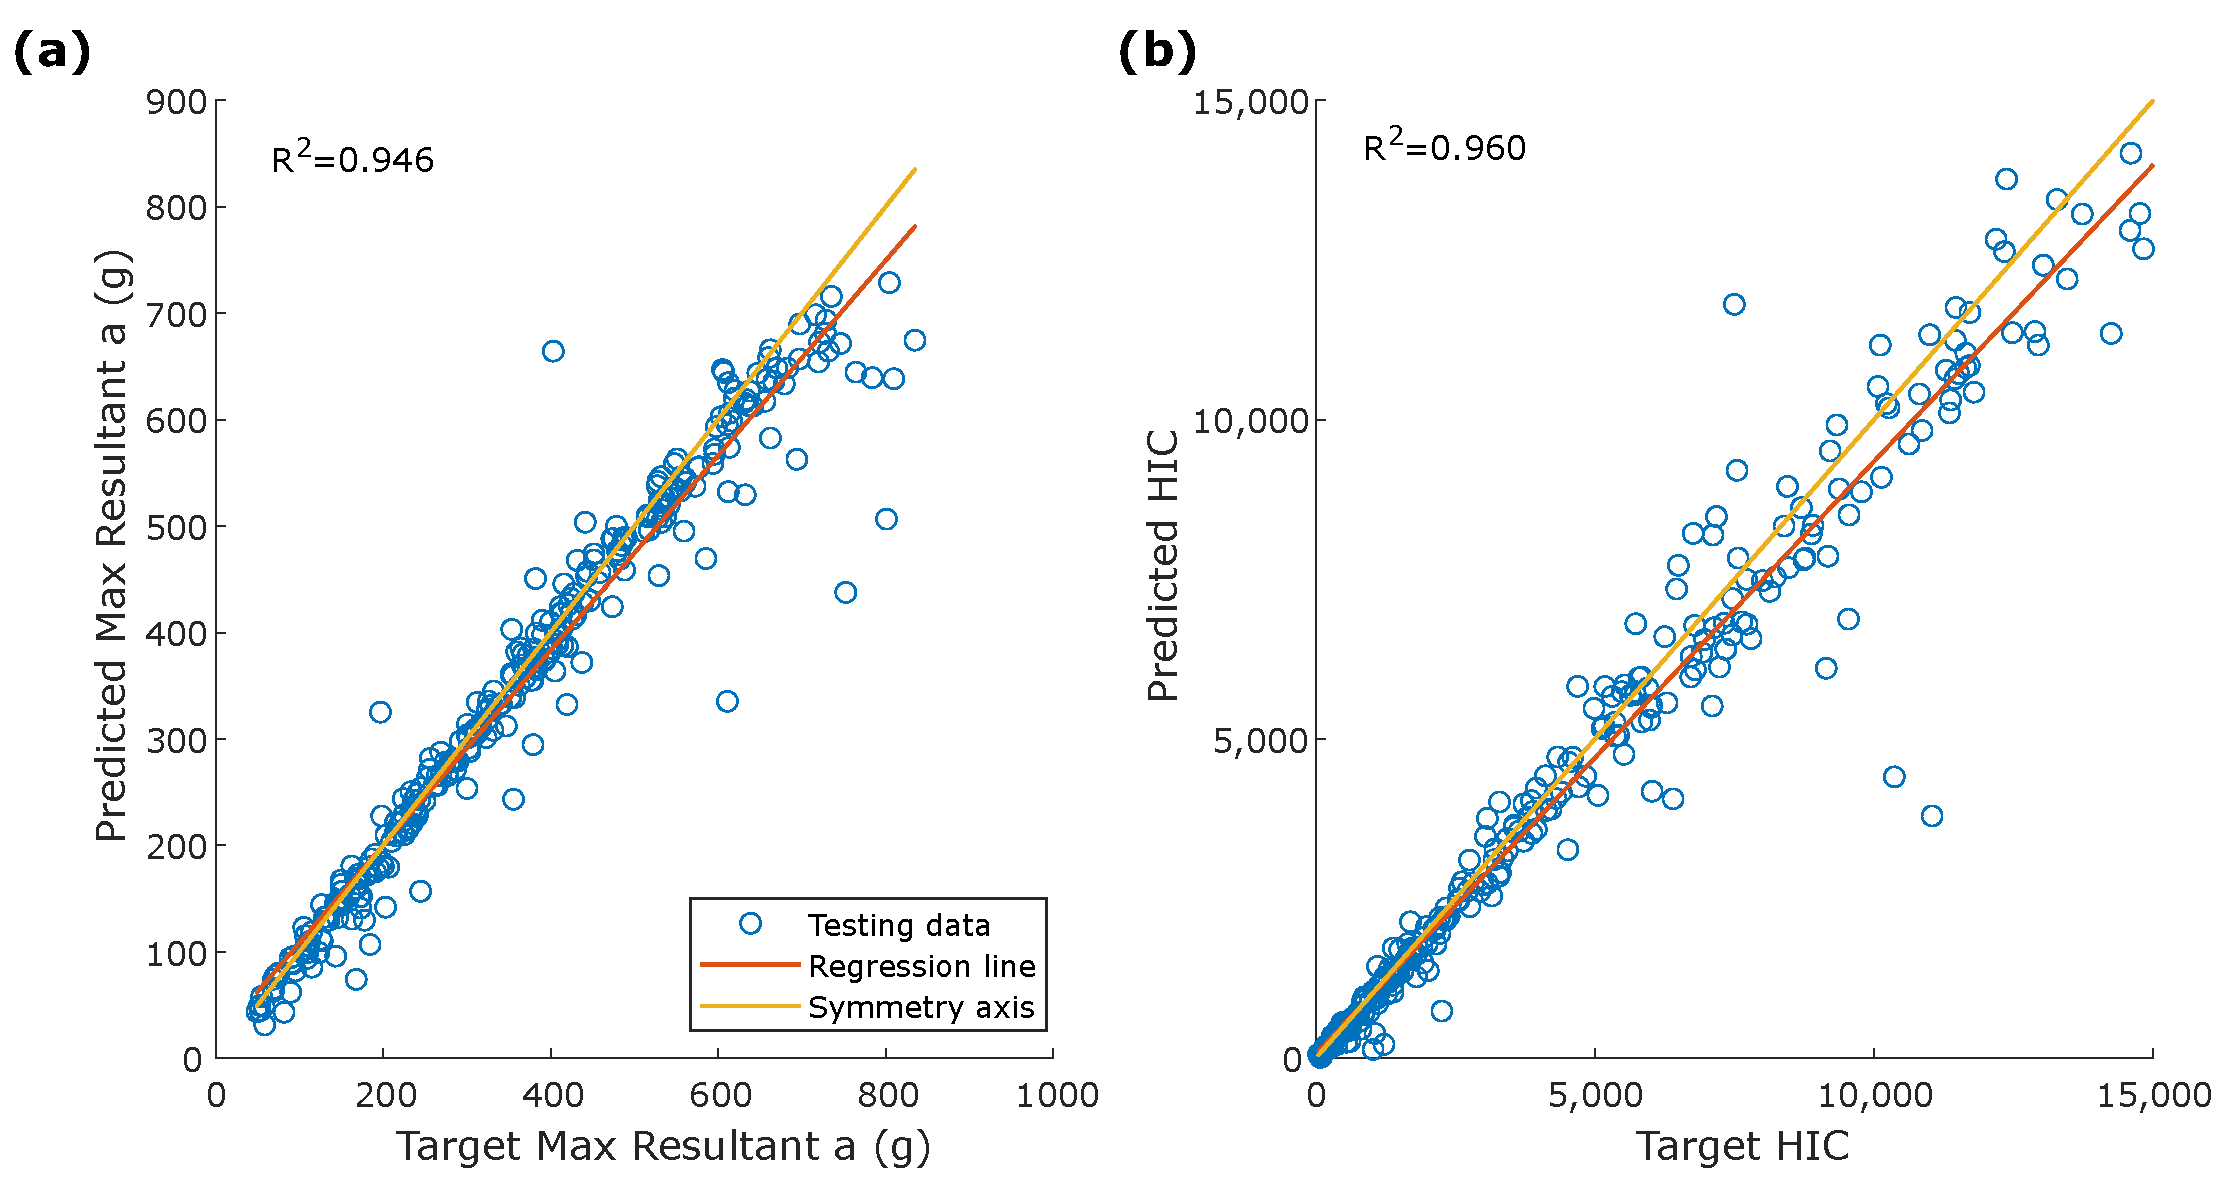
4.2. Head Linear Acceleration
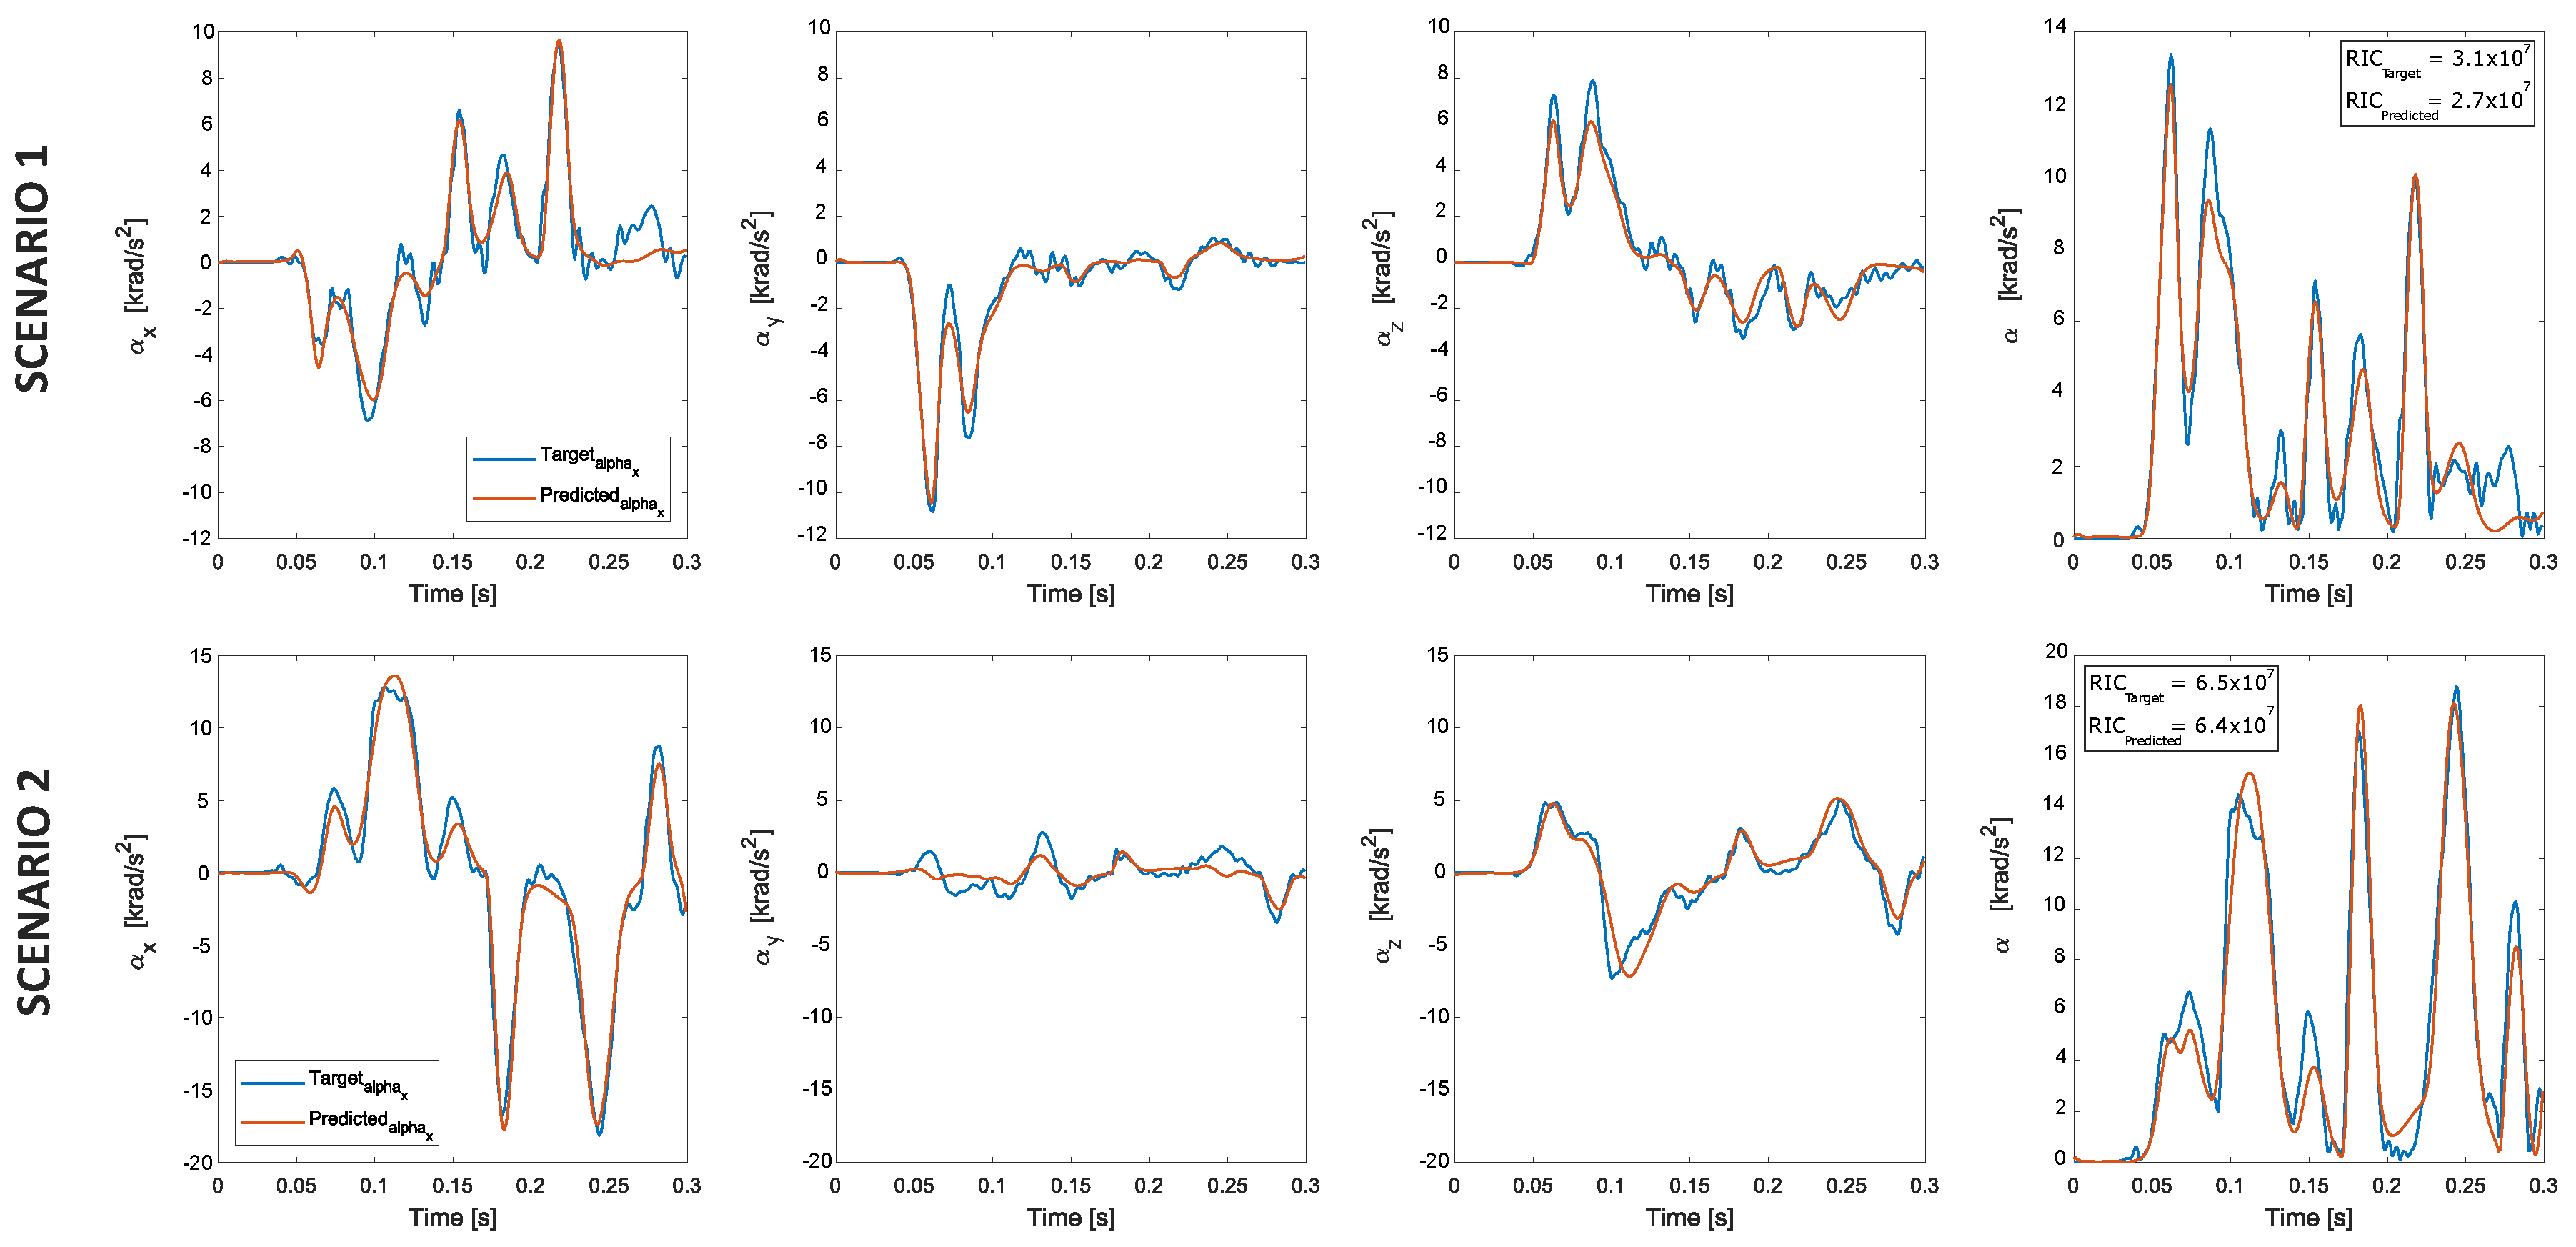
4.3. Head Rotational Acceleration
5. Discussions
6. Conclusions
- Neural Networks: LSTM Neural Networks are capable of reproducing the underlying non-linear behavior of the model. A specific network was defined to solve the problem, and the related hyperparameters were determined. This result enables real-time prediction of head kinematics and paves the road to the application of specific metrics for TBI estimation.
- Dataset:
- -
- The training, validation and testing datasets can be obtained from a virtual environment using state-of-the-art tools (e.g., Finite Elements). The approach used for the generation of datasets greatly reduces time requirements and costs compared to experimental tests;
- -
- An adequate size for the datasets was determined, which may be used for guidance in further applications. The networks can be trained with a limited amount of data because of the well-distributed dataset generated using the LHS method to combine the parameters defining our case study;
- -
- Both the use of virtual testing tools and the application of the LHS method to generate the simulation inputs facilitate the industrial application of the methodology.
- Prediction: The results proved the high accuracy of the trained networks, as a high correlation coefficient was obtained for all the parameters used in the assessment stage.
Author Contributions
Funding
Institutional Review Board Statement
Informed Consent Statement
Data Availability Statement
Acknowledgments
Conflicts of Interest
Abbreviations
| TBIs | Traumatic Brain Injuries |
| PTW | Powered Two Wheeler |
| ANNs | Artificial Neural Networks |
| VRUs | Vulnerable Road Users |
| MEMS | MicroElectroMechanical Systems |
| HITS | Head Impact Telemetry System |
| CoG | Centre of Gravity |
| 6DOF | 6 Degrees of Freedom |
| GTF | gForce Tracker |
| RNNs | Recurrent Neural Networks |
| LHS | Latin Hypercube Sampling |
| HIII | Hybrid III |
| ReLU | Rectified linear function |
| Tanh | Hyperbolic Tangent function |
| LSTM | Long Short Term Memory |
| BLSTM | Bidirectional Long Short Term Memory |
| FC | Fully Connected |
| dANN | deep Artificial Neural Network |
| BPTT | Back Propagation Through Time |
| RMSprop | Root Mean Square propagation |
| RMSE | Root Mean Square Error |
| HIC | Head Injury Criterion |
| RIC | Rotational Injury Criterion |
| MTBI | Mild Traumatic Brain Injury |
References
- Santiago, L.A.; Oh, B.C.; Dash, P.K.; Holcomb, J.B.; Wade, C.E. A clinical comparison of penetrating and blunt traumatic brain injuries. Brain Inj. 2012, 26, 107–125. [Google Scholar] [CrossRef] [PubMed]
- Daugherty, J.; Waltzman, D.; Sarmiento, K.; Xu, L. Traumatic Brain Injury–Related Deaths by Race/Ethnicity, Sex, Intent, and Mechanism of Injury—United States, 2000–2017. MMWR 2019, 46, 1050–1056. [Google Scholar] [CrossRef] [PubMed]
- Dever, A.; Powell, D.; Graham, L.; Mason, R.; Das, J.; Marshall, S.J.; Vitorio, R.; Godfrey, A.; Stuart, S. Gait impairment in traumatic brain injury: A systematic review. Sensors 2022, 22, 1480. [Google Scholar] [CrossRef]
- World Health Organization and others. Global Status Report on Road Safety 2018: Summary; World Health Organization: Geneva, Switzerland, 2018. [Google Scholar]
- Gabler, L.F.; Crandall, J.R.; Panzer, M.B. Assessment of Kinematic Brain Injury Metrics for Predicting Strain Responses in Diverse Automotive Impact Conditions. Ann. Biomed. Eng. 2016, 44, 3705–3718. [Google Scholar] [CrossRef]
- United Nations. Uniform Provisions Concerning the Approval of Protective Helmets and Their Visors for Drivers and Passengers of Motor Cycles and Mopeds; UN ECE 22.05; United Nations: San Francisco, CA, USA, 2002. [Google Scholar]
- United Nations. Uniform Provisions Concerning the Approval of Protective Helmets and Their Visors for Drivers and Passengers of Motor Cycles and Mopeds; UN ECE 22.06; United Nations: San Francisco, CA, USA, 2021. [Google Scholar]
- Ommaya, A.K.; Hirsch, A.E.; Yarnell, P.; Harris, E.H. Scaling of Experimental Data on Cerebral Concussion in Sub-Human Primates to Concussion Threshold for Man; DTIC Document; DTIC: Fort Belvoir, VR, USA, 1967.
- Ono, K.; Kikuchi, A.; Nakamura, M.; Kobayashi, H.; Nakamura, N. Human Head Tolerance to Sagittal Impact—Reliable Estimation Deduced from Experimental Head Injury Using Subhuman Primates and Human Cadaver Skulls. JSAE Trans. 1980, 1089, 3837–3866. [Google Scholar]
- Margulies, S.S.; Thibault, L.E. A proposed tolerance criterion for diffuse axonal injury in man. J. Biomech. 1992, 25, 917–923. [Google Scholar] [CrossRef]
- Greenwald, R.M.; Gwin, J.T.; Chu, J.J.; Crisco, J.J. Head impact severity measures for evaluating mild traumatic brain injury risk exposure. Neurosurgery 2008, 10, 789–798. [Google Scholar] [CrossRef] [PubMed]
- Kimpara, H.; Iwamoto, M. Mild Traumatic Brain Injury Predictors Based on Angular Accelerations During Impacts. Ann. Biomed. Eng. 2012, 40, 114–126. [Google Scholar] [CrossRef]
- Rowson, S.; Duma, S.M. Brain Injury Prediction: Assessing the Combined Probability of Concussion Using Linear and Rotational Head Acceleration. Ann. Biomed. Eng. 2013, 41, 873–882. [Google Scholar] [CrossRef]
- Gabler, L.F.; Crandall, J.R.; Panzer, M.B. Investigating Brain Injury Tolerance in the Sagittal Plane Using a Finite Element Model of the Human Head. Int. J. Automot. Eng. 2016, 10, 37–43. [Google Scholar] [CrossRef][Green Version]
- Crisco, J.J.; Chu, J.J.; Greenwald, R.M. An algorithm for estimating acceleration magnitude and impact location using multiple nonorthogonal single-axis accelerometers. J. Biomech. Eng. 2005, 126, 849. [Google Scholar] [CrossRef] [PubMed]
- Duma, S.M.; Manoogian, S.J.; Bussone, W.R.; Brolinson, P.G.; Goforth, M.W.; Donnenwerth, J.J.; Crisco, J.J. Analysis of real-time head accelerations in collegiate football players. Clin. J. Sport Med. 2005, 15, 3–8. [Google Scholar] [CrossRef] [PubMed]
- Funk, J.R.; Duma, S.M.; Manoogian, S.J.; Rowson, S. Biomechanical Risk Estimates for Mild Traumatic Brain Injury. J. Chem. Inf. Model. 2007, 4510, 343–361. [Google Scholar]
- Crisco, J.J.; Wilcox, B.J.; Beckwith, J.G.; Chu, J.J.; Duhaime, A.C.; Rowson, S.; Greenwald, R.M. Head impact exposure in collegiate football players. J. Biomech. 2011, 44, 2673–2678. [Google Scholar] [CrossRef] [PubMed]
- Beckwith, J.G.; Greenwald, R.M.; Chu, J.J. Measuring head kinematics in football: Correlation between the head impact telemetry system and Hybrid III headform. Ann. Biomed. Eng. 2012, 40, 237–248. [Google Scholar] [CrossRef]
- Rowson, S.; Duma, S.M.; Beckwith, J.G.; Chu, J.J.; Greenwald, R.M.; Crisco, J.J.; Maerlender, A.C. Rotational head kinematics in football impacts: An injury risk function for concussion. Ann. Biomed. Eng. 2012, 40, 1–13. [Google Scholar] [CrossRef]
- Jadischke, R.; Viano, D.C.; Dau, N.; King, A.I.; McCarthy, J. On the accuracy of the Head Impact Telemetry (HIT) System used in football helmets. J. Biomech. 2013, 46, 2310–2315. [Google Scholar] [CrossRef]
- Rowson, S.; Beckwith, J.G.; Chu, J.J.; Leonard, D.S.; Greenwald, R.M.; Duma, S.M. A six degree of freedom head acceleration measurement device for use in football. J. Appl. Biomech. 2011, 10, 8–14. [Google Scholar] [CrossRef][Green Version]
- Beckwith, J.G.; Chu, J.J.; Greenwald, R.M. Validation of a noninvasive system for measuring head acceleration for use during boxing competition. J. Appl. Biomech. 2007, 23, 238–244. [Google Scholar] [CrossRef]
- Allison, M.A.; Kang, Y.S.; Maltese, M.R.; Bolte, J.H.; Arbogast, K.B. Measurement of Hybrid III head impact kinematics using an accelerometer and gyroscope system in ice hockey helmets. Ann. Biomed. Eng. 2015, 43, 1896–1906. [Google Scholar] [CrossRef]
- Manoogian, S.; McNeely, D.; Duma, S.; Brolinson, G.; Greenwald, R. Head acceleration is less than 10 percent of helmet acceleration in football impacts. Tech. Pap. ISA 2006, 42, 383–388. [Google Scholar]
- Joodaki, H.; Bailey, A.; Lessley, D.; Funk, J.; Sherwood, C.; Crandall, J. Relative motion between the helmet and the head in football impact test. J. Biomech. Eng. 2019, 141, 1–16. [Google Scholar] [CrossRef] [PubMed]
- Ghajari, M.; Peldschus, S.; Galvanetto, U.; Iannucci, L. Effects of the presence of the body in helmet oblique impacts. Accid. Anal. Prev. 2013, 10, 142–149. [Google Scholar] [CrossRef]
- Staszewski, W.J.; Worden, K.; Wardle, R.; Tomlinson, G.R. Fail-safe sensor distributions for impact detection in composite materials. Smart Mater. Struct. 2000, 9, 298–303. [Google Scholar] [CrossRef]
- Zhou, J.M.; Dong, L.; Guan, W.; Yan, J. Impact load identification of nonlinear structures using deep Recurrent Neural Network. Mech. Syst. Signal Process. 2019, 133, 106292. [Google Scholar] [CrossRef]
- Tu, J.V. Advantages and disadvantages of using artificial neural networks versus logistic regression for predicting medical outcomes. J. Clin. Epidemiol. 1996, 49, 1225–1231. [Google Scholar] [CrossRef]
- Mahmood, M.A.; Visan, A.I.; Ristoscu, C.; Mihailescu, I.N. Artificial neural network algorithms for 3D printing. Materials 2020, 14, 163. [Google Scholar] [CrossRef]
- Logacjov, A.; Bach, K.; Kongsvold, A.; Bårdstu, H.B.; Mork, P.J. HARTH: A Human Activity Recognition Dataset for Machine Learning. Sensors 2021, 21, 7853. [Google Scholar] [CrossRef]
- Dirgová Luptáková, I.; Kubovčík, M.; Pospíchal, J. Wearable Sensor-Based Human Activity Recognition with Transformer Model. Sensors 2022, 22, 1911. [Google Scholar] [CrossRef]
- Bracali, A.; Barbani, D.; Baldanzini, N. Feasibility study for the estimation of a motorcycle helmet Centre of Gravity accelerations with 6 Degrees of Freedom (6DOF) system. Transp. Res. Interdiscip. Perspect. 2022, 14, 100603. [Google Scholar] [CrossRef]
- Piantini, S.; Pierini, M.; Delogu, M.; Baldanzini, N.; Franci, A.; Mangini, M.; Peris, A. Injury analysis of powered two-wheeler versus other-vehicle urban accidents. In Proceedings of the IRCOBI Conference, Malaga, Spain, 14–16 September 2016. [Google Scholar]
- Aldman, B.; Lundell, B.; Thorngren, L. Oblique impacts, a parametric study in crash helmets. In Proceedings of the IRCOBI (International Research Committee on Biokinetics of Impacts) Conference, Bron, France, 12–14 September 1978. [Google Scholar]
- Mills, N.J.; Wilkes, S.; Derler, S.; Flisch, A. FEA of oblique impact tests on a motorcycle helmet. Int. J. Impact Eng. 2009, 36, 913–925. [Google Scholar] [CrossRef]
- Meng, S.; Cernicchi, A.; Kleiven, S.; Halldin, P. High-speed helmeted head impacts in motorcycling: A computational study. Accid. Anal. Prev. 2020, 134, 105297. [Google Scholar] [CrossRef]
- Iman, R.L.; Conover, W.J. Small sample sensitivity analysis techniques for computer models. with an application to risk assessment. Commun. Stat.-Theory Methods 1980, 9, 1749–1842. [Google Scholar] [CrossRef]
- Giudice, J.S.; Kong, K.; Caudillo, A.; Mukherjee, S.; Panzer, M.B. User Manual-Finite Element Models of Helmet Assessment Tools (Hybrid III Head-Neck, NOCSAE Headform, Linear Impact, Pendulum Impact, Drop Impact-Version 1.0 for LS-DYNA. 2018. Available online: https://www.biocorellc.com/wp-content/uploads/2020/11/Manual_2016_Schutt_Air_XP_Pro_Helmet_Model_v1.0.pdf (accessed on 21 July 2022).
- Medsker, L.R.; Jain, L.C. Recurrent neural networks. Design Appl. 2001, 5, 64–67. [Google Scholar]
- Hochreiter, S.; Schmidhuber, J. Long short-term memory. Neural Comput. 1997, 9, 1735–1780. [Google Scholar] [CrossRef] [PubMed]
- ISO 6487:2002; Road Vehicles-Measurement Techniques in Impact Tests-Instrumentation. International Organization of Standardization: Geneva, Switzerland, 2002.
- Werbos, P.J. Backpropagation through time: What it does and how to do it. Proc. Name IEEE 1990, 78, 3796883. [Google Scholar] [CrossRef]
- Ruder, S. An overview of gradient descent optimization algorithms. arXiv 2016, arXiv:1609.04747. [Google Scholar]
- Versace, J. A Review of the Severity Index; SAE Technical Paper; SAE: Warrendale, PA, USA, 1971. [Google Scholar]
- Pike, J. Biomechanical Risk Estimates for Mild Traumatic Brain Injury; SAE: Warrendale, PA, USA, 2011. [Google Scholar]
- Zhang, L.; Yang, K.H.; King, A.I. A proposed injury threshold for mild traumatic brain injury. J. Biomech. Eng. 2004, 126, 226–236. [Google Scholar] [CrossRef]


| Architecture | Learning Rate | Hidden Units | Peak Value | RIC | ||||
|---|---|---|---|---|---|---|---|---|
| Resultant | ||||||||
| DANN0 | BLSTM and 2LSTM [29] | 0.005 | 128 | 0.248 | 0.278 | 0.168 | 0.192 | 0.404 |
| DANN1 | BLSTM and 2LSTM and 2FC | 0.001 | 100 | 0.776 | 0.882 | 0.795 | 0.755 | 0.672 |
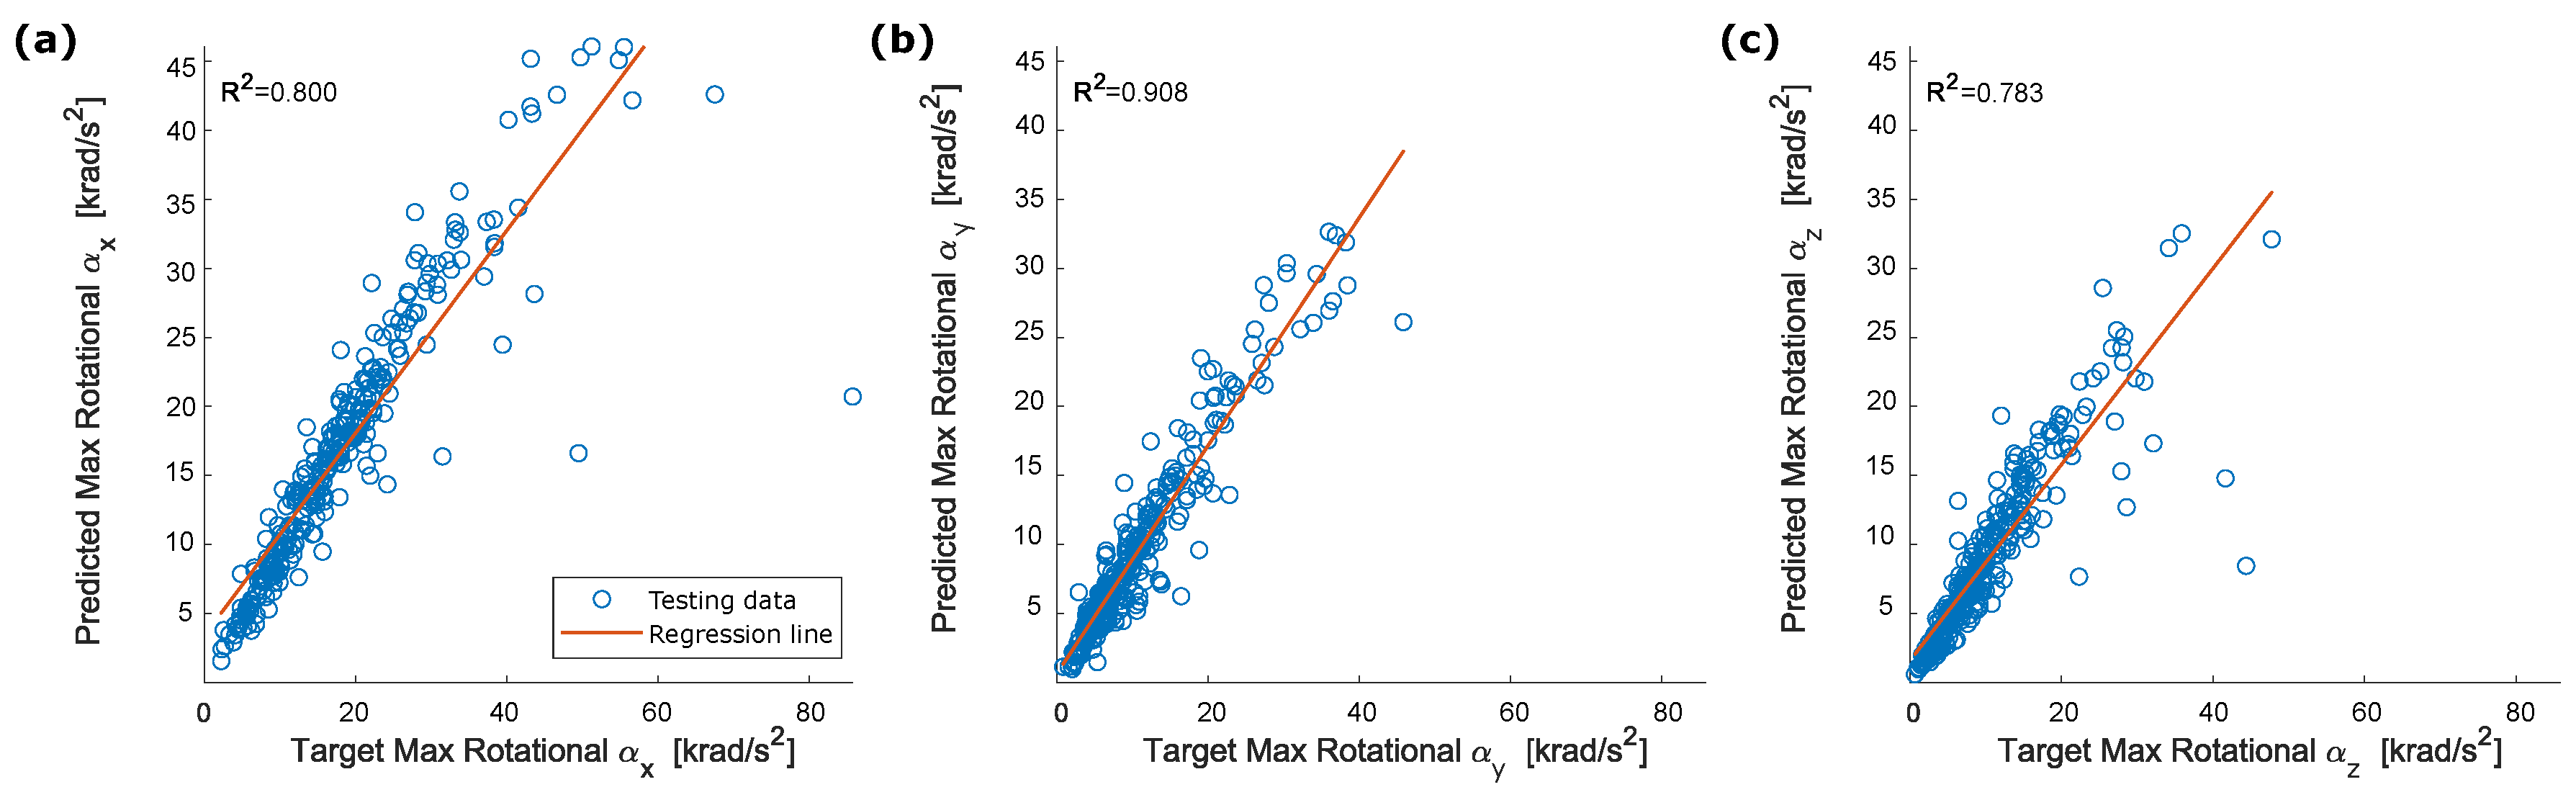
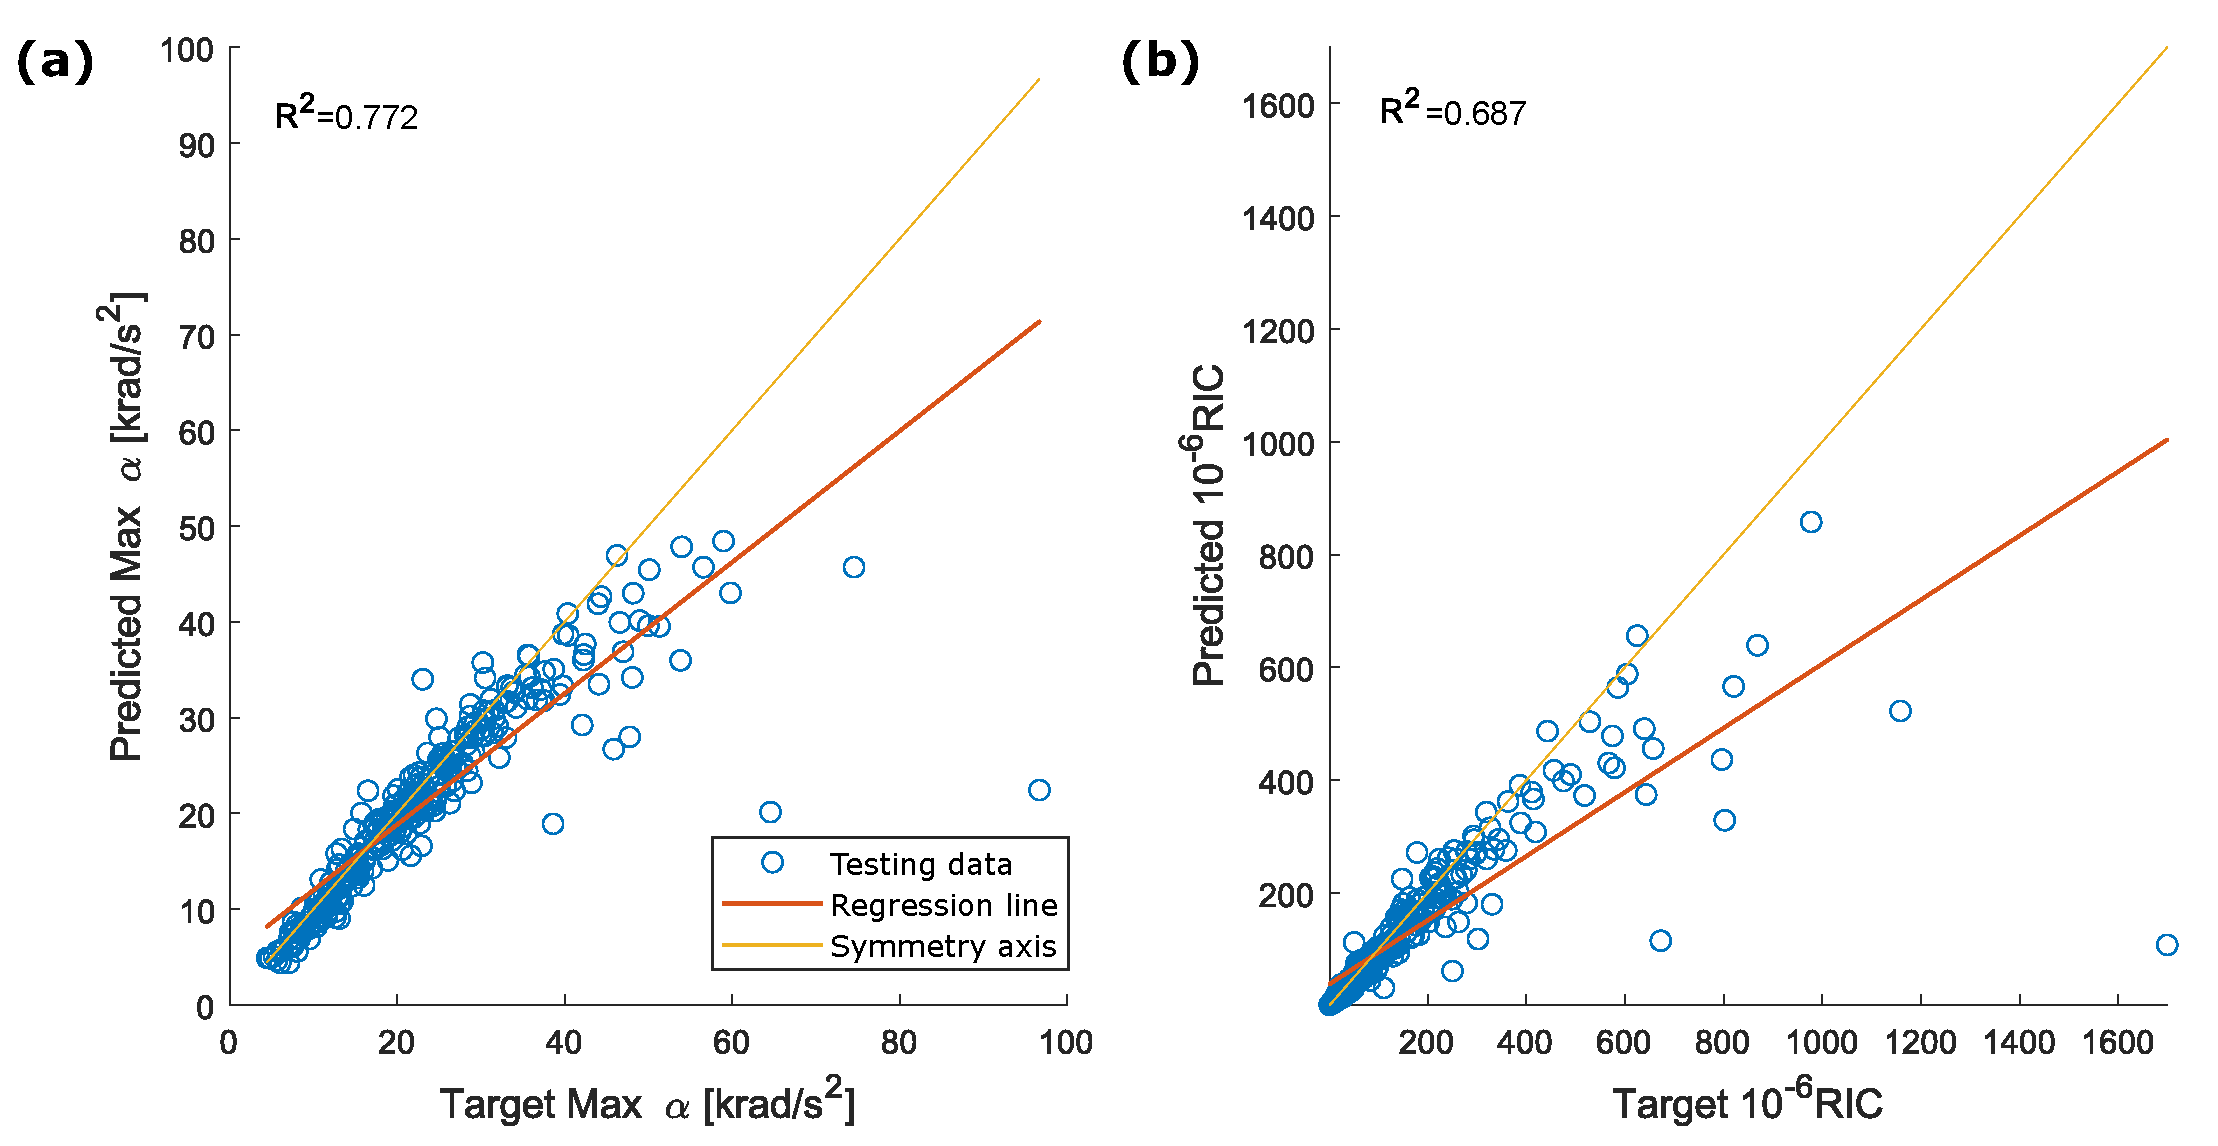
| DANN2 | BLSTM and 2LSTM and 2FC | 0.001 | 200 | 0.800 | 0.908 | 0.783 | 0.772 | 0.687 |
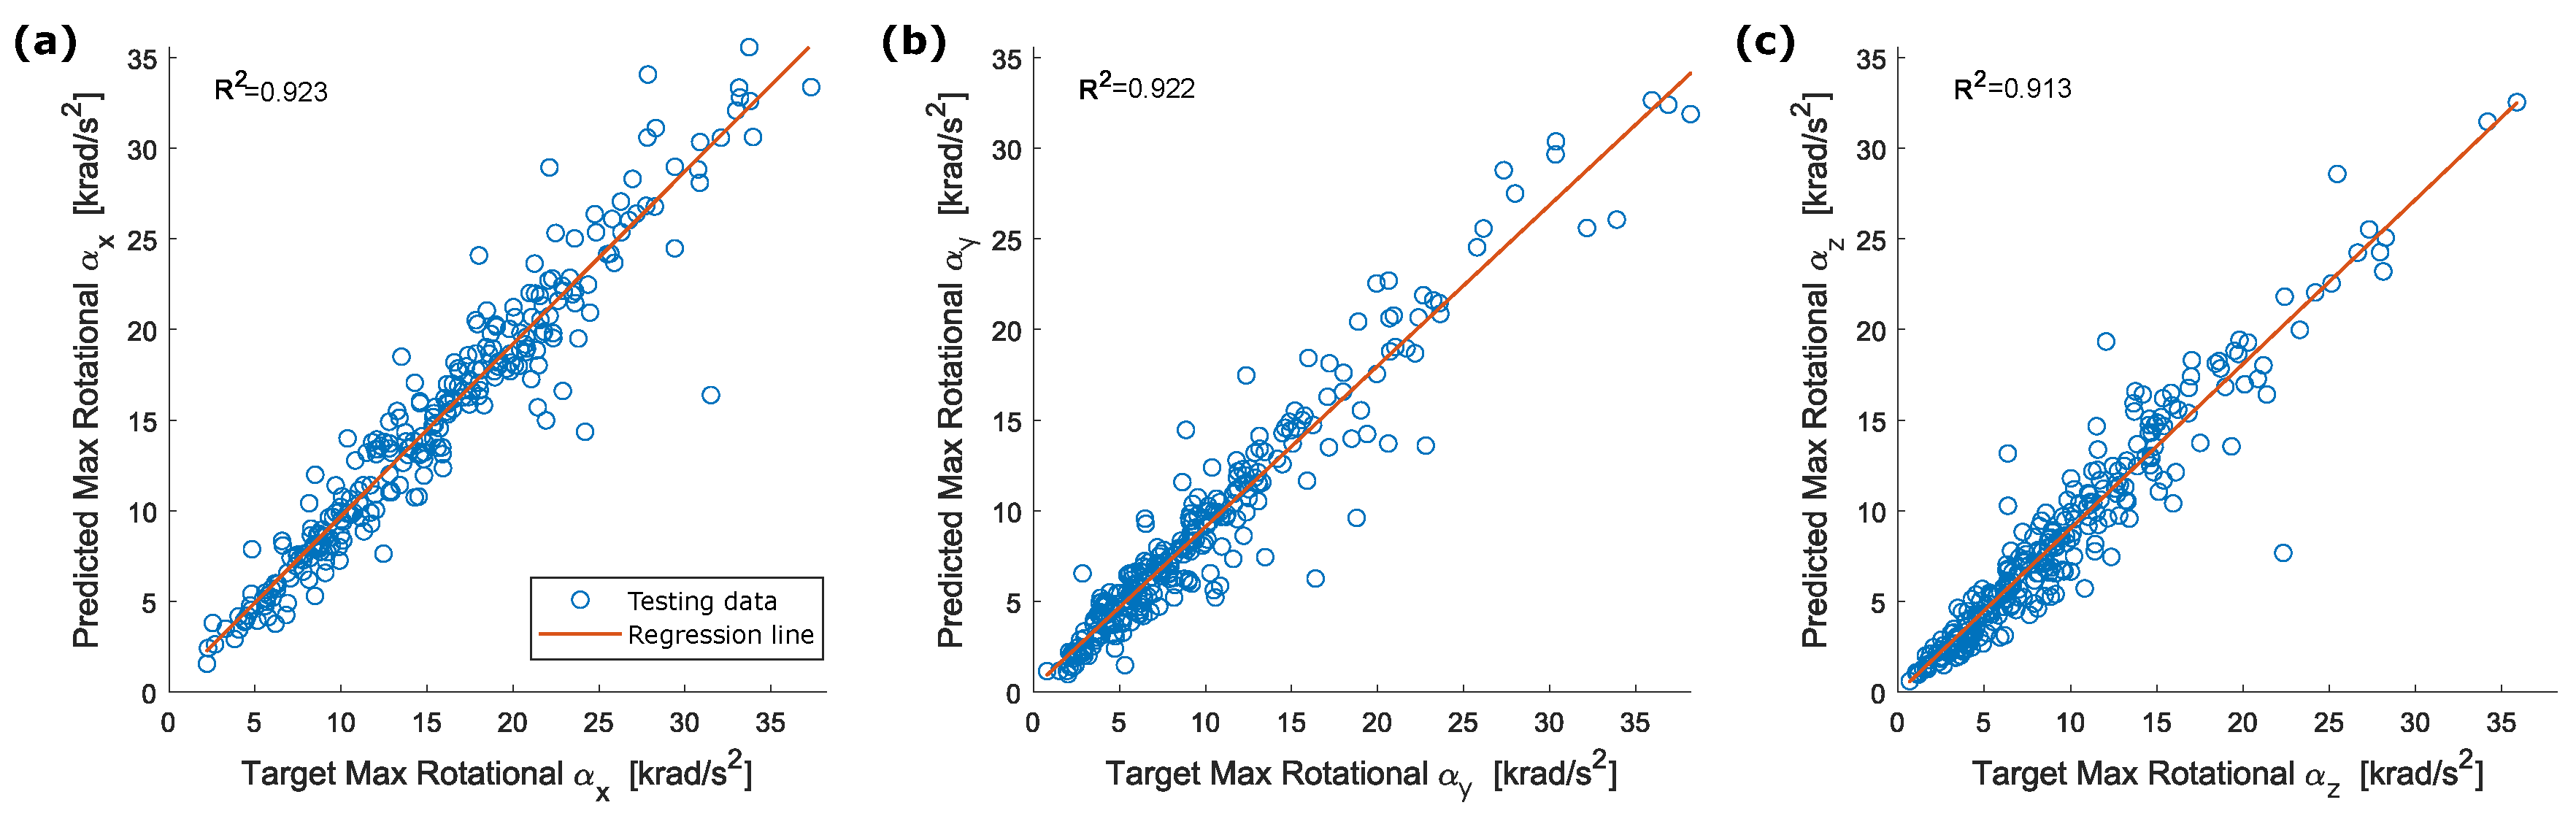
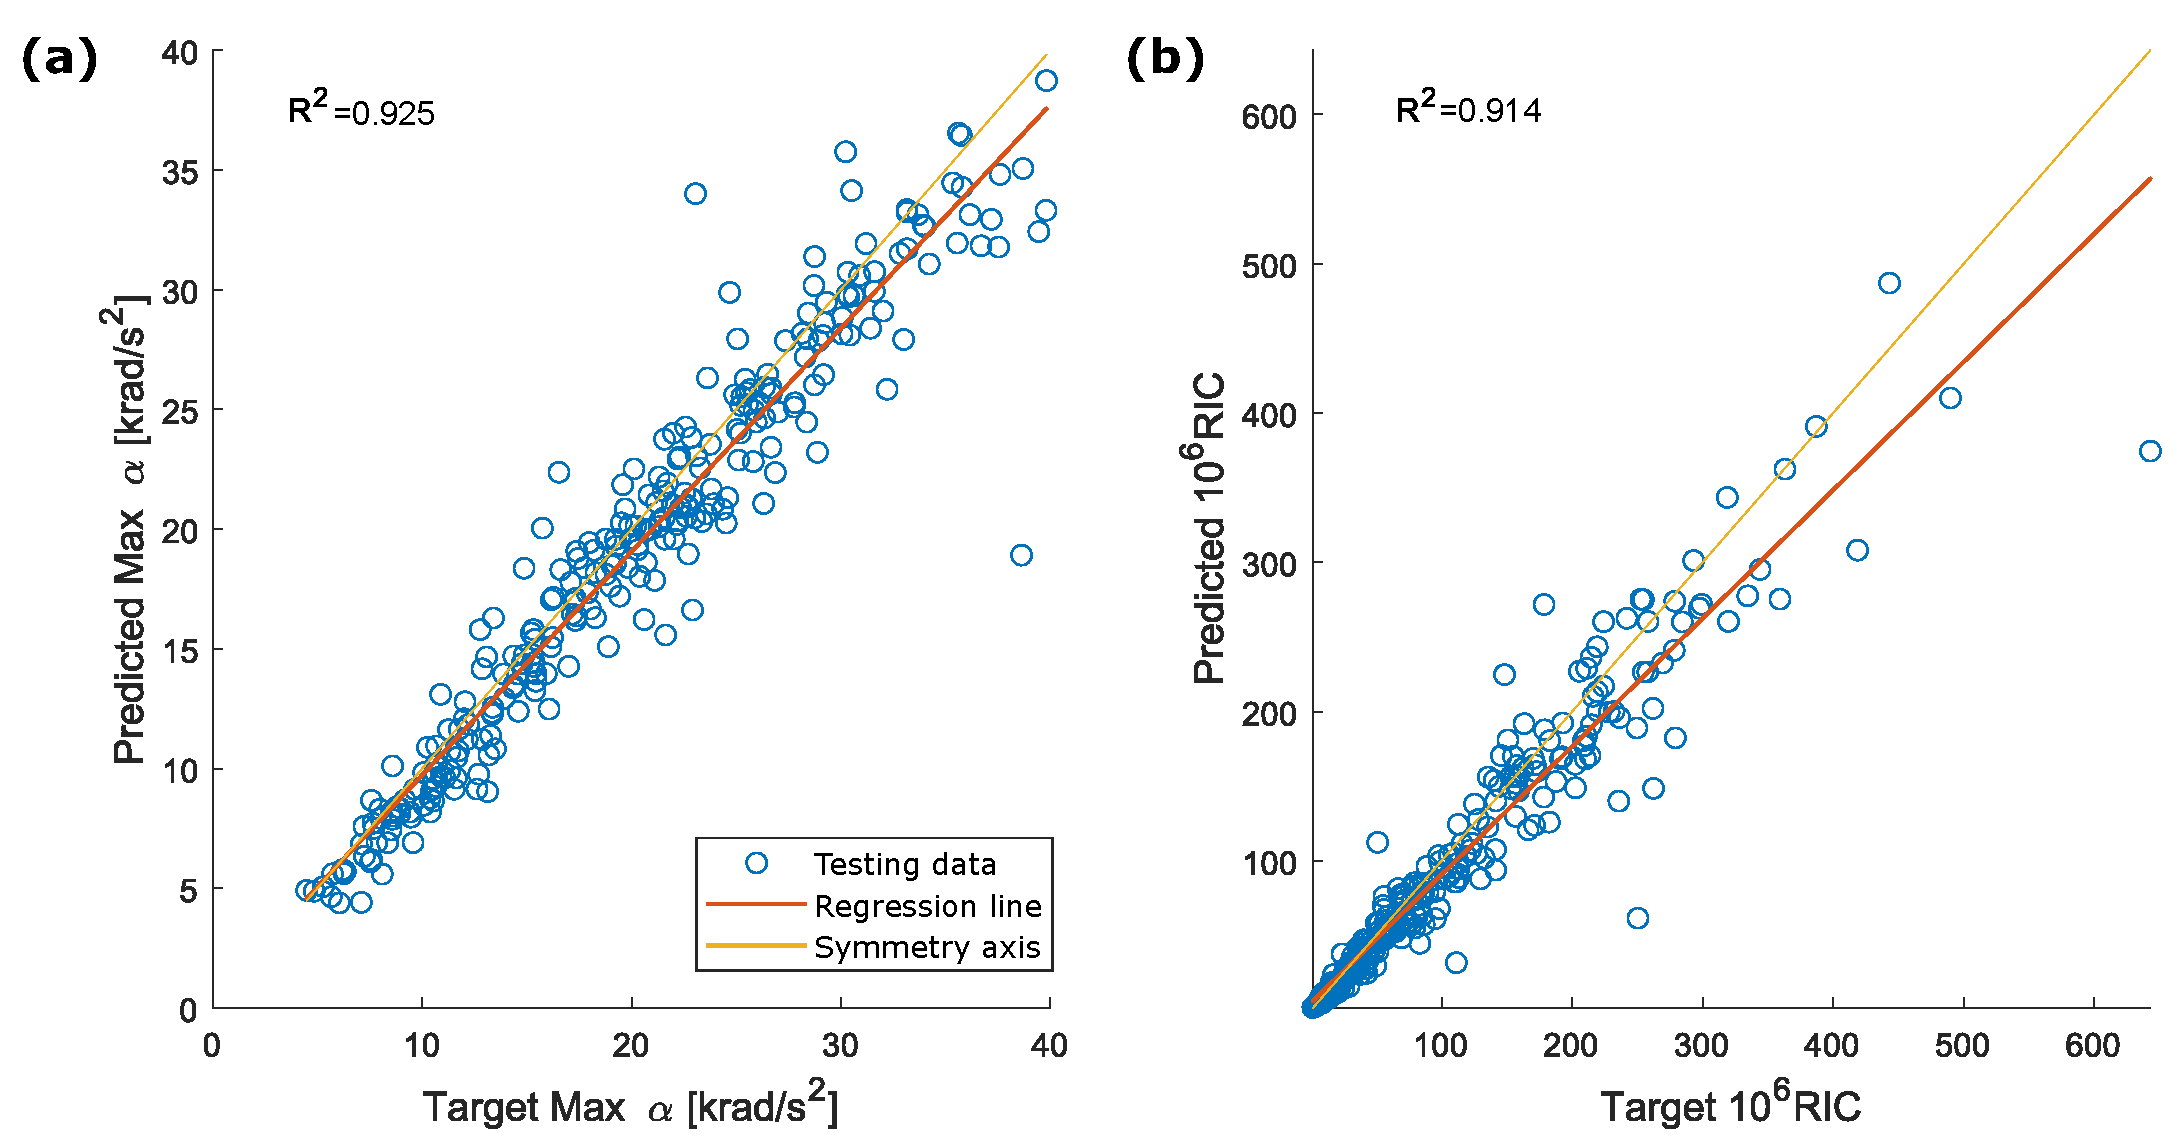
| DANN3 | BLSTM and 2LSTM and 2FC | 0.001 | 300 | 0.802 | 0.927 | 0.827 | 0.783 | 0.681 |
| DANN4 | BLSTM and 2LSTM and 2FC | 0.01 | 200 | 0.775 | 0.849 | 0.759 | 0.746 | 0.679 |
| DANN5 | BLSTM and 2LSTM and 2FC | 0.0001 | 200 | 0.689 | 0.016 | 0.231 | 0.529 | 0.514 |
| DANN6 | BLSTM and 3LSTM and 2FC | 0.001 | 200 | 0.817 | 0.901 | 0.834 | 0.782 | 0.710 |
| DANN7 | 2BLSTM and 3LSTM and 2FC | 0.001 | 200 | 0.791 | 0.917 | 0.834 | 0.791 | 0.705 |
| DANN8 | 3BLSTM and 2LSTM and 2FC | 0.001 | 200 | 0.804 | 0.890 | 0.765 | 0.772 | 0.650 |
| DANN9 | 4LSTM and 2FC | 0.001 | 200 | 0.782 | 0.900 | 0.780 | 0.772 | 0.643 |
Publisher’s Note: MDPI stays neutral with regard to jurisdictional claims in published maps and institutional affiliations. |
© 2022 by the authors. Licensee MDPI, Basel, Switzerland. This article is an open access article distributed under the terms and conditions of the Creative Commons Attribution (CC BY) license (https://creativecommons.org/licenses/by/4.0/).
Share and Cite
Bracali, A.; Baldanzini, N. Estimation of Head Accelerations in Crashes Using Neural Networks and Sensors Embedded in the Protective Helmet. Sensors 2022, 22, 5592. https://doi.org/10.3390/s22155592
Bracali A, Baldanzini N. Estimation of Head Accelerations in Crashes Using Neural Networks and Sensors Embedded in the Protective Helmet. Sensors. 2022; 22(15):5592. https://doi.org/10.3390/s22155592
Chicago/Turabian StyleBracali, Andrea, and Niccolò Baldanzini. 2022. "Estimation of Head Accelerations in Crashes Using Neural Networks and Sensors Embedded in the Protective Helmet" Sensors 22, no. 15: 5592. https://doi.org/10.3390/s22155592
APA StyleBracali, A., & Baldanzini, N. (2022). Estimation of Head Accelerations in Crashes Using Neural Networks and Sensors Embedded in the Protective Helmet. Sensors, 22(15), 5592. https://doi.org/10.3390/s22155592