
Benchmarking Built-In Tracking Systems for Indoor AR Applications on Popular Mobile Devices


Abstract
:1. Introduction
2. Related Works
3. Materials and Methods
3.1. Description of Selected Devices
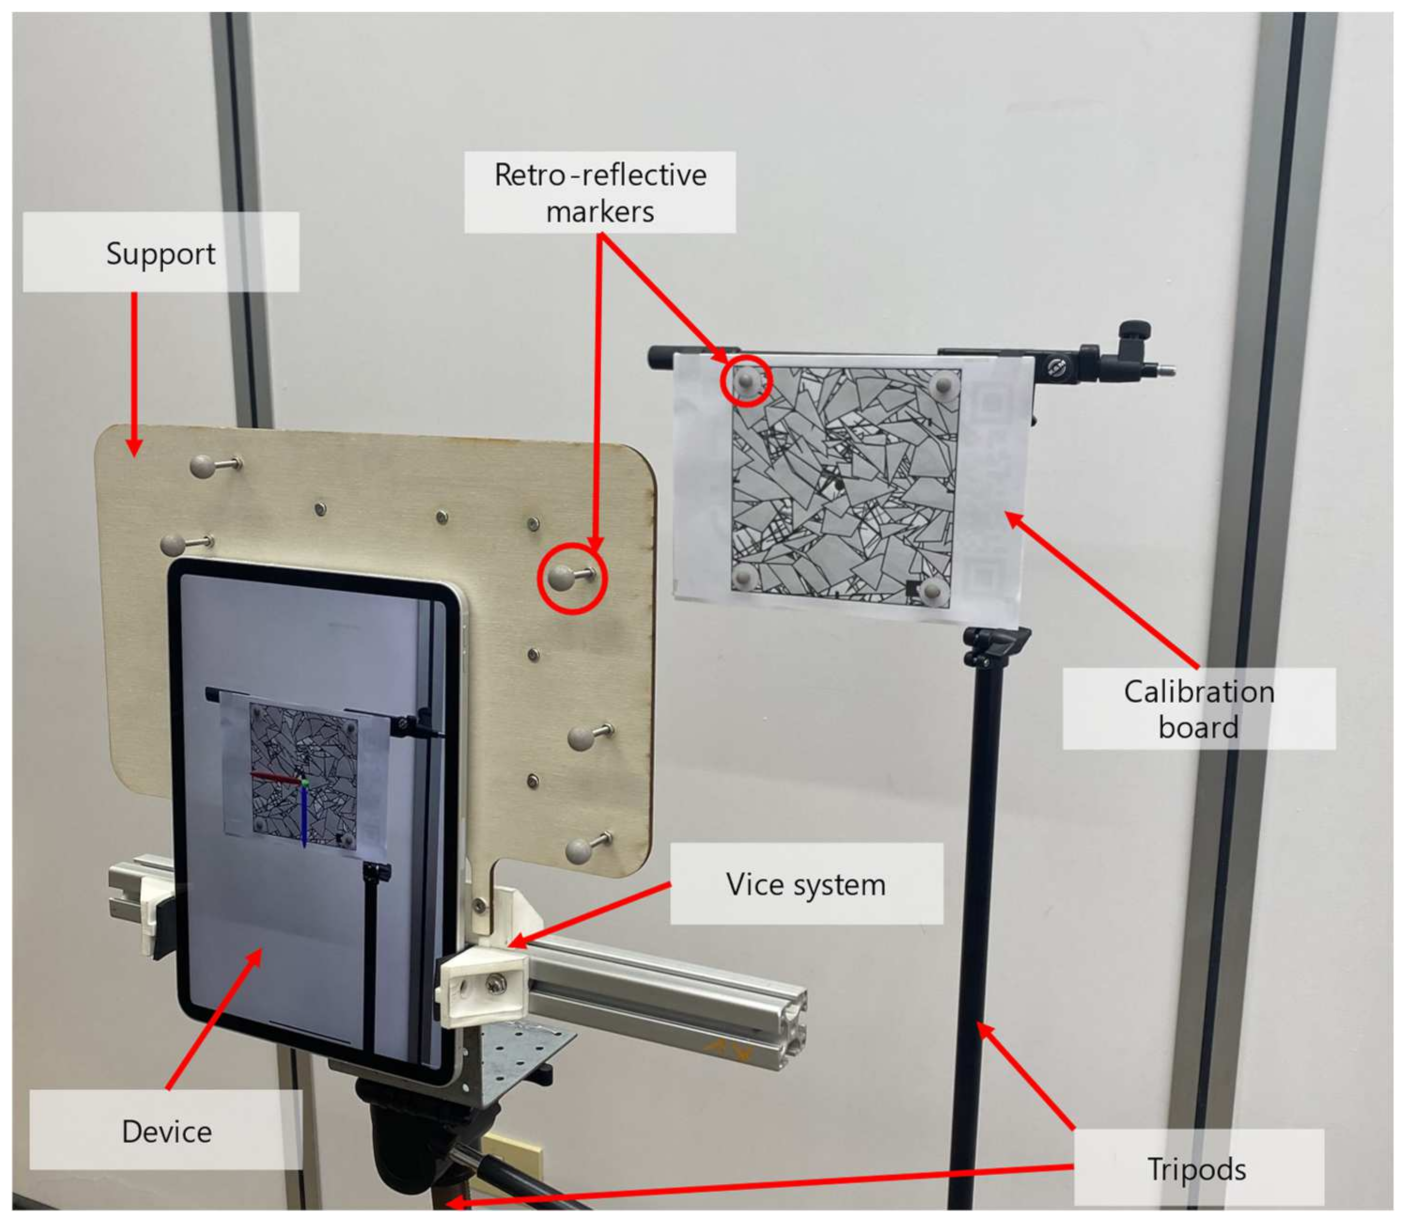
3.2. Experimental Setup
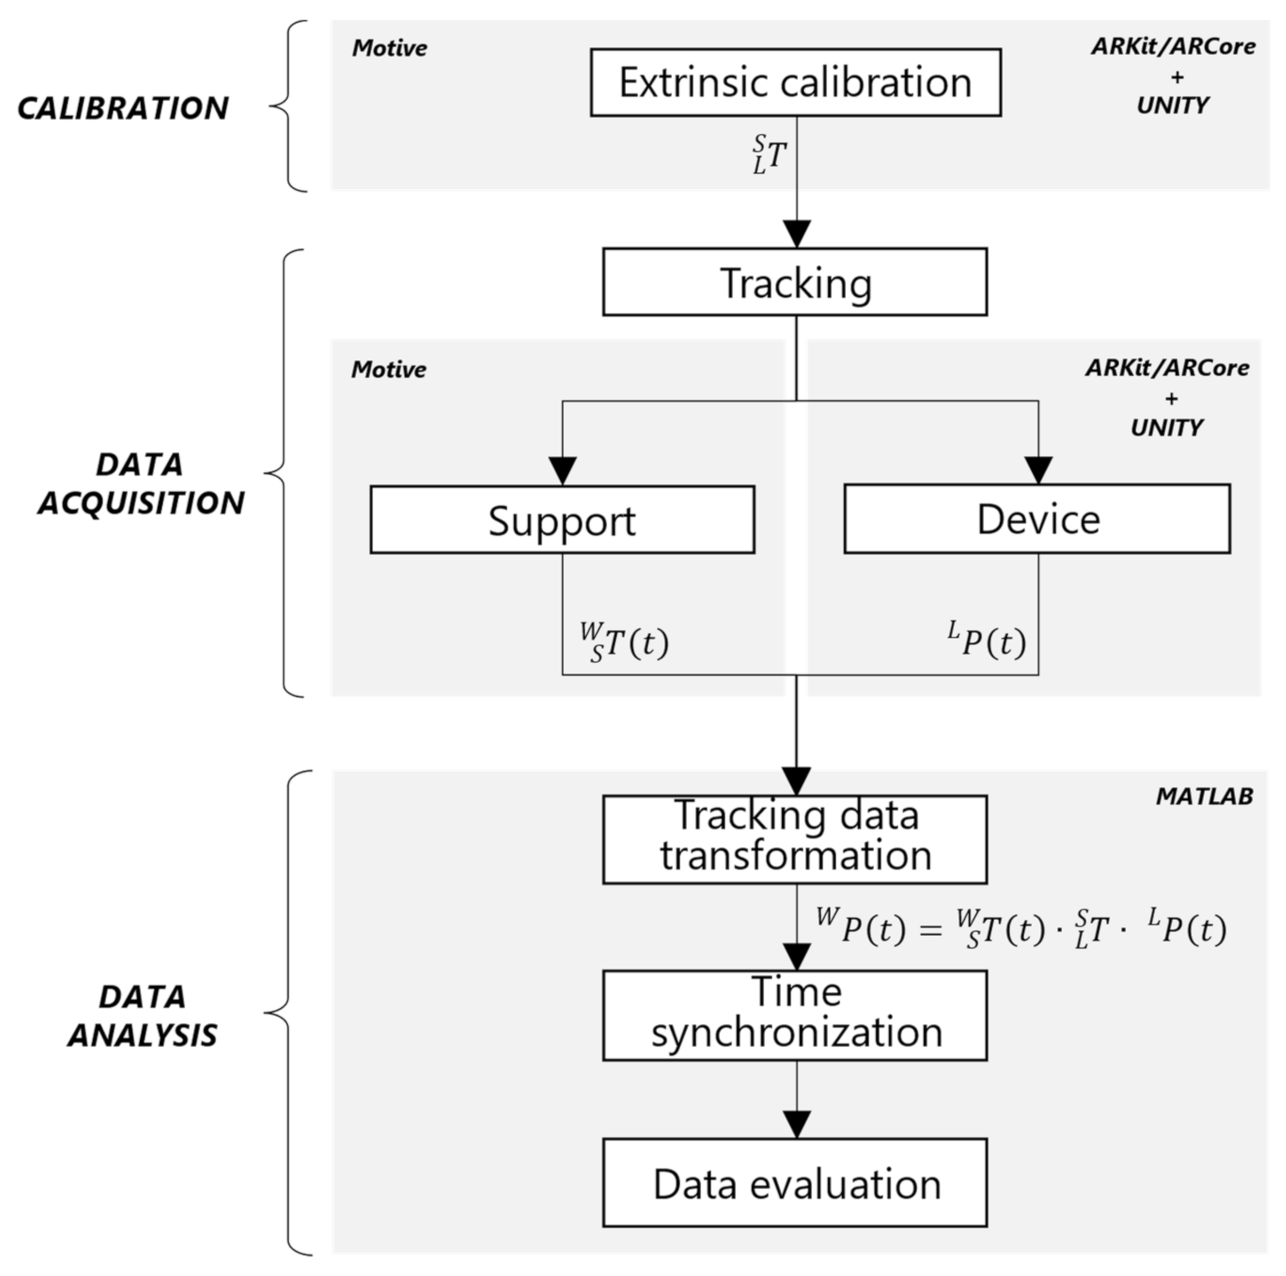
3.3. Evaluation Method
3.3.1. Calibration
3.3.2. Data Acquisition
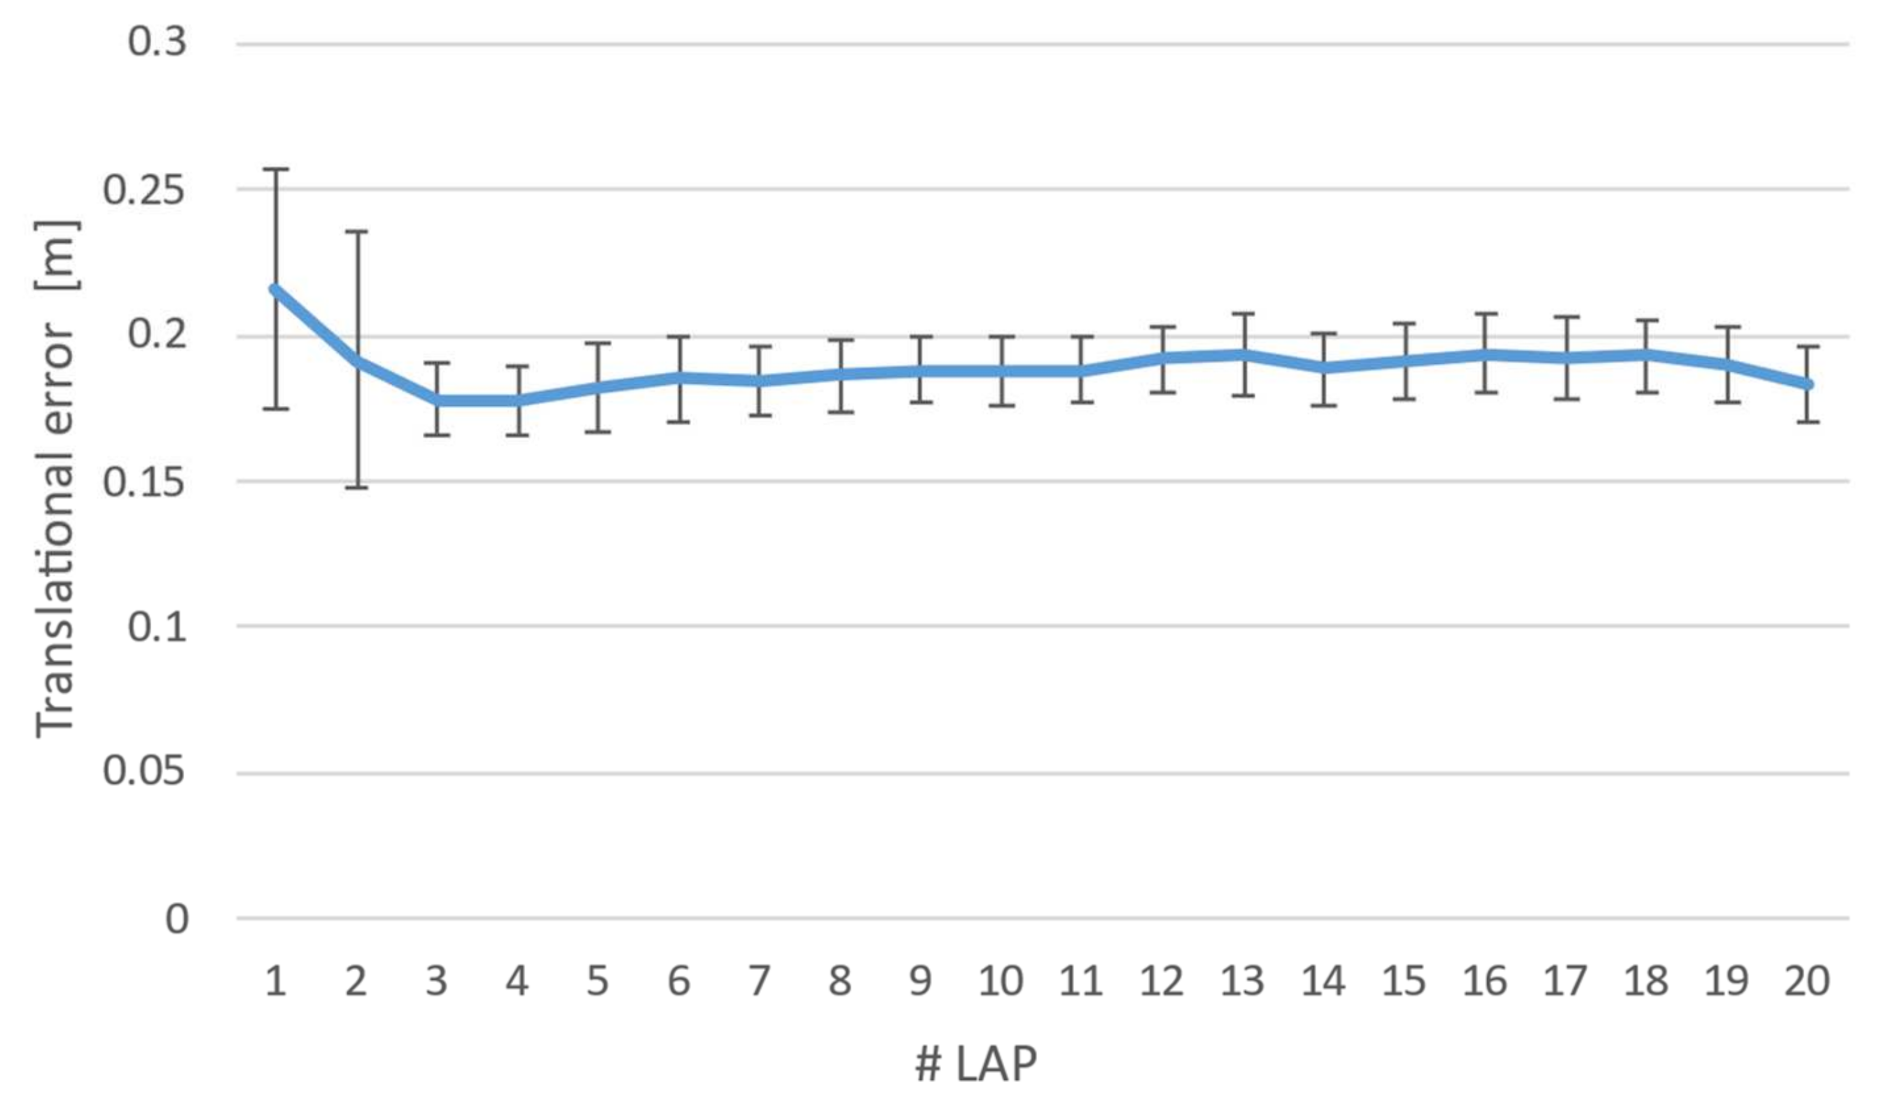
3.3.3. Preliminary Tests
3.3.4. Data Analysis
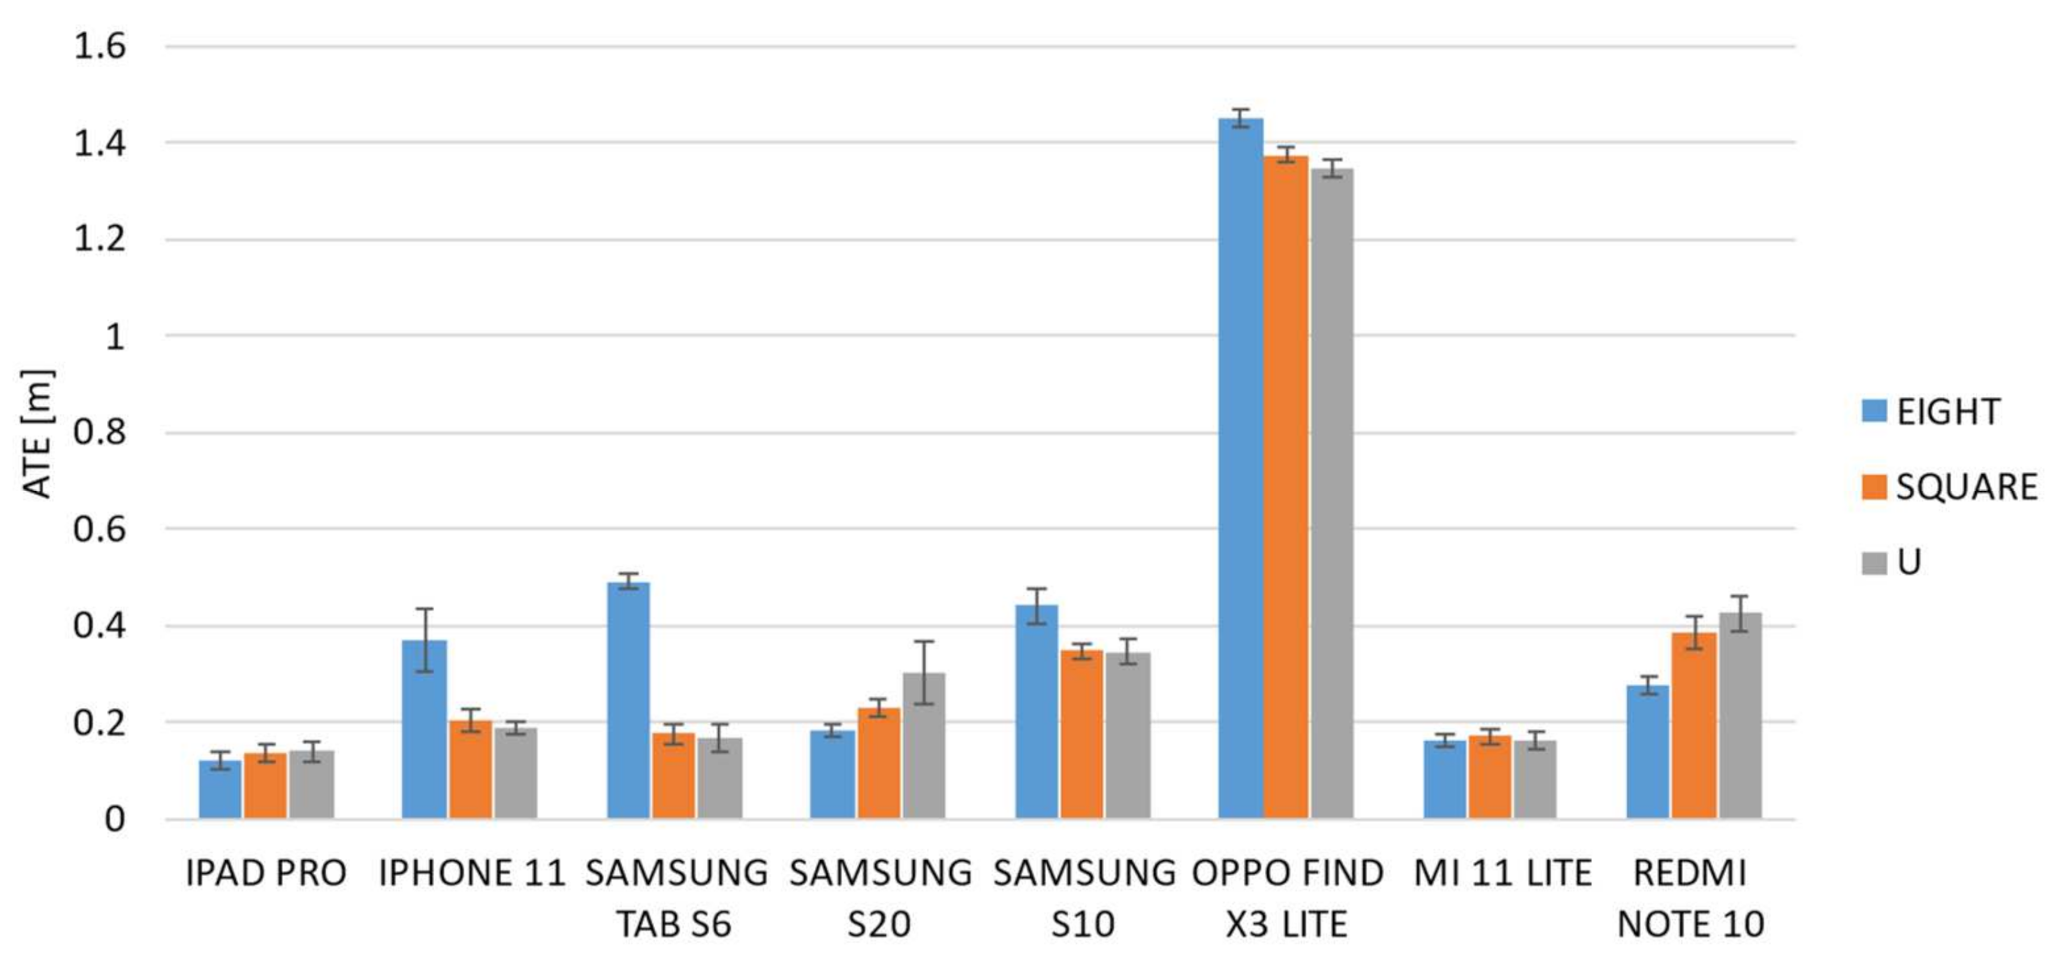
4. Results and Discussion
5. Conclusions
Author Contributions
Funding
Institutional Review Board Statement
Informed Consent Statement
Acknowledgments
Conflicts of Interest
Nomenclature
| AR | Augmented Reality |
| SDK | Software Development Kit |
| SLAM | Simultaneous localization and mapping |
| LIDAR | Laser Imaging Detection and Ranging |
| ATE | Absolute Trajectory Error |
| RPE | Relative Pose Error |
References
- Liberatore, M.J.; Wagner, W.P. Virtual, mixed, and augmented reality: A systematic review for immersive systems research. Virtual Real. 2021, 25, 773–799. [Google Scholar] [CrossRef]
- Kim, K.; Billinghurst, M.; Bruder, G.; Duh, H.B.L.; Welch, G.F. Revisiting trends in augmented reality research: A review of the 2nd decade of ISMAR (2008–2017). IEEE Trans. Vis. Comput. Graph. 2018, 24, 2947–2962. [Google Scholar] [CrossRef] [PubMed]
- Sirohi, P.; Agarwal, A.; Maheshwari, P. A survey on Augmented Virtual Reality: Applications and Future Directions. In Proceedings of the 2020 Seventh International Conference on Information Technology Trends (ITT), Abu Dhabi, United Arab Emirates, 25–26 November 2020; pp. 99–106. [Google Scholar]
- Minaee, S.; Liang, X.; Yan, S. Modern Augmented Reality: Applications, Trends, and Future Directions. arXiv 2022, arXiv:2202.09450. [Google Scholar]
- Parekh, P.; Patel, S.; Patel, N.; Shah, M. Systematic review and meta-analysis of augmented reality in medicine, retail, and games. Vis. Comput. Ind. Biomed. Art 2022, 3, 21. [Google Scholar] [CrossRef]
- Chatzopoulos, D.; Bermejo, C.; Huang, Z.; Hui, P. Mobile augmented reality survey: From where we are to where we go. IEEE Access 2017, 5, 6917–6950. [Google Scholar] [CrossRef]
- Masood, T.; Egger, J. Adopting augmented reality in the age of industrial digitalization. Comput. Ind. 2020, 115, 103112. [Google Scholar] [CrossRef]
- Bekele, M.K.; Pierdicca, R.; Frontoni, E.; Malinverni, E.S.; Gain, J. A survey of augmented, virtual, and mixed reality for cultural heritage. J. Comput. Cult. Herit. 2018, 11, 1–36. [Google Scholar] [CrossRef]
- Costa, G.D.M.; Petry, M.R.; Moreira, A.P. Augmented Reality for Human–Robot Collaboration and Cooperation in Industrial Applications: A Systematic Literature Review. Sensors 2022, 22, 2725. [Google Scholar] [CrossRef]
- Garzón, J.; Pavón, J.; Baldiris, S. Systematic review and meta-analysis of augmented reality in educational settings. Virtual Real. 2019, 23, 447–459. [Google Scholar] [CrossRef]
- De Pace, F.; Manuri, F.; Sanna, A. Augmented reality in industry 4.0. Am. J. Comput. Sci. Inf. Technol. 2018, 6, 17. [Google Scholar] [CrossRef]
- Fraga-Lamas, P.; Fernández-Caramés, T.M.; Blanco-Novoa, O.; Vilar-Montesinos, M.A. A review on industrial augmented reality systems for the industry 4.0 shipyard. IEEE Access 2018, 6, 13358–13375. [Google Scholar] [CrossRef]
- Reljić, V.; Milenković, I.; Dudić, S.; Šulc, J.; Bajči, B. Augmented reality applications in industry 4.0 environment. Appl. Sci. 2021, 11, 5592. [Google Scholar] [CrossRef]
- Erdem, A.T.; Ercan, A.Ö. Ercan. Fusing Inertial Sensor Data in an Extended Kalman Filter for 3D Camera Tracking. IEEE Trans. Image Process. 2015, 24, 538–548. [Google Scholar] [CrossRef] [PubMed]
- Palmarini, R.; Erkoyuncu, J.A.; Roy, R.; Torabmostaedi, H. A systematic review of augmented reality applications in maintenance. Robot. Comput. -Integr. Manuf. 2018, 49, 215–228. [Google Scholar] [CrossRef] [Green Version]
- Danielsson, O.; Holm, M.; Syberfeldt, A. Augmented reality smart glasses in industrial assembly: Current status and future challenges. J. Ind. Inf. Integr. 2020, 20, 100175. [Google Scholar] [CrossRef]
- Roberto, R.; Lima, J.P.; Teichrieb, V. Tracking for mobile devices: A systematic mapping study. Comput. Graph. 2016, 56, 20–30. [Google Scholar] [CrossRef]
- de Souza Cardoso, L.F.; Mariano, F.C.M.Q.; Zorzal, E.R. A survey of industrial augmented reality. Comput. Ind. Eng. 2020, 139, 106159. [Google Scholar] [CrossRef]
- Sadeghi-Niaraki, A.; Choi, S.M. A survey of marker-less tracking and registration techniques for health & environmental applications to augmented reality and ubiquitous geospatial information Systems. Sensors 2020, 20, 2997. [Google Scholar]
- Gupta, S.; Chaudhary, R.; Kaur, A.; Mantri, A. A survey on tracking techniques in augmented reality-based application. In Proceedings of the 2019 Fifth International Conference on Image Information Processing (ICIIP), Shimla, India, 15–17 November 2019; pp. 215–220. [Google Scholar]
- Debeunne, C.; Vivet, D. A review of visual-LiDAR fusion based simultaneous localization and mapping. Sensors 2020, 20, 2068. [Google Scholar] [CrossRef] [Green Version]
- Nowacki, P.; Woda, M. Capabilities of arcore and arkit platforms for ar/vr applications. In Proceedings of the International Conference on Dependability and Complex Systems, Brunów, Poland, 1–5 July 2019; Springer: Cham, Switzerland; pp. 358–370. [Google Scholar]
- Cao, J.; Lam, K.Y.; Lee, L.H.; Liu, X.; Hui, P.; Su, X. Mobile Augmented Reality: User Interfaces, Frameworks, and Intelligence. arXiv 2021, arXiv:2106.08710. [Google Scholar]
- Diao, P.H.; Shih, N.J. MARINS: A mobile smartphone AR system for pathfinding in a dark environment. Sensors 2018, 18, 3442. [Google Scholar] [CrossRef] [Green Version]
- Shih, N.J.; Diao, P.H.; Chen, Y. ARTS, an AR tourism system, for the integration of 3D scanning and smartphone AR in cultural heritage tourism and pedagogy. Sensors 2019, 19, 3725. [Google Scholar] [CrossRef] [PubMed] [Green Version]
- Wang, J.; Qi, Y. A Multi-User Collaborative AR System for Industrial Applications. Sensors 2022, 22, 1319. [Google Scholar] [CrossRef]
- Li, X.; Tian, Y.; Zhang, F.; Quan, S.; Xu, Y. Object detection in the context of mobile augmented reality. In Proceedings of the 2020 IEEE International Symposium on Mixed and Augmented Reality (ISMAR), Porto de Galinhas, Brazil, 9–13 November 2020; pp. 156–163. [Google Scholar]
- Ye, H.; Kwan, K.C.; Su, W.; Fu, H. ARAnimator: In-situ character animation in mobile AR with user-defined motion gestures. ACM Trans. Graph. 2020, 39, 83. [Google Scholar] [CrossRef]
- Monica, R.; Aleotti, J. Evaluation of the Oculus Rift S tracking system in room scale virtual reality. Virtual Real. 2022, 1–11. [Google Scholar] [CrossRef]
- Soares, I.; BSousa, R.; Petry, M.; Moreira, A.P. Accuracy and Repeatability Tests on HoloLens 2 and HTC Vive. Multimodal Technol. Interact. 2021, 5, 47. [Google Scholar] [CrossRef]
- Groves, L.A.; Carnahan, P.; Allen, D.R.; Adam, R.; Peters, T.M.; Chen, E. Accuracy assessment for the co-registration between optical and VIVE head-mounted display tracking. Int. J. Comput. Assist. Radiol. Surg. 2019, 14, 1207–1215. [Google Scholar] [CrossRef]
- Li, J.; Slembrouck, M.; Deboeverie, F.; Bernardos, A.M.; Besada, J.A.; Veelaert, P.; Casar, J.R. A hybrid pose tracking approach for handheld augmented reality. In Proceedings of the 9th International Conference on Distributed Smart Cameras, Seville, Spain, 8–11 September 2015; pp. 7–12. [Google Scholar]
- Marino, E.; Barbieri, L.; Colacino, B.; Fleri, A.K.; Bruno, F. An Augmented Reality inspection tool to support workers in Industry 4.0 environments. Comput. Ind. 2021, 127, 103412. [Google Scholar] [CrossRef]
- Bruno, F.; Barbieri, L.; Marino, E.; Muzzupappa, M.; D’Oriano, L.; Colacino, B. An augmented reality tool to detect and annotate design variations in an Industry 4.0 approach. Int. J. Adv. Manuf. Technol. 2019, 105, 875–887. [Google Scholar] [CrossRef]
- Bruno, F.; Barbieri, L.; Marino, E.; Muzzupappa, M.; Colacino, B. A Handheld Mobile Augmented Reality Tool for On-Site Piping Assembly Inspection. In International Conference of the Italian Association of Design Methods and Tools for Industrial Engineering; Springer: Cham, Switzerland, 2019; pp. 129–139. [Google Scholar]
- Feigl, T.; Porada, A.; Steiner, S.; Löffler, C.; Mutschler, C.; Philippsen, M. Localization Limitations of Arcore, Arkit, and Hololens in Dynamic Large-scale Industry Environments. In Proceedings of the 15th International Joint Conference on Computer Vision, Imaging and Computer Graphics Theory and Applications (GRAPP), Valletta, Malta, 27–29 February 2020; pp. 307–318. [Google Scholar]
- Hasler, O.; Blaser, S.; Nebiker, S. Implementation and first evaluation of an indoor mapping application using smartphones and AR frameworks. Int. Arch. Photogramm. Remote Sens. Spat. Inf. Sci. 2019, XLII-2/W17, 135–141. [Google Scholar] [CrossRef] [Green Version]
- Hübner, P.; Clintworth, K.; Liu, Q.; Weinmann, M.; Wursthorn, S. Evaluation of hololens tracking and depth sensing for indoor mapping applications. Sensors 2020, 20, 1021. [Google Scholar] [CrossRef] [PubMed] [Green Version]
- Cortés, S.; Solin, A.; Rahtu, R.; Kannala, J. Advio: An authentic dataset for visual-inertial odometry. In Proceedings of the European Conference on Computer Vision, Munich, Germany, 8–14 September 2018; pp. 419–434. [Google Scholar]
- Aurand, A.M.; Dufour, J.S.; Marras, W.S. Accuracy map of an optical motion capture system with 42 or 21 cameras in a large measurement volume. J. Biomech. 2017, 58, 237–240. [Google Scholar] [CrossRef] [PubMed]
- Chen, Q.; Zhou, Y.; Wang, Y.; Zhu, M.M.; Guo, L.; He, C.X. Research on stability and accuracy of the OptiTrack system based on mean error. In Proceedings of the International Symposium on Artificial Intelligence and Robotics 2021, Fukuoka, Japan, 28 October 2021; Volume 11884, pp. 438–450. [Google Scholar]
- Nagymáté, G.; Kiss, R.M. Application of OptiTrack motion capture systems in human movement analysis: A systematic literature review. Recent Innov. Mechatron. 2018, 5, 1–9. [Google Scholar]
- Nezami, F.N.; Wächter, M.A.; Maleki, N.; Spaniol, P.; Kühne, L.M.; Haas, A.; Pingel, J.; Tiemann, L.; Nienhaus, F.; Keller, L.; et al. Westdrive X LoopAR: An Open-Access Virtual Reality Project in Unity for Evaluating User Interaction Methods during Takeover Requests. Sensors 2021, 21, 1879. [Google Scholar] [CrossRef] [PubMed]
- Ortiz-Fernandez, L.E.; Cabrera-Avila, E.V.; da Silva, B.M.; Gonçalves, L.M. Smart artificial markers for accurate visual mapping and localization. Sensors 2021, 21, 625. [Google Scholar] [CrossRef]
- Chai, W.; Li, C.; Zhang, M.; Sun, Z.; Yuan, H.; Lin, F.; Li, Q. An enhanced pedestrian visual-inertial SLAM system aided with vanishing point in indoor environments. Sensors 2021, 21, 7428. [Google Scholar] [CrossRef]
- Sturm, J.; Engelhard, N.; Endres, F.; Burgard, W.; Cremers, D. A benchmark for the evaluation of RGB-D SLAM systems. In Proceedings of the 2012 IEEE/RSJ International Conference on Intelligent Robots and Systems, Vilamoura-Algarve, Portugal, 7–12 October 2012; pp. 573–580. [Google Scholar]
- Seiskari, O.; Rantalankila, P.; Kannala, J.; Ylilammi, J.; Rahtu, E.; Solin, A. HybVIO: Pushing the Limits of Real-time Visual-inertial Odometry. In Proceedings of the IEEE/CVF Winter onference on Applications of Computer Vision, Waikoloa, HI, USA, 3–8 January 2022; pp. 701–710. [Google Scholar]
- Di, K.; Zhao, Q.; Wan, W.; Wang, Y.; Gao, Y. RGB-D SLAM based on extended bundle adjustment with 2D and 3D information. Sensors 2016, 16, 1285. [Google Scholar] [CrossRef] [Green Version]
- Newman, P.; Ho, K. SLAM-loop closing with visually salient features. In Proceedings of the 2005 IEEE International Conference on Robotics and Automation, Barcelona, Spain, 18–22 April 2005; pp. 635–642. [Google Scholar]
- Mahon, I.; Williams, S.B.; Pizarro, O.; Johnson-Roberson, M. Efficient view-based SLAM using visual loop closures. IEEE Trans. Robot. 2008, 24, 1002–1014. [Google Scholar] [CrossRef]
- Oufqir, Z.; El Abderrahmani, A.; Satori, K. ARKit and ARCore in serve to augmented reality. In Proceedings of the 2020 International Conference on Intelligent Systems and Computer Vision (ISCV), Fez, Morocco, 9–11 June 2020; pp. 1–7. [Google Scholar]
- Torresani, A.; Rigon, S.; Farella, E.M.; Menna, F.; Remondino, F. Unveiling large-scale historical contents with V-SLAM and markerless mobile AR solutions. Int. Arch. Photogramm. Remote Sens. Spat. Inf. Sci. 2021, 46, 761–768. [Google Scholar] [CrossRef]


| Manufacturer | Device | Type | Price Range | Platform | CPU (GHz) | RAM (GB) | Main Cameras | Camera Resolution | Release Date |
|---|---|---|---|---|---|---|---|---|---|
| Apple | iPad Pro 11 | Tablet | High | iOS | Octa-core (4 × 2.5 + 4 × 1.6) | 8 | 3 | 12 MP, 10 MP | May 2021 |
| Apple | iPhone 11 | Smartphone | High | iOS | Hexa-core (2 × 2.65 + 4 × 1.8) | 4 | 2 | 12 MP | May 2021 |
| Samsung | Tab S6 | Tablet | Medium | Android | Octa-core (1 × 2.84 + 3 × 2.42+ 4 × 1.78) | 4 | 2 | 13 MP, 5 MP | July 2019 |
| Samsung | S20 | Smartphone | High | Android | Octa-core (2 × 2.73 + 2 × 2.50+ 4 × 2.0) | 8 | 3 | 12 MP, 64 MP | March 2020 |
| Samsung | S10 | Smartphone | Medium | Android | Octa-core (2 × 2.73 + 2 × 2.31+ 4 × 1.95) | 8 | 3 | 12 MP, 16 MP | March 2019 |
| Oppo | Find X3 Lite | Smartphone | Low | Android | Octa-core (1 × 2.4 + 1 × 2.2+ 6 × 1.8) | 8 | 4 | 64 MP, 8MP, 2 MP | March 2021 |
| Xiaomi | MI 11 Lite | Smartphone | Low | Android | Octa-core (2 × 2.3 + 6 × 1.8) | 6 | 3 | 64 MP, 8 MP, 4 MP | March 2021 |
| Xiaomi | Redmi Note 10 | Smartphone | Low | Android | Octa-core (2 × 2.2 + 6 × 1.7) | 4 | 4 | 48 MP, 8 MP, 2 MP | March 2021 |
| Path (#) | Shape | Length (m) | Mean Duration (S) |
|---|---|---|---|
| 1 |  | 13 | 160 |
| 2 |  | 8 | 230 |
| 3 |  | 6 | 30 |
| Device | ATE | RPE | ||
|---|---|---|---|---|
| F-Value | p-Value | F-Value | p-Value | |
| iPad Pro | 0.810 | 0.456 | 0.111 | 0.896 |
| iPhone 11 | 14.288 | <0.001 | 21.126 | <0.001 |
| Tab S6 | 110.819 | <0.001 | 304.782 | <0.001 |
| S20 | 13.880 | <0.001 | 7.322 | 0.007 |
| S10 | 9.672 | 0.002 | 180.569 | <0.001 |
| Find X3 Lite | 35.436 | <0.001 | 117.87 | <0.001 |
| Mi 11 Lite | 0.425 | 0.658 | 16.328 | <0.001 |
| Redmi Note 10 | 27.101 | <0.001 | 0.809 | 0.456 |
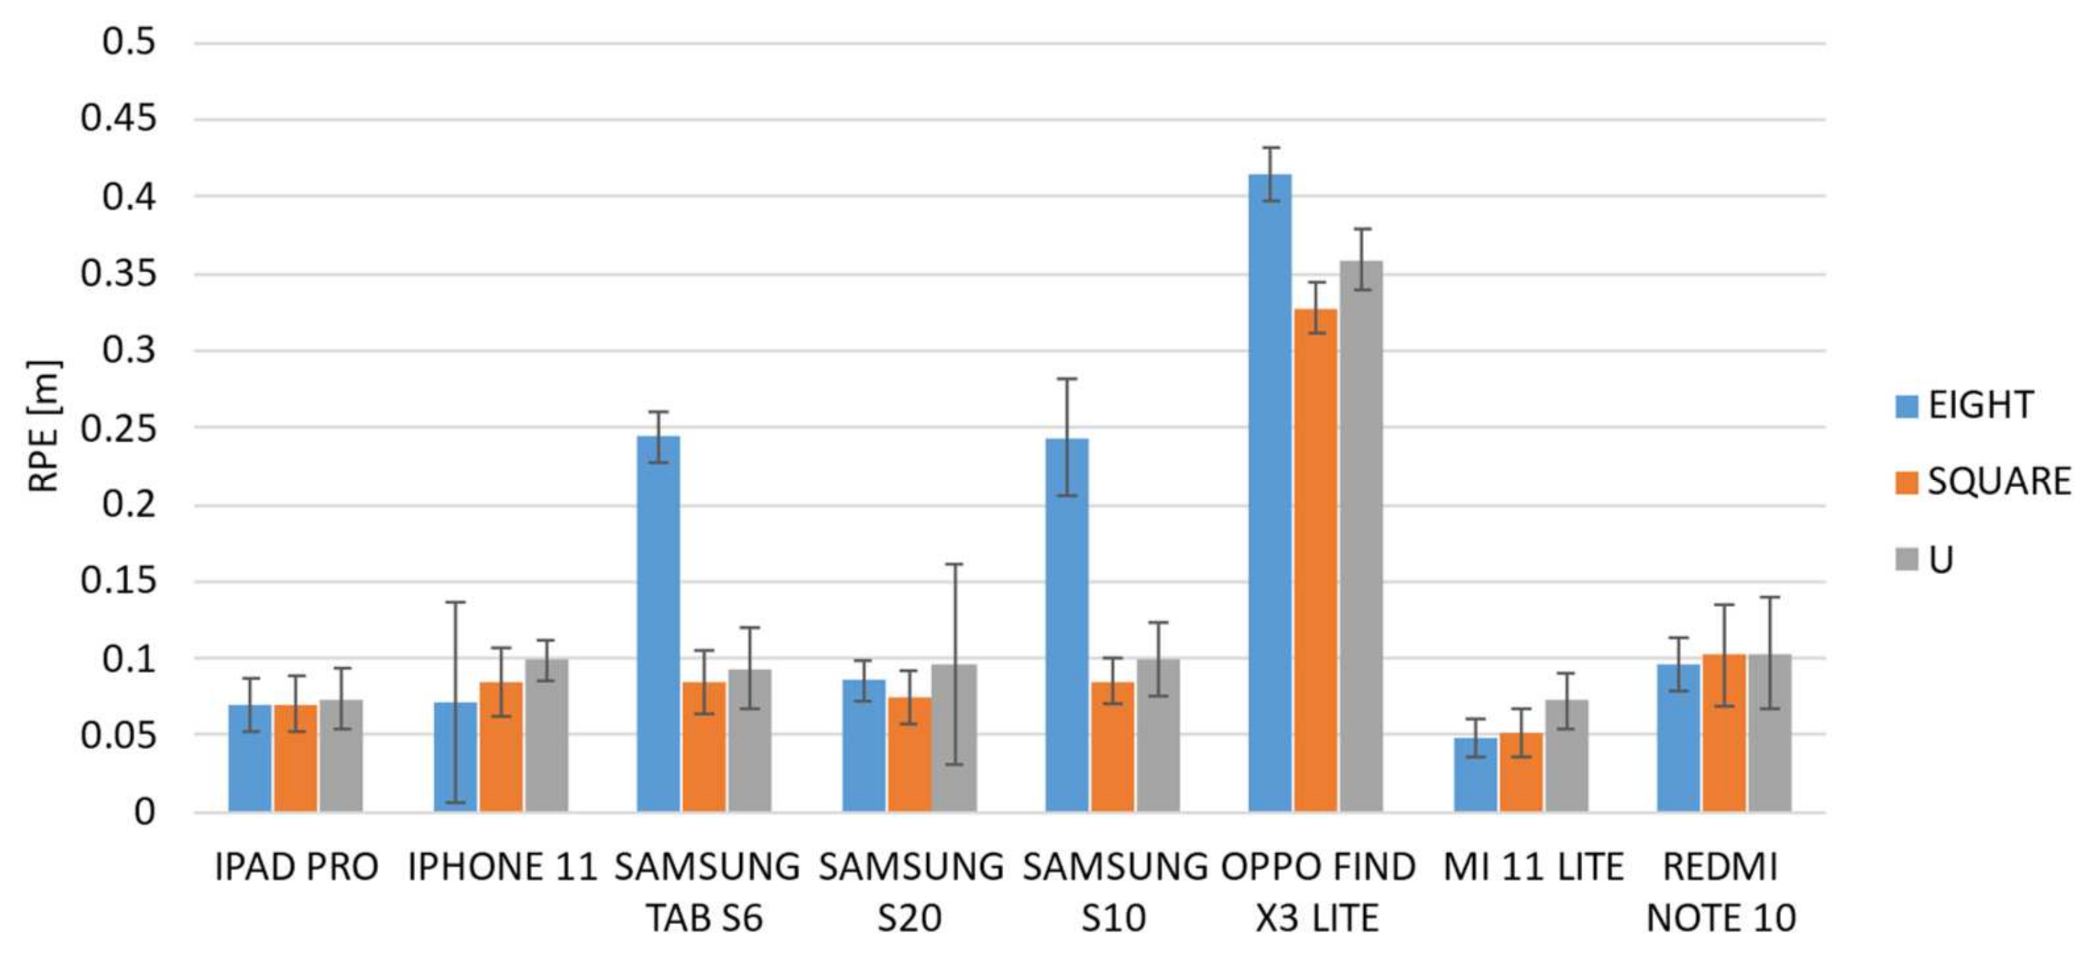
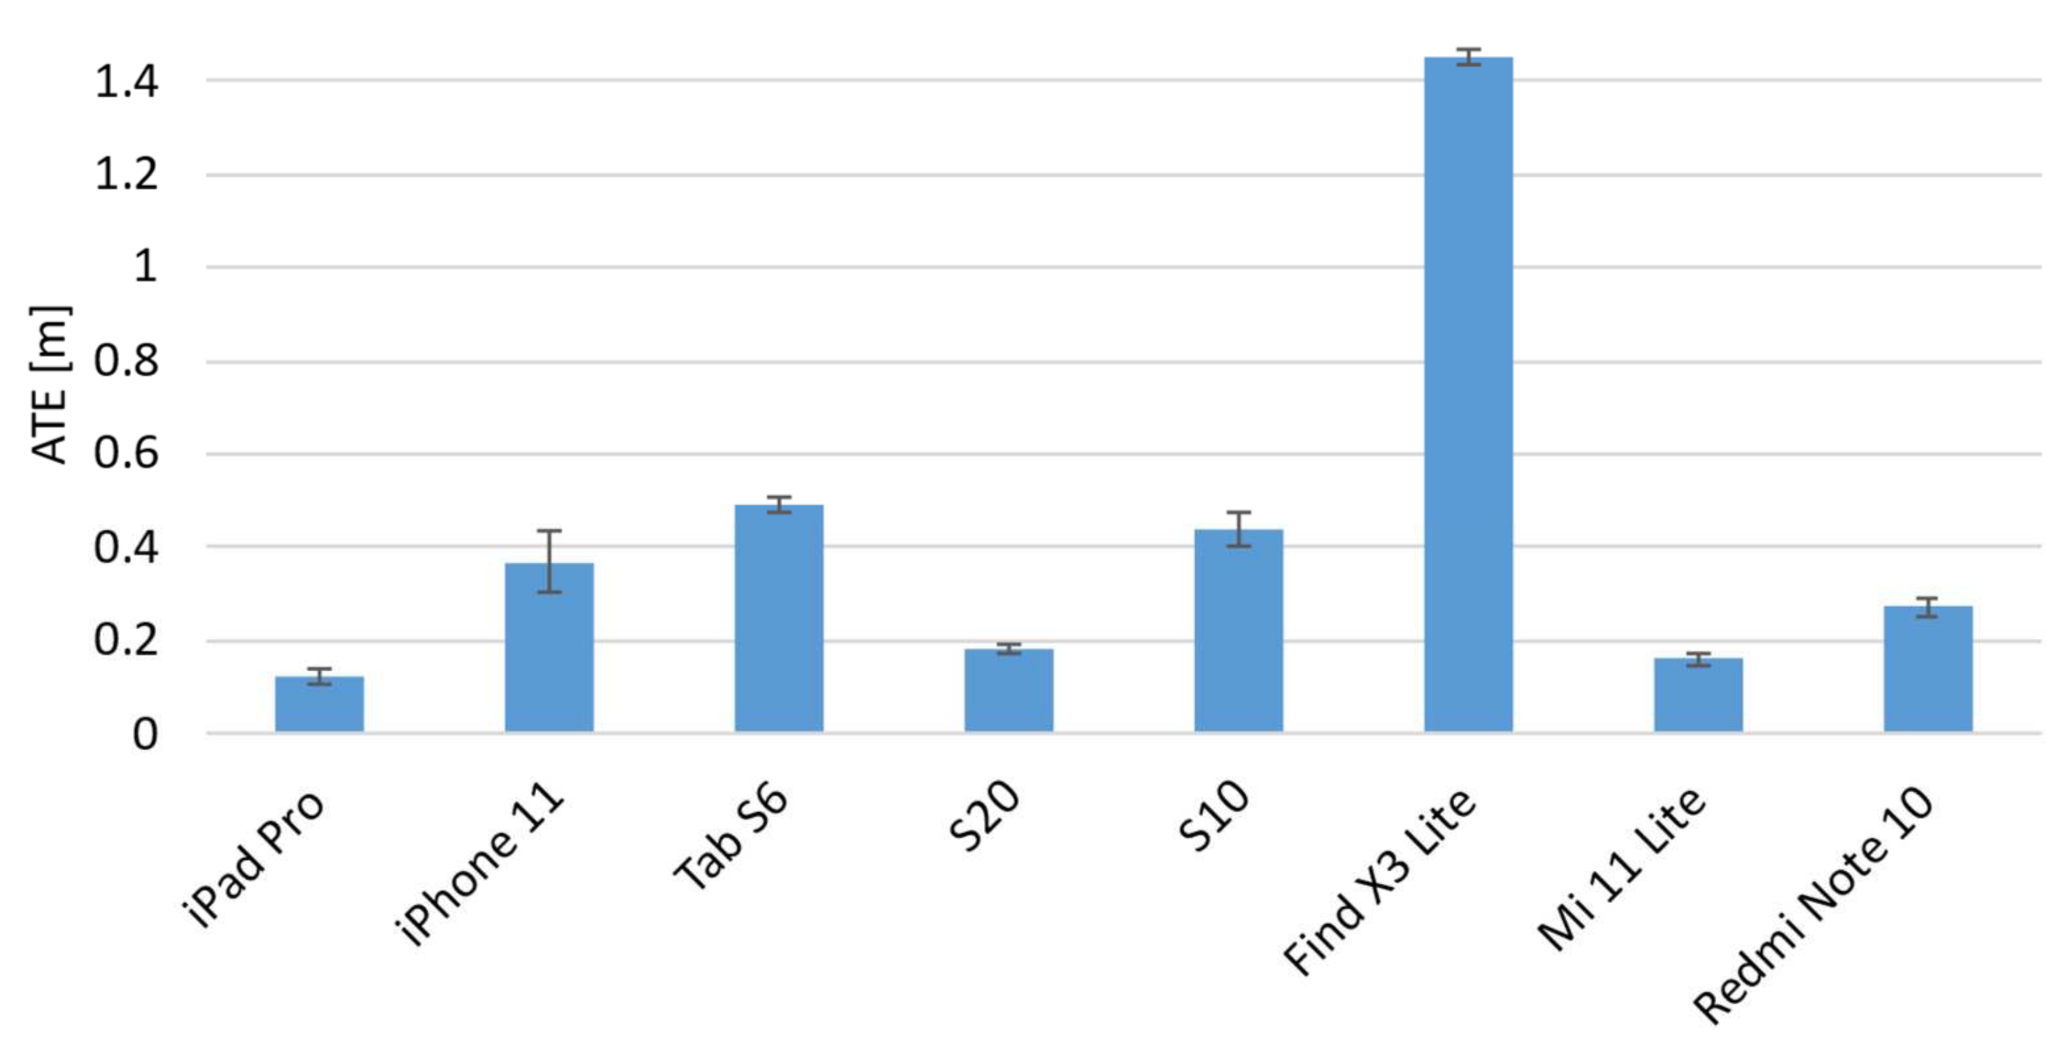
| Device | ATE (m) | RPE (m) | ||||||
|---|---|---|---|---|---|---|---|---|
| Mean | SD | Max | Min | Mean | SD | Max | Min | |
| iPad Pro | 0.121 | 0.027 | 0.175 | 0.089 | 0.069 | 0.013 | 0.097 | 0.052 |
| iPhone 11 | 0.369 | 0.105 | 0.514 | 0.221 | 0.072 | 0.007 | 0.085 | 0.064 |
| Tab S6 | 0.491 | 0.026 | 0.547 | 0.453 | 0.244 | 0.018 | 0.266 | 0.208 |
| S20 | 0.182 | 0.020 | 0.225 | 0.160 | 0.085 | 0.008 | 0.095 | 0.073 |
| S10 | 0.437 | 0.059 | 0.562 | 0.376 | 0.241 | 0.022 | 0.272 | 0.204 |
| Find X3 Lite | 1.451 | 0.027 | 1.494 | 1.411 | 0.414 | 0.012 | 0.438 | 0.391 |
| Mi 11 Lite | 0.162 | 0.0196 | 0.202 | 0.138 | 0.048 | 0.004 | 0.053 | 0.041 |
| Redmi Note 10 | 0.271 | 0.029 | 0.331 | 0.234 | 0.096 | 0.005 | 0.102 | 0.087 |
| Device | Detected Reference Points (#) | ||
|---|---|---|---|
| | | | |
| iPad Pro 11 | 33.233 | 31.061 | 2.069 |
| iPhone 11 | 31.697 | 29.913 | 2.798 |
| Tab S6 | 25.363 | 29.315 | 2.188 |
| S20 | 31.865 | 31.043 | 3.559 |
| S10 | 31.132 | 29.639 | 2.935 |
| Find X3 Lite | 29.662 | 26.812 | 3.865 |
| MI 11 Lite | 31.231 | 30.254 | 3.869 |
| Redmi Note 10 | 31.671 | 30.672 | 3.740 |
Publisher’s Note: MDPI stays neutral with regard to jurisdictional claims in published maps and institutional affiliations. |
© 2022 by the authors. Licensee MDPI, Basel, Switzerland. This article is an open access article distributed under the terms and conditions of the Creative Commons Attribution (CC BY) license (https://creativecommons.org/licenses/by/4.0/).
Share and Cite
Marino, E.; Bruno, F.; Barbieri, L.; Lagudi, A. Benchmarking Built-In Tracking Systems for Indoor AR Applications on Popular Mobile Devices. Sensors 2022, 22, 5382. https://doi.org/10.3390/s22145382
Marino E, Bruno F, Barbieri L, Lagudi A. Benchmarking Built-In Tracking Systems for Indoor AR Applications on Popular Mobile Devices. Sensors. 2022; 22(14):5382. https://doi.org/10.3390/s22145382
Chicago/Turabian StyleMarino, Emanuele, Fabio Bruno, Loris Barbieri, and Antonio Lagudi. 2022. "Benchmarking Built-In Tracking Systems for Indoor AR Applications on Popular Mobile Devices" Sensors 22, no. 14: 5382. https://doi.org/10.3390/s22145382
APA StyleMarino, E., Bruno, F., Barbieri, L., & Lagudi, A. (2022). Benchmarking Built-In Tracking Systems for Indoor AR Applications on Popular Mobile Devices. Sensors, 22(14), 5382. https://doi.org/10.3390/s22145382