
Artificial Intelligence, Machine Learning and Smart Technologies for Nondestructive Evaluation


Abstract
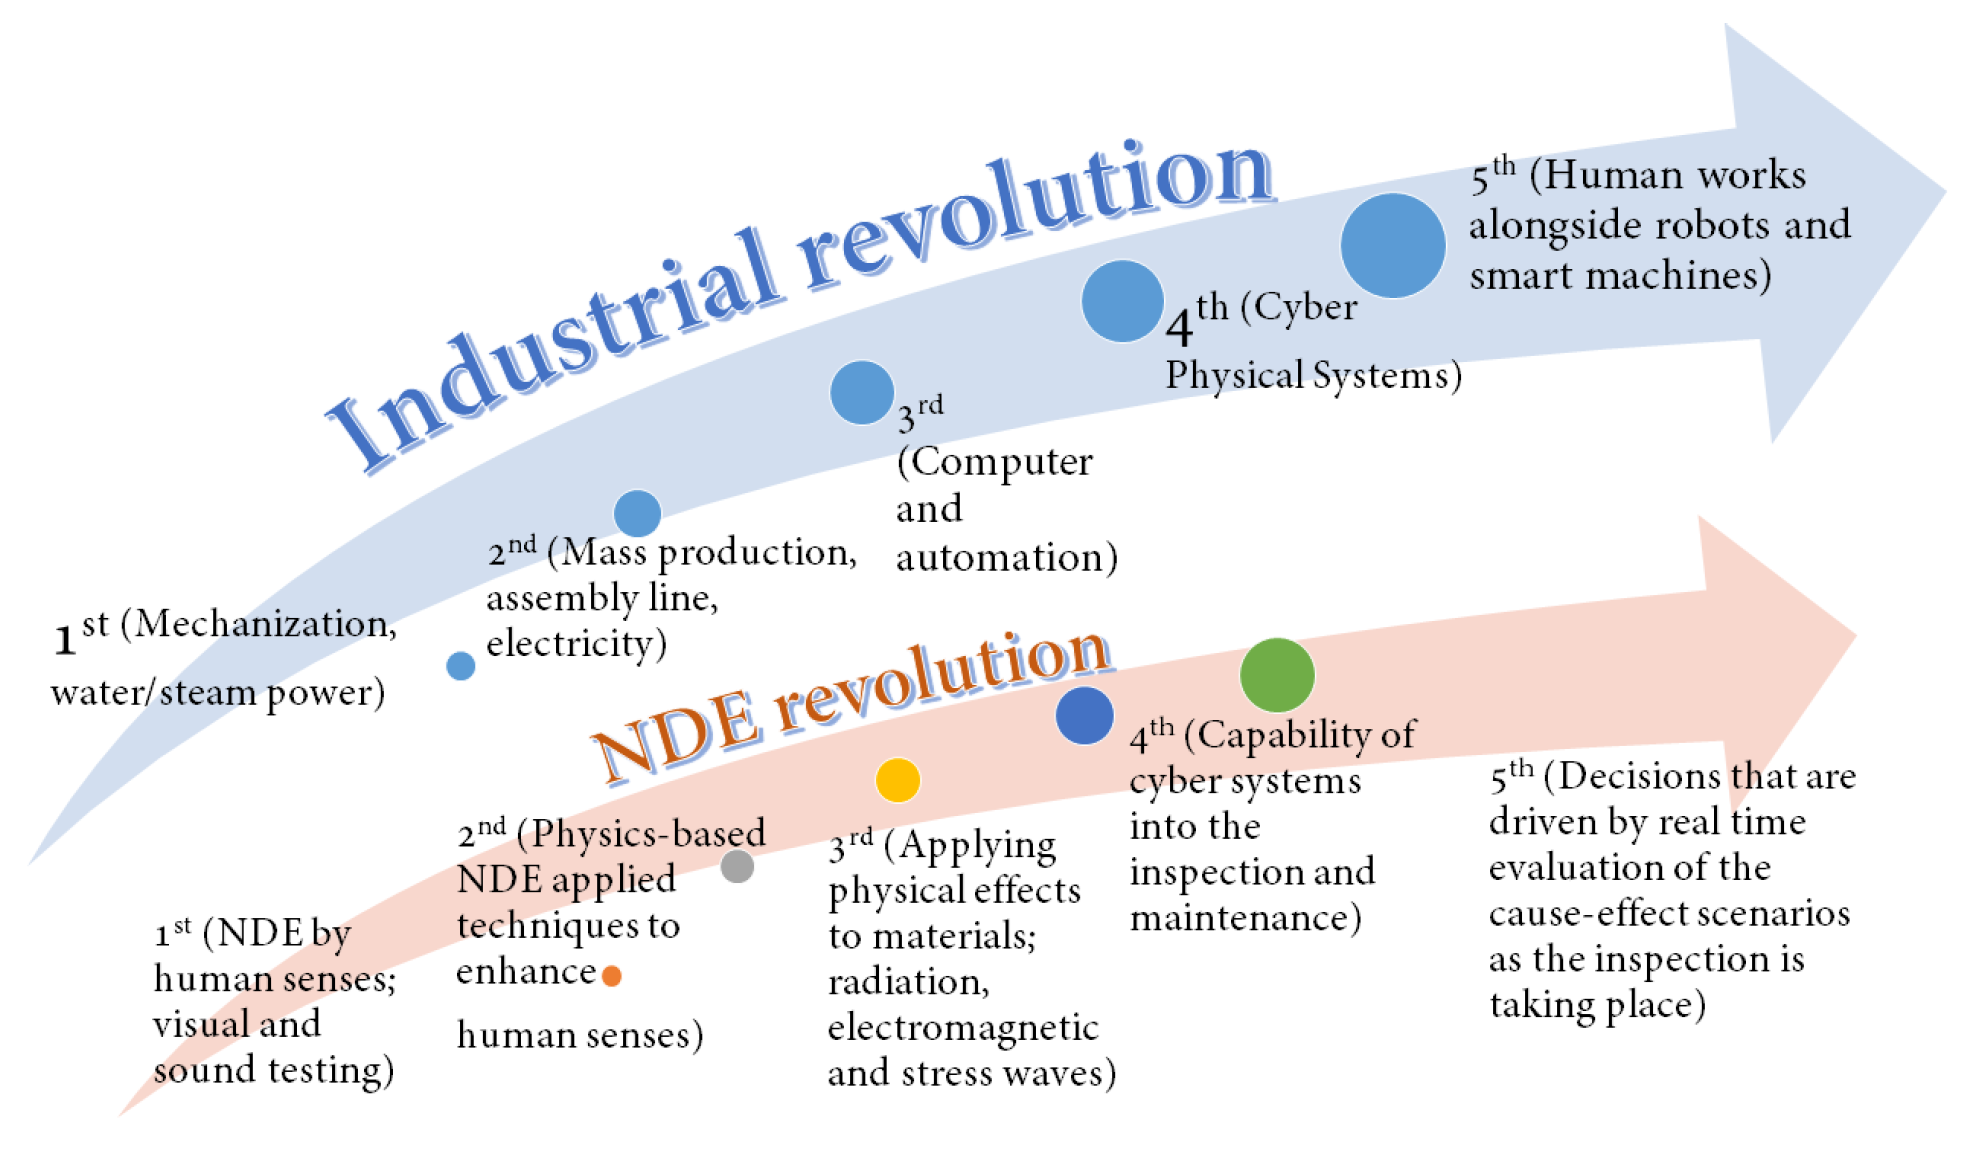
:1. Introduction
1.1. Nondestructive Evaluation (NDE)
1.2. Artificial Intelligence
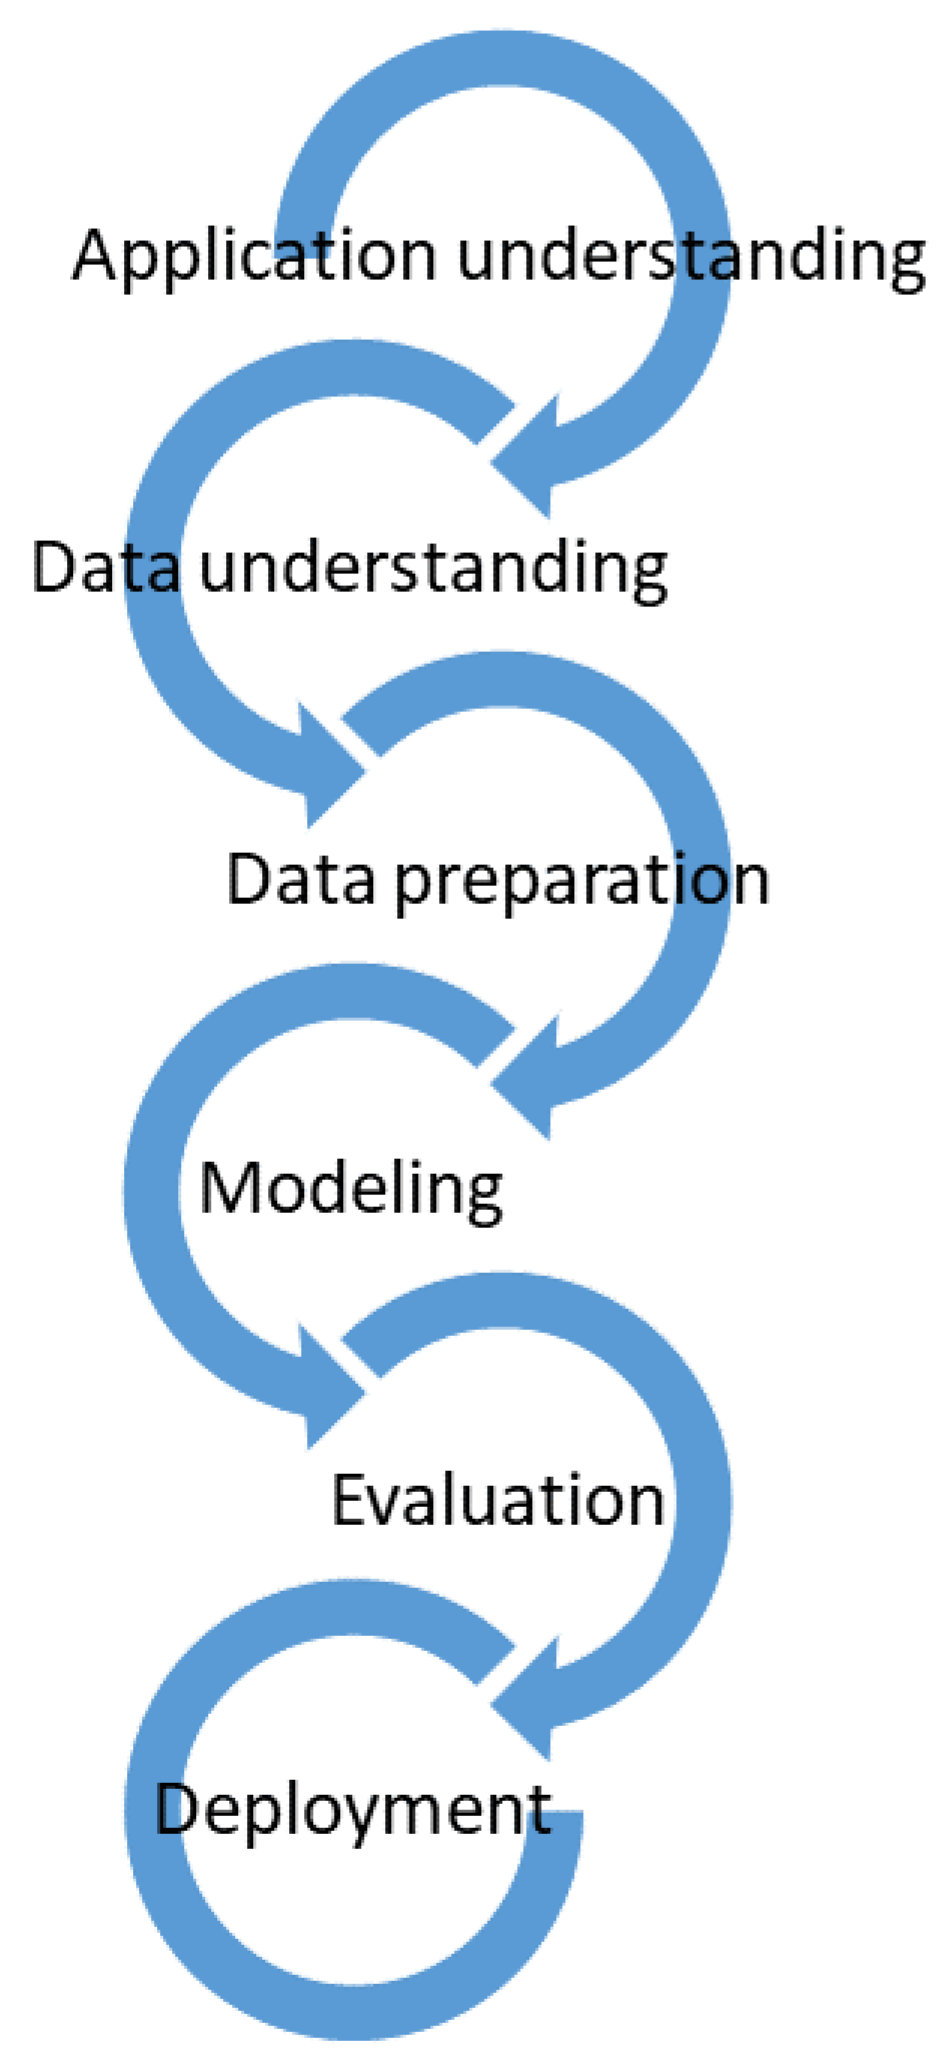
2. Artificial Intelligence in NDE
2.1. Machine Learning
2.2. Unsupervised Learning
2.3. Cluster Analysis
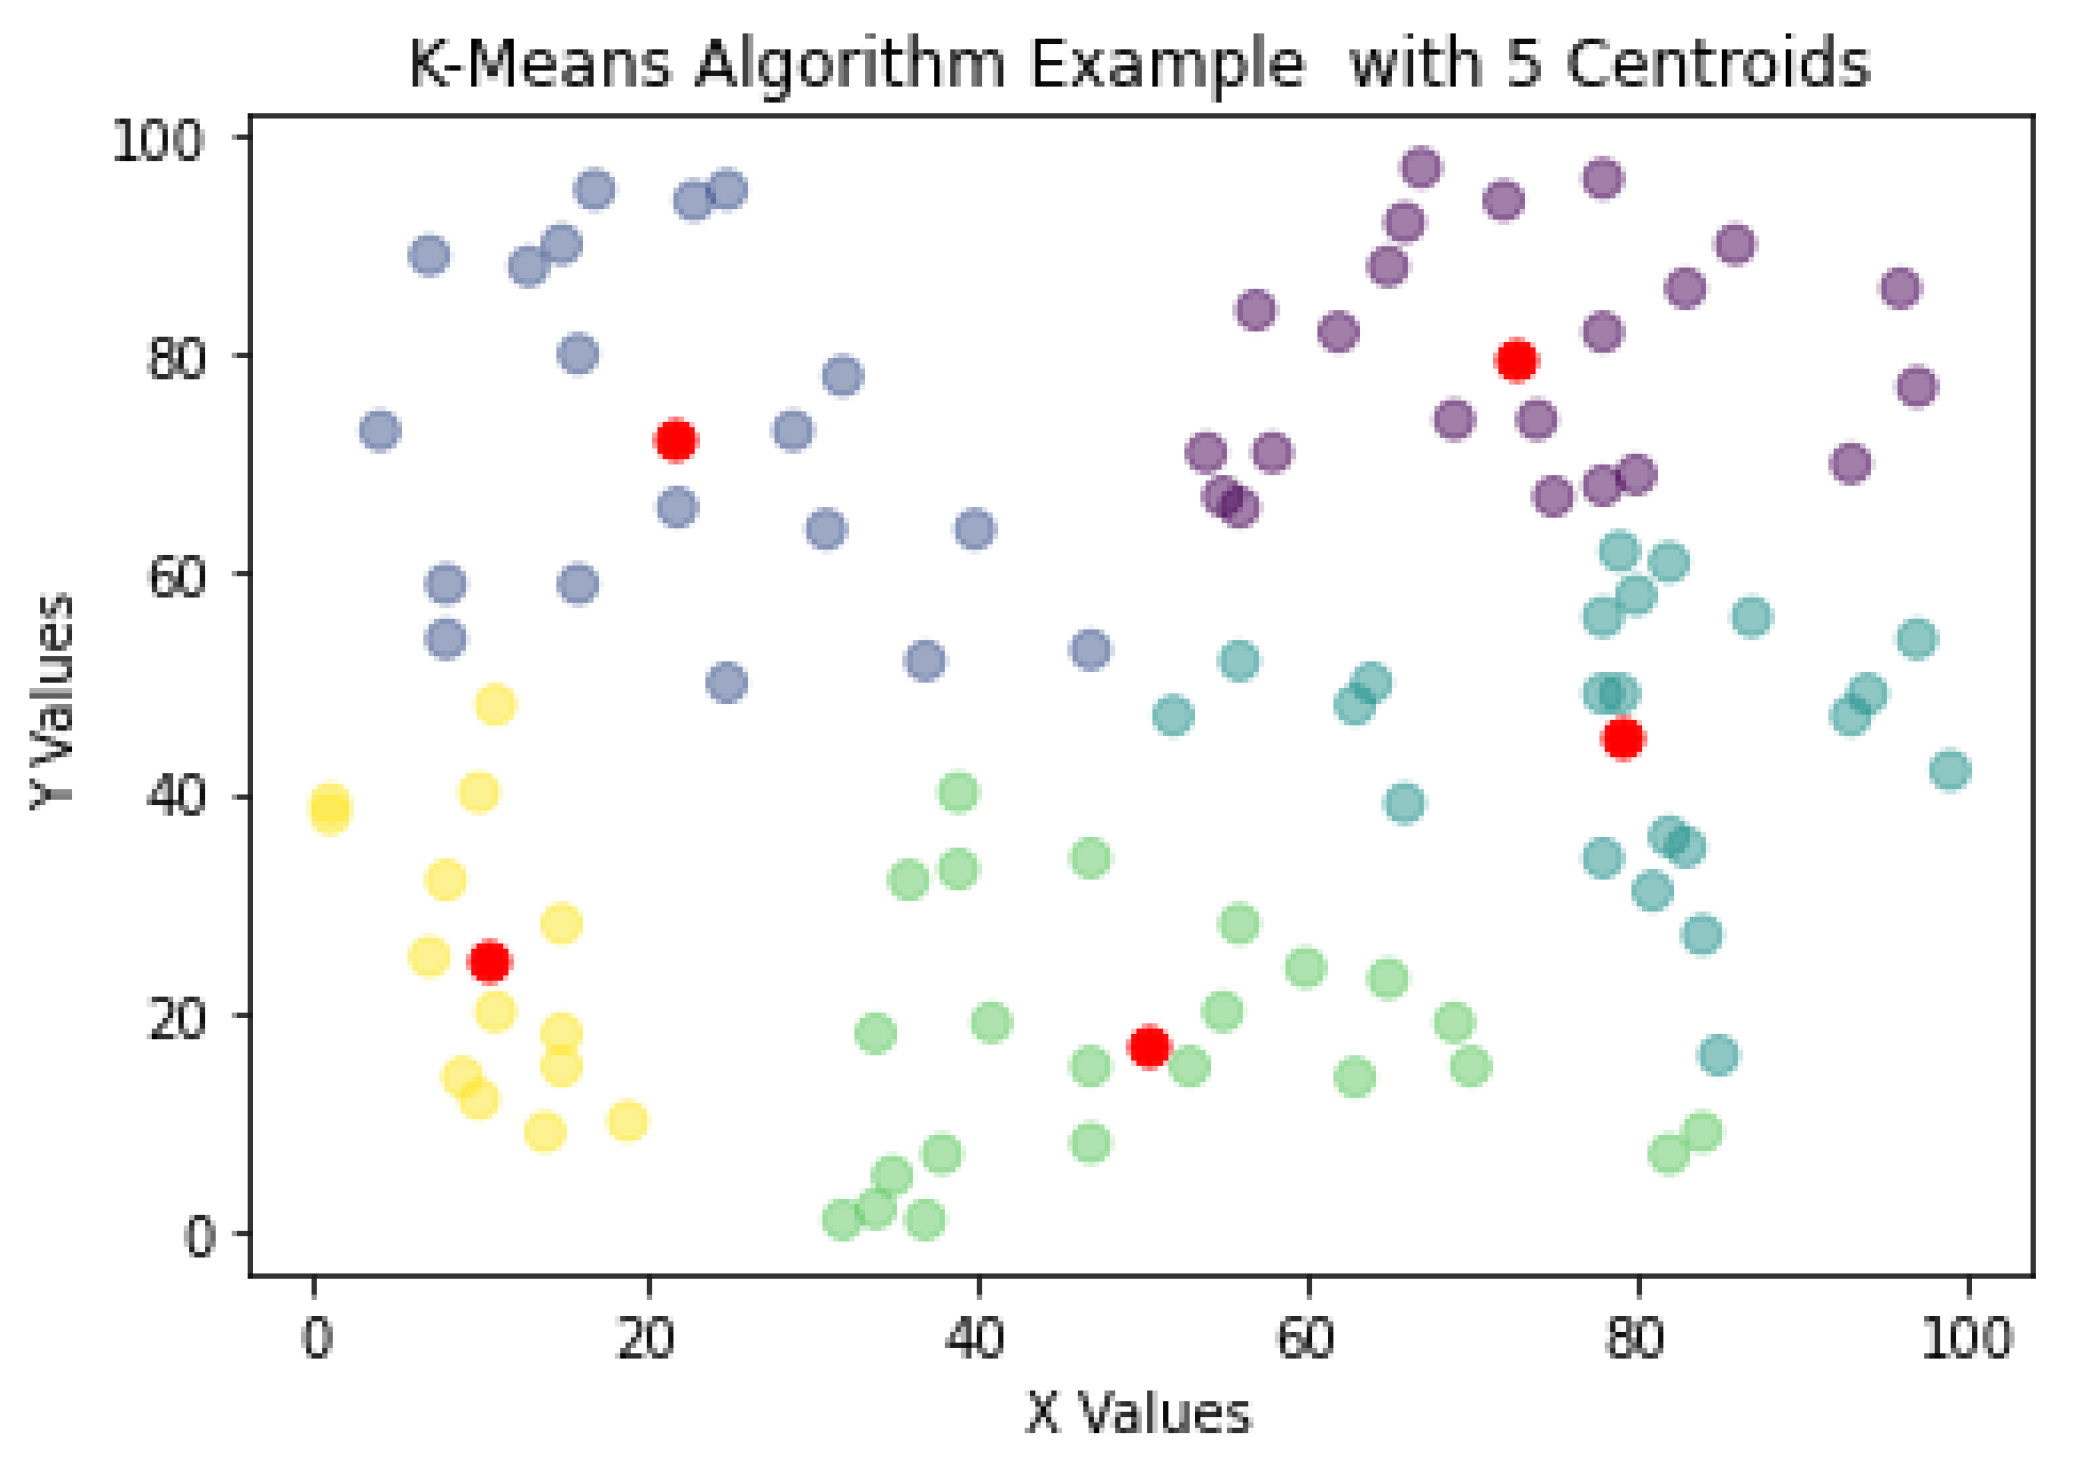
2.3.1. K-Means Algorithm
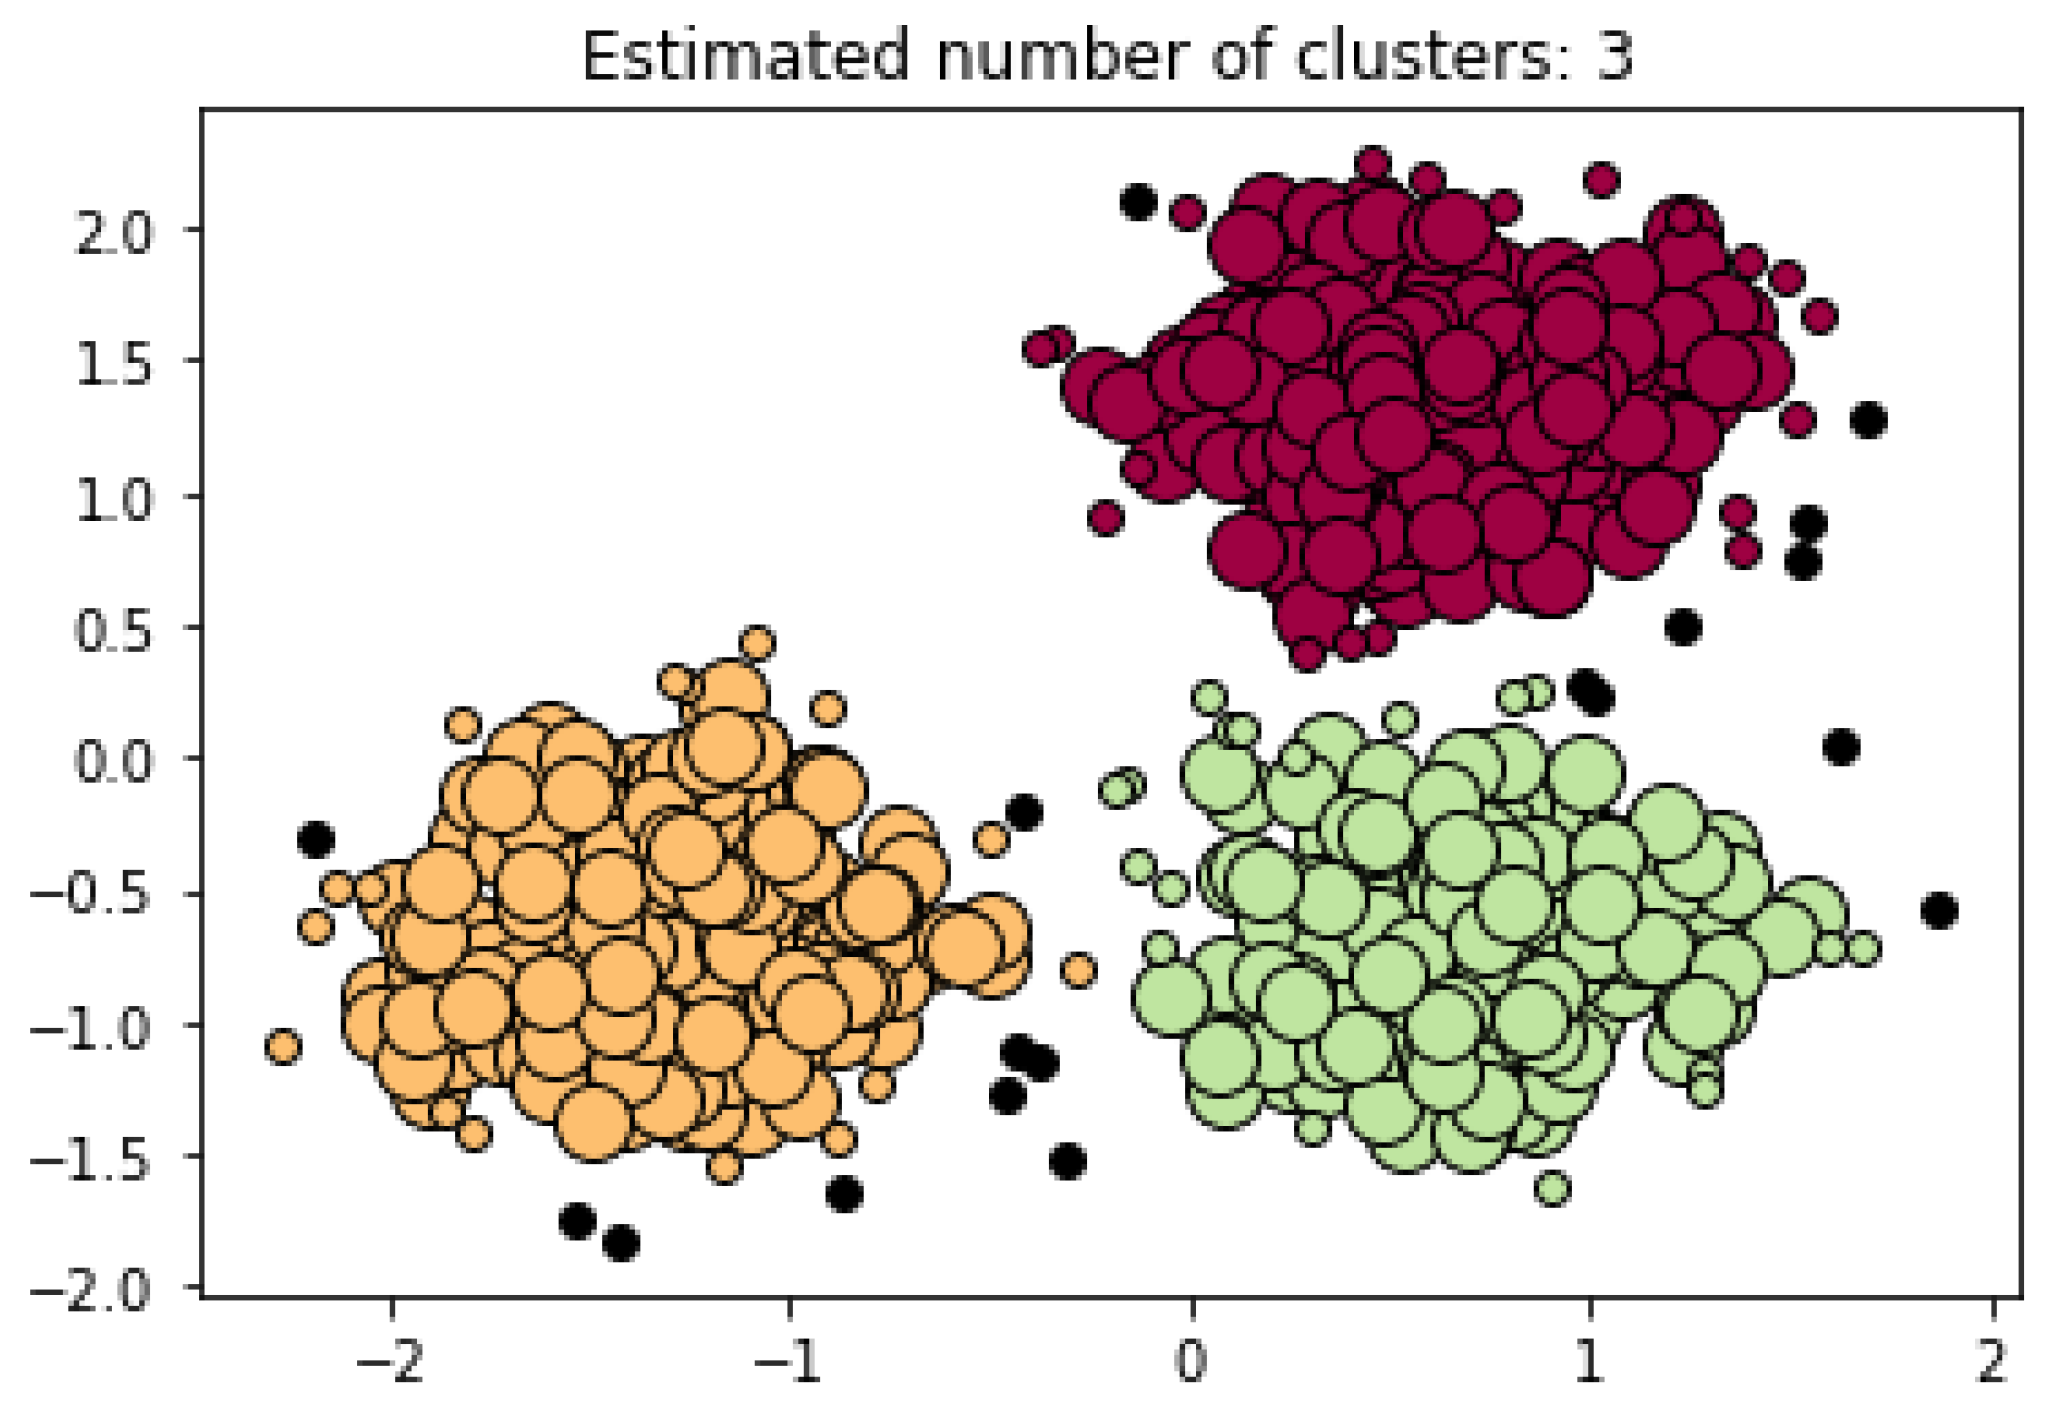
2.3.2. Density-Based Clustering
2.3.3. Spectral Clustering
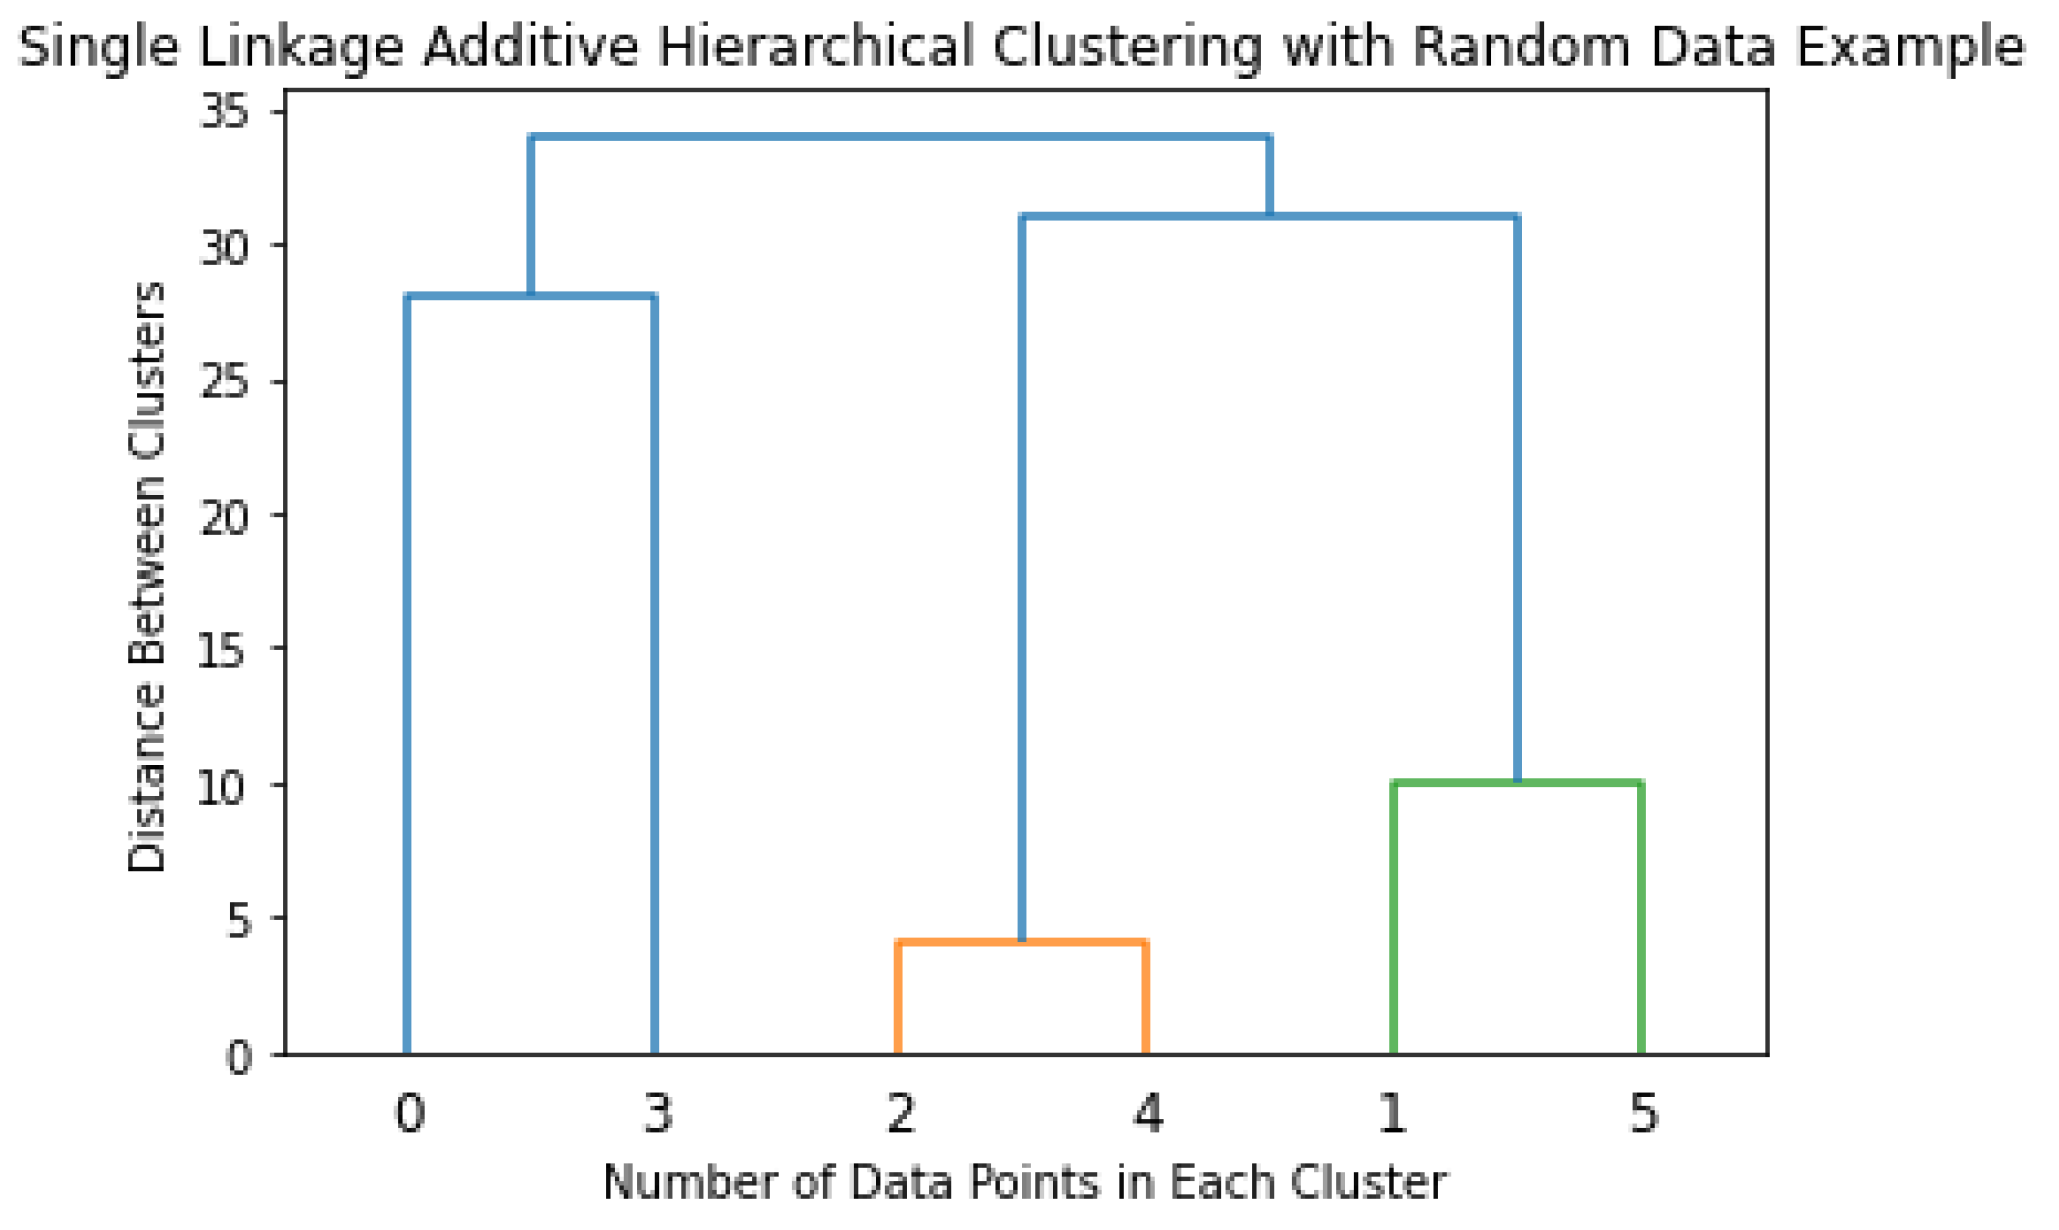
2.3.4. Hierarchical Clustering
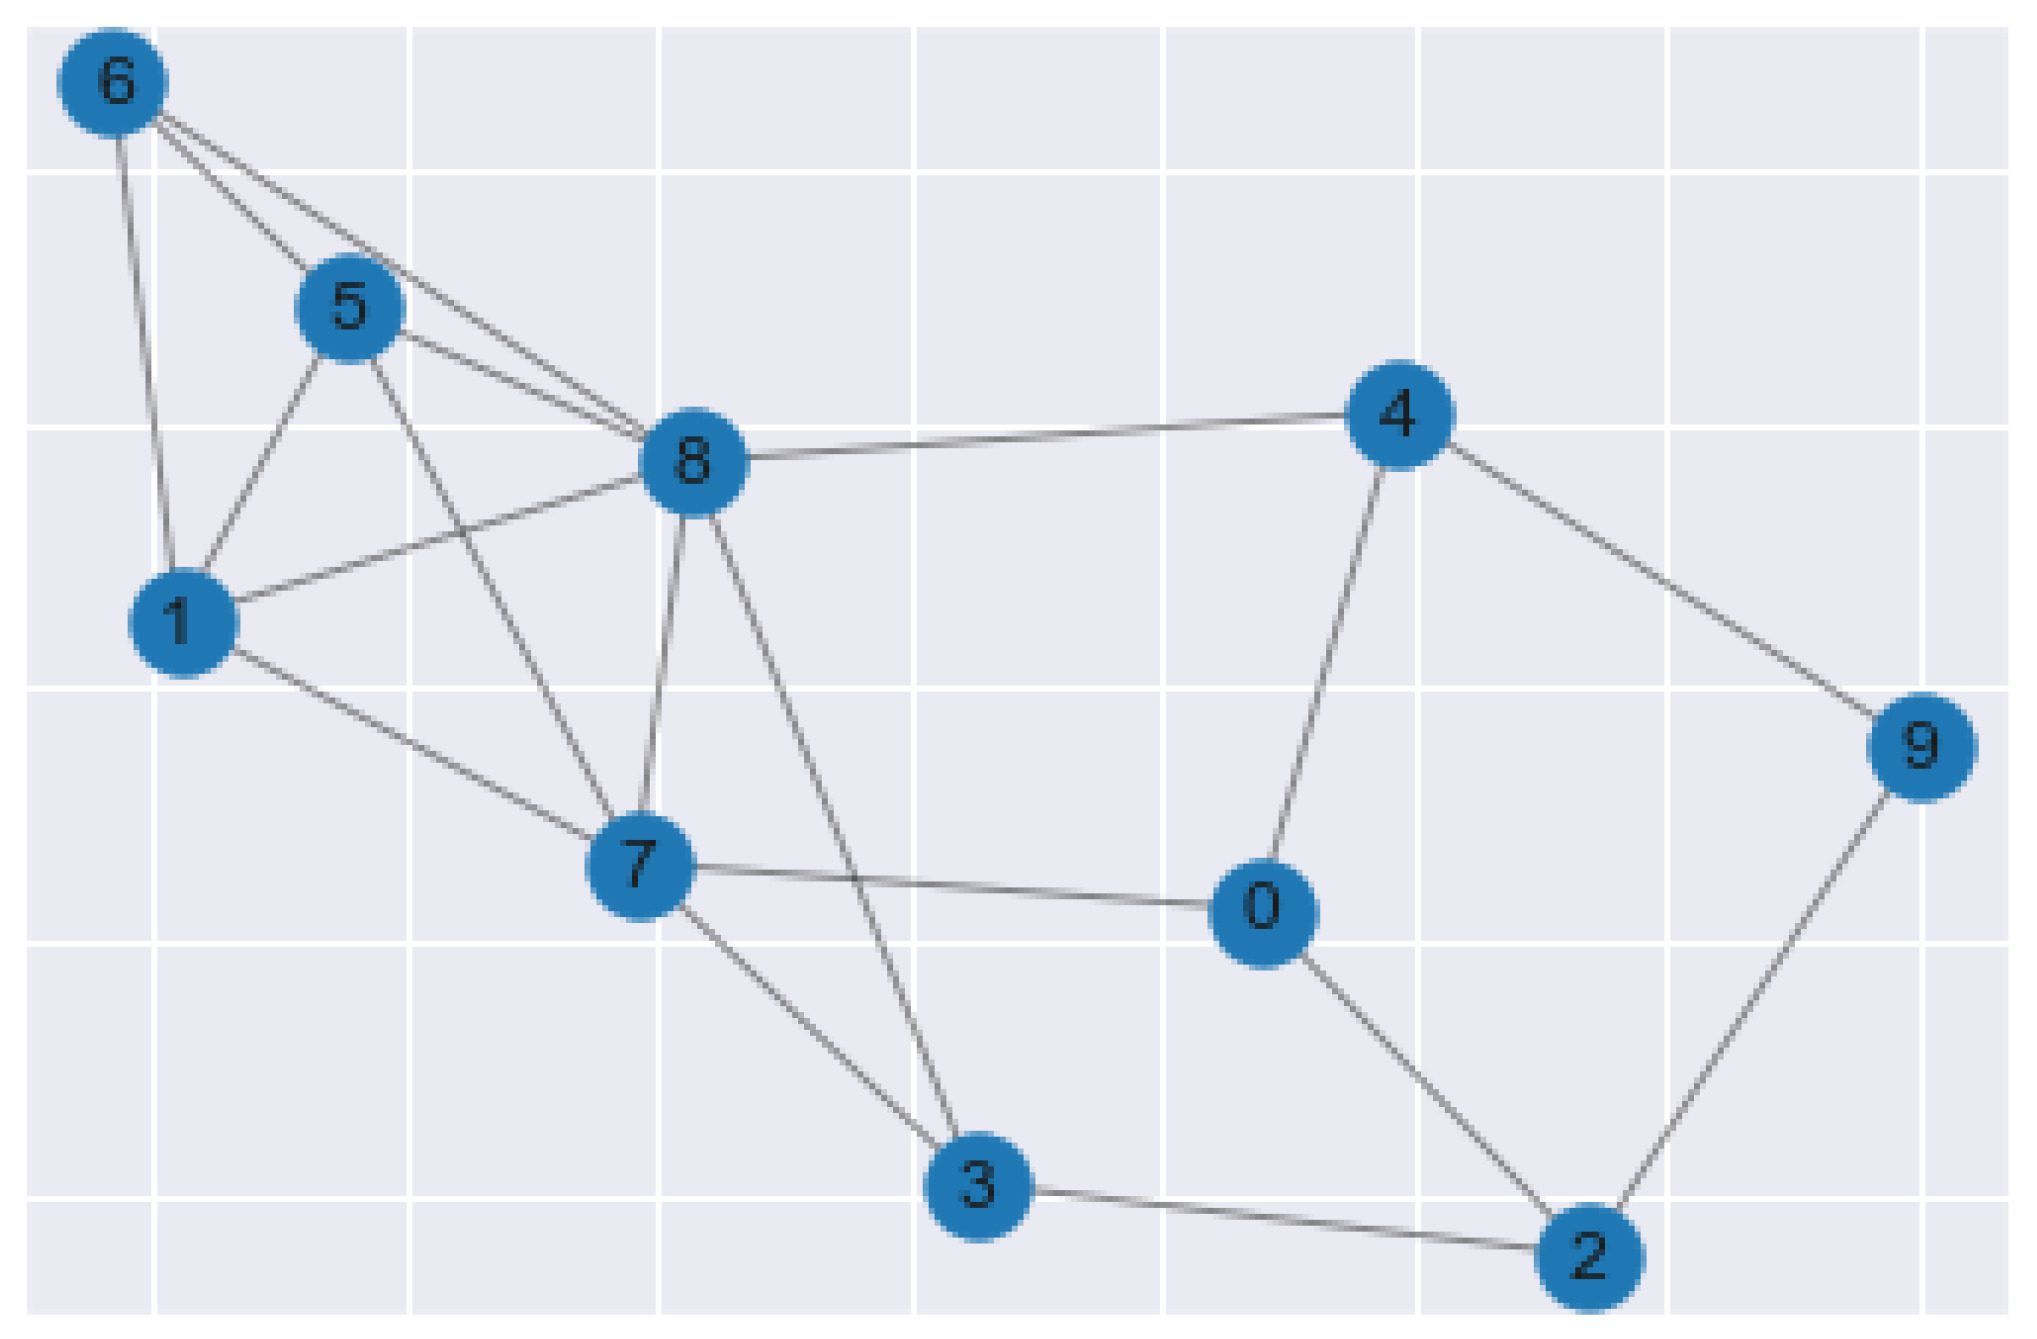
2.4. Association Analysis
2.5. Supervised Learning
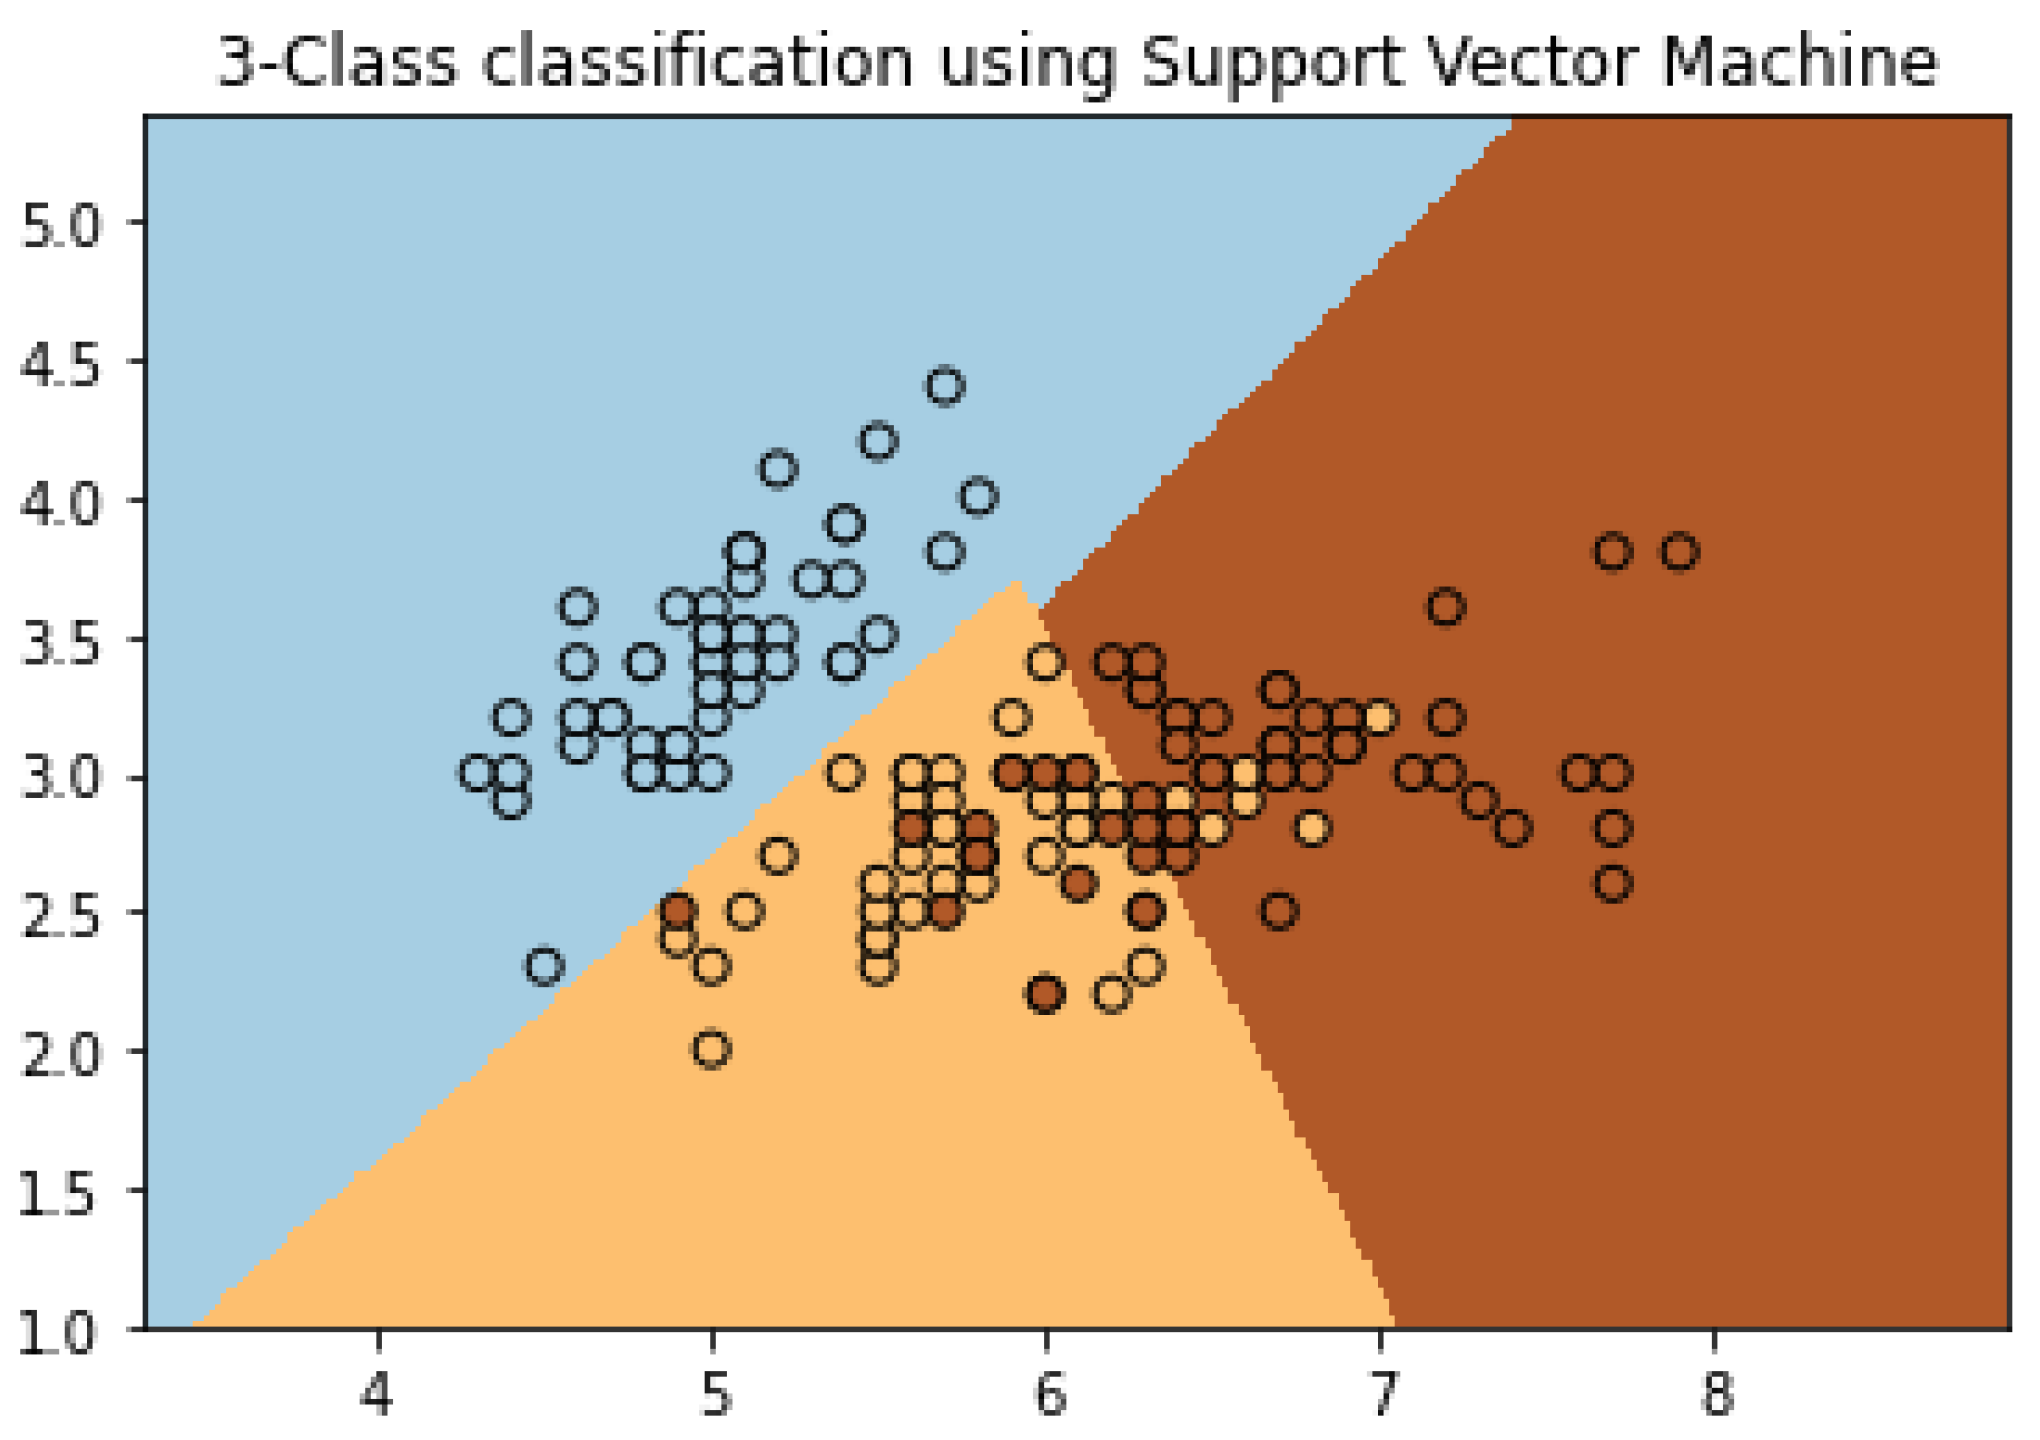
2.5.1. Support Vector Machine
2.5.2. K-Nearest Neighbor
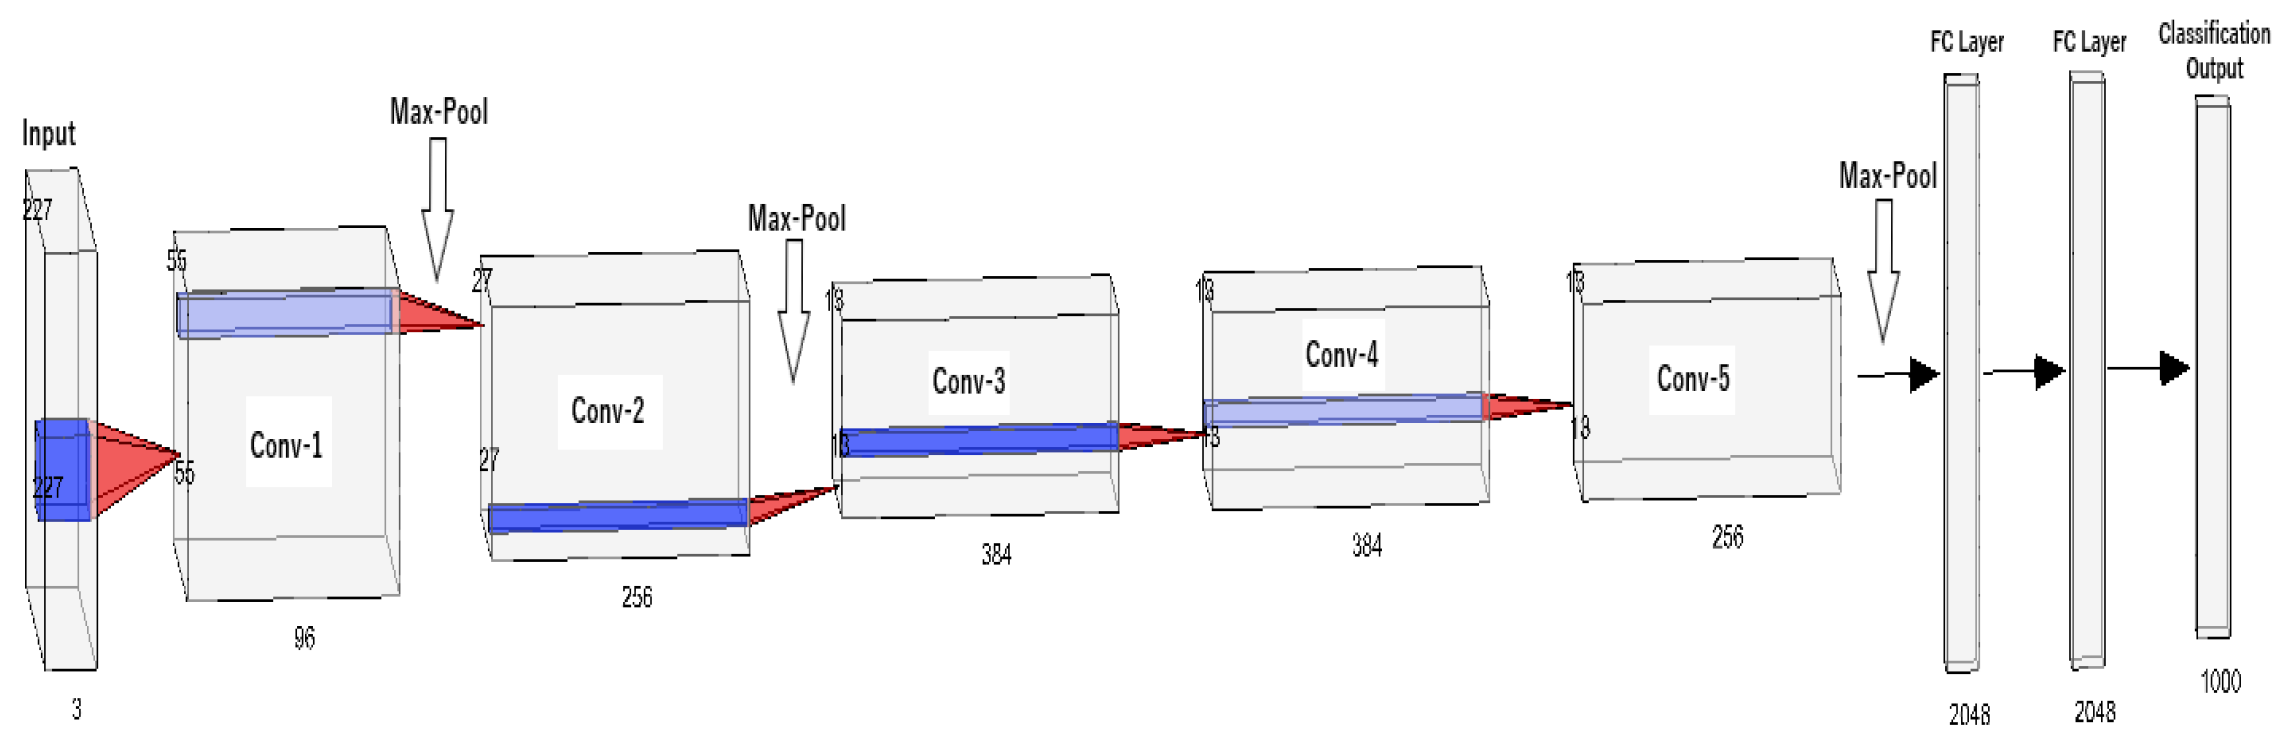
2.5.3. Neural Networks
2.6. Feature Extraction
2.7. Machine Vision
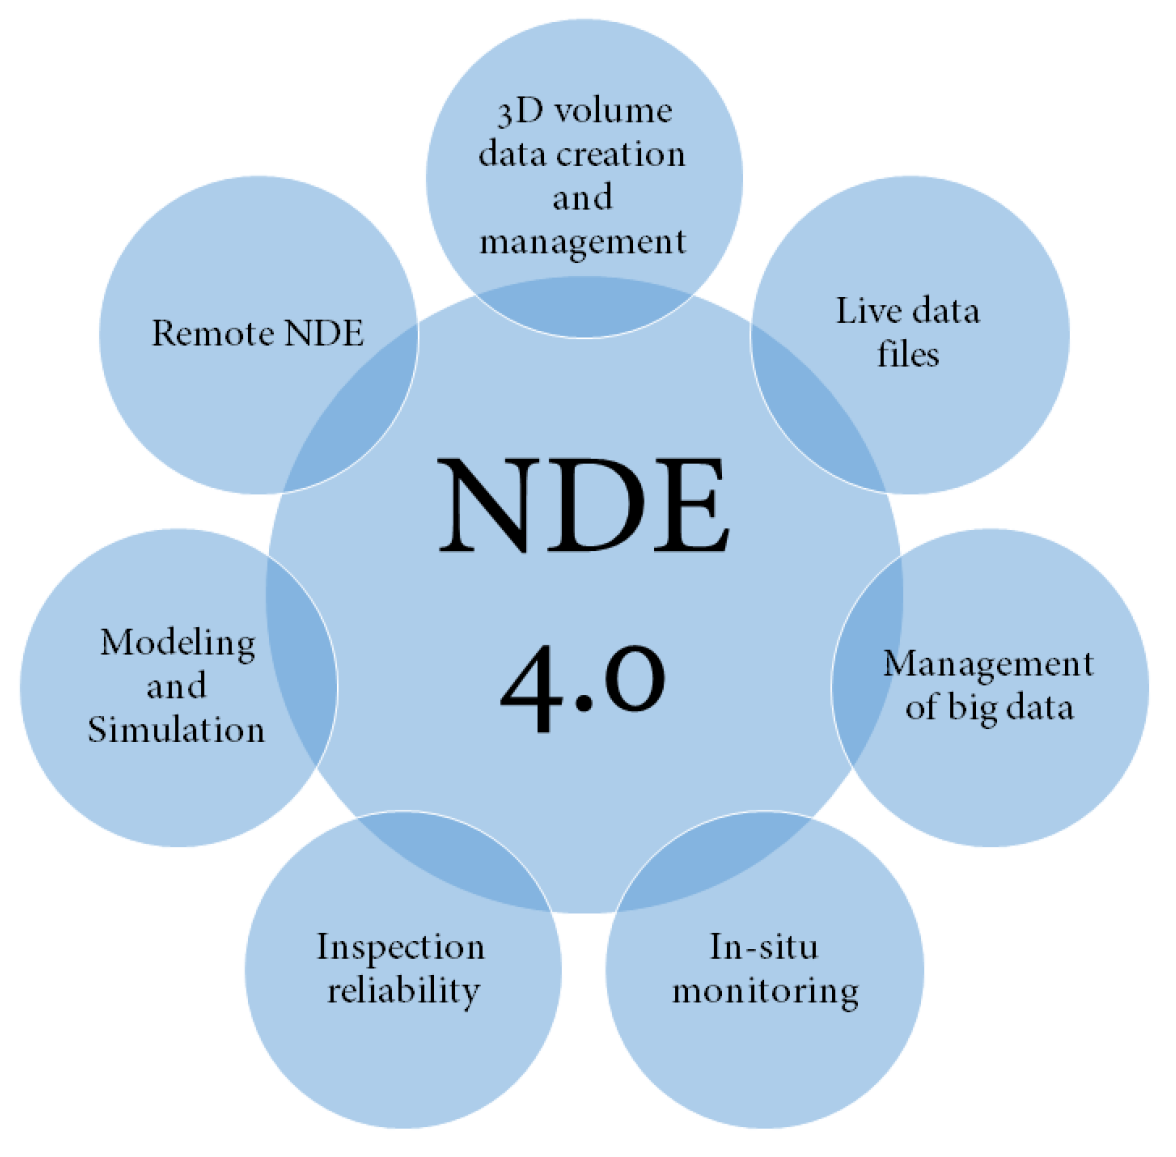
3. Internet of Things (IoT)-Related Applications and NDE 4.0
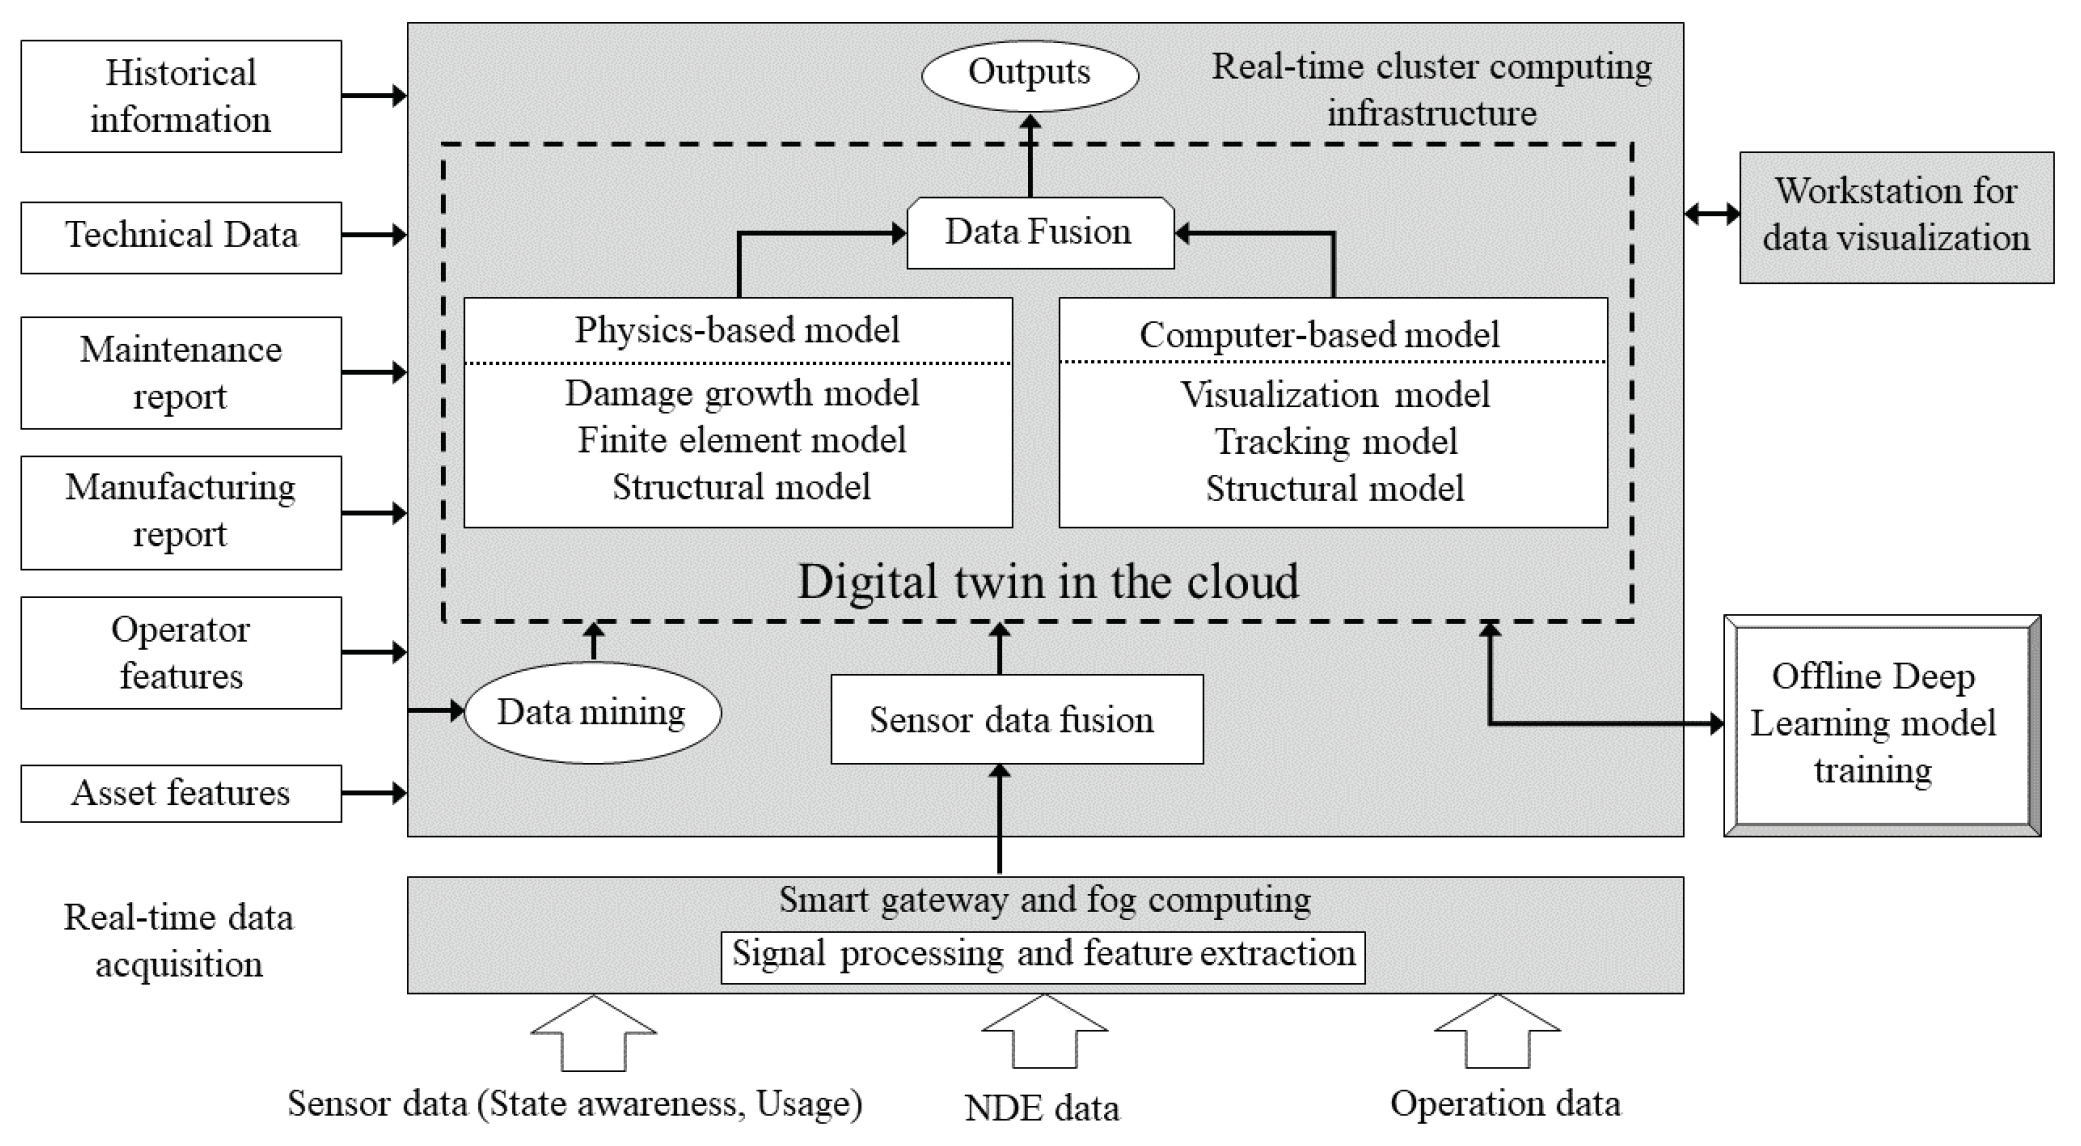
4. Digital Twins in NDE
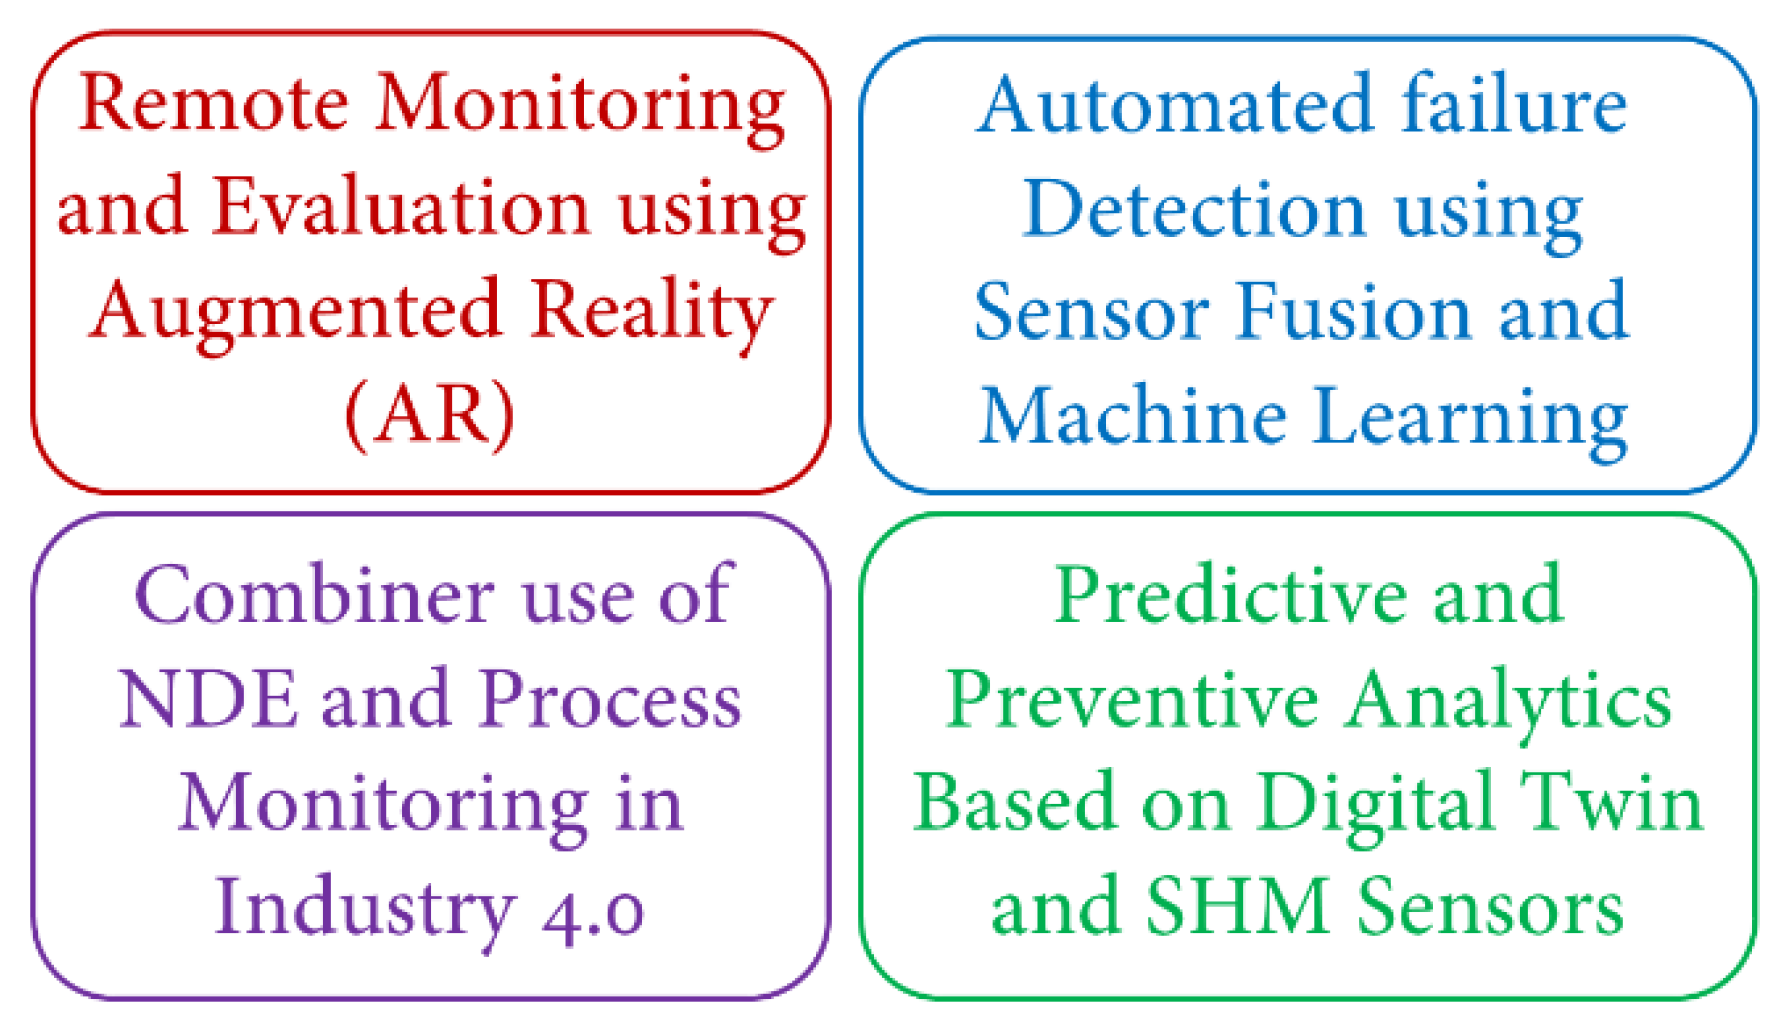
5. Virtual Reality (VR) and Augmented Reality (AR)
6. Challenges and Needs Assessment
6.1. General
6.2. Preprocessing
6.3. Physical Situation
6.4. Opportunities
7. Summary and Conclusions
Author Contributions
Funding
Institutional Review Board Statement
Informed Consent Statement
Data Availability Statement
Acknowledgments
Conflicts of Interest
References
- Bray, D.E.; Stanley, R.K. Nondestructive Evaluation: A Tool in Design, Manufacturing, and Service; CRC Press: Boca Raton, FL, USA, 2018. [Google Scholar]
- Koester, L.W.; Bond, L.J.; Taheri, H.; Collins, P.C. Nondestructive evaluation of additively manufactured metallic parts: In situ and post deposition. In Additive Manufacturing for the Aerospace Industry; Elsevier: Amsterdam, The Netherlands, 2019; pp. 401–417. [Google Scholar]
- Ida, N.; Meyendorf, N. Handbook of Advanced Nondestructive Evaluation; Springer International Publishing: Cham, Switzerland, 2019. [Google Scholar]
- O’Rorke, P.; Morris, S.; Amirfathi, M.; Bond, W.; Clair, D.S. Machine learning for nondestructive evaluation. In Machine Learning Proceedings 1991; Elsevier: Amsterdam, The Netherlands, 1991; pp. 620–624. [Google Scholar]
- Ph Papaelias, M.; Roberts, C.; Davis, C.L. A review on non-destructive evaluation of rails: State-of-the-art and future development. Proc. Inst. Mech. Eng. Part F J. Rail Rapid Transit 2008, 222, 367–384. [Google Scholar] [CrossRef]
- Popovics, J.S. Nondestructive evaluation: Past, present, and future. J. Mater. Civ. Eng. 2003, 15, 211. [Google Scholar] [CrossRef]
- Mineo, C.; Herbert, D.; Morozov, M.; Pierce, S.; Nicholson, P.; Cooper, I. Robotic non-destructive inspection. In Proceedings of the 51st Annual Conference of the British Institute of Non-Destructive Testing, Northamptonshire, UK, 11–13 September 2012; pp. 345–352. [Google Scholar]
- Ahmed, H.; La, H.M.; Gucunski, N. Review of non-destructive civil infrastructure evaluation for bridges: State-of-the-art robotic platforms, sensors and algorithms. Sensors 2020, 20, 3954. [Google Scholar] [CrossRef]
- Gardner, P.; Fuentes, R.; Dervilis, N.; Mineo, C.; Pierce, S.; Cross, E.; Worden, K. Machine learning at the interface of structural health monitoring and non-destructive evaluation. Philos. Trans. R. Soc. A 2020, 378, 20190581. [Google Scholar] [CrossRef] [PubMed]
- Osman, A.; Duan, Y.; Kaftandjian, V. Applied Artificial Intelligence in NDE. In Handbook of Nondestructive Evaluation 4.0; Springer: Berlin/Heidelberg, Germany, 2021; pp. 1–35. [Google Scholar]
- Wunderlich, C.; Tschöpe, C.; Duckhorn, F. Advanced methods in NDE using machine learning approaches. AIP Conf. Proc. 2018, 1949, 020022. [Google Scholar]
- Shrifan, N.H.; Akbar, M.F.; Isa, N.A.M. Prospect of using artificial intelligence for microwave nondestructive testing technique: A review. IEEE Access 2019, 7, 110628–110650. [Google Scholar] [CrossRef]
- Siegel, M. Automation for nondestructive inspection of aircraft. In Proceedings of the Conference on Intelligent Robots in Factory, Field, Space, and Service, Houston, TX, USA, 21–24 March 1994; p. 1223. [Google Scholar]
- Gemander, F. Machine Learning: Basics and NDT Applications. 2019. Available online: https://wiki.tum.de/display/zfp/Machine+Learning%3A+Basics+and+NDT+Applications (accessed on 10 March 2022).
- Harley, J.B.; Sparkman, D. Machine learning and NDE: Past, present, and future. AIP Conf. Proc. 2019, 2102, 090001. [Google Scholar]
- Du, G.; Li, J.; Wang, W.; Jiang, C.; Song, S. Detection and characterization of stress-corrosion cracking on 304 stainless steel by electrochemical noise and acoustic emission techniques. Corros. Sci. 2011, 53, 2918–2926. [Google Scholar] [CrossRef]
- Risheh, A.; Tavakolian, P.; Melinkov, A.; Mandelis, A. Infrared computer vision in non-destructive imaging: Sharp delineation of subsurface defect boundaries in enhanced truncated correlation photothermal coherence tomography images using K-means clustering. NDT E Int. 2022, 125, 102568. [Google Scholar] [CrossRef]
- Sophian, A.; Tian, G.; Fan, M. Pulsed eddy current non-destructive testing and evaluation: A review. Chin. J. Mech. Eng. 2017, 30, 500–514. [Google Scholar] [CrossRef] [Green Version]
- Ester, M.; Kriegel, H.P.; Sander, J.; Xu, X. A density-based algorithm for discovering clusters in large spatial databases with noise. In Proceedings of the Second International Conference on Knowledge Discovery and Data Mining, Portland, OR, USA, 2–4 August 1996; Volume 96, pp. 226–231. [Google Scholar]
- Baron, J.; Dolbey, M.; Erven, J.; Booth, D.; Murray, D. Improved pressure tube inspection in Candu reactors. Nucl. Eng. Int. 1981, 26, 45–48. [Google Scholar]
- Kumar, N.P.; Patankar, V.; Kulkarni, M. Ultrasonic Gauging and Imaging of Metallic Tubes and Pipes: A Review; International Atomic Energy Agency (IAEA): Vienna, Austria, 2020. [Google Scholar]
- Pedregosa, F.; Varoquaux, G.; Gramfort, A.; Michel, V.; Thirion, B.; Grisel, O.; Blondel, M.; Prettenhofer, P.; Weiss, R.; Dubourg, V.; et al. Scikit-learn: Machine Learning in Python. J. Mach. Learn. Res. 2011, 12, 2825–2830. [Google Scholar]
- Li, T.J.; Chen, C.C.; Liu, J.J.; Shao, G.F.; Chan, C.C.K. A novel THz differential spectral clustering recognition method based on t-SNE. Discret. Dyn. Nat. Soc. 2020, 2020, 6787608. [Google Scholar] [CrossRef]
- Salazar, A.; Igual, J.; Vergara, L. Agglomerative clustering of defects in ultrasonic non-destructive testing using hierarchical mixtures of independent component analyzers. In Proceedings of the 2014 International Joint Conference on Neural Networks (IJCNN), Beijing, China, 6–11 July 2014; pp. 2042–2049. [Google Scholar] [CrossRef]
- Taheri, H.; Koester, L.W.; Bigelow, T.A.; Faierson, E.J.; Bond, L.J. In situ additive manufacturing process monitoring with an acoustic technique: Clustering performance evaluation using K-means algorithm. J. Manuf. Sci. Eng. 2019, 141, 041011. [Google Scholar] [CrossRef]
- Noble, W.S. What is a support vector machine? Nat. Biotechnol. 2006, 24, 1565–1567. [Google Scholar] [CrossRef]
- Yadavar Nikravesh, S.M.; Rezaie, H.; Kilpatrik, M.; Taheri, H. Intelligent fault diagnosis of bearings based on energy levels in frequency bands using wavelet and support vector machines (SVM). J. Manuf. Mater. Process. 2019, 3, 11. [Google Scholar] [CrossRef] [Green Version]
- Shao, J.; Shi, H.; Du, D.; Wang, L.; Cao, H. Automatic weld defect detection in real-time X-ray images based on support vector machine. In Proceedings of the 4 th International Congress on Image and Signal Processing, Shanghai, China, 15–17 October 2011; Volume 4, pp. 1842–1846. [Google Scholar] [CrossRef]
- Lee, L.H.; Rajkumar, R.; Lo, L.H.; Wan, C.H.; Isa, D. Oil and gas pipeline failure prediction system using long range ultrasonic transducers and Euclidean-Support Vector Machines classification approach. Expert Syst. Appl. 2013, 40, 1925–1934. [Google Scholar] [CrossRef]
- Moomen, A.; Ali, A.; Ramahi, O.M. Reducing sweeping frequencies in microwave NDT employing machine learning feature selection. Sensors 2016, 16, 559. [Google Scholar] [CrossRef] [Green Version]
- Kim, J.G.; Jang, C.; Kang, S.S. Classification of ultrasonic signals of thermally aged cast austenitic stainless steel (CASS) using machine learning (ML) models. Nucl. Eng. Technol. 2022, 54, 1167–1174. [Google Scholar] [CrossRef]
- LeCun, Y.; Jackel, L.; Bottou, L.; Brunot, A.; Cortes, C.; Denker, J.; Drucker, H.; Guyon, I.; Muller, U.; Sackinger, E.; et al. Comparison of learning algorithms for handwritten digit recognition. In Proceedings of the International Conference on Artificial Neural Networks, Perth, Australia, 27 November–1 December 1995; Volume 60, pp. 53–60. [Google Scholar]
- Krizhevsky, A.; Sutskever, I.; Hinton, G.E. Imagenet classification with deep convolutional neural networks. Adv. Neural Inf. Process. Syst. 2012, 25, 1097–1105. [Google Scholar] [CrossRef]
- Saleem, M.; Gutierrez, H. Using artificial neural network and non-destructive test for crack detection in concrete surrounding the embedded steel reinforcement. Struct. Concr. 2021, 22, 2849–2867. [Google Scholar] [CrossRef]
- Saeed, N.; Omar, M.A.; Abdulrahman, Y. A neural network approach for quantifying defects depth, for nondestructive testing thermograms. Infrared Phys. Technol. 2018, 94, 55–64. [Google Scholar] [CrossRef]
- Radkowski, R.; Garrett, T.; Holland, S.D. 3D machine vision technology for automatic data integration of ultrasonic data. In Proceedings of the QNDE 2019: 46th Annual Review of Progress in Quantitative Nondestructive Evaluation, Portland, OR, USA, 14–18 July 2019. [Google Scholar]
- Addamani, R.; Ravindra, H.V.; Gayathri Devi, S.; Gonchikar, U. Assessment of Weld Bead Performance for Pulsed Gas Metal Arc Welding (P-GMAW) Using Acoustic Emission (AE) and Machine Vision (MV) Signals Through NDT Methods for SS 304 Material. In ASME International Mechanical Engineering Congress and Exposition; American Society of Mechanical Engineers: New York, NY, USA, 2020; Volume 84485, p. V02AT02A002. [Google Scholar]
- Johnson, J.T. Defect and Thickness Inspection System for Cast Thin Films Using Machine Vision and Full-Field Transmission Densitometry. Ph.D. Thesis, Georgia Institute of Technology, Atlanta, GA, USA, 2009. [Google Scholar]
- Ye, X.W.; Dong, C.Z.; Liu, T. A review of machine vision-based structural health monitoring: Methodologies and applications. J. Sensors 2016, 2016, 7103039. [Google Scholar] [CrossRef] [Green Version]
- Tang, Y.; Lin, Y.; Huang, X.; Yao, M.; Huang, Z.; Zou, X. Grand challenges of machine-vision technology in civil structural health monitoring. In Artificial Intelligence Evolution; Universal Wiser Publisher: Singapore, 2020; pp. 8–16. [Google Scholar]
- Dawood, T.; Zhu, Z.; Zayed, T. Machine vision-based model for spalling detection and quantification in subway networks. Autom. Constr. 2017, 81, 149–160. [Google Scholar] [CrossRef]
- Azarpajouh, S.; Calderón Díaz, J.; Bueso Quan, S.; Taheri, H. Farm 4.0: A review of innovative smart dairy technologies and their applications as tools for welfare assessment in dairy cattle. CAB Rev. 2021, 16, 1–9. [Google Scholar] [CrossRef]
- Meyendorf, N.G.; Bond, L.J.; Curtis-Beard, J.; Heilmann, S.; Pal, S.; Schallert, R.; Scholz, H.; Wunderlich, C. Nde 4.0—Nde for the 21st Century—The Internet of Things and cyber physical systems will revolutionize nde. In Proceedings of the 15th Asia Pacific Conference for Non-Destructive Testing (APCNDT2017), Singapore, 13–17 November 2017. [Google Scholar]
- Koester, L.; Taheri, H.; Bond, L.J.; Barnard, D.; Gray, J. Additive manufacturing metrology: State of the art and needs assessment. AIP Conf. Proc. 2016, 1706, 130001. [Google Scholar]
- Vrana, J.; Meyendorf, N.; Ida, N.; Singh, R. Introduction to NDE 4.0. In Handbook of Nondestructive Evaluation 4.0; Springer: Berlin/Heidelberg, Germany, 2021; pp. 1–28. [Google Scholar]
- Lee, H.; Lim, H.J.; Skinner, T.; Chattopadhyay, A.; Hall, A. Automated fatigue damage detection and classification technique for composite structures using Lamb waves and deep autoencoder. Mech. Syst. Signal Process. 2022, 163, 108148. [Google Scholar] [CrossRef]
- Taheri, H.; Koester, L.W.; Bigelow, T.A.; Bond, L.J. Thermoelastic finite element modeling of laser generated ultrasound in additive manufacturing materials. In Proceedings of the ASNT Annual Conference, Nashville, TN, USA, 30 October–2 November 2017; Volume 2017, pp. 188–198. [Google Scholar]
- Bigelow, T.A.; Schneider, B.; Taheri, H. Detection of pores in additive manufactured parts by near field response of laser-induced ultrasound. AIP Conf. Proc. 2019, 2102, 070002. [Google Scholar]
- Taheri, H.; Koester, L.; Bigelow, T.; Bond, L.J. Finite element simulation and experimental verification of ultrasonic non-destructive inspection of defects in additively manufactured materials. AIP Conf. Proc. 2018, 1949, 020011. [Google Scholar]
- Liu, Z.; Meyendorf, N.; Mrad, N. The role of data fusion in predictive maintenance using digital twin. AIP Conf. Proc. 2018, 1949, 020023. [Google Scholar]
- Ababsa, F. Augmented Reality Application in Manufacturing Industry: Maintenance and Non-destructive Testing (NDT) Use Cases. In International Conference on Augmented Reality, Virtual Reality and Computer Graphics; Springer: Berlin/Heidelberg, Germany, 2020; pp. 333–344. [Google Scholar]
- Vejdannik, M.; Sadr, A.; de Albuquerque, V.H.C.; Tavares, J.M.R. Signal processing for NDE. In Handbook of Advanced Non-Destructive Evaluation; Springer: Cham, Switzerland, 2018. [Google Scholar]
- Pyle, R.J.; Bevan, R.L.; Hughes, R.R.; Rachev, R.K.; Ali, A.A.S.; Wilcox, P.D. Deep learning for ultrasonic crack characterization in NDE. IEEE Trans. Ultrason. Ferroelectr. Freq. Control 2020, 68, 1854–1865. [Google Scholar] [CrossRef]
- Zhou, X.; Wang, H.; Hsieh, S.J.T. Thermography and k-means clustering methods for anti-reflective coating film inspection: Scratch and bubble defects. In Thermosense: Thermal Infrared Applications XXXVIII; SPIE: Bellingham, WA, USA, 2016; Volume 9861, pp. 195–204. [Google Scholar]
- Chen, C.; Zhou, S.; Hu, G.; Jia, J.; Floor, G.W.; Sharath, D.; Menaka, M. Lamb wave detection and localization of multiple discontinuities for plate-like structures based on DBSCAN and k-means. Mater. Eval. 2019, 77, 1439–1449. [Google Scholar]
- Volker, C.; Kruschwitz, S.; Boller, C.; Wiggenhauser, H. Feasibility study on adapting a machine learning based multi-sensor data fusion approach for honeycomb detection in concrete. In NDE/NDT for Highways & Bridges: SMT 2016; The American Society of Nondestructive Testing: Columbus, OH, USA, 2016; pp. 144–148. [Google Scholar]
- Selim, H.; Delgado Prieto, M.; Trull, J.; Romeral, L.; Cojocaru, C. Laser ultrasound inspection based on wavelet transform and data clustering for defect estimation in metallic samples. Sensors 2019, 19, 573. [Google Scholar] [CrossRef] [Green Version]
- Li, X.; Shen, T. Nondestructive testing system design for biological product based on vibration signal analysis of acceleration sensor. J. Vibroeng. 2017, 19, 2164–2173. [Google Scholar] [CrossRef] [Green Version]
- Sevillano, E.; Sun, R.; Gil, A.; Perera, R. Interfacial crack-induced debonding identification in FRP-strengthened RC beams from PZT signatures using hierarchical clustering analysis. Compos. Part B Eng. 2016, 87, 322–335. [Google Scholar] [CrossRef]
- Na, W.S. Low cost technique for detecting adhesive debonding damage of glass epoxy composite plate using an impedance based non-destructive testing method. Compos. Struct. 2018, 189, 99–106. [Google Scholar] [CrossRef]
- Tian, F.; Tan, F.; Li, H. An rapid nondestructive testing method for distinguishing rice producing areas based on Raman spectroscopy and support vector machine. Vib. Spectrosc. 2020, 107, 103017. [Google Scholar] [CrossRef]


| Algorithm | NDE Methodology | Paper Reference |
|---|---|---|
| K-Means Algorithm | Acoustic Emission Signal | [16,25] |
| Thermal Imaging | [17] | |
| Pulse Eddy Currents | [18] | |
| Thermography | [54,55] | |
| DBSCAN | Ultrasonic Testing | [20] |
| Ultrasonic Lamb Wave | [46,55] | |
| Impact Echo, Ultrasonic Pulse Echo | [56] | |
| Laser Ultrasound | [57] | |
| Spectral Clustering | Terahertz Spectroscopy | [23] |
| Vibration Signals | [58] | |
| Spectral Kurtosis | [59] | |
| Hierarchical Clustering | Ultrasonic Echo Testing | [24] |
| Electromechanical Impedance Method | [59,60] | |
| Association Analysis | Fiber Optic Sensors | [25] |
| Multi-point Laser Vibrometers | ||
| Acoustic Emission Sensors | ||
| Support Vector Machine | X-Ray Casting | [28] |
| Long Range Ultrasonic Testing | [29] | |
| Raman Spectroscopy | [61] | |
| K-Nearest Neighbor | Microwave Testing | [30] |
| Neural Networks | Ultrasonic Pulse Velocity Test | [34] |
| Thermograms | [35] |
Publisher’s Note: MDPI stays neutral with regard to jurisdictional claims in published maps and institutional affiliations. |
© 2022 by the authors. Licensee MDPI, Basel, Switzerland. This article is an open access article distributed under the terms and conditions of the Creative Commons Attribution (CC BY) license (https://creativecommons.org/licenses/by/4.0/).
Share and Cite
Taheri, H.; Gonzalez Bocanegra, M.; Taheri, M. Artificial Intelligence, Machine Learning and Smart Technologies for Nondestructive Evaluation. Sensors 2022, 22, 4055. https://doi.org/10.3390/s22114055
Taheri H, Gonzalez Bocanegra M, Taheri M. Artificial Intelligence, Machine Learning and Smart Technologies for Nondestructive Evaluation. Sensors. 2022; 22(11):4055. https://doi.org/10.3390/s22114055
Chicago/Turabian StyleTaheri, Hossein, Maria Gonzalez Bocanegra, and Mohammad Taheri. 2022. "Artificial Intelligence, Machine Learning and Smart Technologies for Nondestructive Evaluation" Sensors 22, no. 11: 4055. https://doi.org/10.3390/s22114055
APA StyleTaheri, H., Gonzalez Bocanegra, M., & Taheri, M. (2022). Artificial Intelligence, Machine Learning and Smart Technologies for Nondestructive Evaluation. Sensors, 22(11), 4055. https://doi.org/10.3390/s22114055