
Low-Frequency Vibrational Spectroscopy Characteristic of Pharmaceutical Carbamazepine Co-Crystals with Nicotinamide and Saccharin


Abstract
:1. Introduction
2. Materials and Methods
2.1. Materials
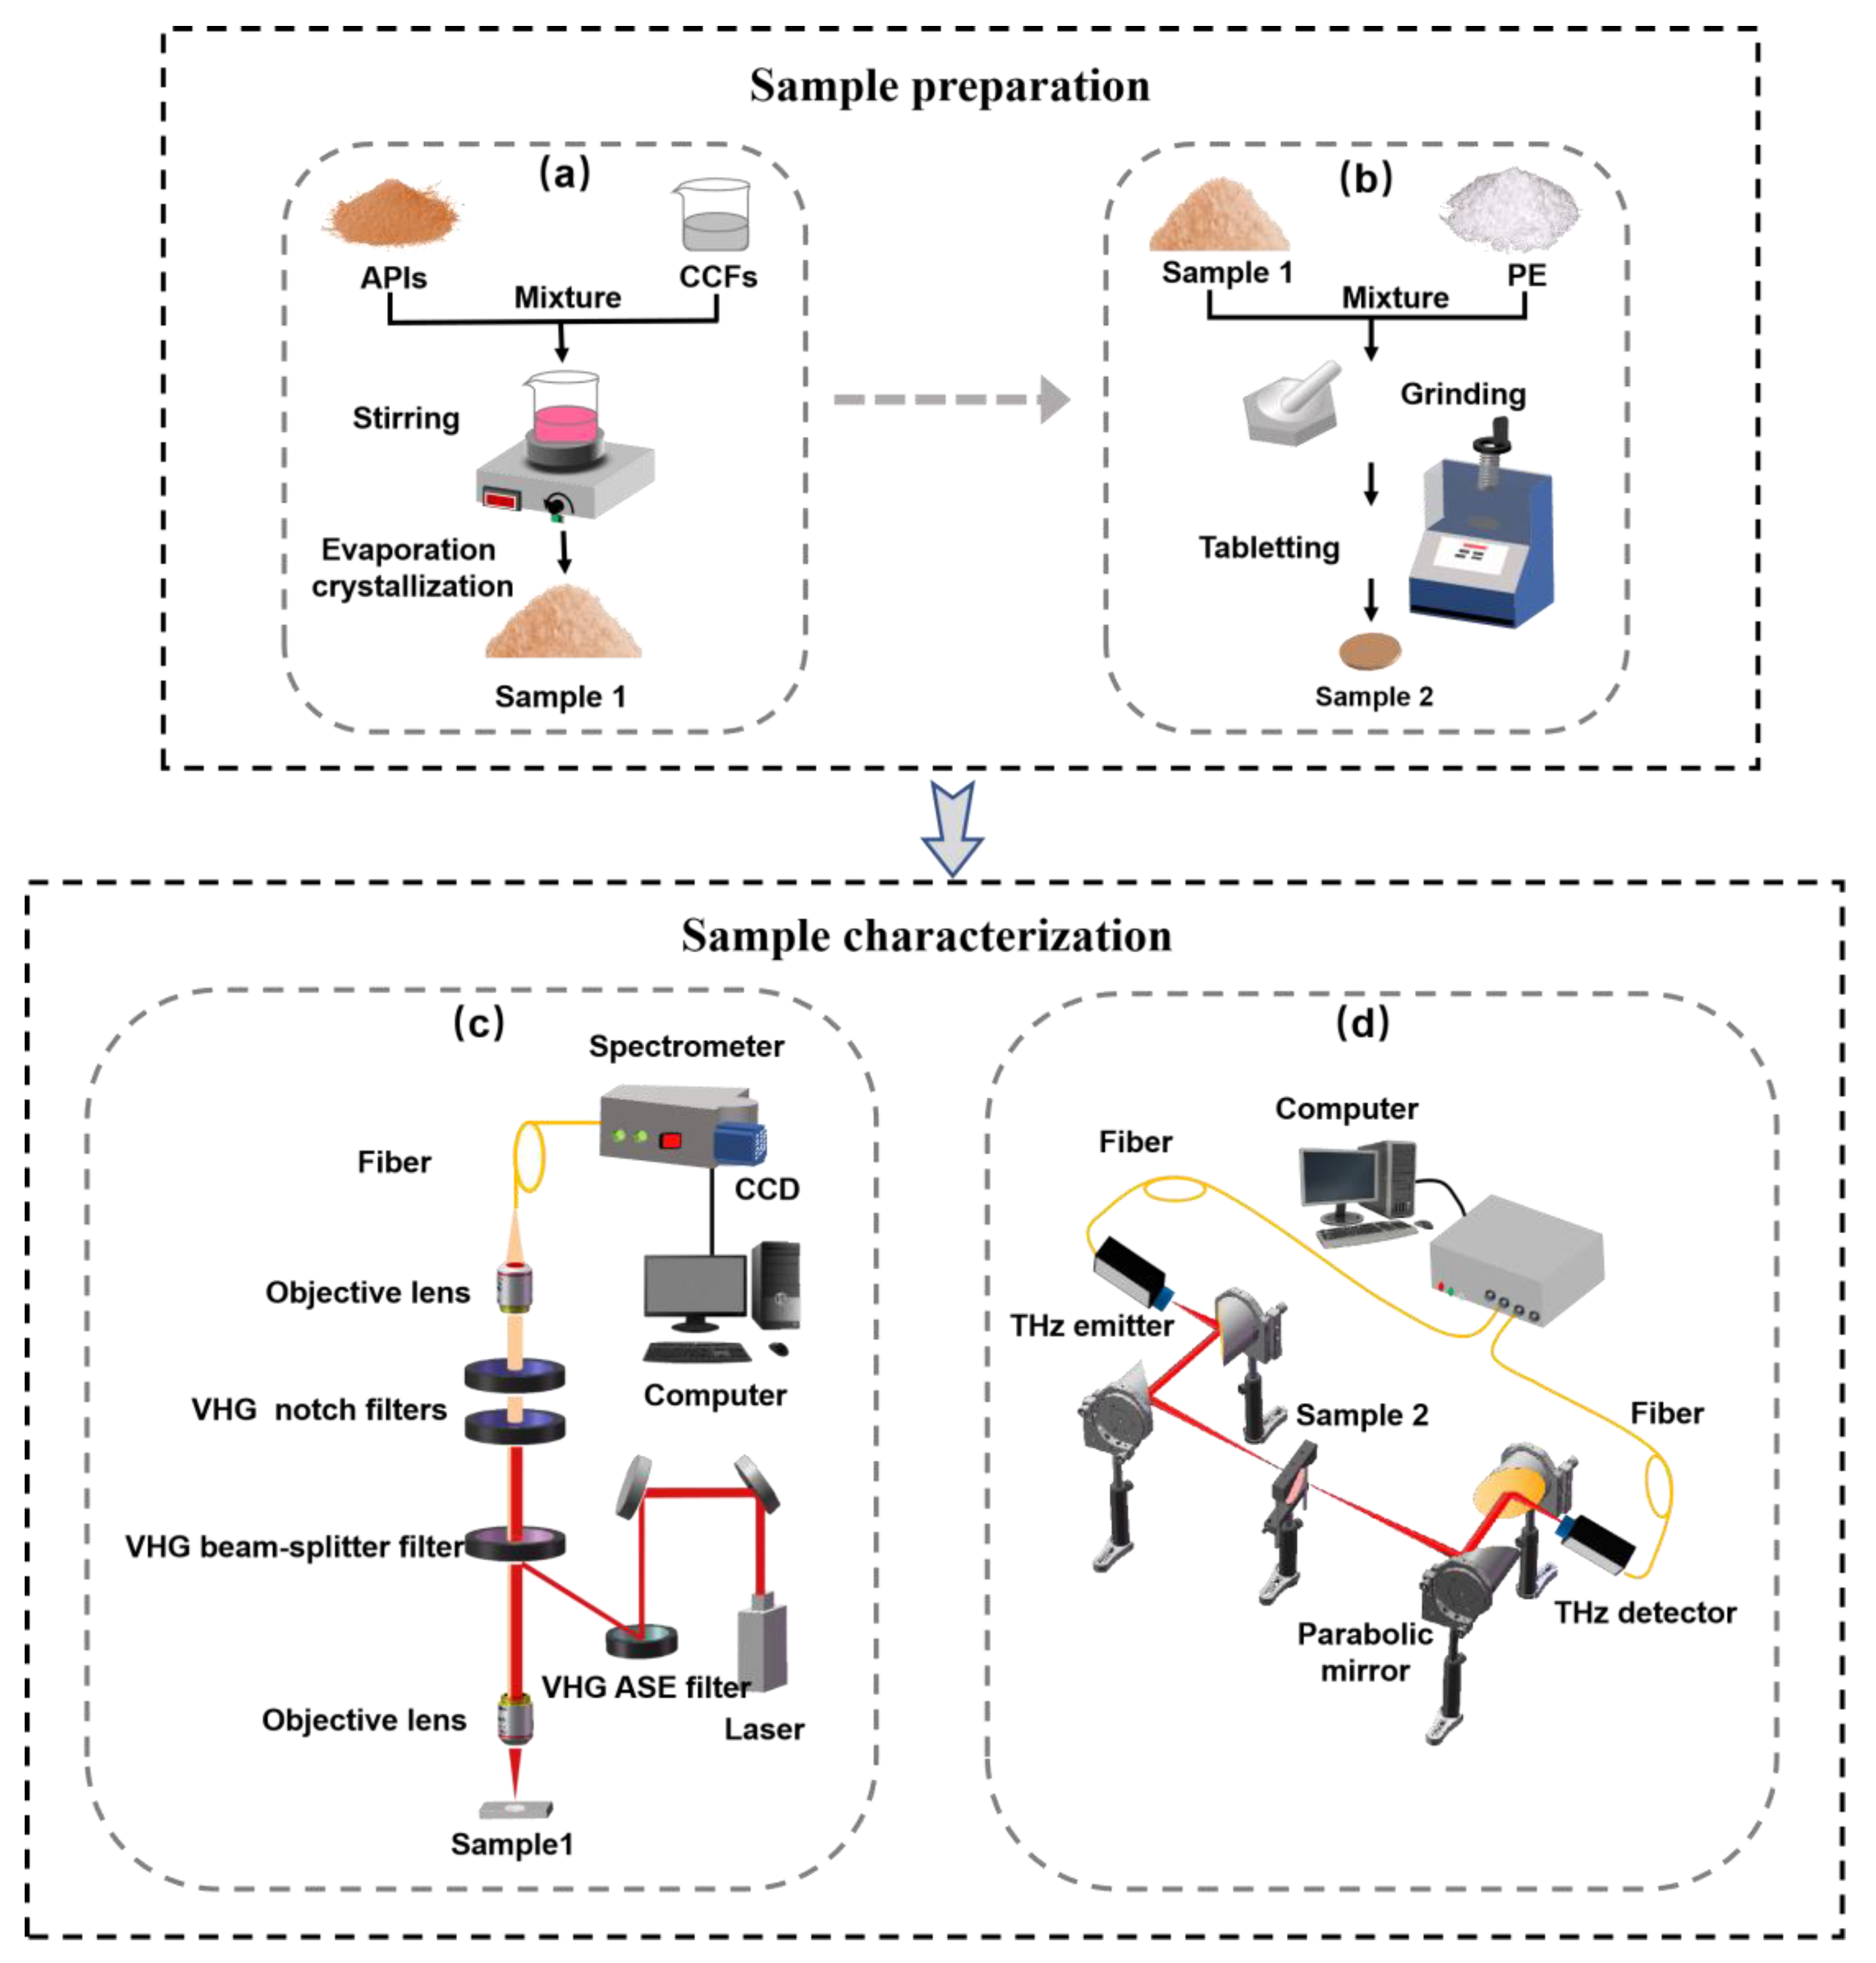
2.2. Apparatus and Procedure
2.3. Theoretical Calculation
3. Results and Discussion
3.1. PXRD Analysis
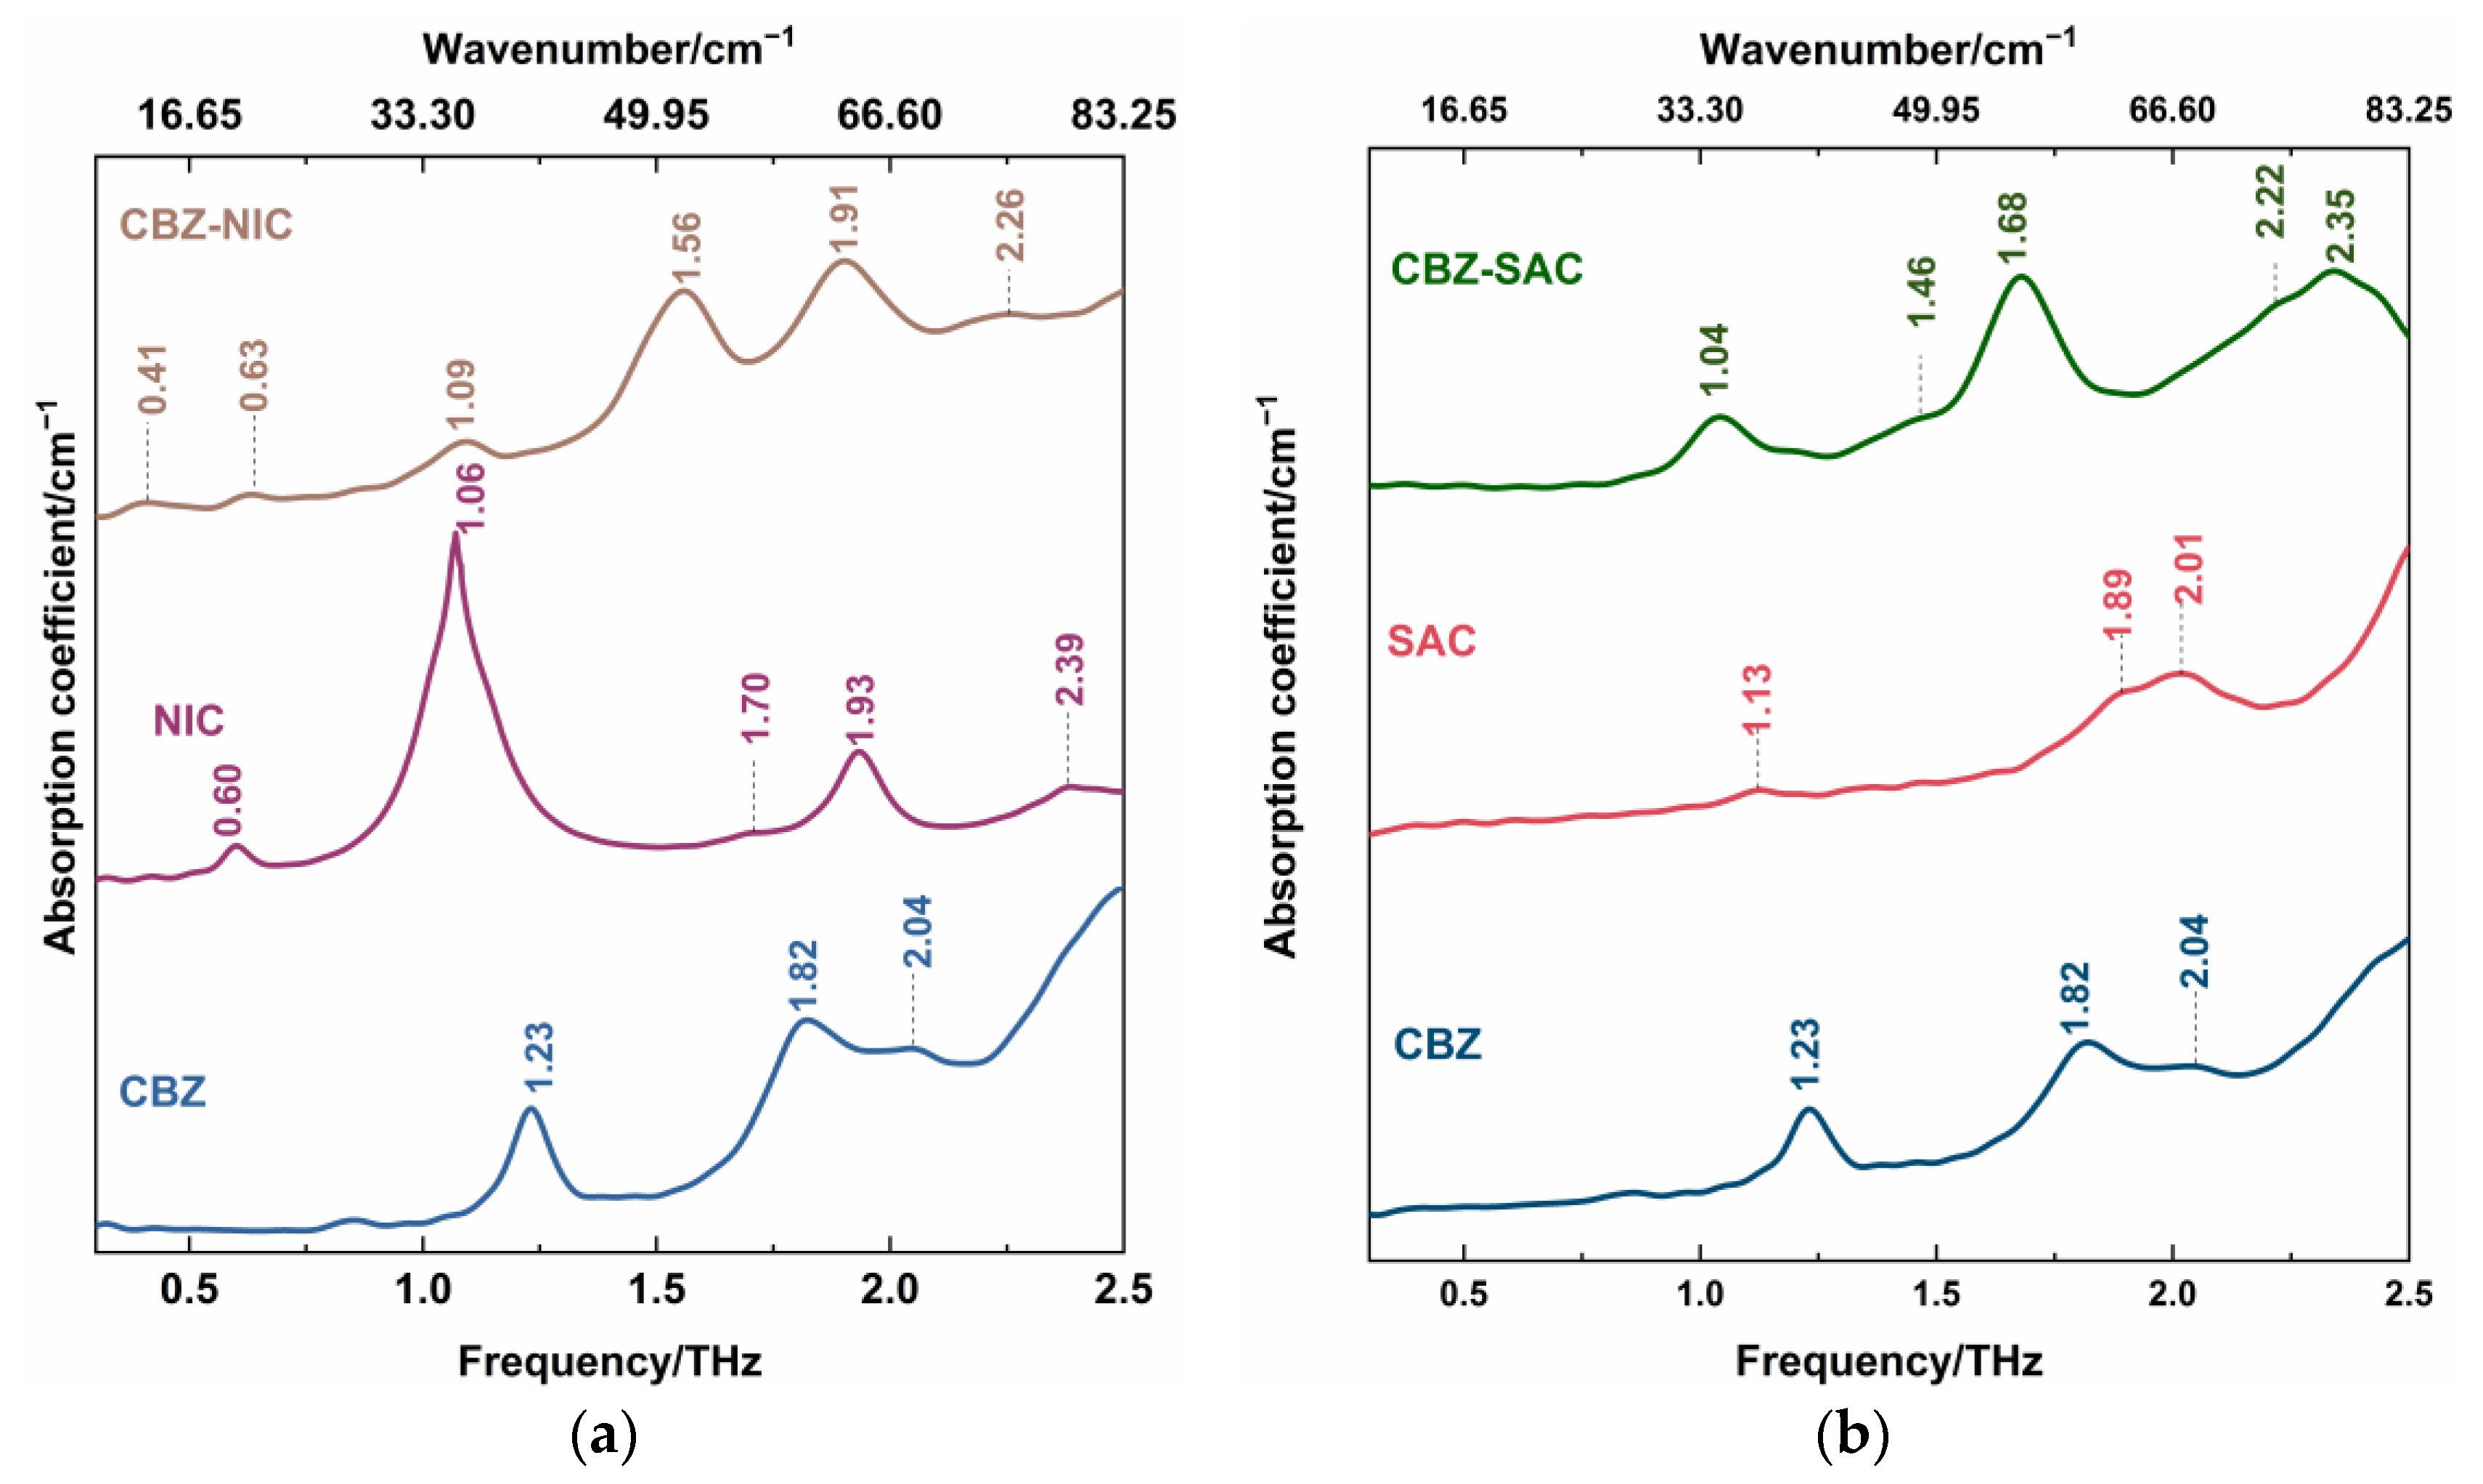
3.2. THz Absorption Spectral Characteristic and Analysis of CBZ-NIC and CBZ-SAC Co-Crystals
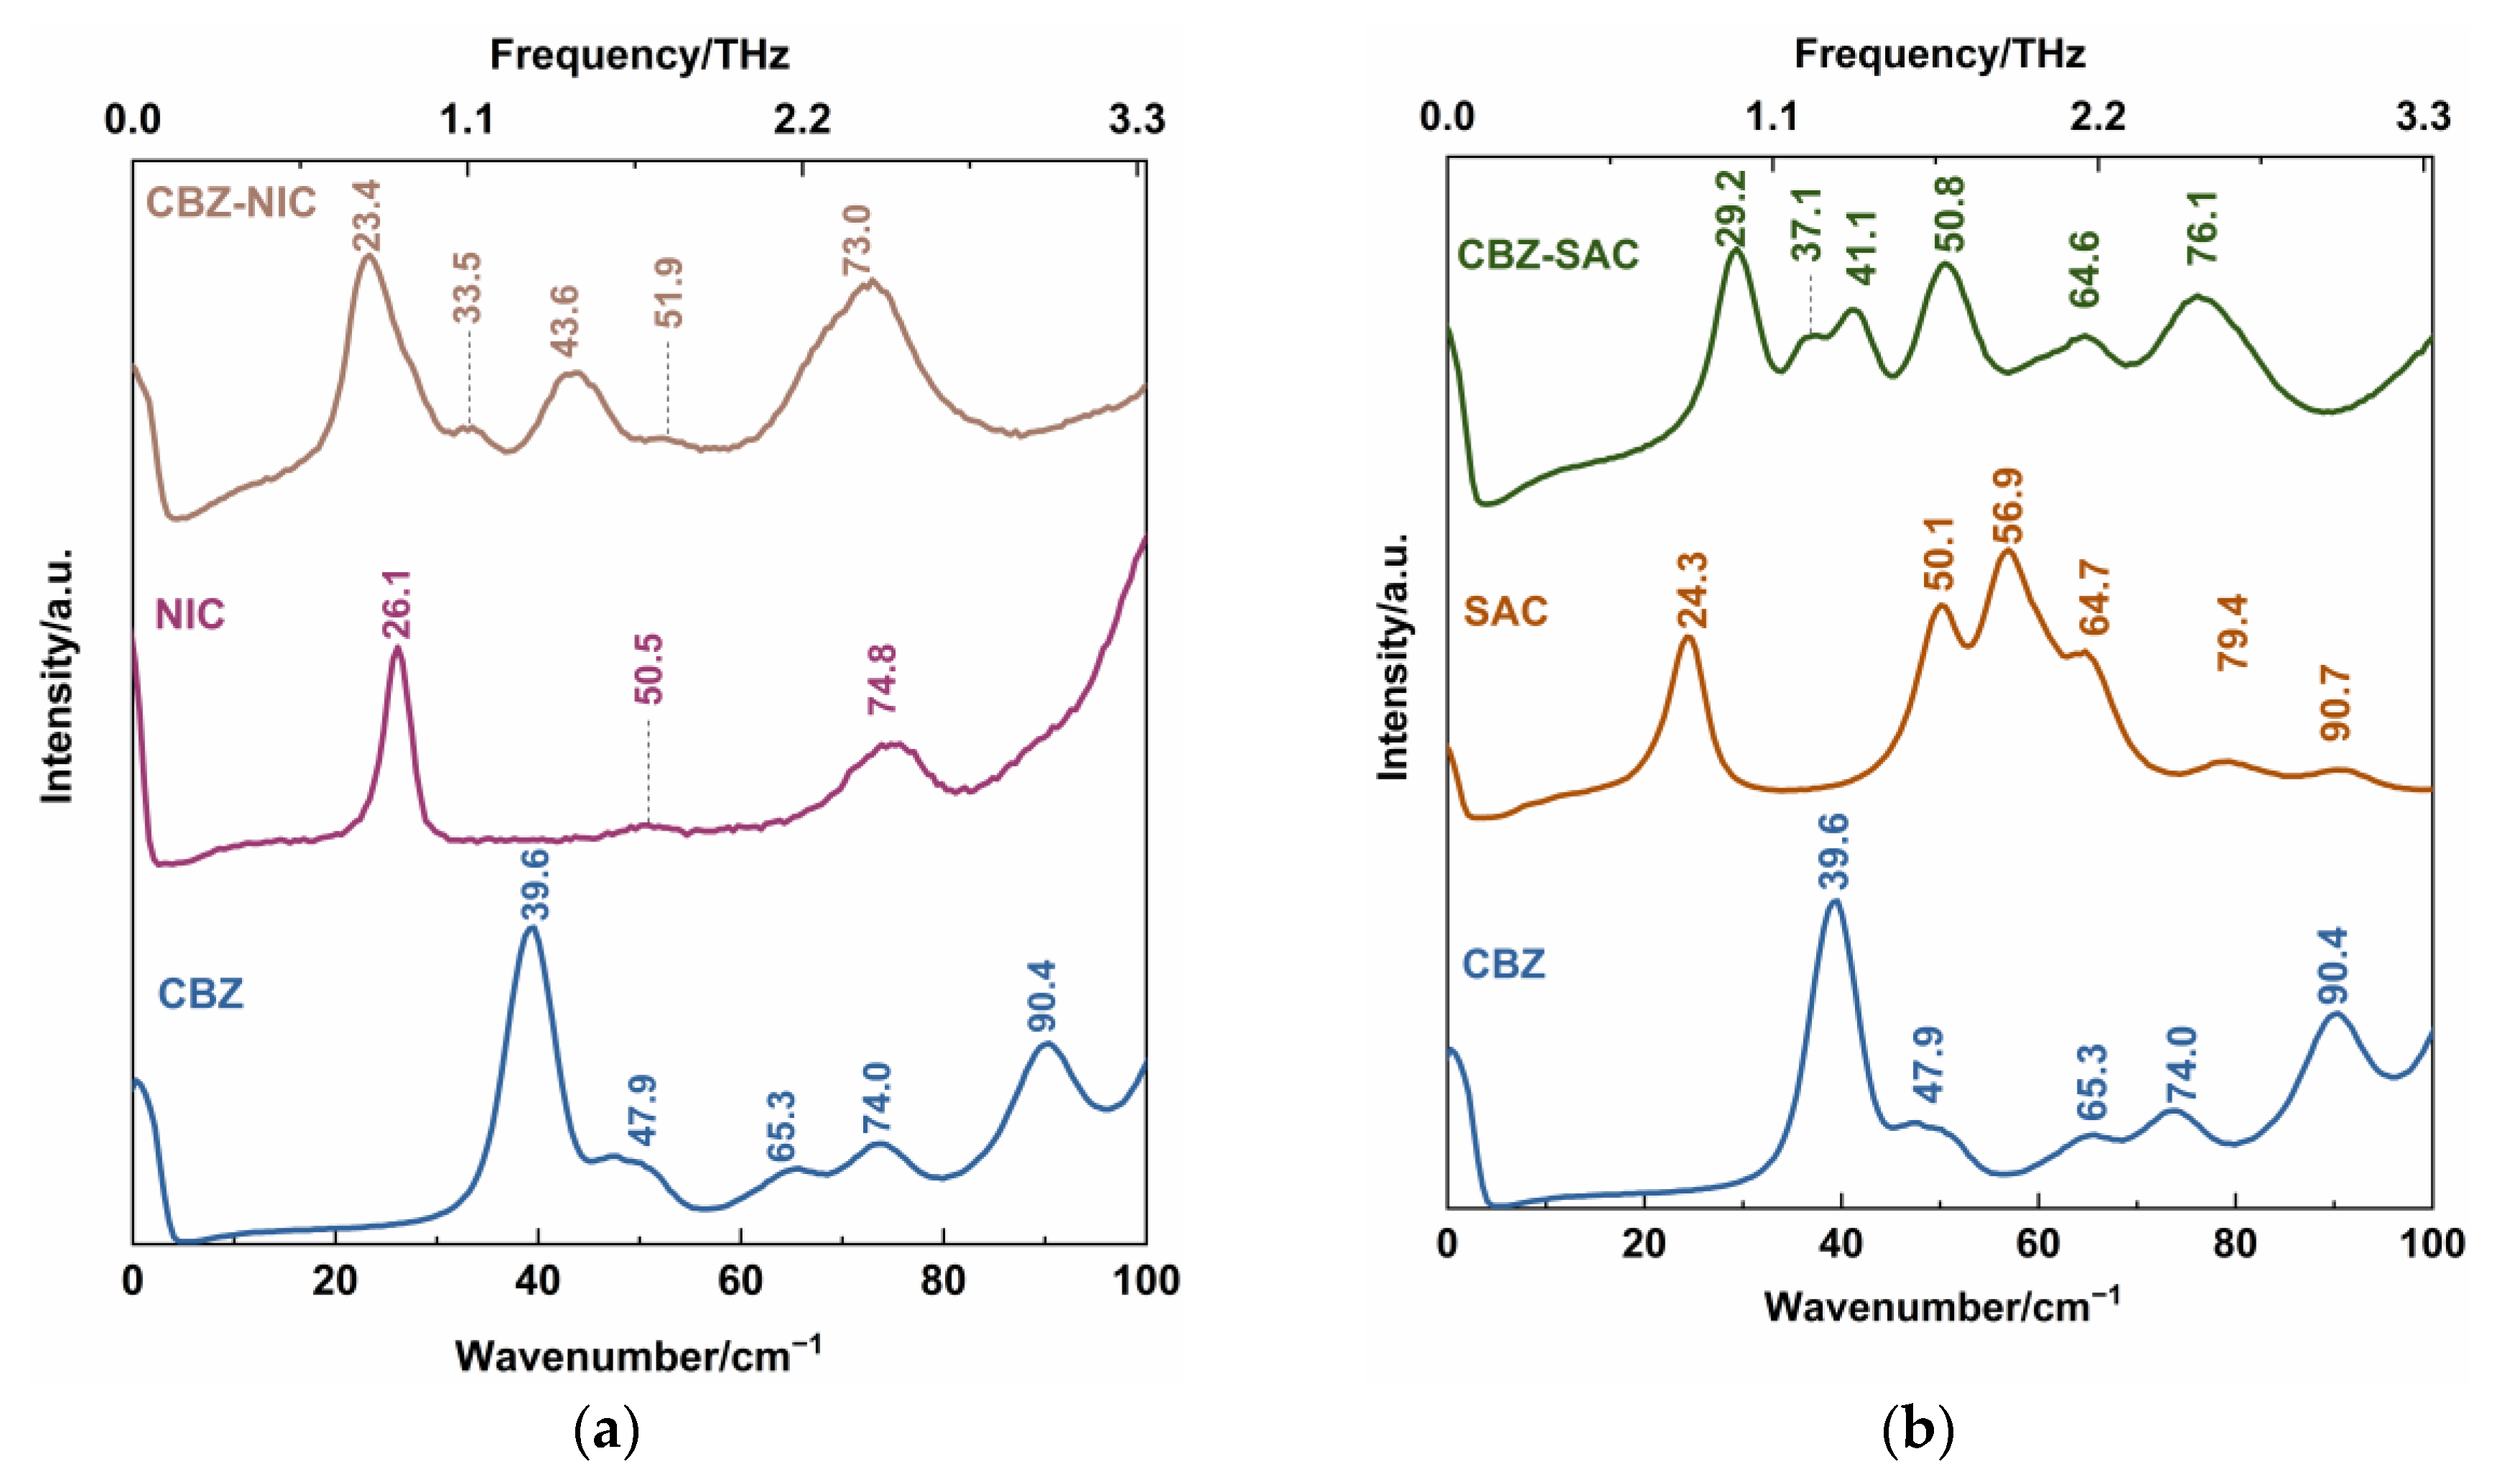
3.3. Low-Wavenumber Raman Spectral Characteristic and Analysis of CBZ-NIC and CBZ-SAC Co-Crystals
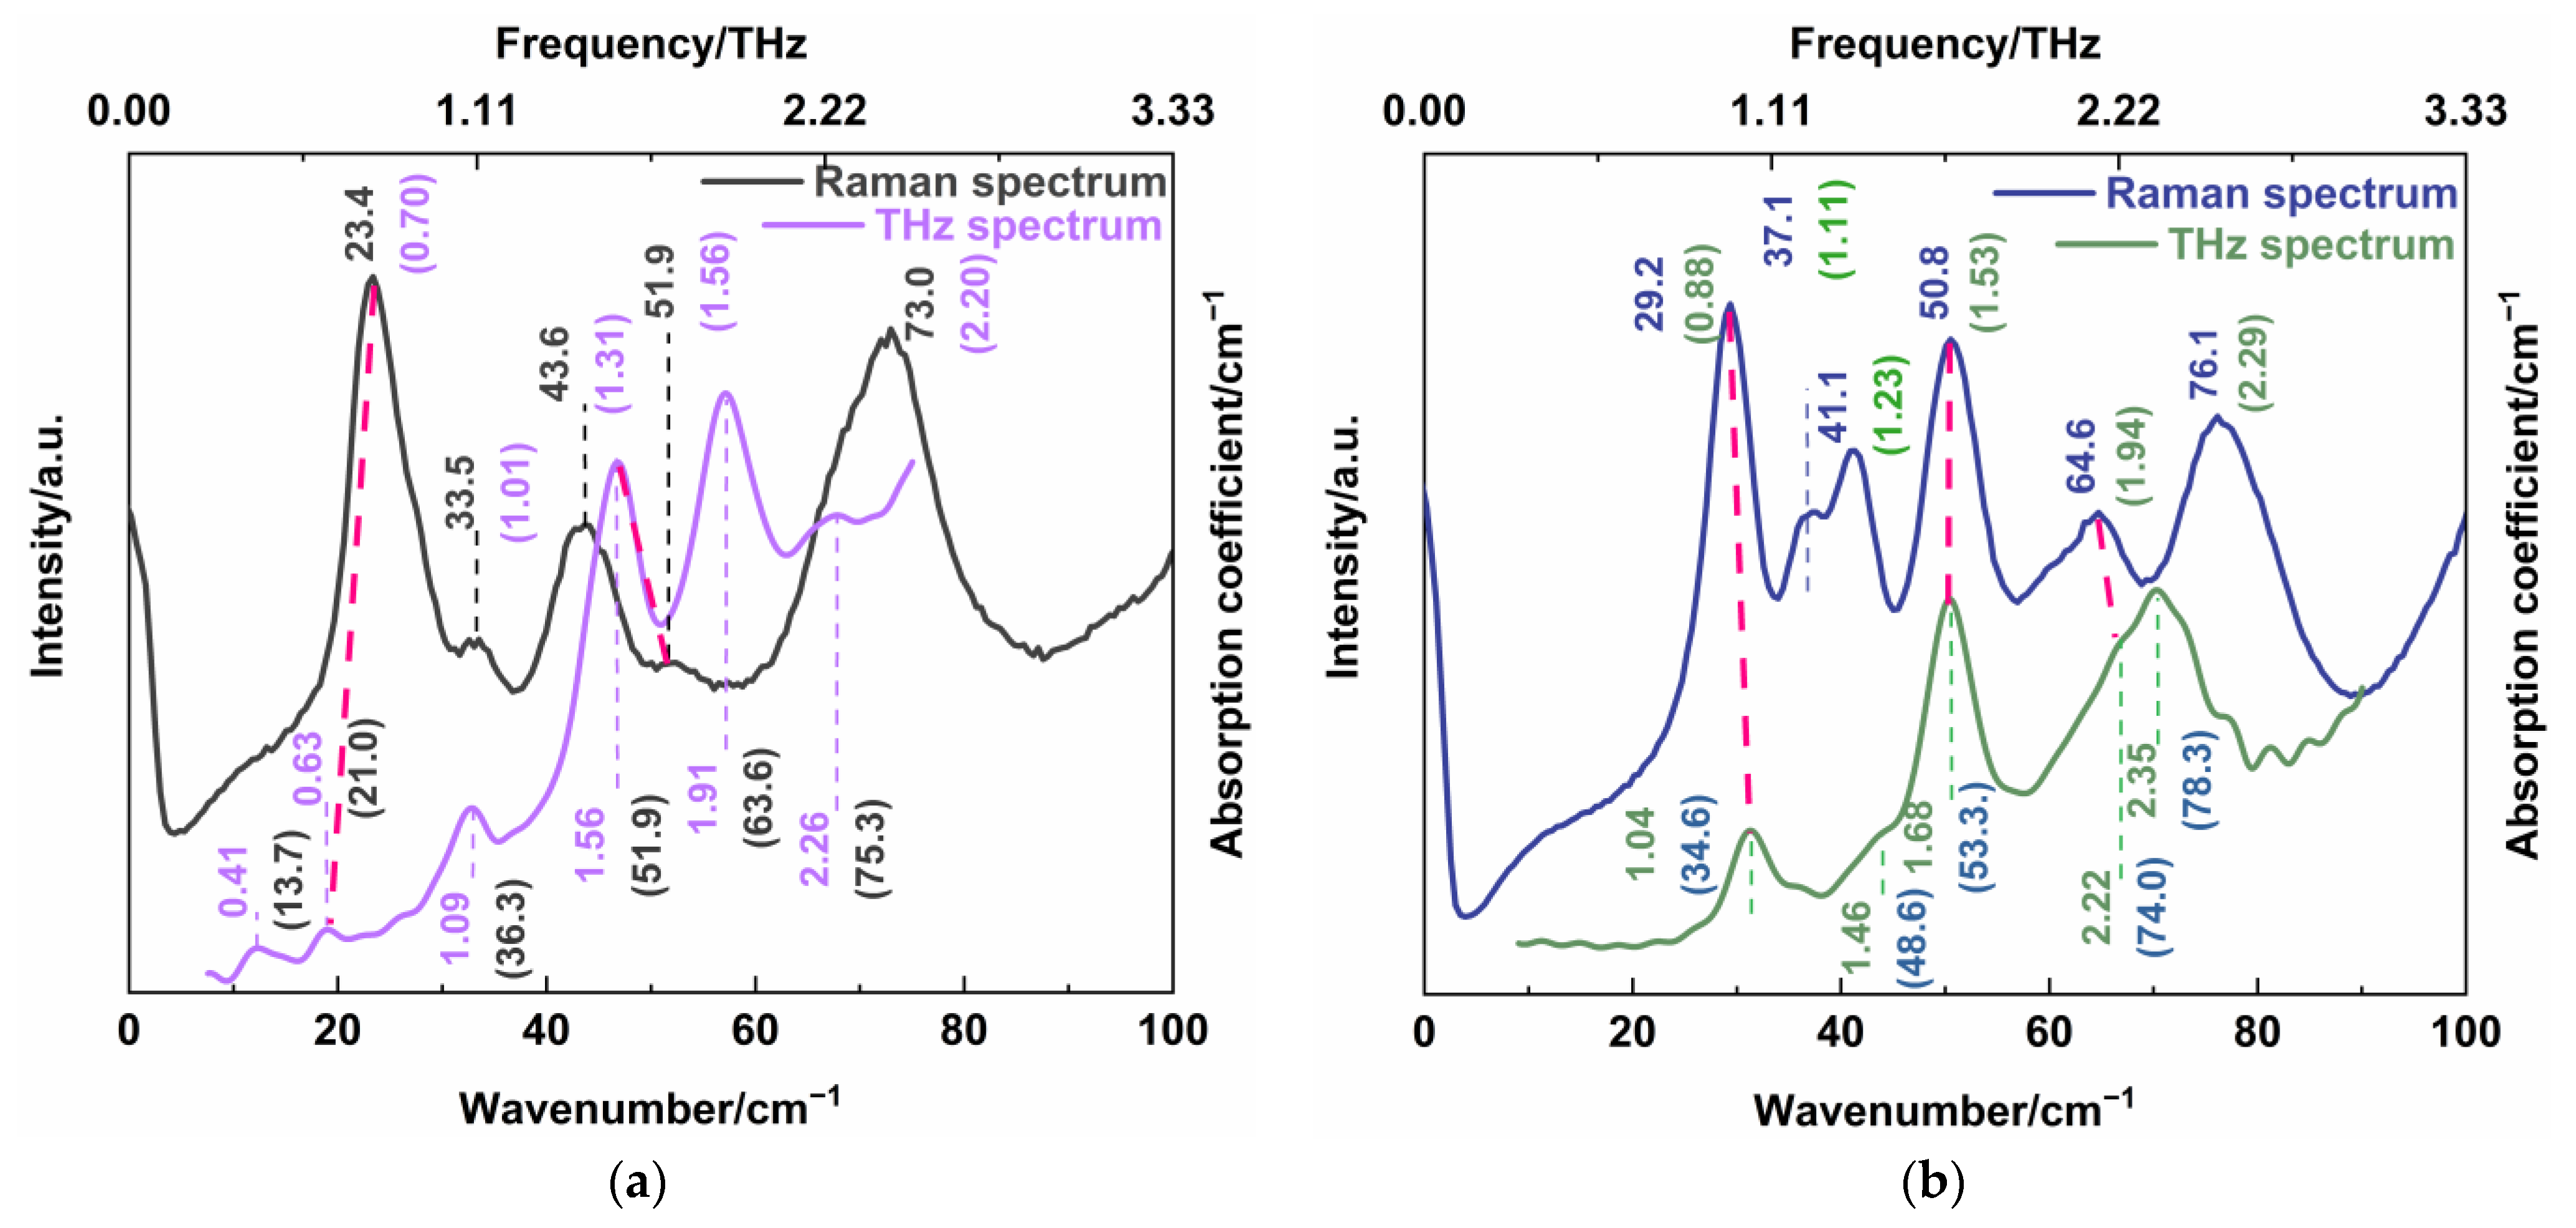
3.4. Comparison of THz and Low-Wavenumber Raman Characteristic of CBZ-NIC and CBZ-SAC Co-Crystals
4. Conclusions
Author Contributions
Funding
Conflicts of Interest
References
- Albani, F.; Riva, R.; Baruzzi, A. Carbamazepine clinical pharmacology: A review. Pharmacopsychiatry 1995, 28, 235–244. [Google Scholar] [CrossRef] [PubMed]
- Kobayashi, Y.; Ito, S.; Itai, S.; Yamamoto, K. Physicochemical properties and bioavailability of carbamazepine polymorphs and dihydrate. Int. J. Pharm. 2000, 193, 137–146. [Google Scholar] [CrossRef]
- Barmpalexis, P.; Karagianni, A.; Nikolakakis, I.; Kachrimanis, K. Artificial Neural Networks (ANNs) and partial least squares (PLS) regression in the quantitative analysis of cocrystal formulations by Raman and ATR-FTIR spectroscopy. J. Pharm. Biomed. Anal. 2018, 158, 214–224. [Google Scholar] [CrossRef]
- Roy, S.; Chamberlin, B.; Matzger, A.J. Polymorph discrimination using low wavenumber Raman spectroscopy. Org. Process. Res. Dev. 2013, 17, 976–980. [Google Scholar] [CrossRef] [PubMed] [Green Version]
- Zhou, Q.; Shen, Y.; Li, Y.; Xu, L.; Cai, Y.; Deng, X. Terahertz spectroscopic characterizations and DFT calculations of carbamazepine cocrystals with nicotinamide, saccharin and fumaric acid. Spectrochim. Acta. A. Mol. Biomol. Spectrosc. 2020, 236, 118346. [Google Scholar] [CrossRef]
- Yw, A.; Jx, B.; Jq, A.; Jl, A.; Yong, D.A. Structure and spectroscopic characterization of pharmaceutical co-crystal formation between acetazolamide and 4-hydroxybenzoic acid-ScienceDirect. Spectrochim. Acta. A. Mol. Biomol. Spectrosc. 2019, 219, 419–426. [Google Scholar]
- Wang, Q.; Xue, J.; Hong, Z.; Du, Y. Pharmaceutical cocrystal formation of pyrazinamide with 3-Hydroxybenzoic Acid: A terahertz and Raman vibrational spectroscopies study. Molecules 2019, 24, 488. [Google Scholar] [CrossRef] [Green Version]
- Hickey, M.B.; Peterson, M.L.; Scoppettuolo, L.A.; Morrisette, S.L.; Vetter, A.; Guzmán, H.; Remenar, J.F.; Zhong, Z.; Tawa, M.; Haley, S. Performance comparison of a co-crystal of carbamazepine with marketed product. Eur. J. Pharm. Biopharm. 2007, 67, 112–119. [Google Scholar] [CrossRef]
- Cheney, M.L.; Shan, N.; Healey, E.R.; Hanna, M.; Wojtas, L.; Zaworotko, M.J.; Sava, V.; Song, S.; Sanchez-Ramos, J.R. Effects of crystal form on solubility and pharmacokinetics: A crystal engineering case study of lamotrigine. Cryst. Growth Des. 2010, 10, 394–405. [Google Scholar] [CrossRef]
- Du, Y.; Zhang, H.L.; Xue, J.D.; Tang, W.J.; Fang, H.X.; Zhang, Q.; Li, Y.F.; Hong, Z. Vibrational spectroscopic study of polymorphism and polymorphic transformation of the anti-viral drug lamivudine. Spectrochim. Acta. A. Mol. Biomol. Spectrosc. 2015, 137, 1158–1163. [Google Scholar] [CrossRef]
- Childs, S.L.; Wood, P.A.; Rodríguez-Hornedo, N.; Reddy, L.S.; Hardcastle, K.I. Analysis of 50 crystal structures containing carbamazepine using the materials module of mercury CSD. Cryst. Growth Des. 2009, 9, 1869–1888. [Google Scholar] [CrossRef]
- Fleischman, S.G.; Kuduva, S.S.; Mcmahon, J.A.; Moulton, B.; Zaworotko, M.J. Crystal engineering of the composition of pharmaceutical phases: Multiple-component crystalline solids involving carbamazepine. Cryst. Growth Des. 2003, 3, 909–919. [Google Scholar] [CrossRef]
- Qiao, N.; Li, M.; Schlindwein, W.; Malek, N.; Davies, A.; Trappitt, G. Pharmaceutical cocrystals: An overview. Int. J. Pharm. 2011, 419, 1–11. [Google Scholar] [CrossRef] [PubMed]
- Callear, S. Preparation, Characterisation and Structural Analysis of Salts and Co-Crystals of Organic Compounds. Ph.D. Thesis, University of Southampton, Sothampton, UK, 2008. [Google Scholar]
- Sun, Y.; Chen, L.; Huang, B.; Chen, K. A Rapid identification method for calamine using near-infrared spectroscopy based on multi-reference correlation coefficient method and back propagation artificial neural network. Appl. Spectros. 2017, 71, 1447–1456. [Google Scholar] [CrossRef]
- Dampf, S.J.; Korter, T.M. Crystalline molecular standards for low-frequency vibrational spectroscopies. J. Infrared Millim. Terahertz Waves 2020, 41, 1284–1300. [Google Scholar] [CrossRef]
- Chen, W.; Peng, Y.; Jiang, X.; Zhao, J.; Zhao, H.; Zhu, Y. Isomers Identification of 2-hydroxyglutarate acid disodium salt (2HG) by terahertz time-domain spectroscopy. Sci. Rep. 2017, 7, 12166. [Google Scholar] [CrossRef] [Green Version]
- Cai, Q.; Xue, J.; Wang, Q.; Du, Y. Solid-state cocrystal formation between acyclovir and fumaric acid: Terahertz and Raman vibrational spectroscopic studies. Spectrochim. Acta. A. Mol. Biomol. Spectrosc. 2017, 186, 29–36. [Google Scholar] [CrossRef]
- Brillante, A.; Bilotti, I.; Valle, R.D.; Venuti, E.; Girlando, A. Probing polymorphs of organic semiconductors by lattice phonon Raman microscopy. Crystengcomm 2008, 10, 937–946. [Google Scholar] [CrossRef]
- Heyler, R.A.; Carriere, J.; Havermeyer, F. THz-Raman-Accessing molecular structure with Raman spectroscopy for enhanced chemical identification, analysis and monitoring. In Proceedings of the SPIE Defense, Security, and Sensing, Baltimore, MD, USA, 29–30 April 2013. [Google Scholar]
- Larkin, P.J.; Dabros, M.; Sarsfield, B.; Chan, E.; Carriere, J.T.; Smith, B.C. Polymorph characterization of active pharmaceutical ingredients (APIs) using low-frequency Raman spectroscopy. Appl. Spectrosc. 2014, 68, 758–776. [Google Scholar] [CrossRef]
- Yutani, R.; Haku, R.; Teraoka, R.; Tode, C.; Koide, T.; Kitagawa, S.; Sakane, T.; Fukami, T. Comparative evaluation of the photostability of carbamazepine polymorphs and cocrystals. Crystals 2019, 9, 553. [Google Scholar] [CrossRef] [Green Version]
- Carriere, J.T.A.; Havermeyer, F.; Heyler, R.A. THz-Raman spectroscopy for explosives, chemical and biological detection in chemical, biological, radiological, nuclear, and explosives. In Proceedings of the SPIE Chemical, Biological, Radiological, Nuclear, and Explosives Sensing XIV, Baltimore, MD, USA, 30 April–3 May 2013. [Google Scholar]
- Wang, Y.; Wang, G.; Xu, D.; Jiang, B.; Ge, M.; Wu, L.; Yang, C.; Mu, N.; Wang, S.; Chang, C.; et al. Terahertz spectroscopic diagnosis of early blast-induced traumatic brain injury in rats. Biomed. Opt. Express 2020, 11, 4085–4098. [Google Scholar] [CrossRef] [PubMed]
- Du, Y.; Fang, H.X.; Zhang, Q.; Zhang, H.L.; Hong, Z. Spectroscopic investigation on cocrystal formation between adenine and fumaric acid based on infrared and Raman techniques. Spectrochim. Acta Part A-Mol. Biomol. Spectrosc. 2016, 153, 580–585. [Google Scholar] [CrossRef] [PubMed]
- Wu, X.; Wang, Y.; Xue, J.; Liu, J.; Qin, J.; Hong, Z.; Du, Y. Solid phase drug-drug pharmaceutical co-crystal formed between pyrazinamide and diflunisal: Structural characterization based on terahertz/Raman spectroscopy combining with DFT calculation. Spectrochim. Acta. A. Mol. Biomol. Spectrosc. 2020, 234, 118256. [Google Scholar] [CrossRef] [PubMed]
- Zhang, Z.; Cai, Q.; Xue, J.; Qin, J.; Liu, J.; Du, Y. Co-Crystal Formation of antibiotic nitrofurantoin drug and melamine co-former based on a vibrational spectroscopic study. Pharmacopsychiatry 2019, 11, 56. [Google Scholar] [CrossRef] [PubMed] [Green Version]
- Ghosh, P.N. Factor Group Splitting and Multipole Interactions in Molecular Crystals; Spring: New York, NY, USA, 1981; pp. 435–440. [Google Scholar]
- Lagaron, J. The factor group splitting phenomenon: A vibrational spectroscopy approach to assess polymer crystallinity and crystalline density. Macromol. Symp. 2002, 184, 19–36. [Google Scholar] [CrossRef]


| Experimental Result/THz | Calculation Result/THz | Vibrational Mode Assignment |
|---|---|---|
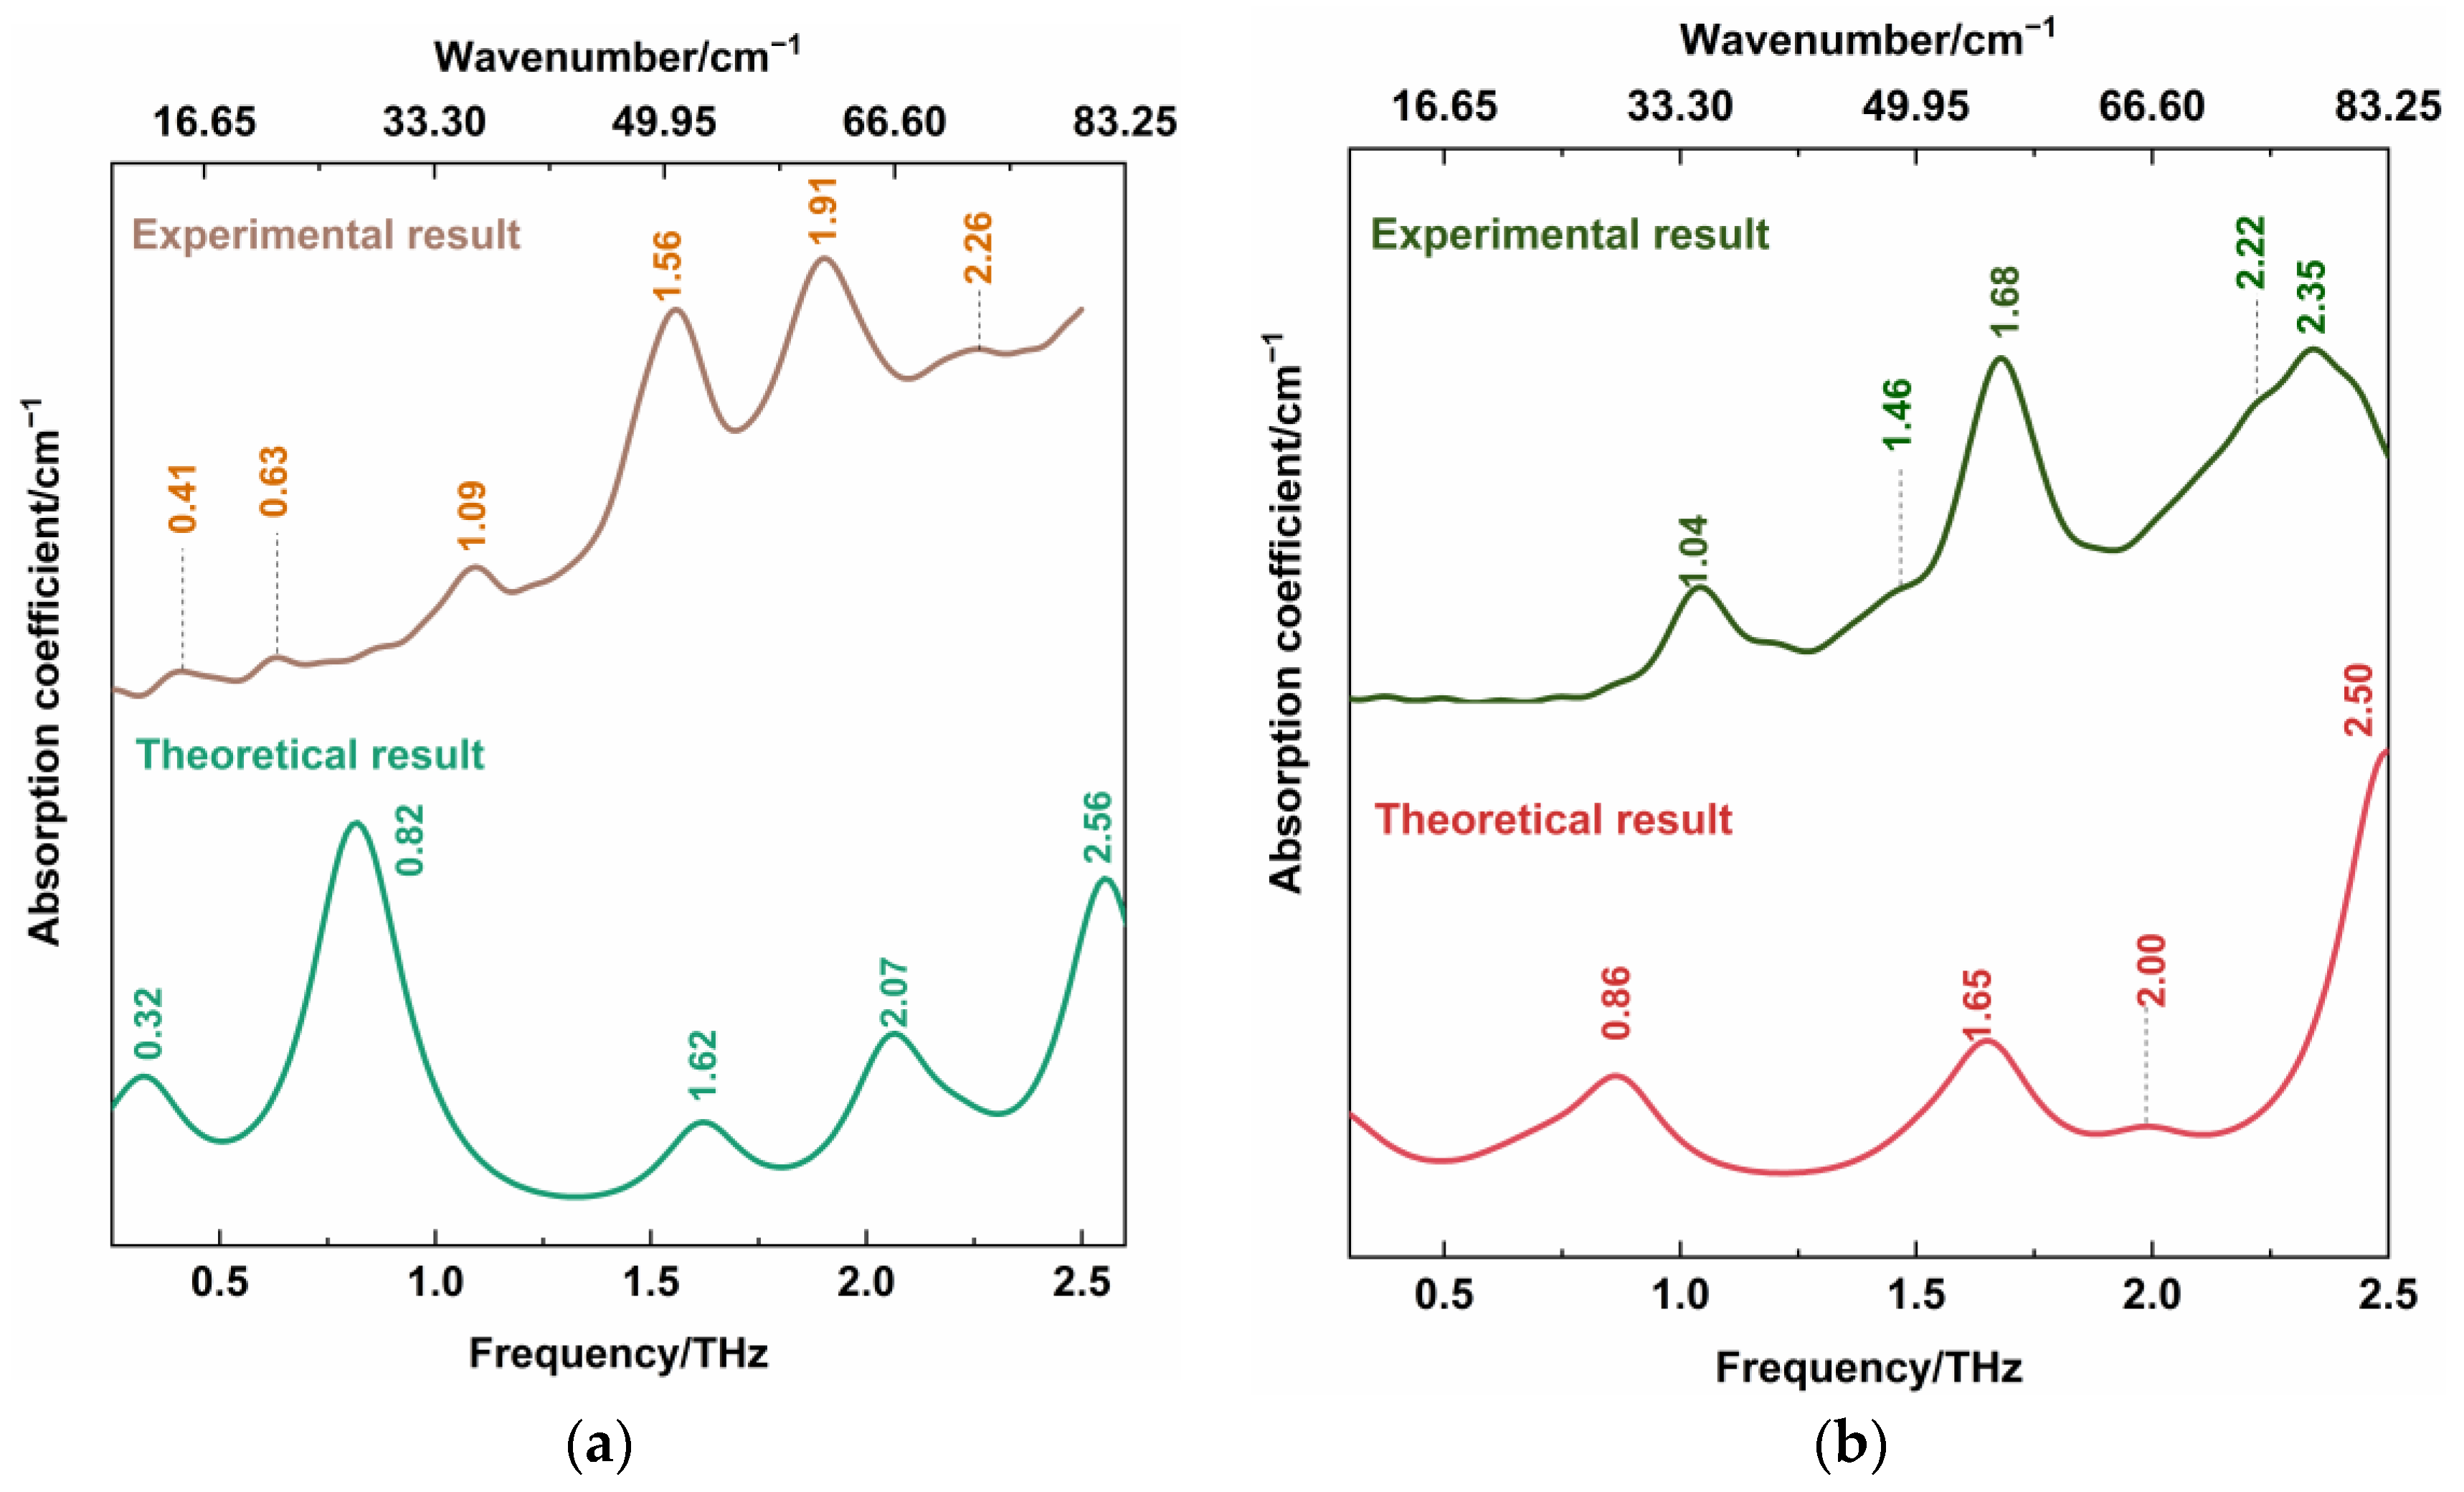
| 0.41 | 0.32 | CBZ and NIC molecule collective twisting vibration |
| 0.63 | 0.82 | collective out-of-plane rocking vibration of the CBZ and NIC molecules |
| 1.09 | — | — |
| 1.56 | 1.62 | strong collective out-of-plane rocking vibration of CBZ; weak collective in-plane rocking vibration of NIC |
| 1.91 | 2.07 | strong NIC molecule collective twisting vibration; weak CBZ molecule shearing vibration |
| 2.26 | 2.56 | strong out-of-plane rocking vibration of N2-6C=10O and twisting of C7-16C-17C-19C-21C-30C within CBZ molecules, and weak collective in-plane rocking vibration of NIC molecules |
| Experimental Result/THz | Calculation Result/THz | Vibrational Mode Assignment |
|---|---|---|
| 1.04 | 0.86 | collective in-plane shearing vibration of CBZ and SAC molecules |
| 1.46 | — | — |
| 1.68 | 1.65 | strong bending vibration of CBZ; in-plane rocking vibration of O2=S1=O3 within the SAC; weak out-of-plane rocking vibration of SAC |
| 2.22 | 2.00 | bending vibration of C45–C36–C34–C32–C31–C22 belonging to CBZ molecules |
| 2.35 | 2.50 | out-of-plane rocking vibration of N19–21C=O18 and twisting vibration of C45–C36–C34–C32–C31–C22 of CBZ molecules |
| Experimental Result/cm−1 | Calculation Result/cm−1 | Vibrational Mode Assignment |
|---|---|---|
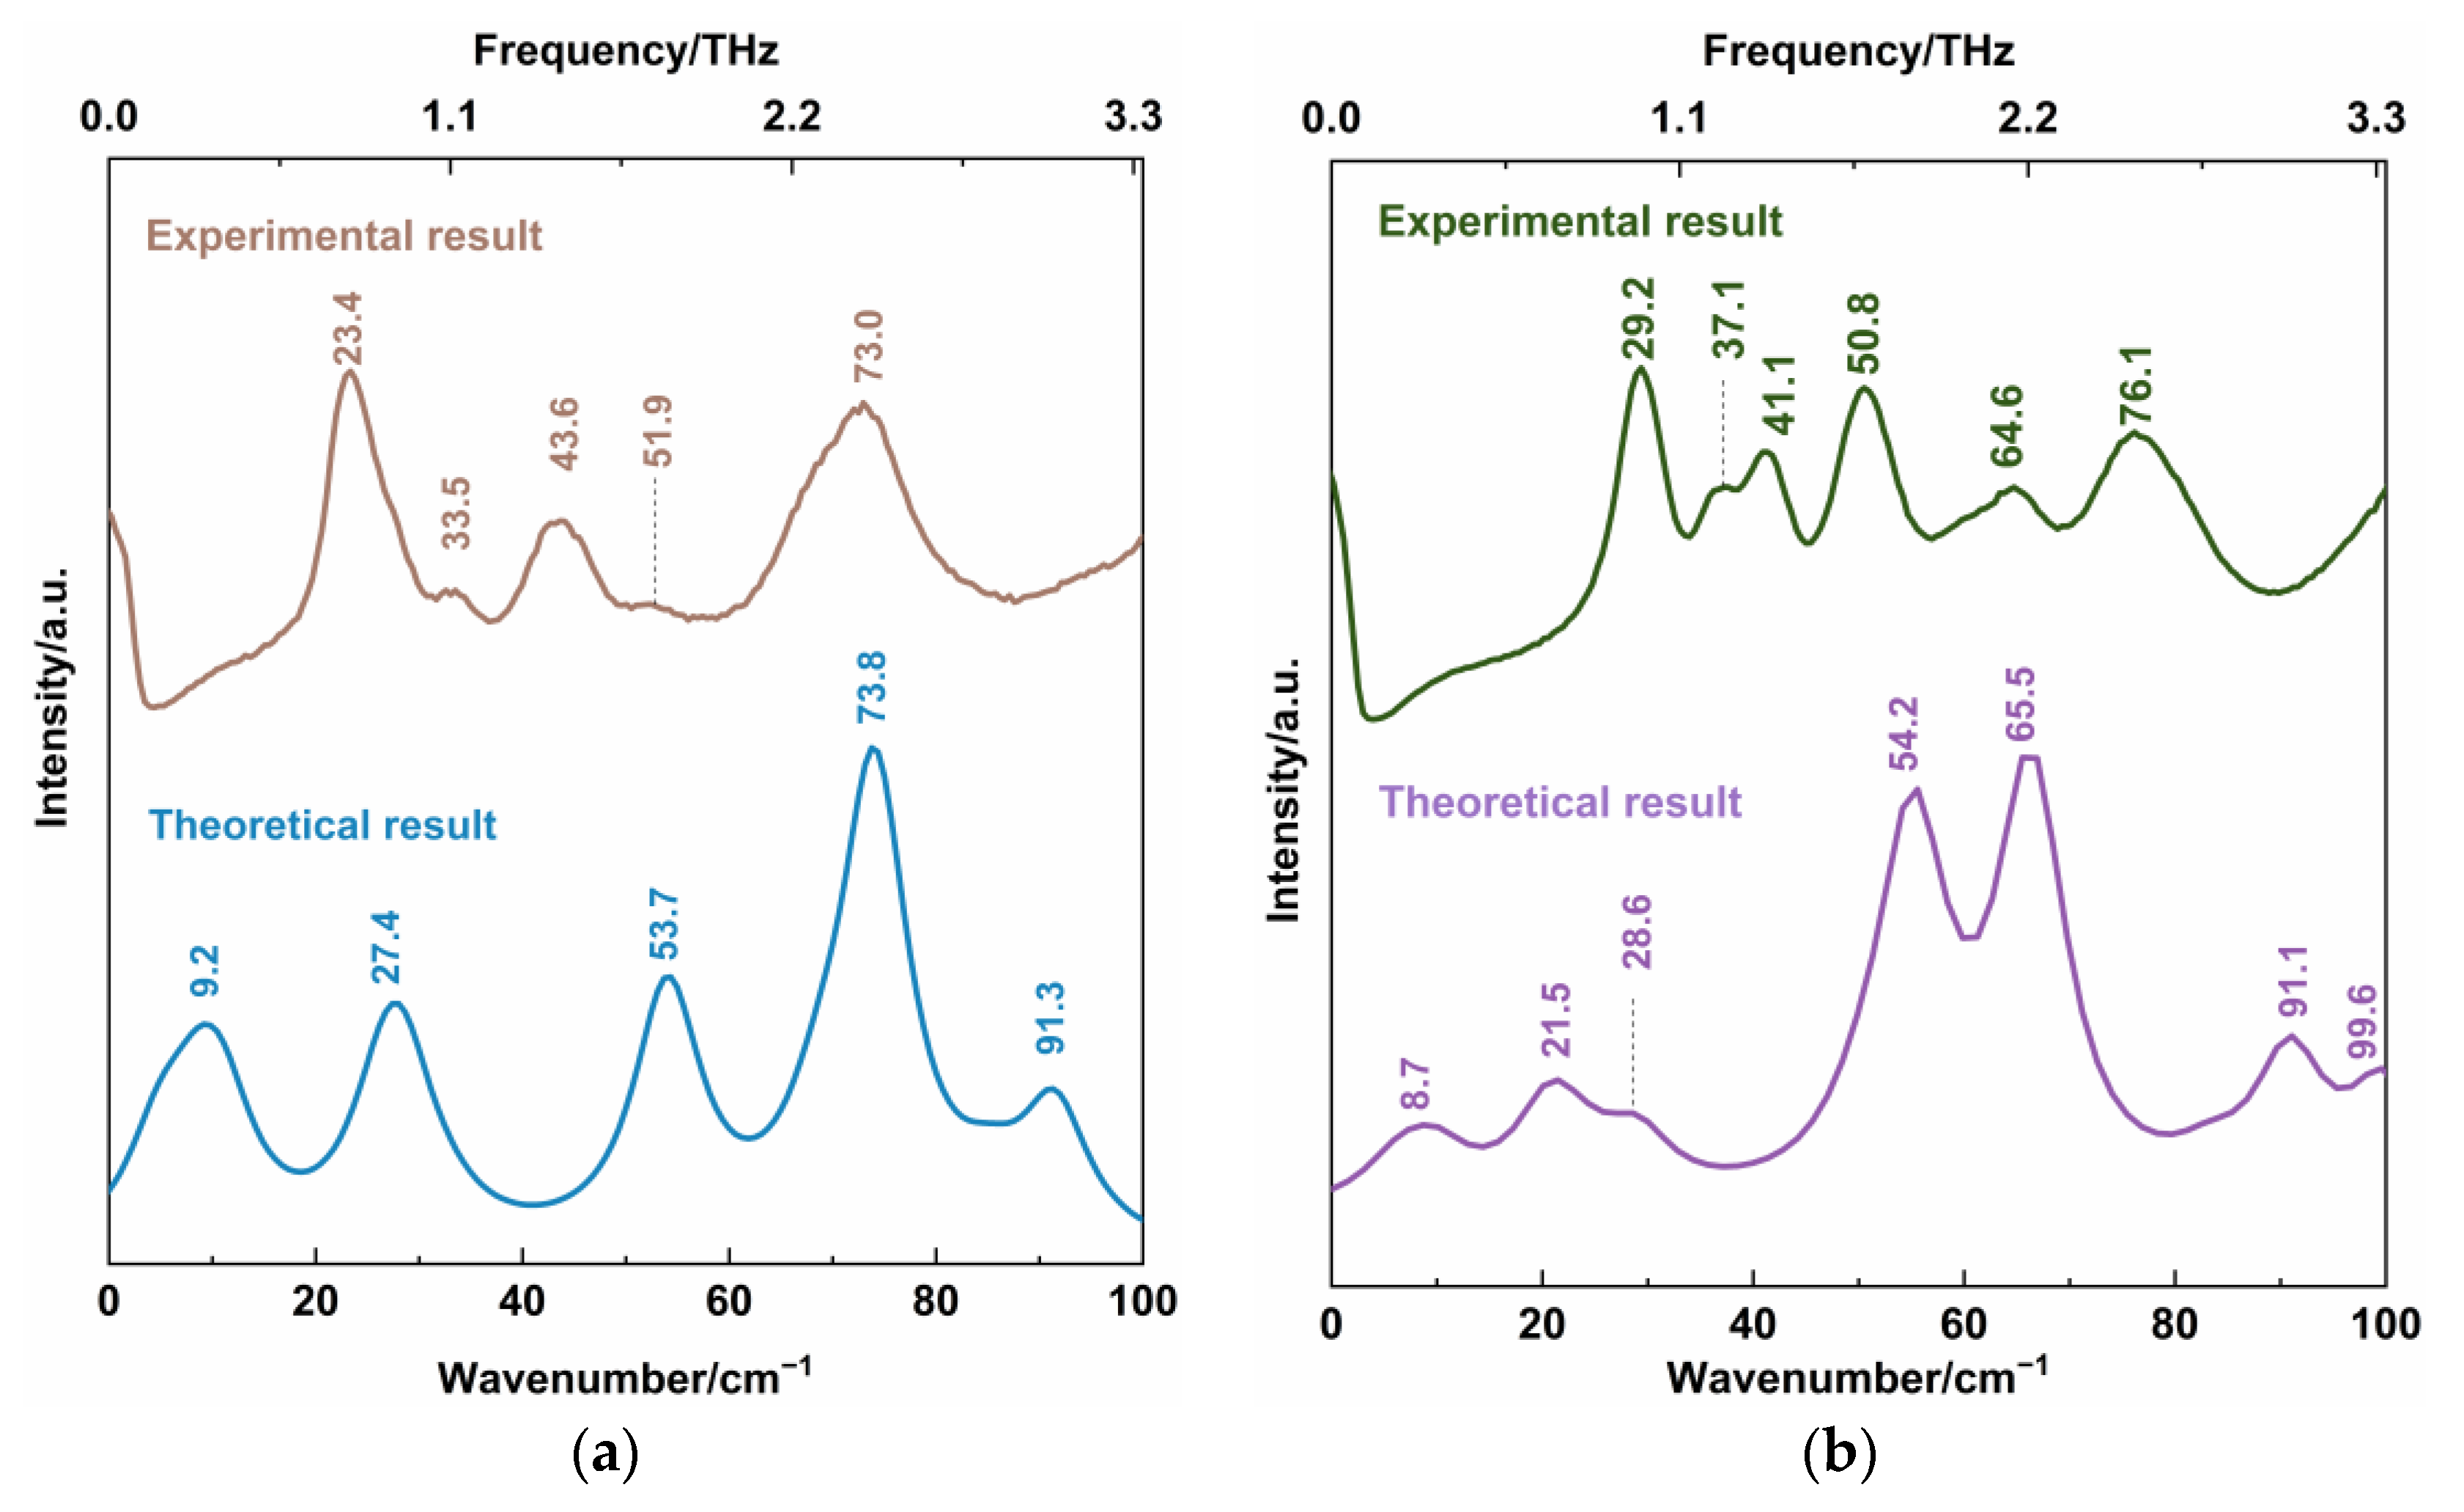
| 9.2 | collective bending vibration of CBZ and NIC molecules | |
| 23.4 | 27.4 | collective out-of-plane rocking vibration of CBZ and NIC molecules |
| 43.6 | ||
| 51.9 | 53.7 | strong collective out-of-plane rocking vibration of CBZ molecules; weak collective in-plane rocking vibration of NIC |
| 73.0 | 73.8 | bending vibration of C7-16C-17C-19C-21C-30C within CBZ molecules; weak in-plane rocking vibration of NIC molecules |
| 91.3 | twisting vibration of C7-16C-17C-19C-21C-30C belonging to CBZ molecules; weak in-plane rocking vibration of NIC molecules |
| Experimental Result/cm−1 | Calculation Result/cm−1 | Vibrational Mode Assignment |
|---|---|---|
| 8.7 | CBZ and SAC molecules’ collective shearing vibration | |
| 21.5 | collective out-of-plane rocking vibration of CBZ and SAC molecules | |
| 29.2 | 28.6 | collective in-plane shearing vibration of CBZ and SAC molecules |
| 37.1 | ||
| 41.1 | ||
| 50.8 | 54.2 | CBZ molecules’ strong bending vibration; in-plane rocking vibration of O2=S1=O3 of SAC molecules; weak out-of-plane rocking vibration of SAC molecules |
| 64.6 | 65.5 | bending vibration of C45-C36-C34-C32-C31-C22 which belongs to CBZ molecules |
| 76.1 | ||
| 91.1 | out-of-plane rocking vibration of N19–21C=O18 twisting vibration of C45–C36–C34–C32–C31–C22 belonging to CBZ molecules | |
| 99.6 | out-of-plane rocking vibration of O2=S1=C8 belonging to SAC molecules |
Publisher’s Note: MDPI stays neutral with regard to jurisdictional claims in published maps and institutional affiliations. |
© 2022 by the authors. Licensee MDPI, Basel, Switzerland. This article is an open access article distributed under the terms and conditions of the Creative Commons Attribution (CC BY) license (https://creativecommons.org/licenses/by/4.0/).
Share and Cite
Ge, M.; Wang, Y.; Zhu, J.; Wu, B.; Xu, D.; Yao, J. Low-Frequency Vibrational Spectroscopy Characteristic of Pharmaceutical Carbamazepine Co-Crystals with Nicotinamide and Saccharin. Sensors 2022, 22, 4053. https://doi.org/10.3390/s22114053
Ge M, Wang Y, Zhu J, Wu B, Xu D, Yao J. Low-Frequency Vibrational Spectroscopy Characteristic of Pharmaceutical Carbamazepine Co-Crystals with Nicotinamide and Saccharin. Sensors. 2022; 22(11):4053. https://doi.org/10.3390/s22114053
Chicago/Turabian StyleGe, Meilan, Yuye Wang, Junfeng Zhu, Bin Wu, Degang Xu, and Jianquan Yao. 2022. "Low-Frequency Vibrational Spectroscopy Characteristic of Pharmaceutical Carbamazepine Co-Crystals with Nicotinamide and Saccharin" Sensors 22, no. 11: 4053. https://doi.org/10.3390/s22114053
APA StyleGe, M., Wang, Y., Zhu, J., Wu, B., Xu, D., & Yao, J. (2022). Low-Frequency Vibrational Spectroscopy Characteristic of Pharmaceutical Carbamazepine Co-Crystals with Nicotinamide and Saccharin. Sensors, 22(11), 4053. https://doi.org/10.3390/s22114053