
The New Ion-Selective Electrodes Developed for Ferric Cations Determination, Modified with Synthesized Al and Fe−Based Nanoparticles

 ,
,  ,
,  , , , and
Abstract
:1. Introduction
2. Materials and Methods
2.1. Al and Fe-Based NPs Synthesis
2.2. Ion-Selective Membranes
2.3. Characterization
3. Results and Discussion
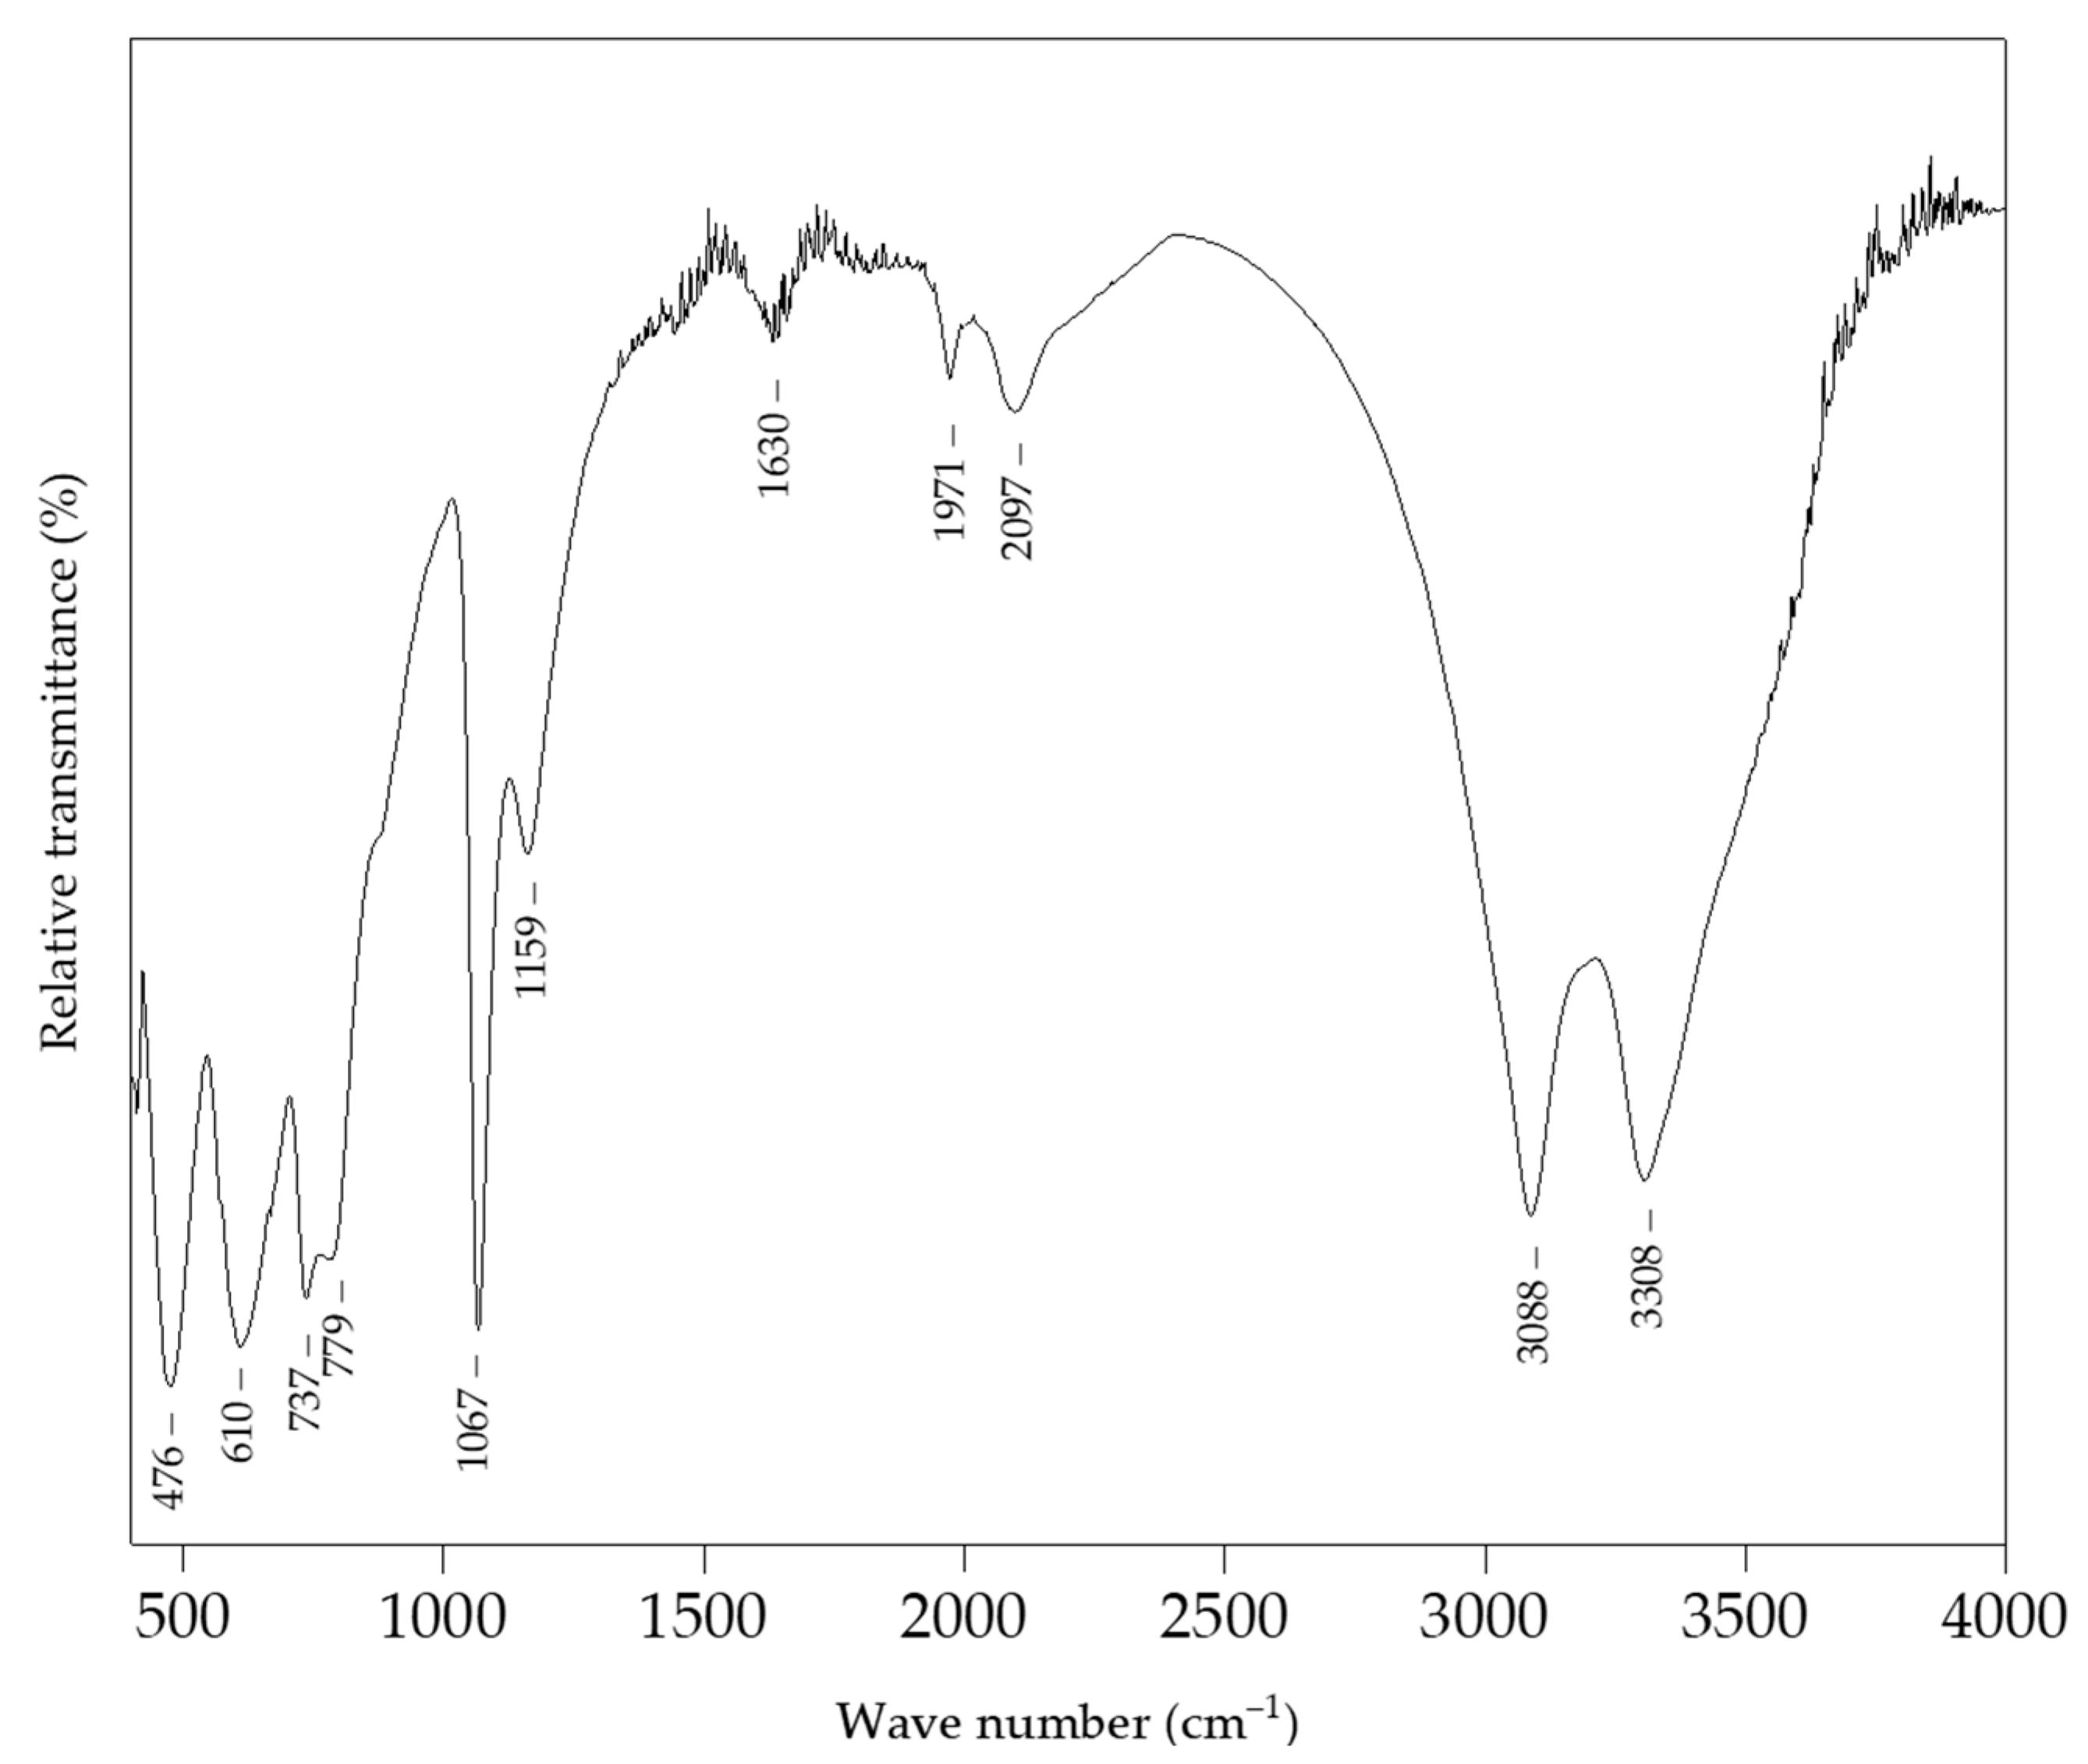
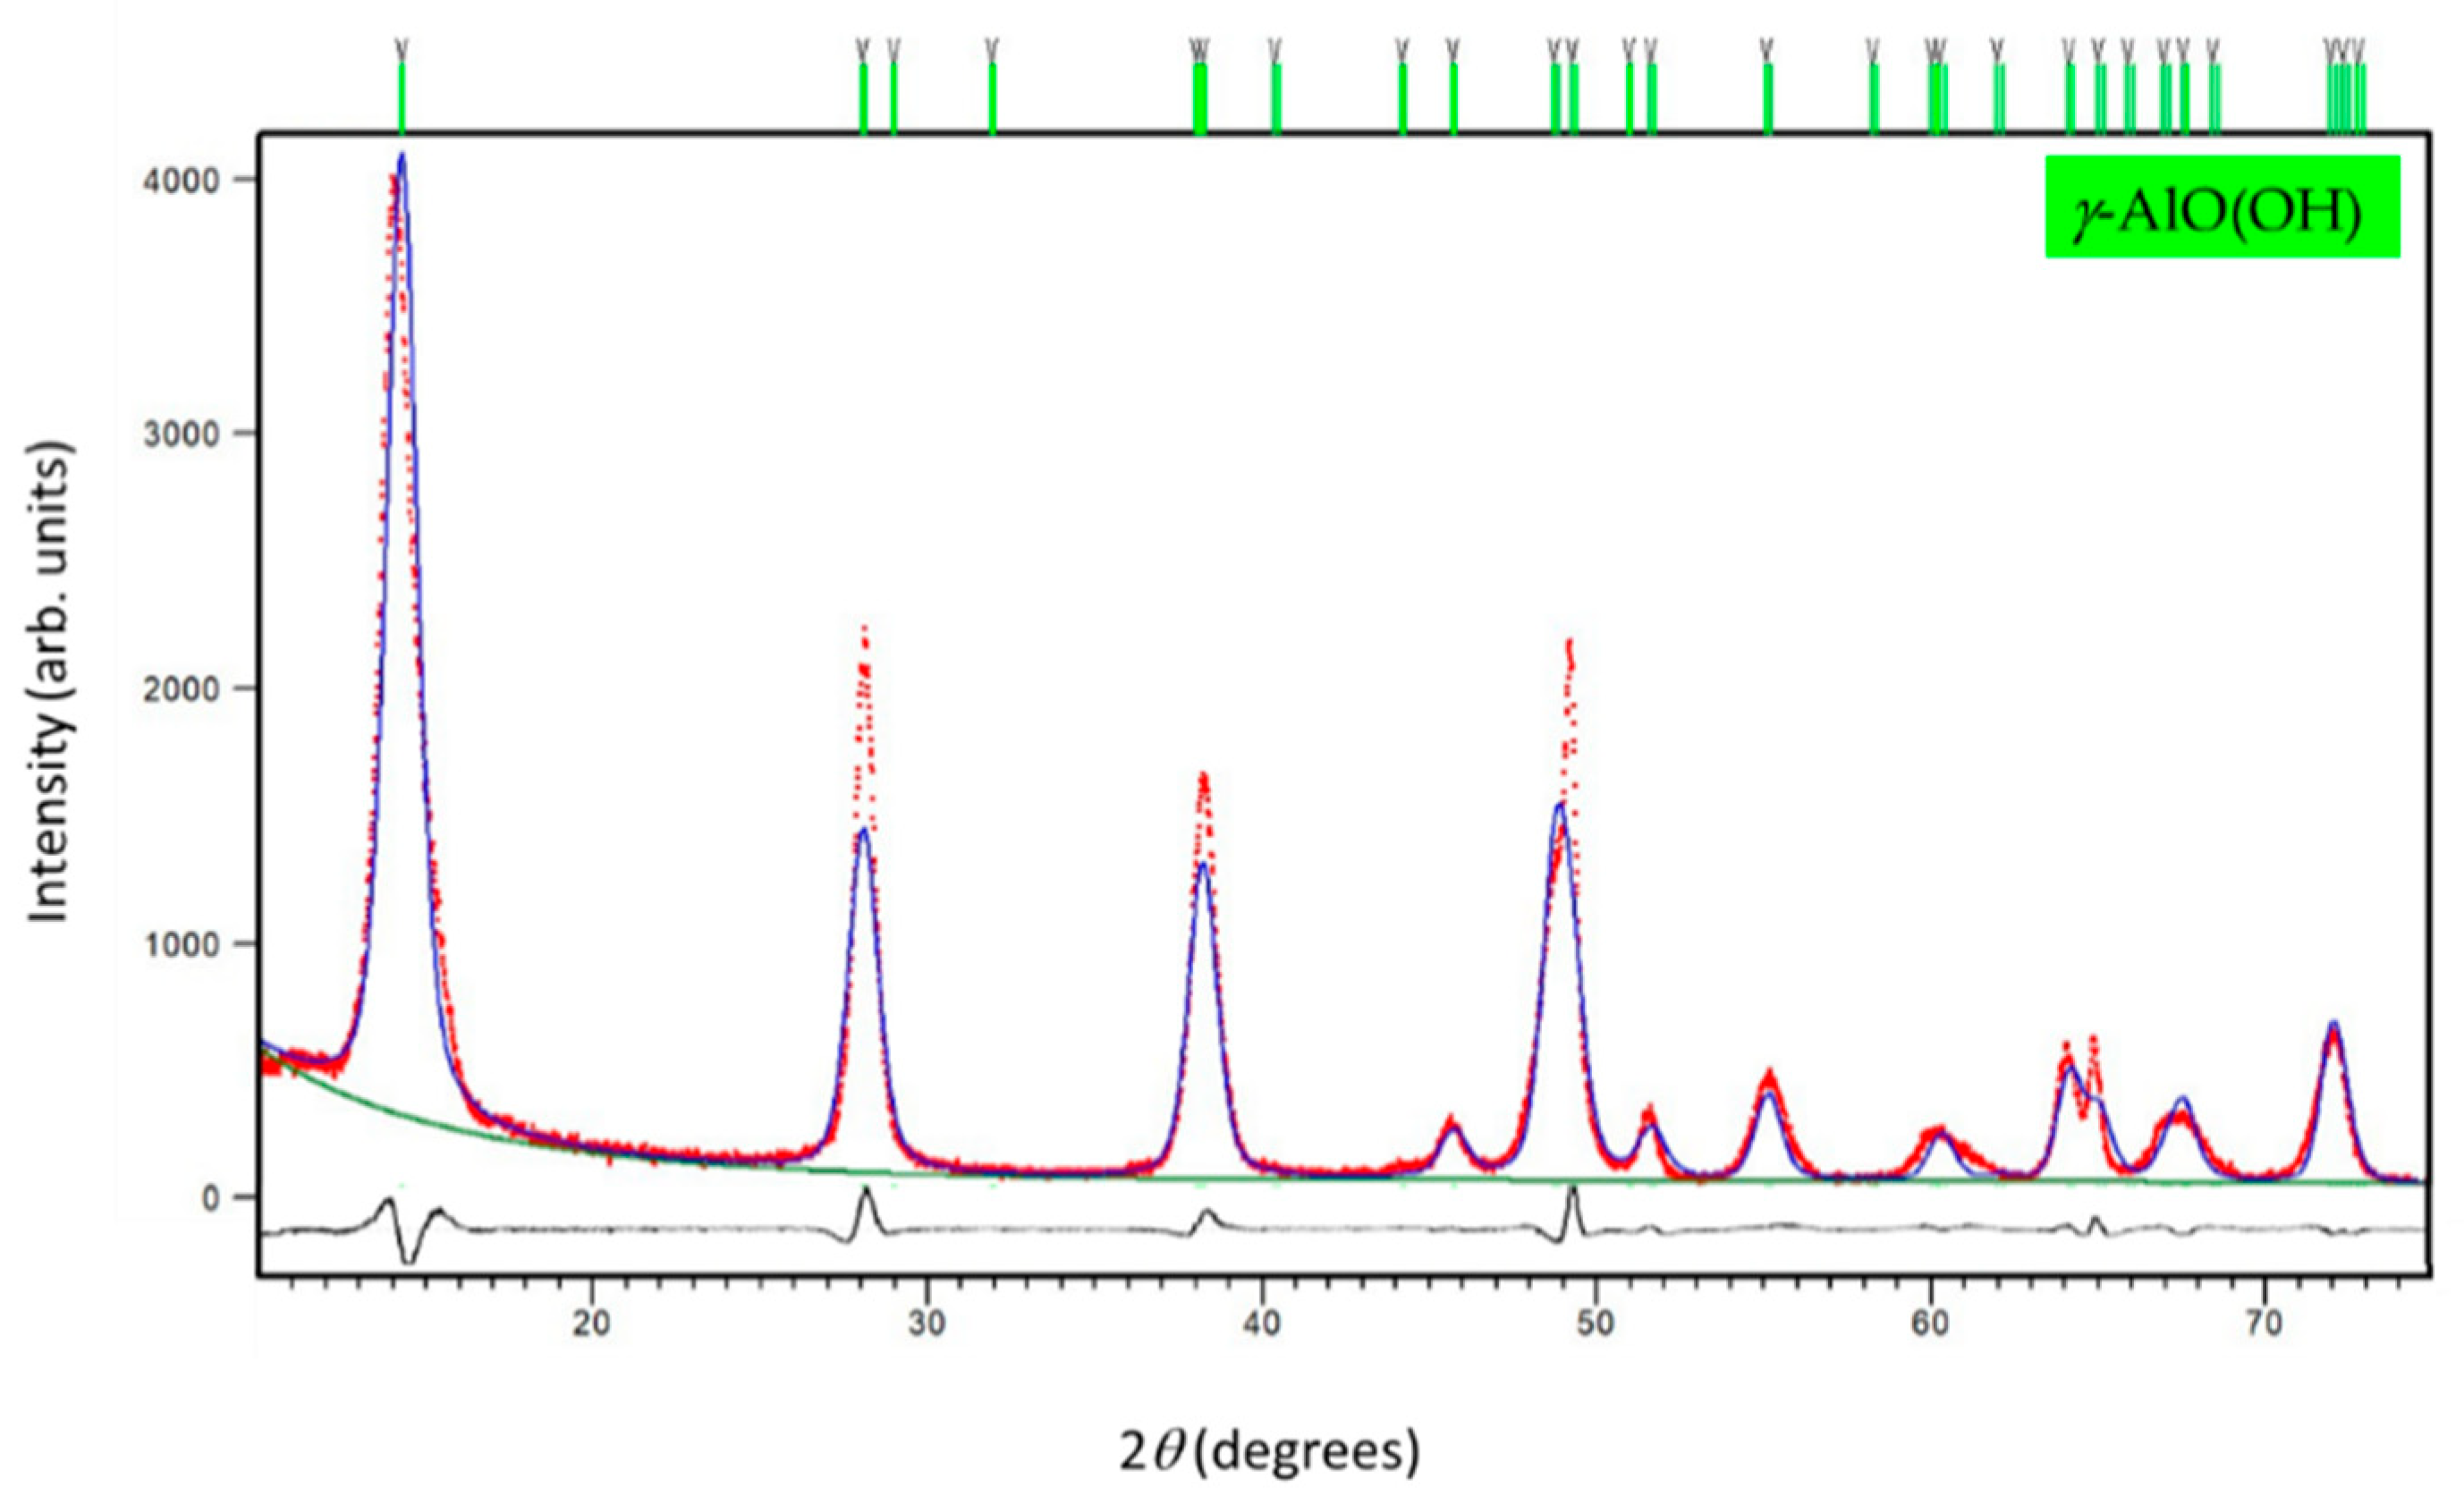
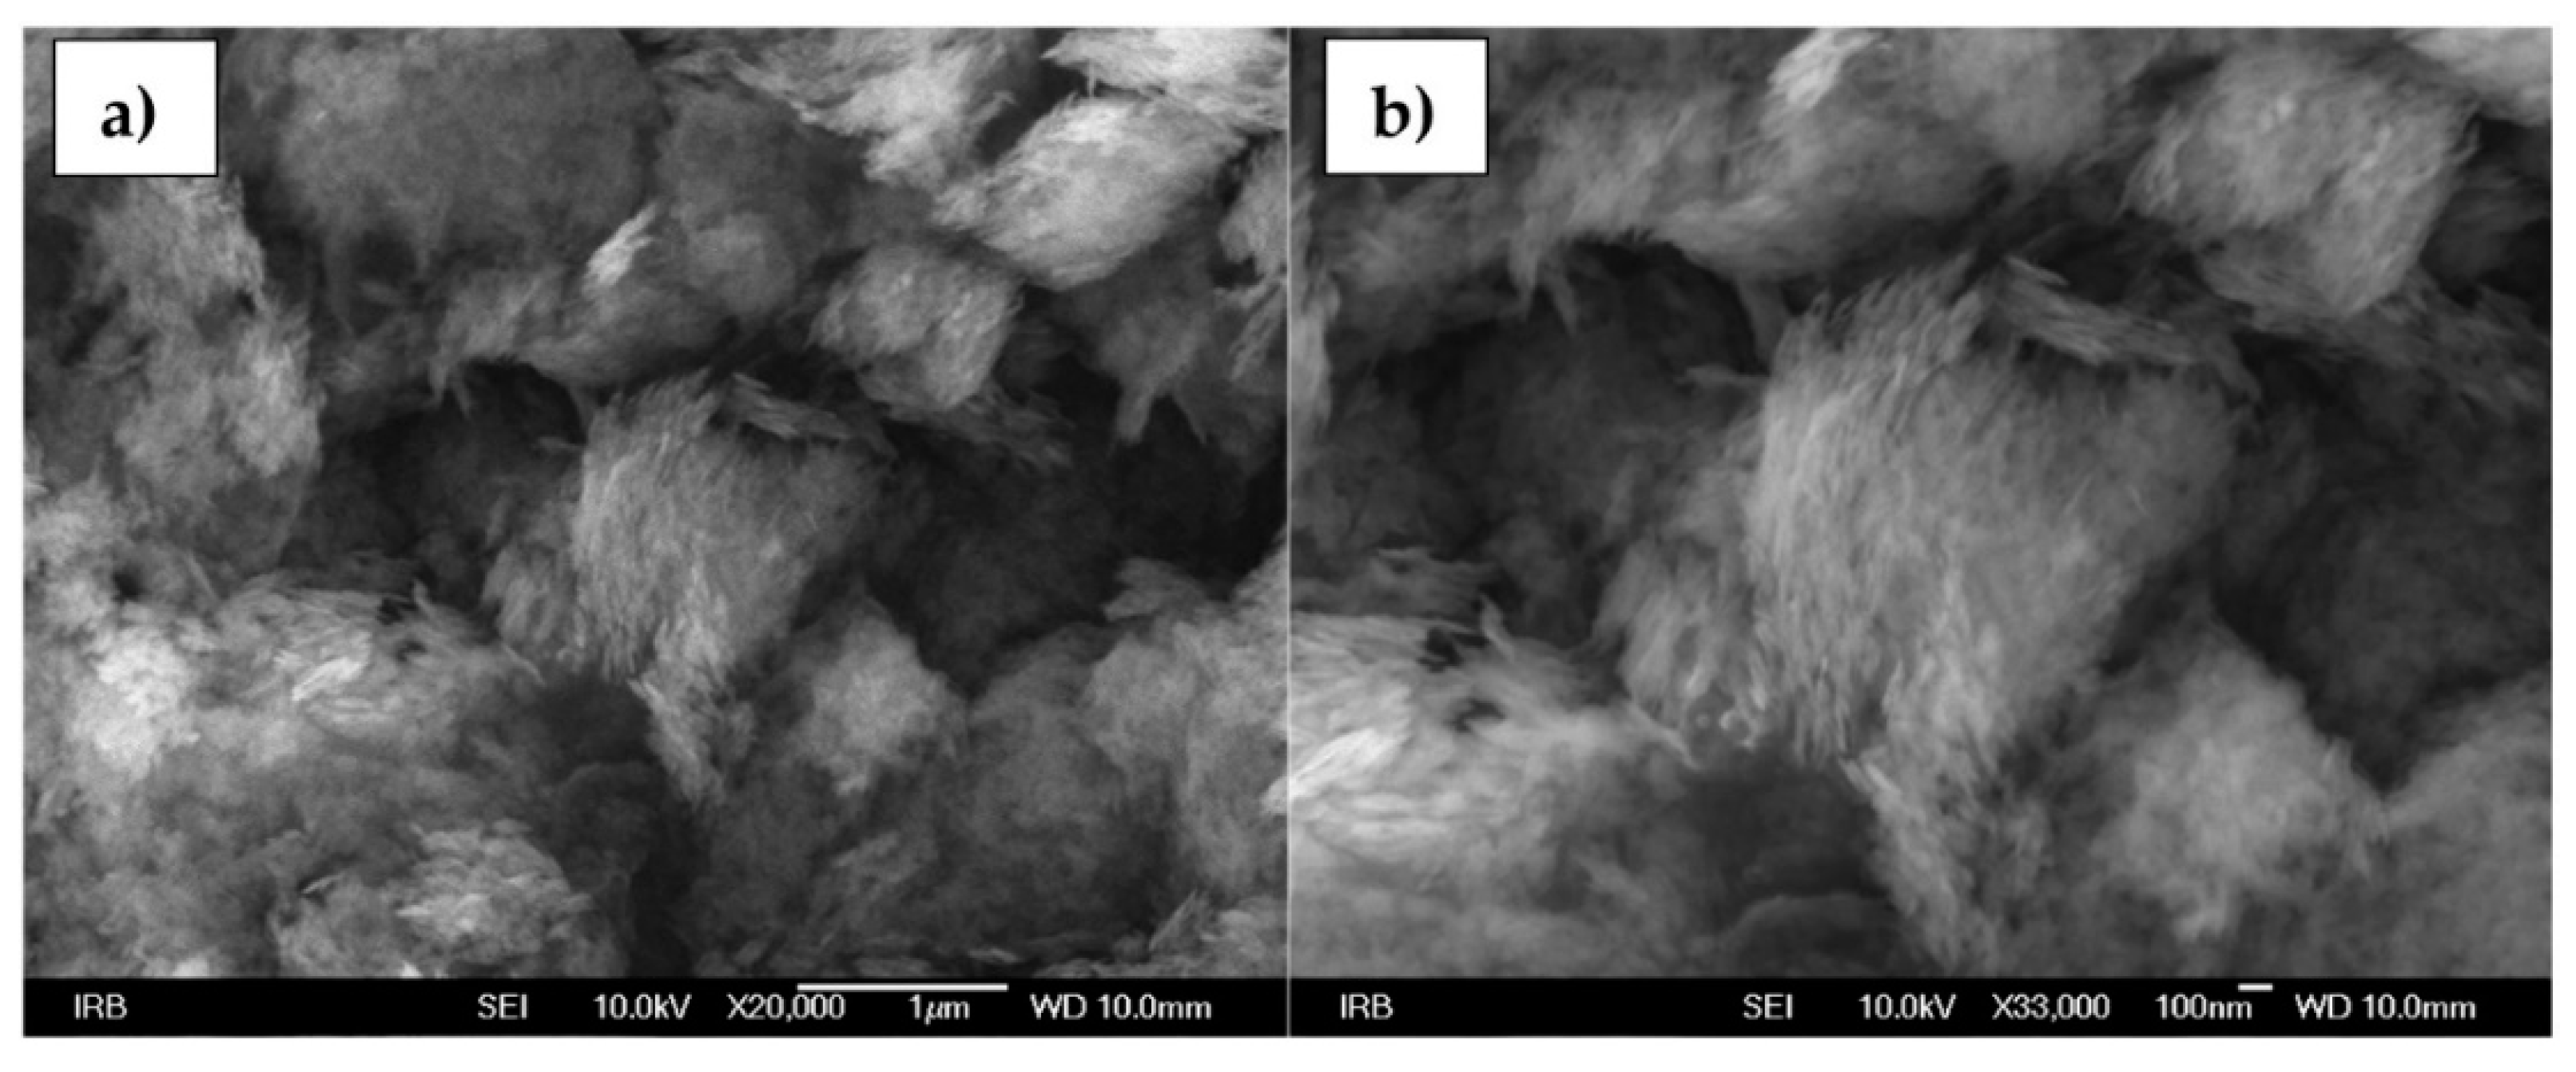
3.1. Bohemite NPs
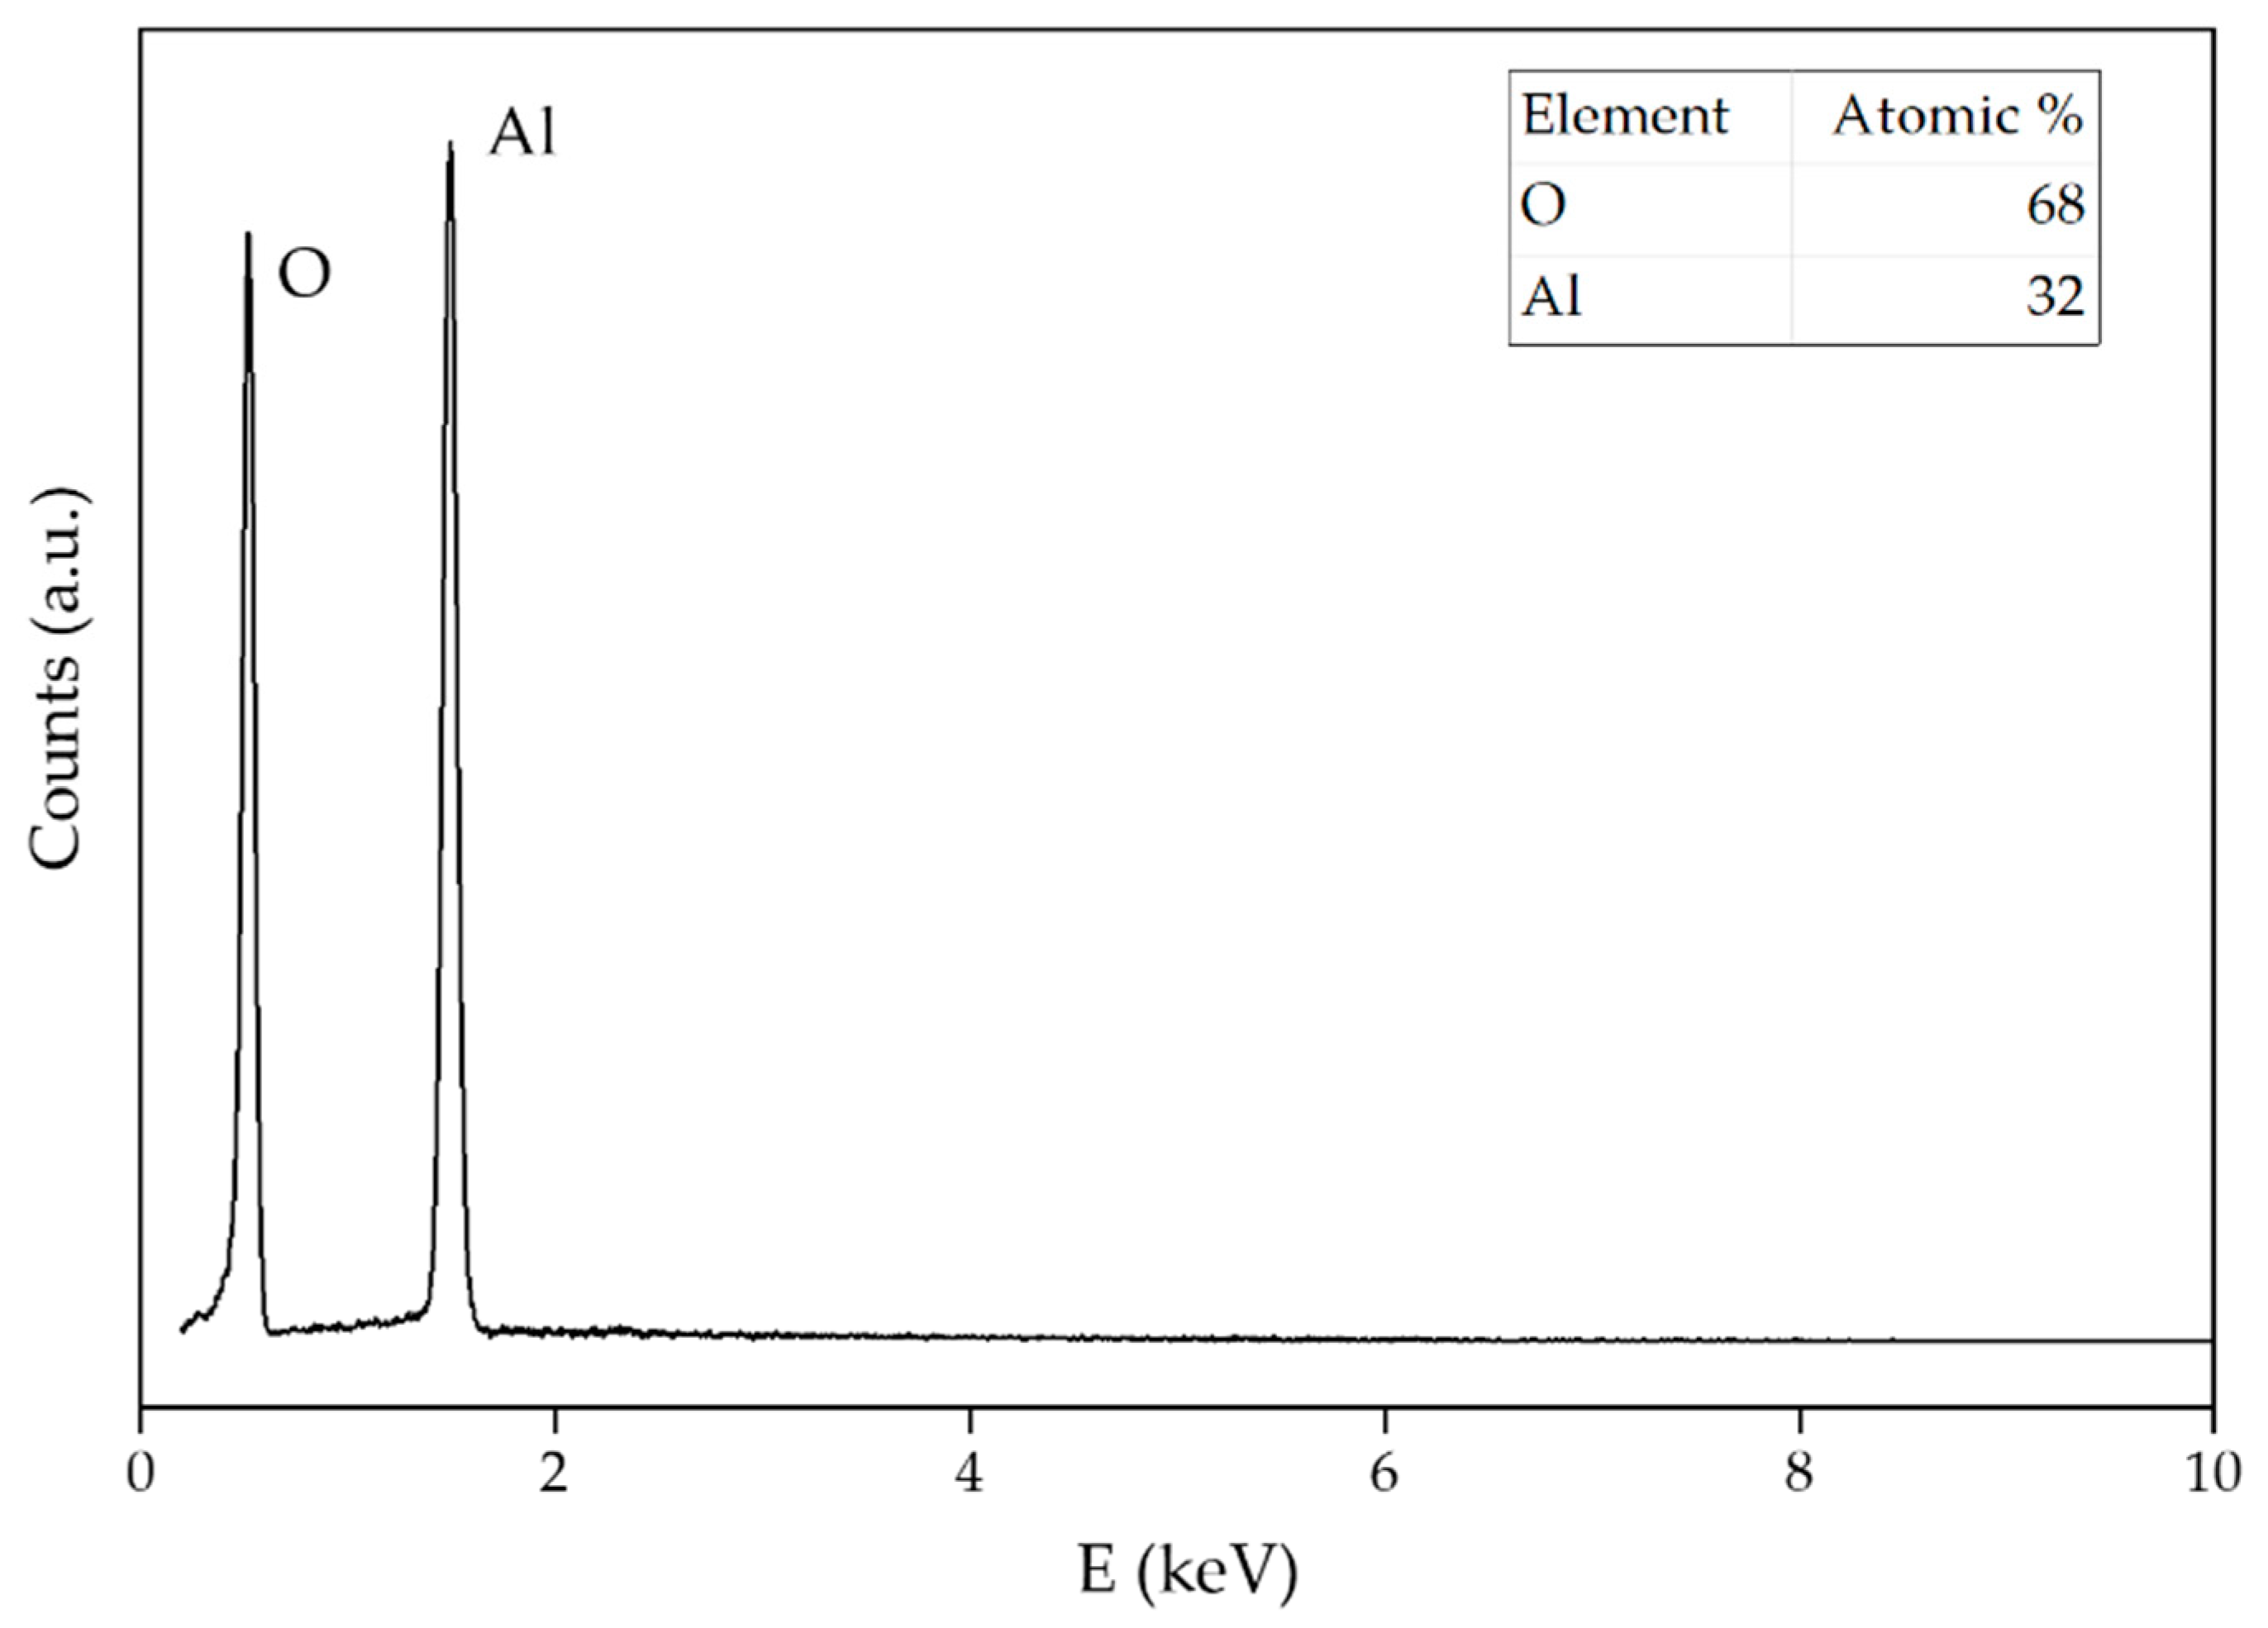
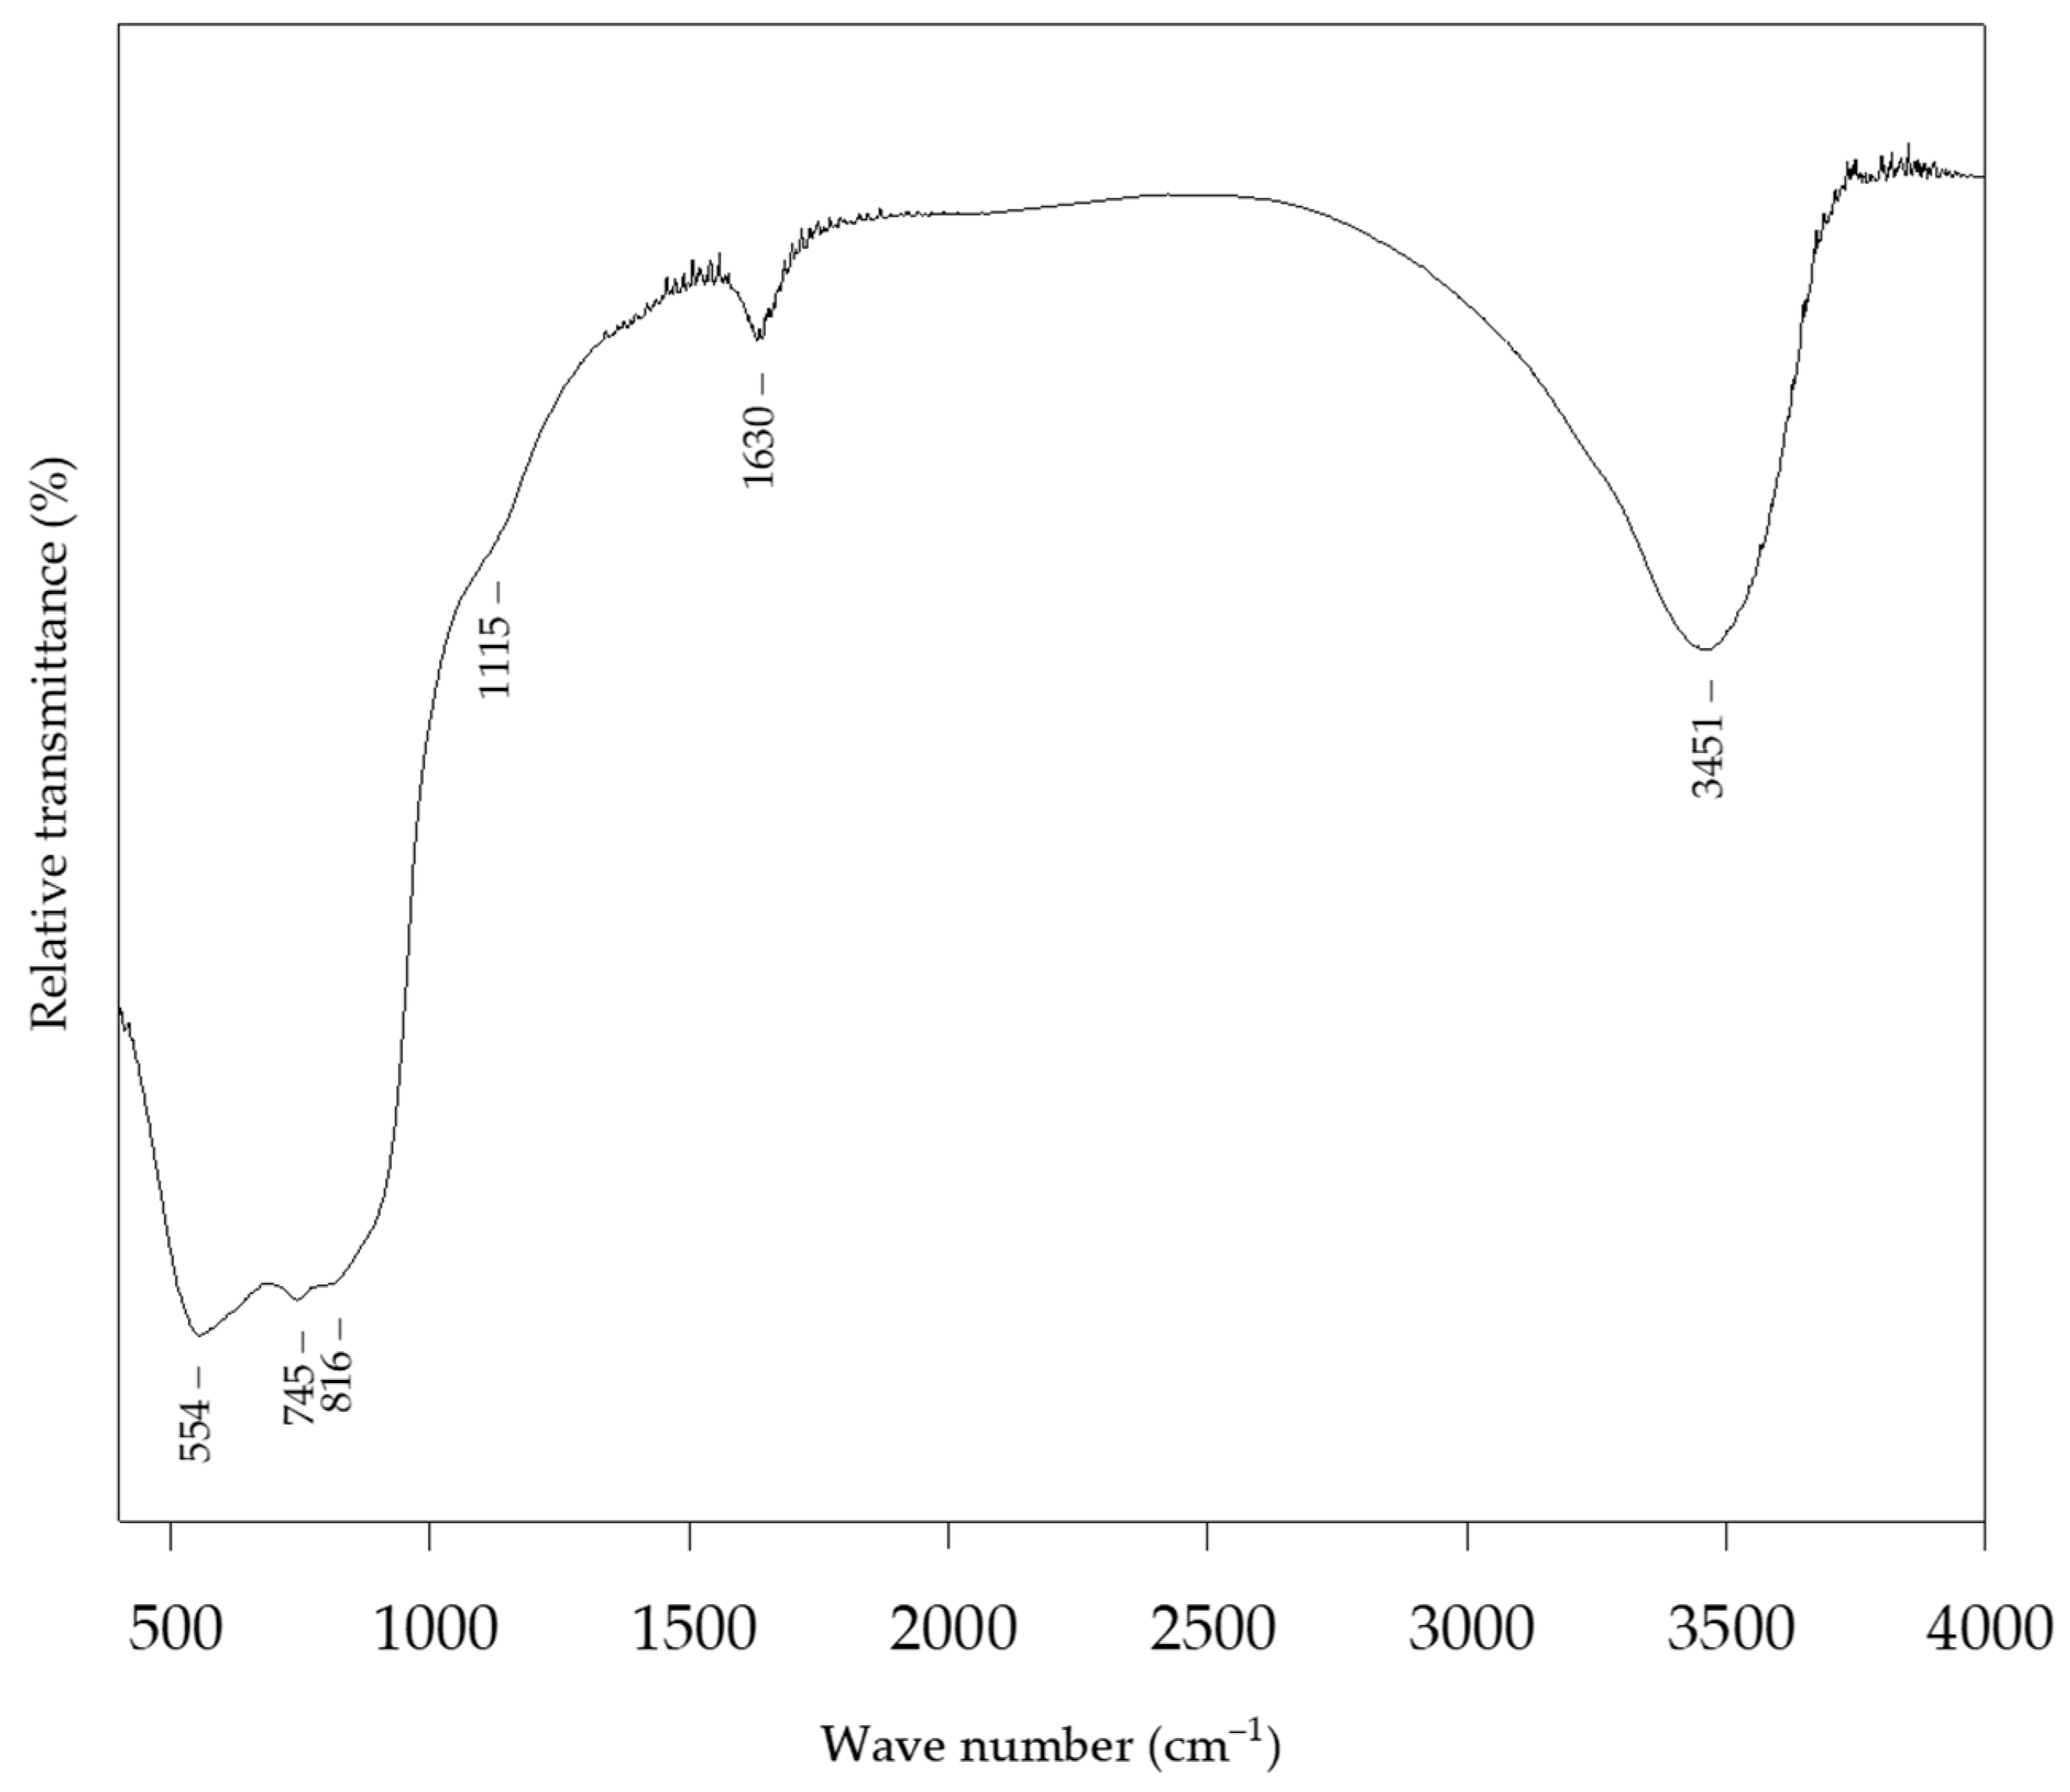
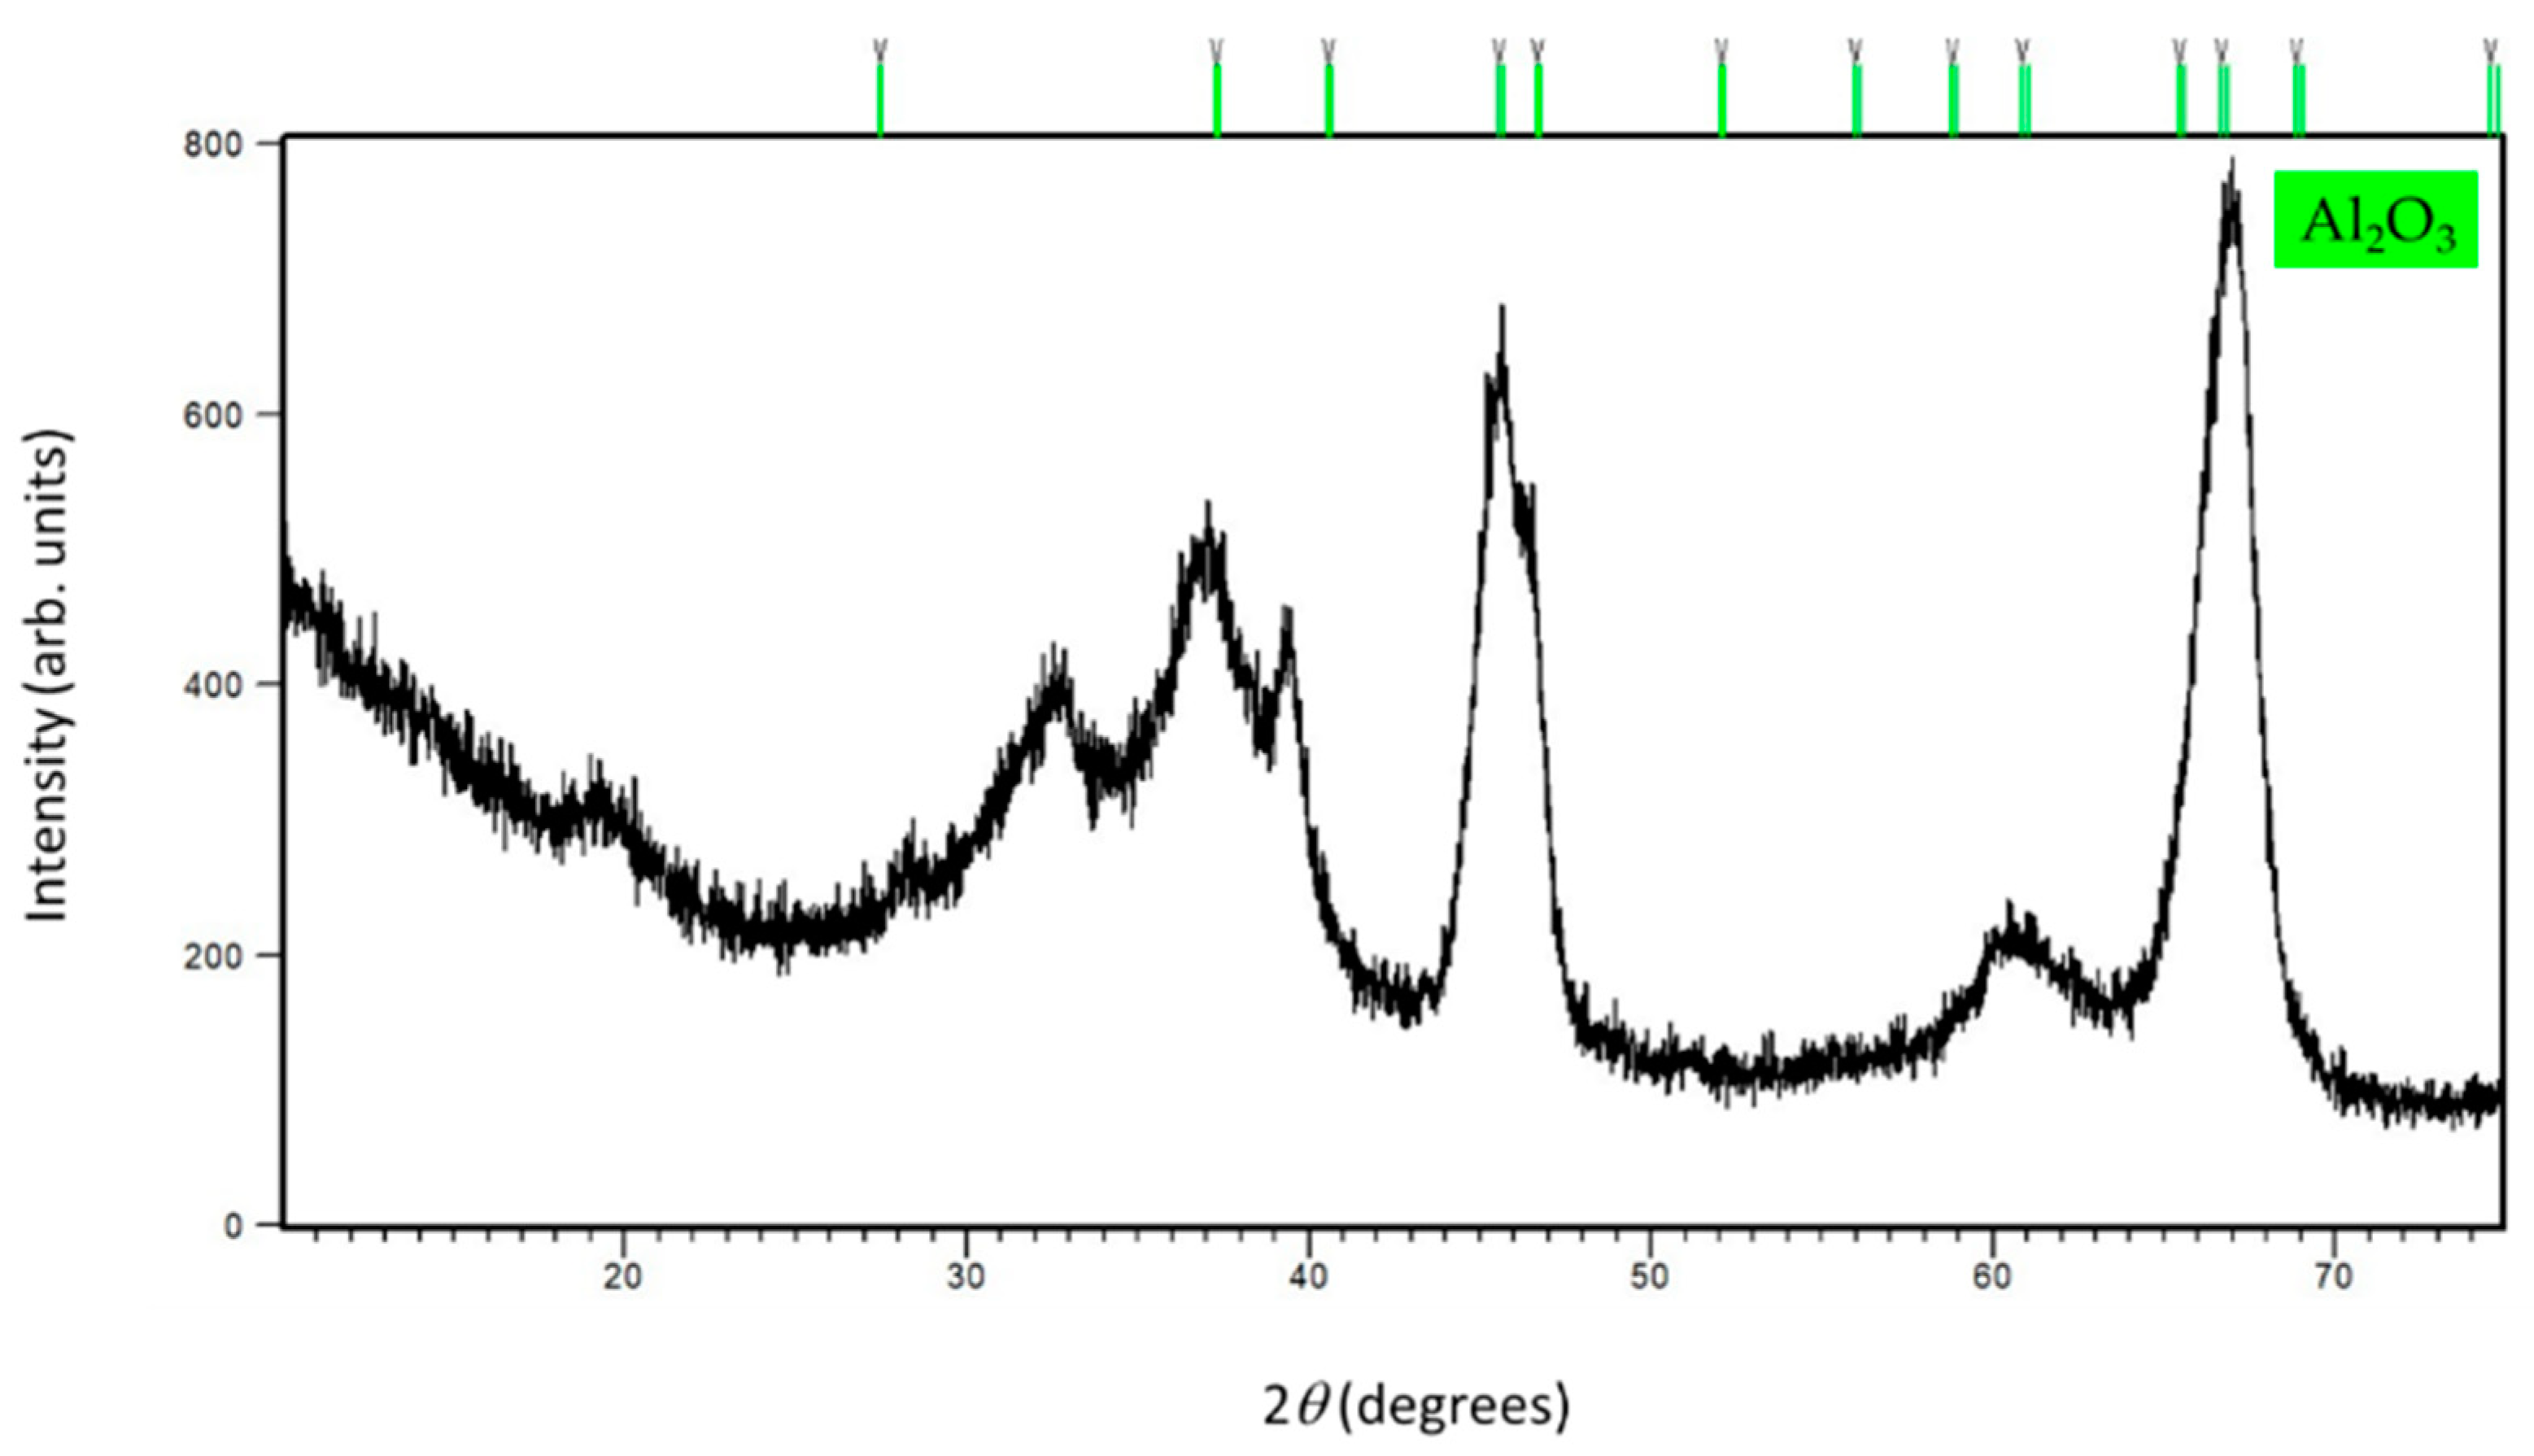
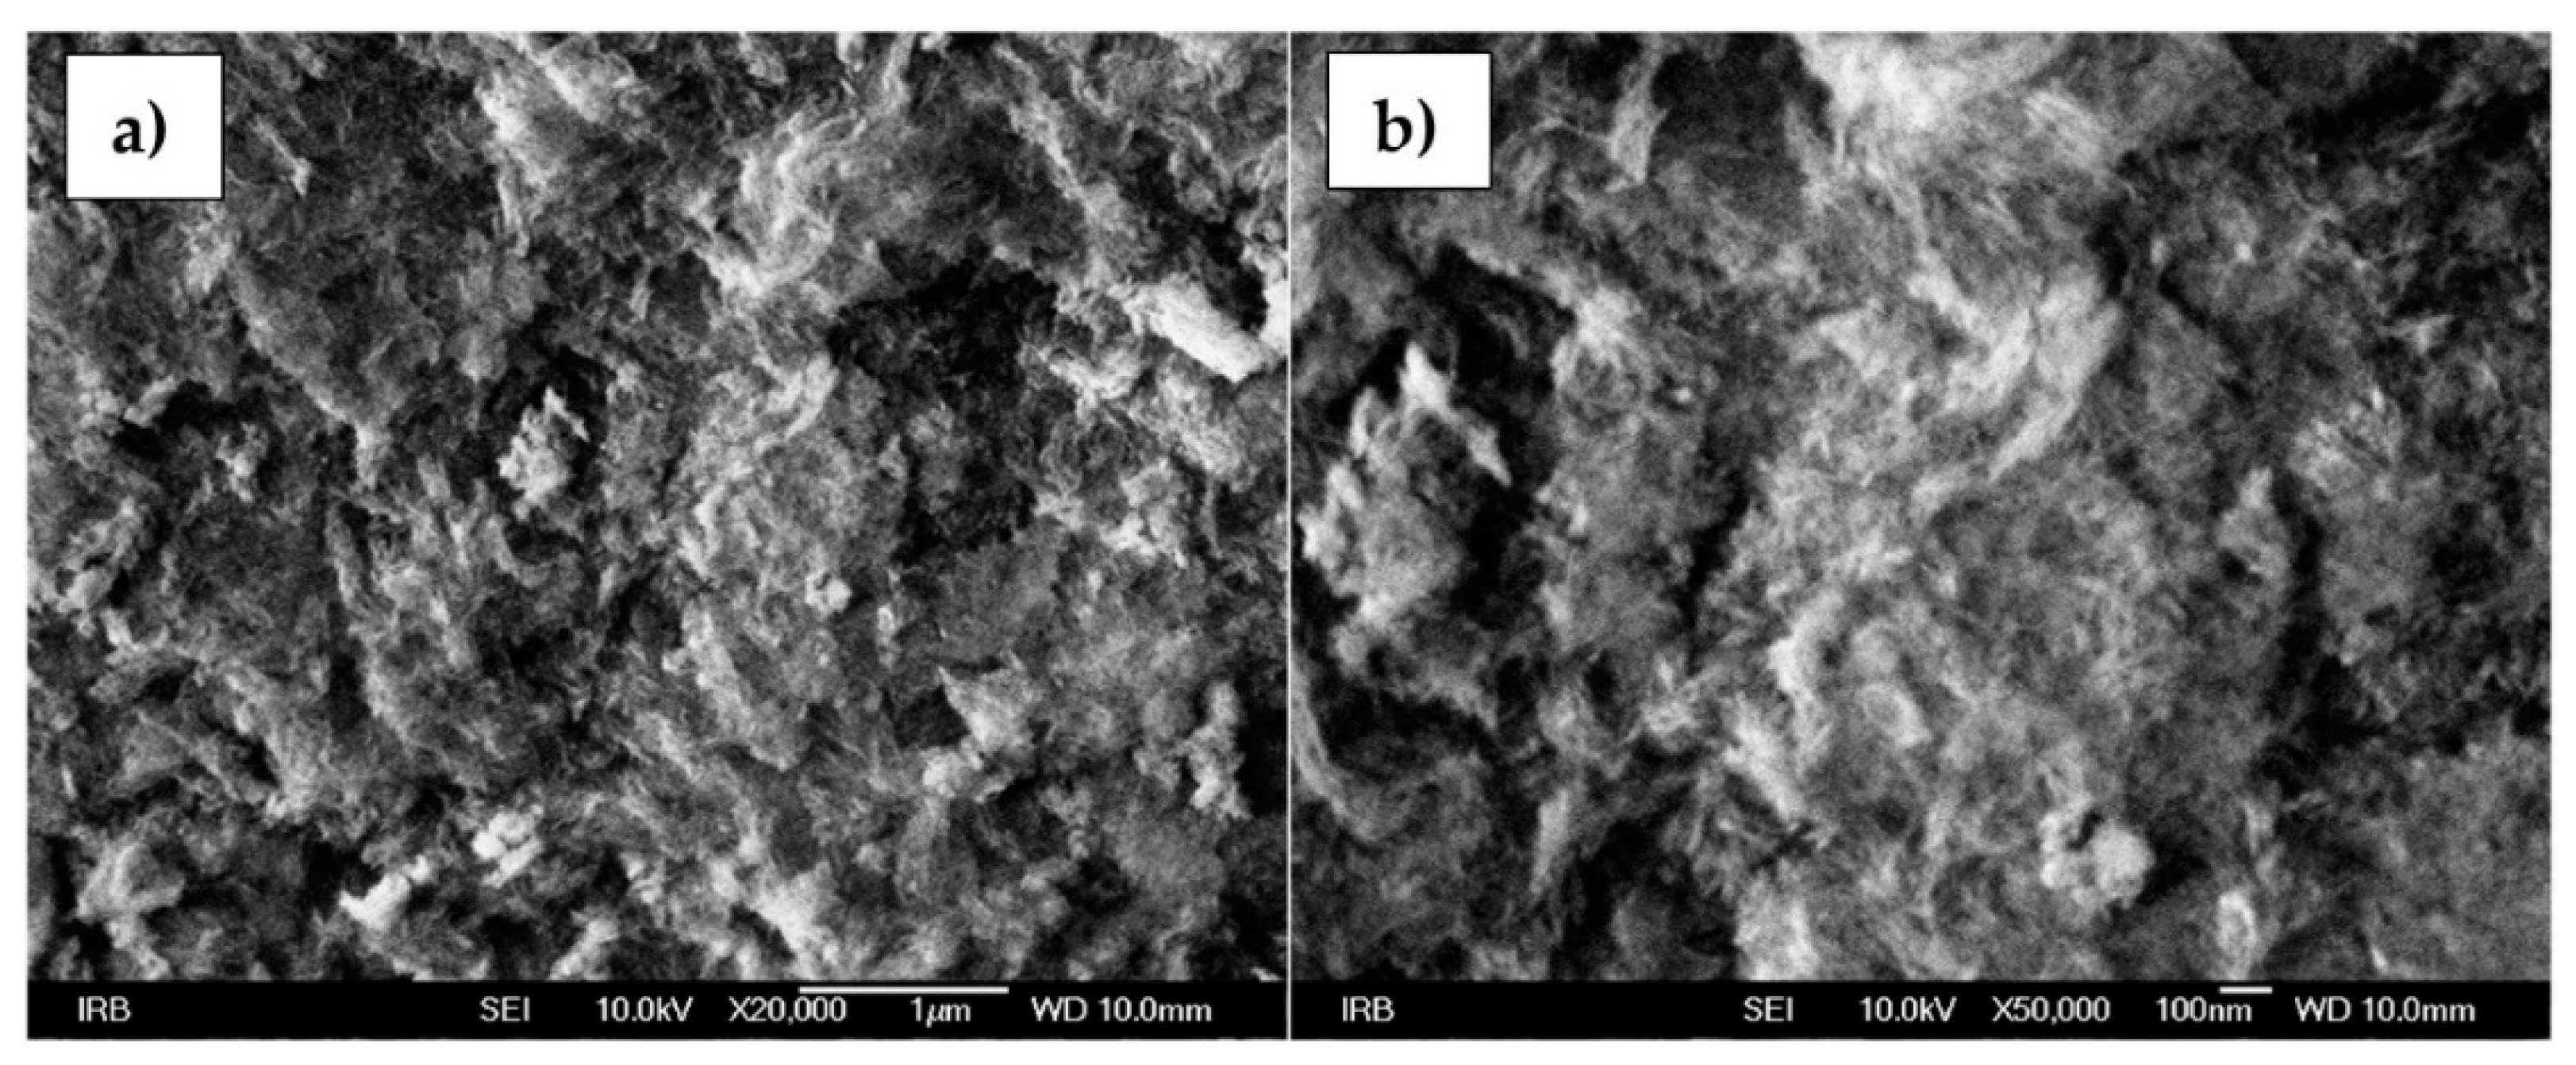
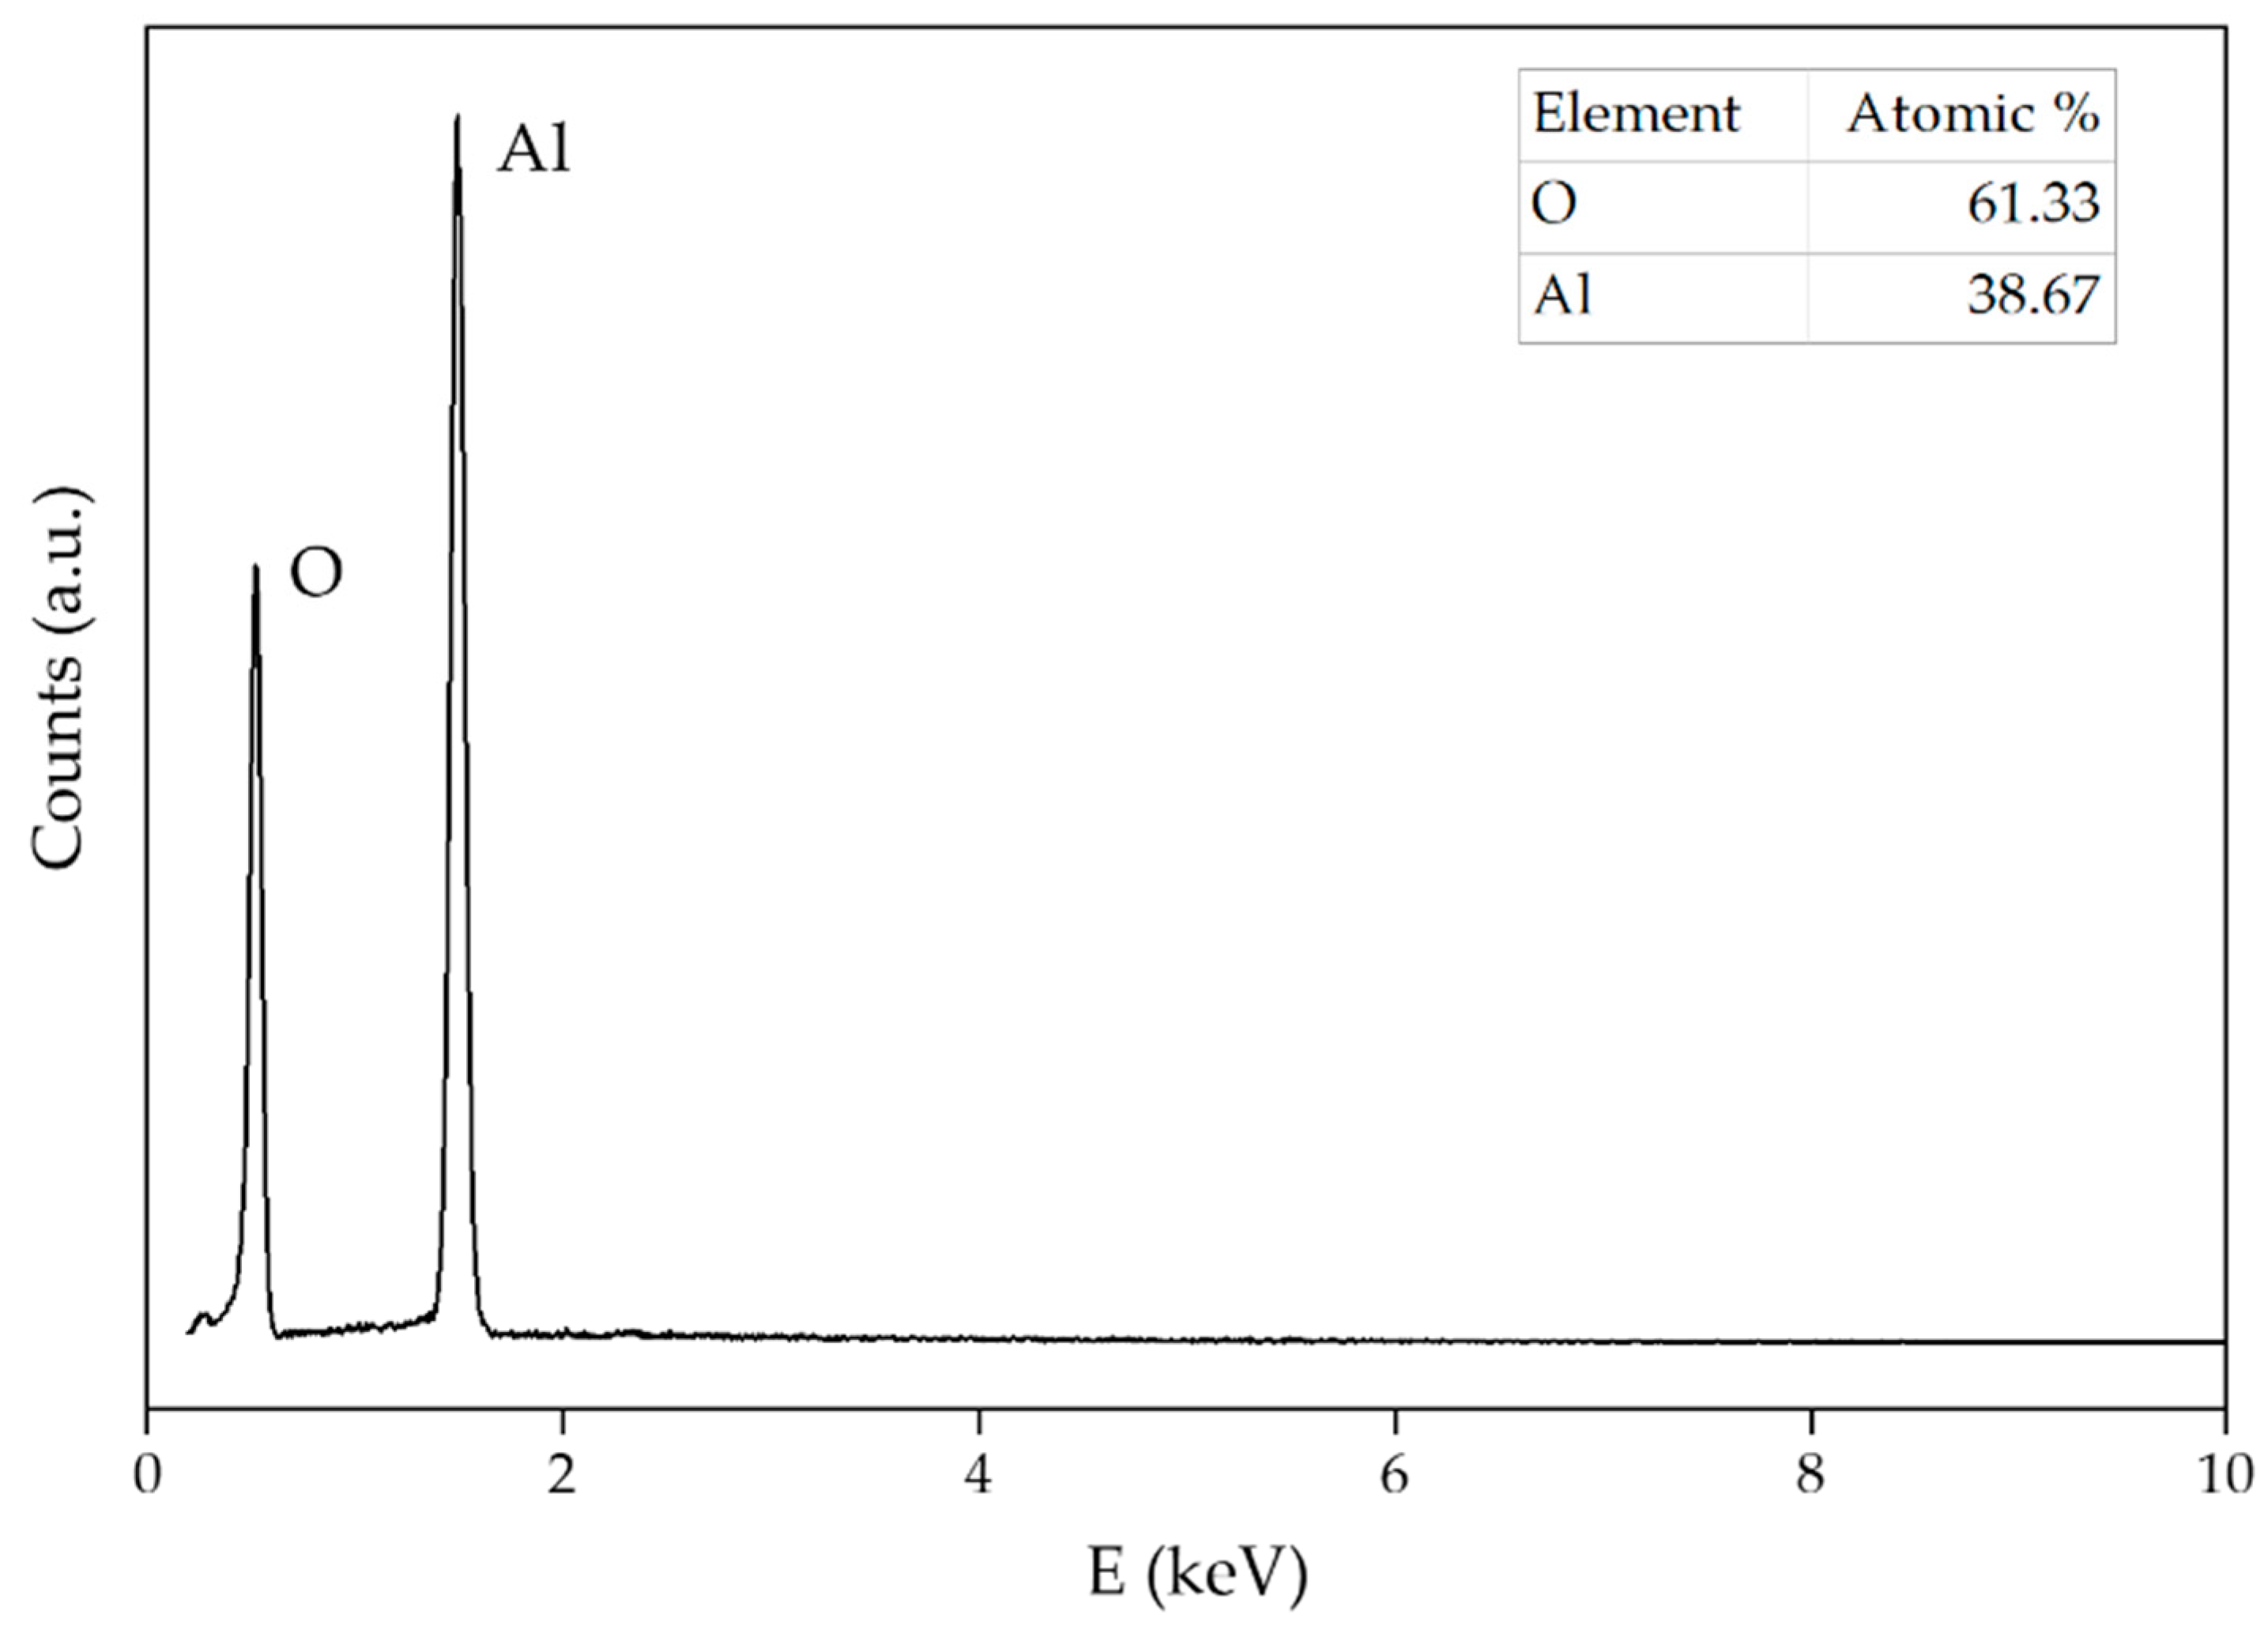
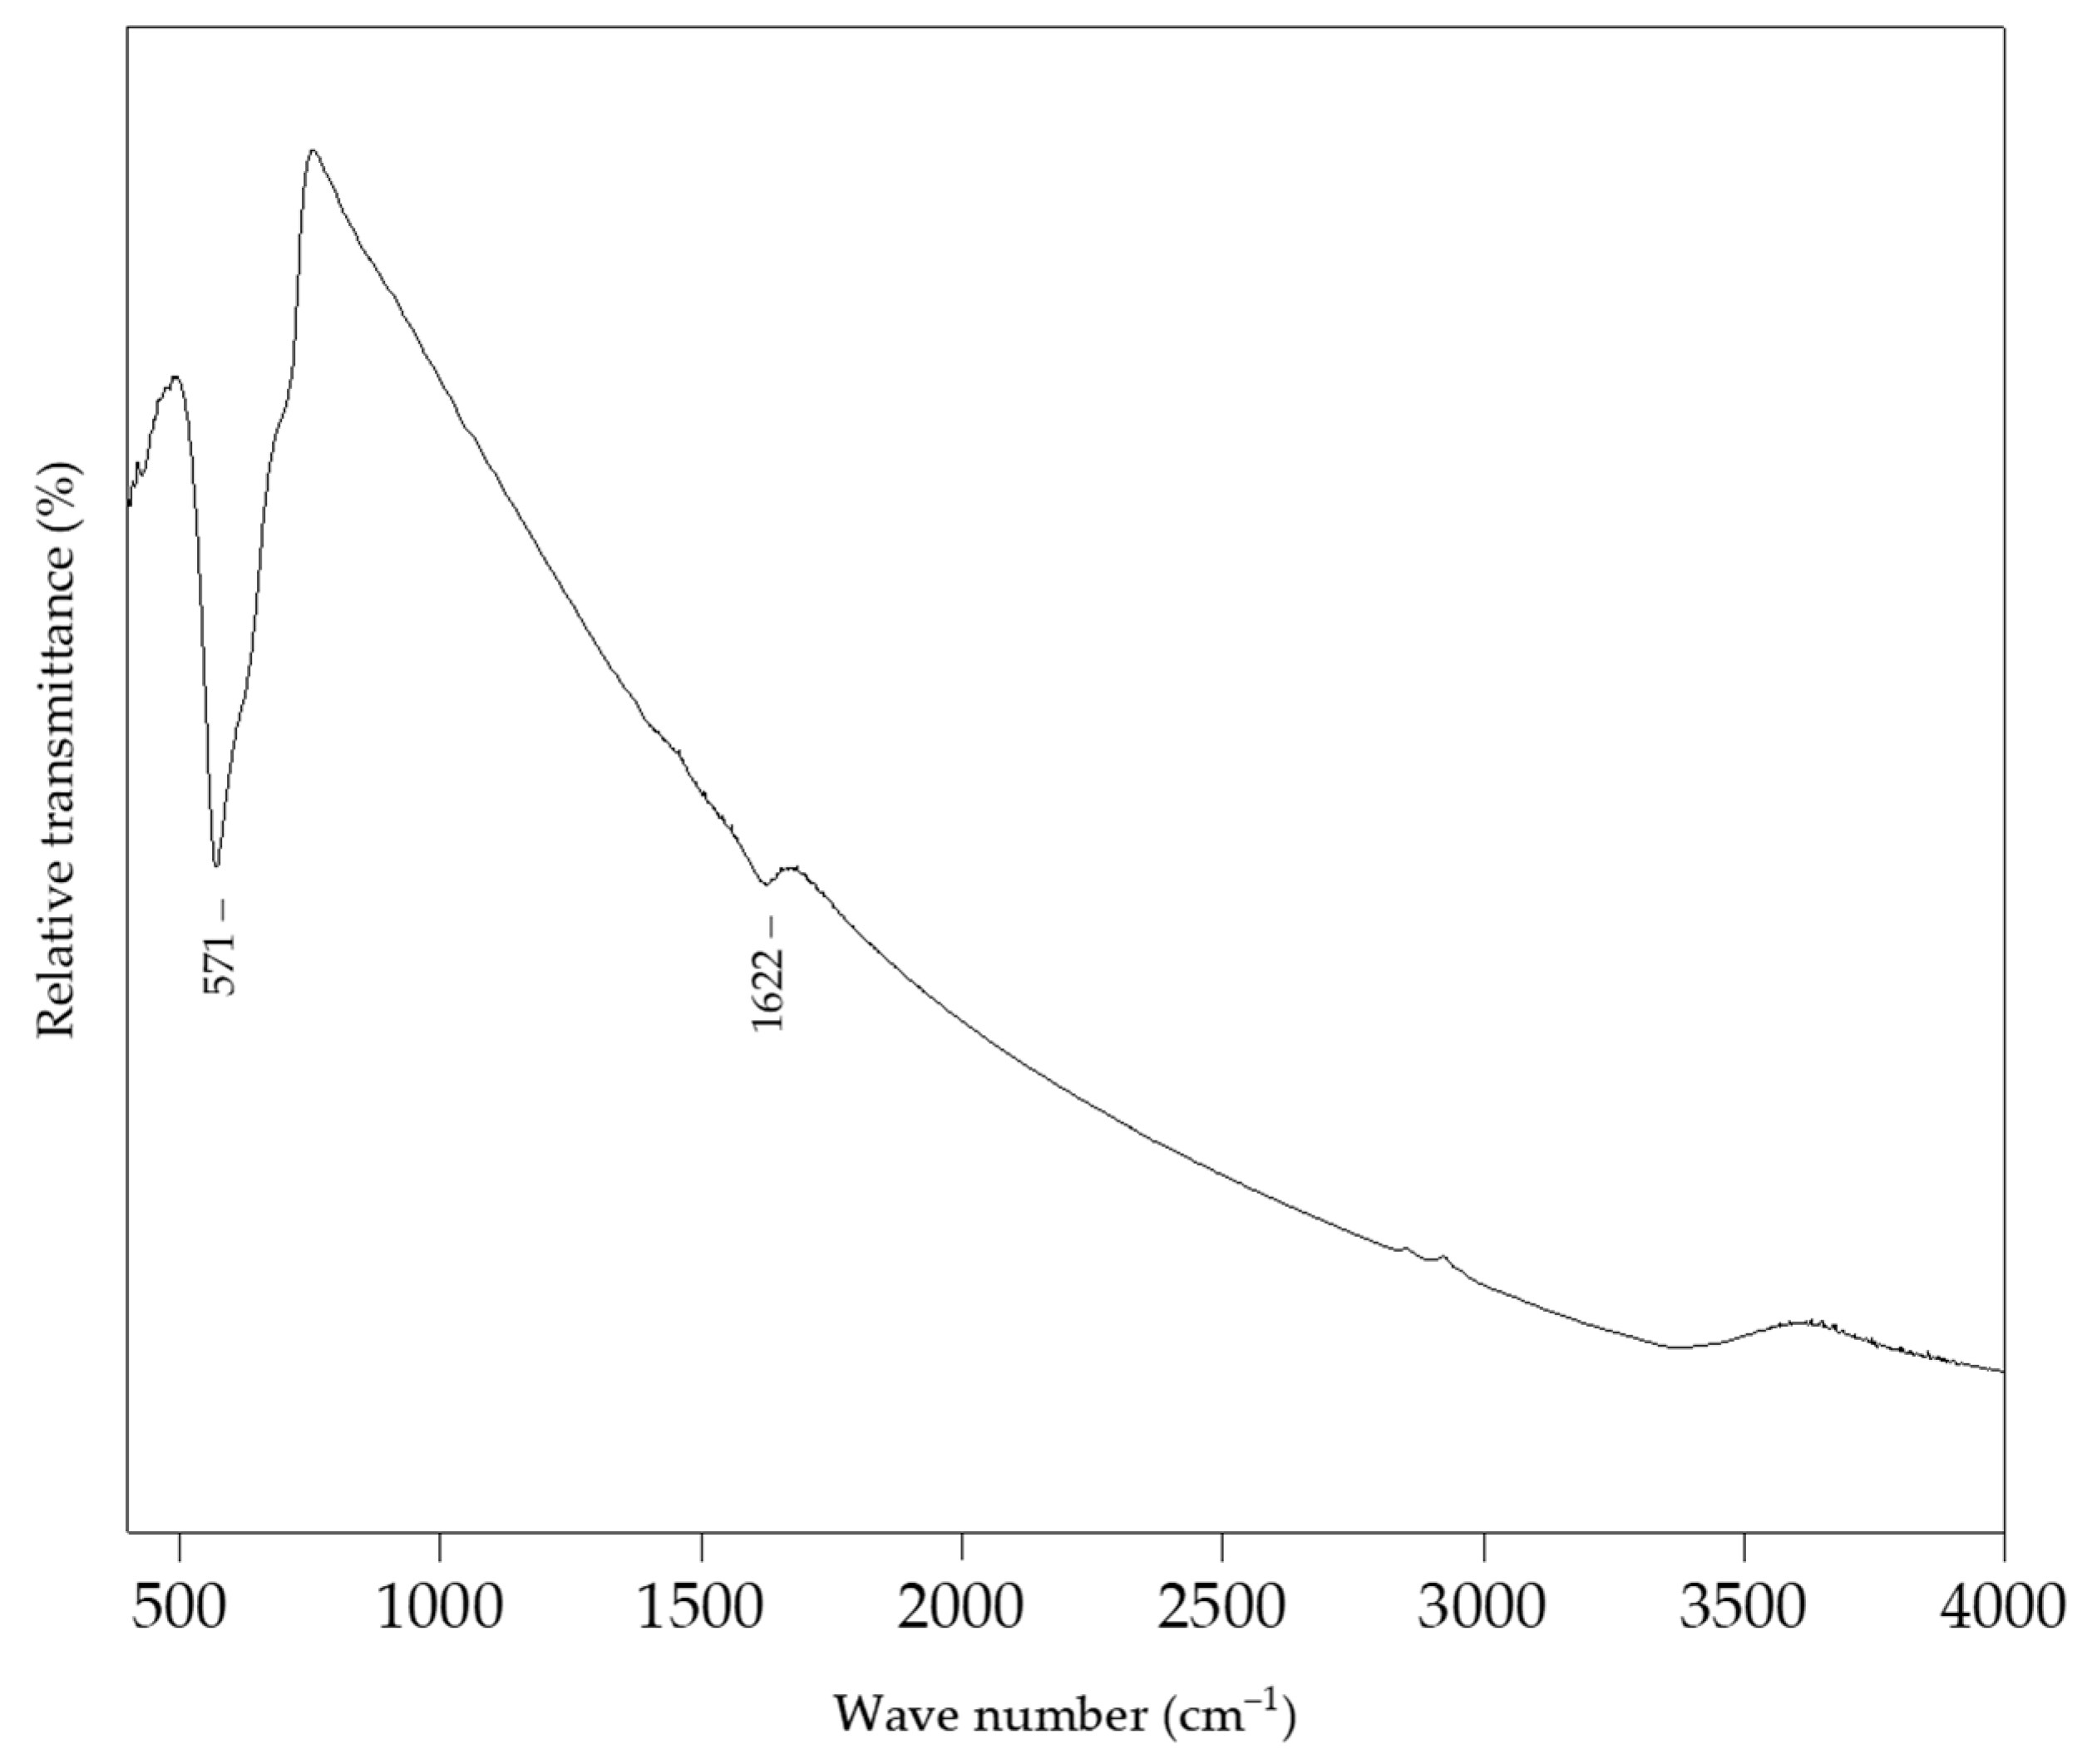
3.2. Alumina NPs.
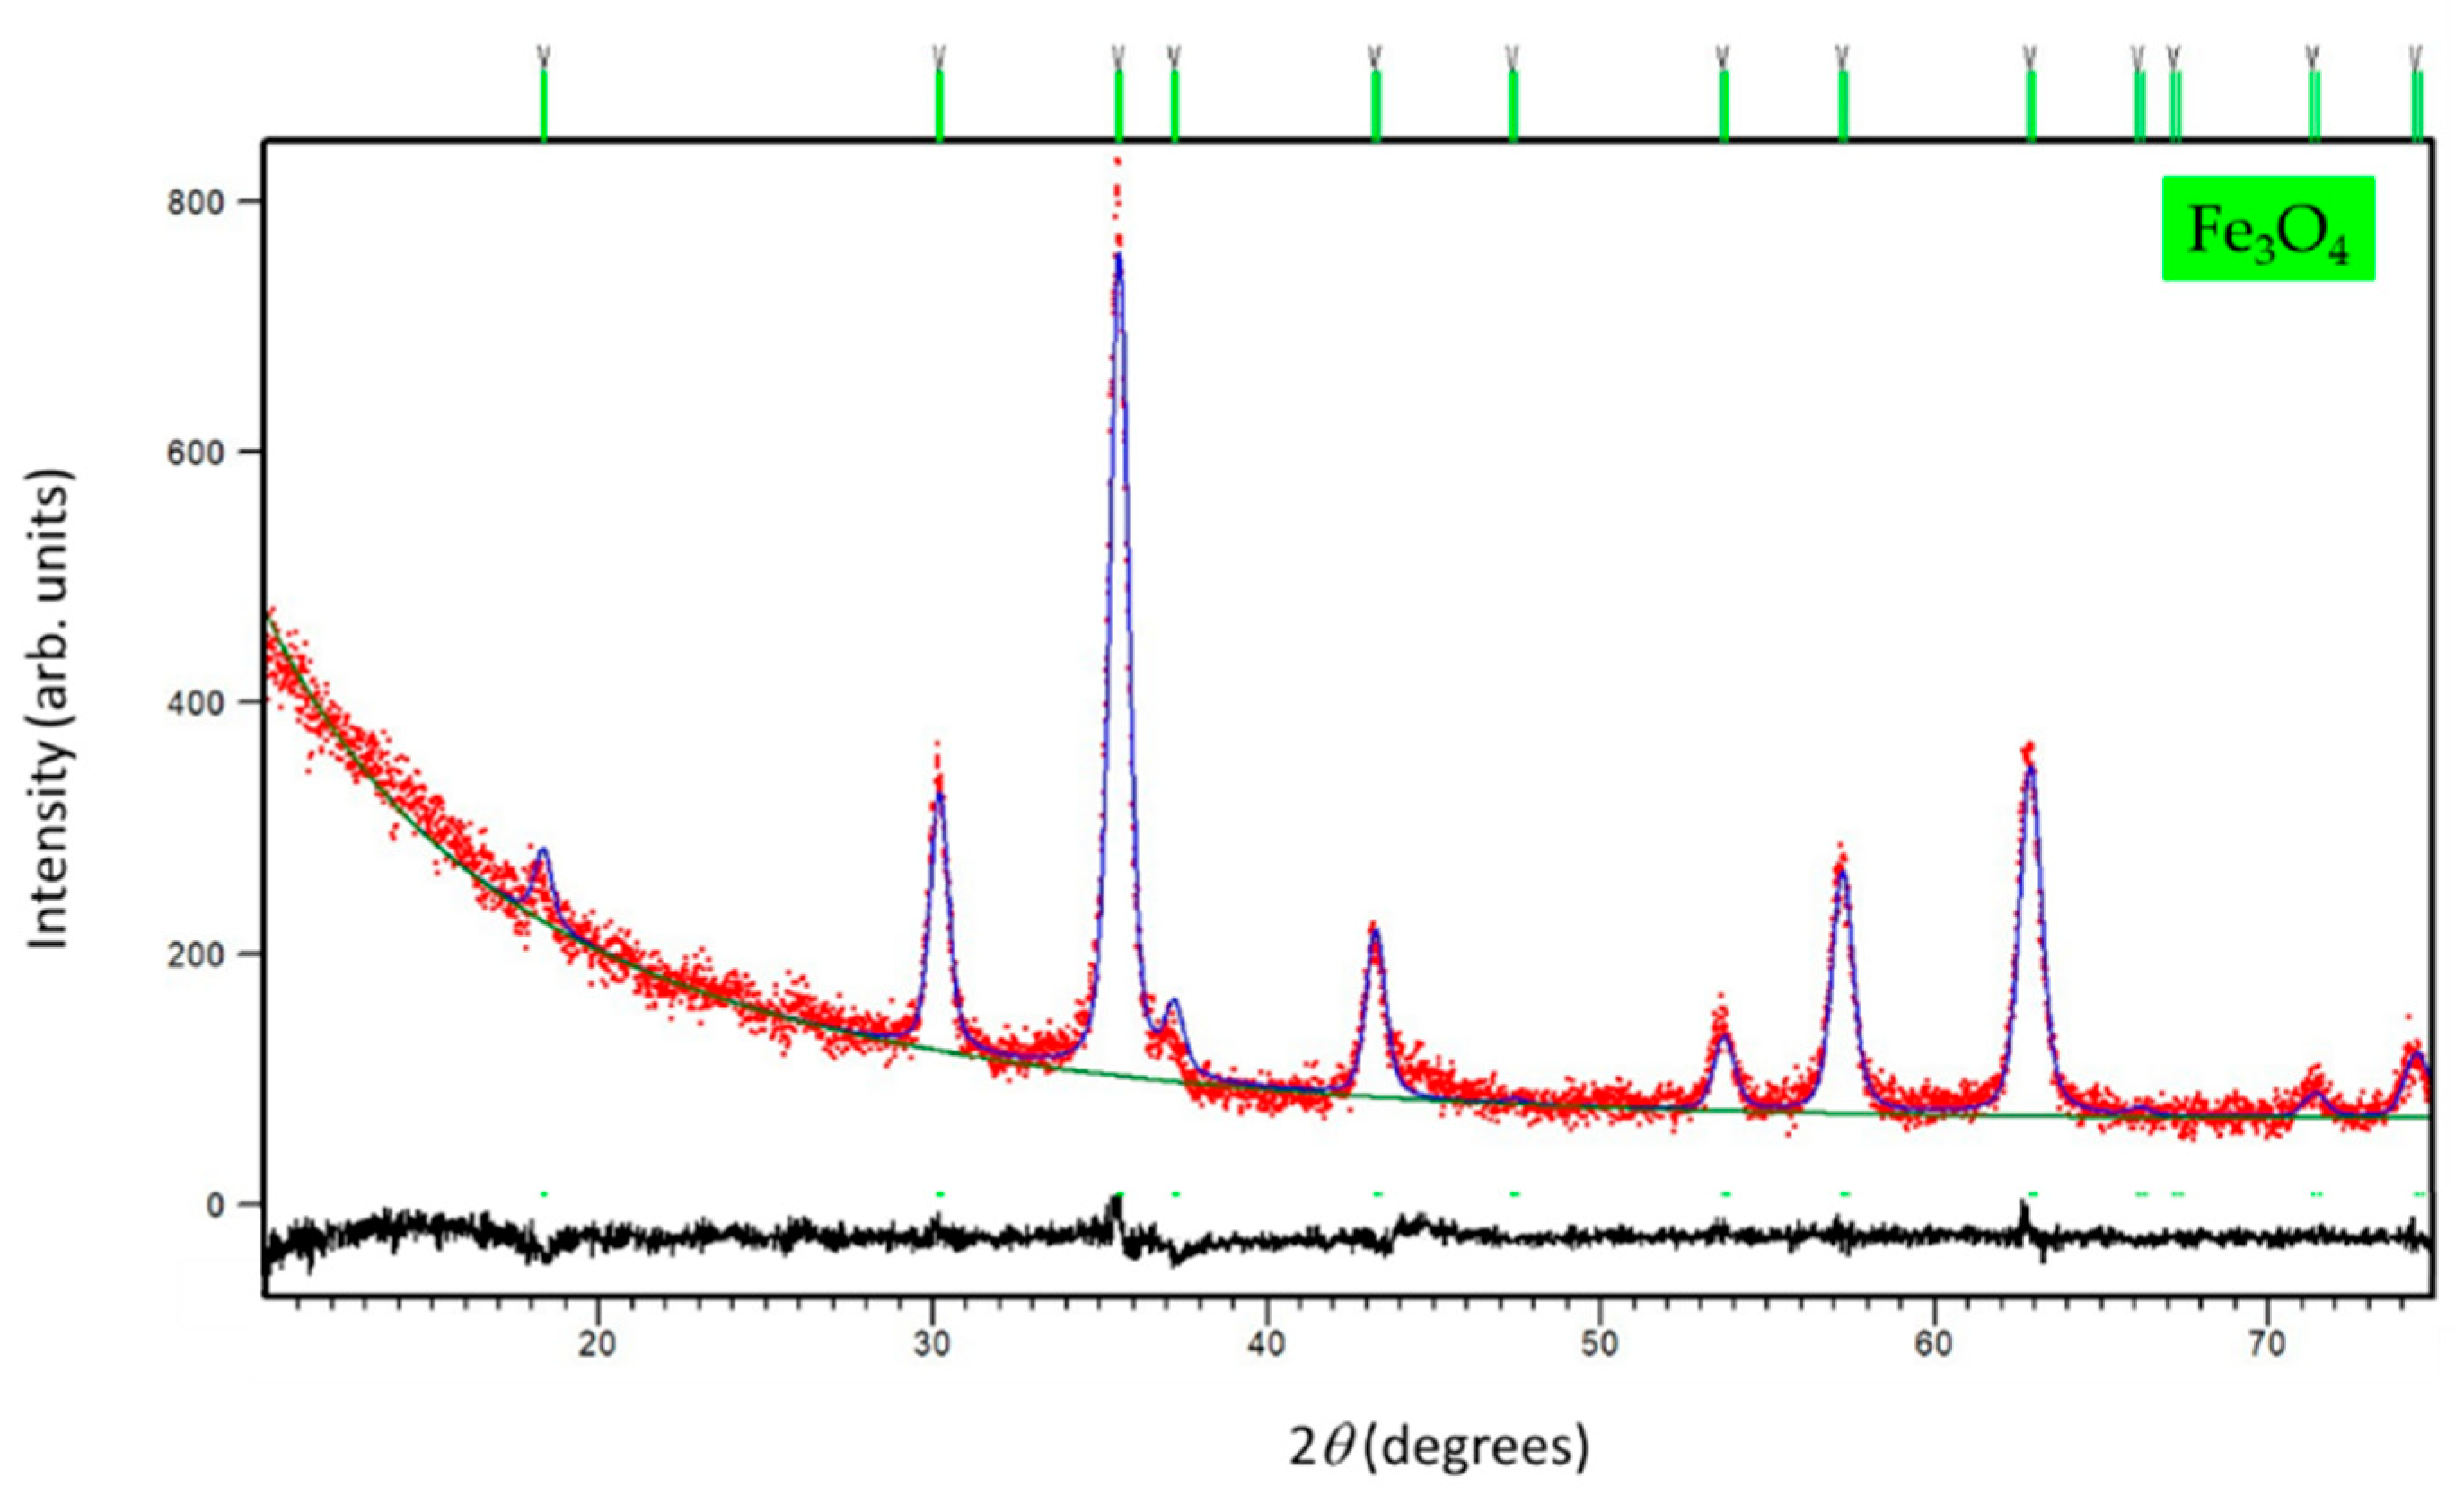
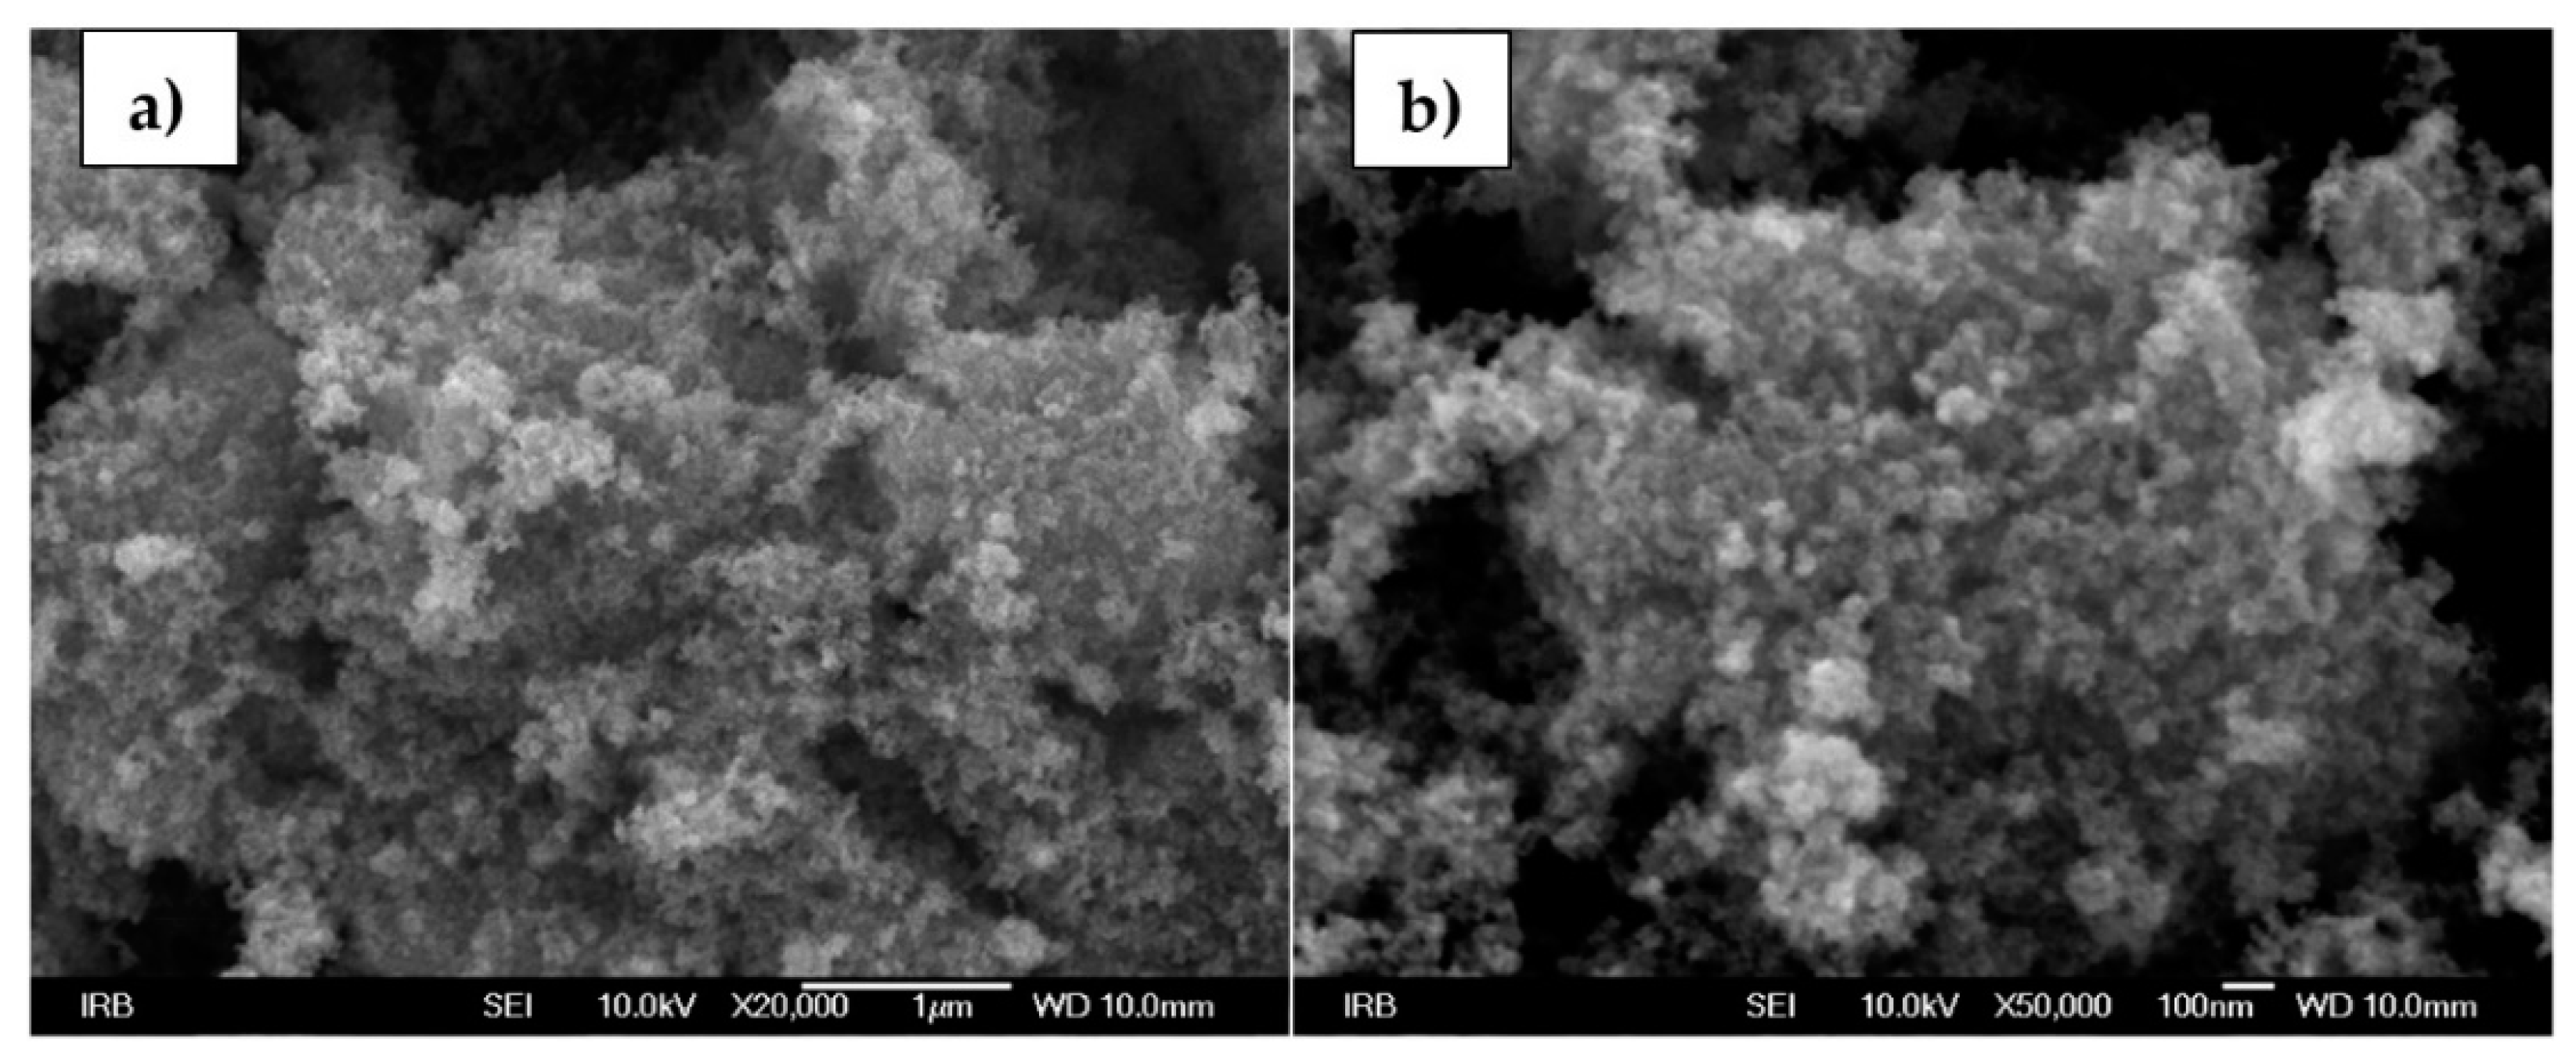
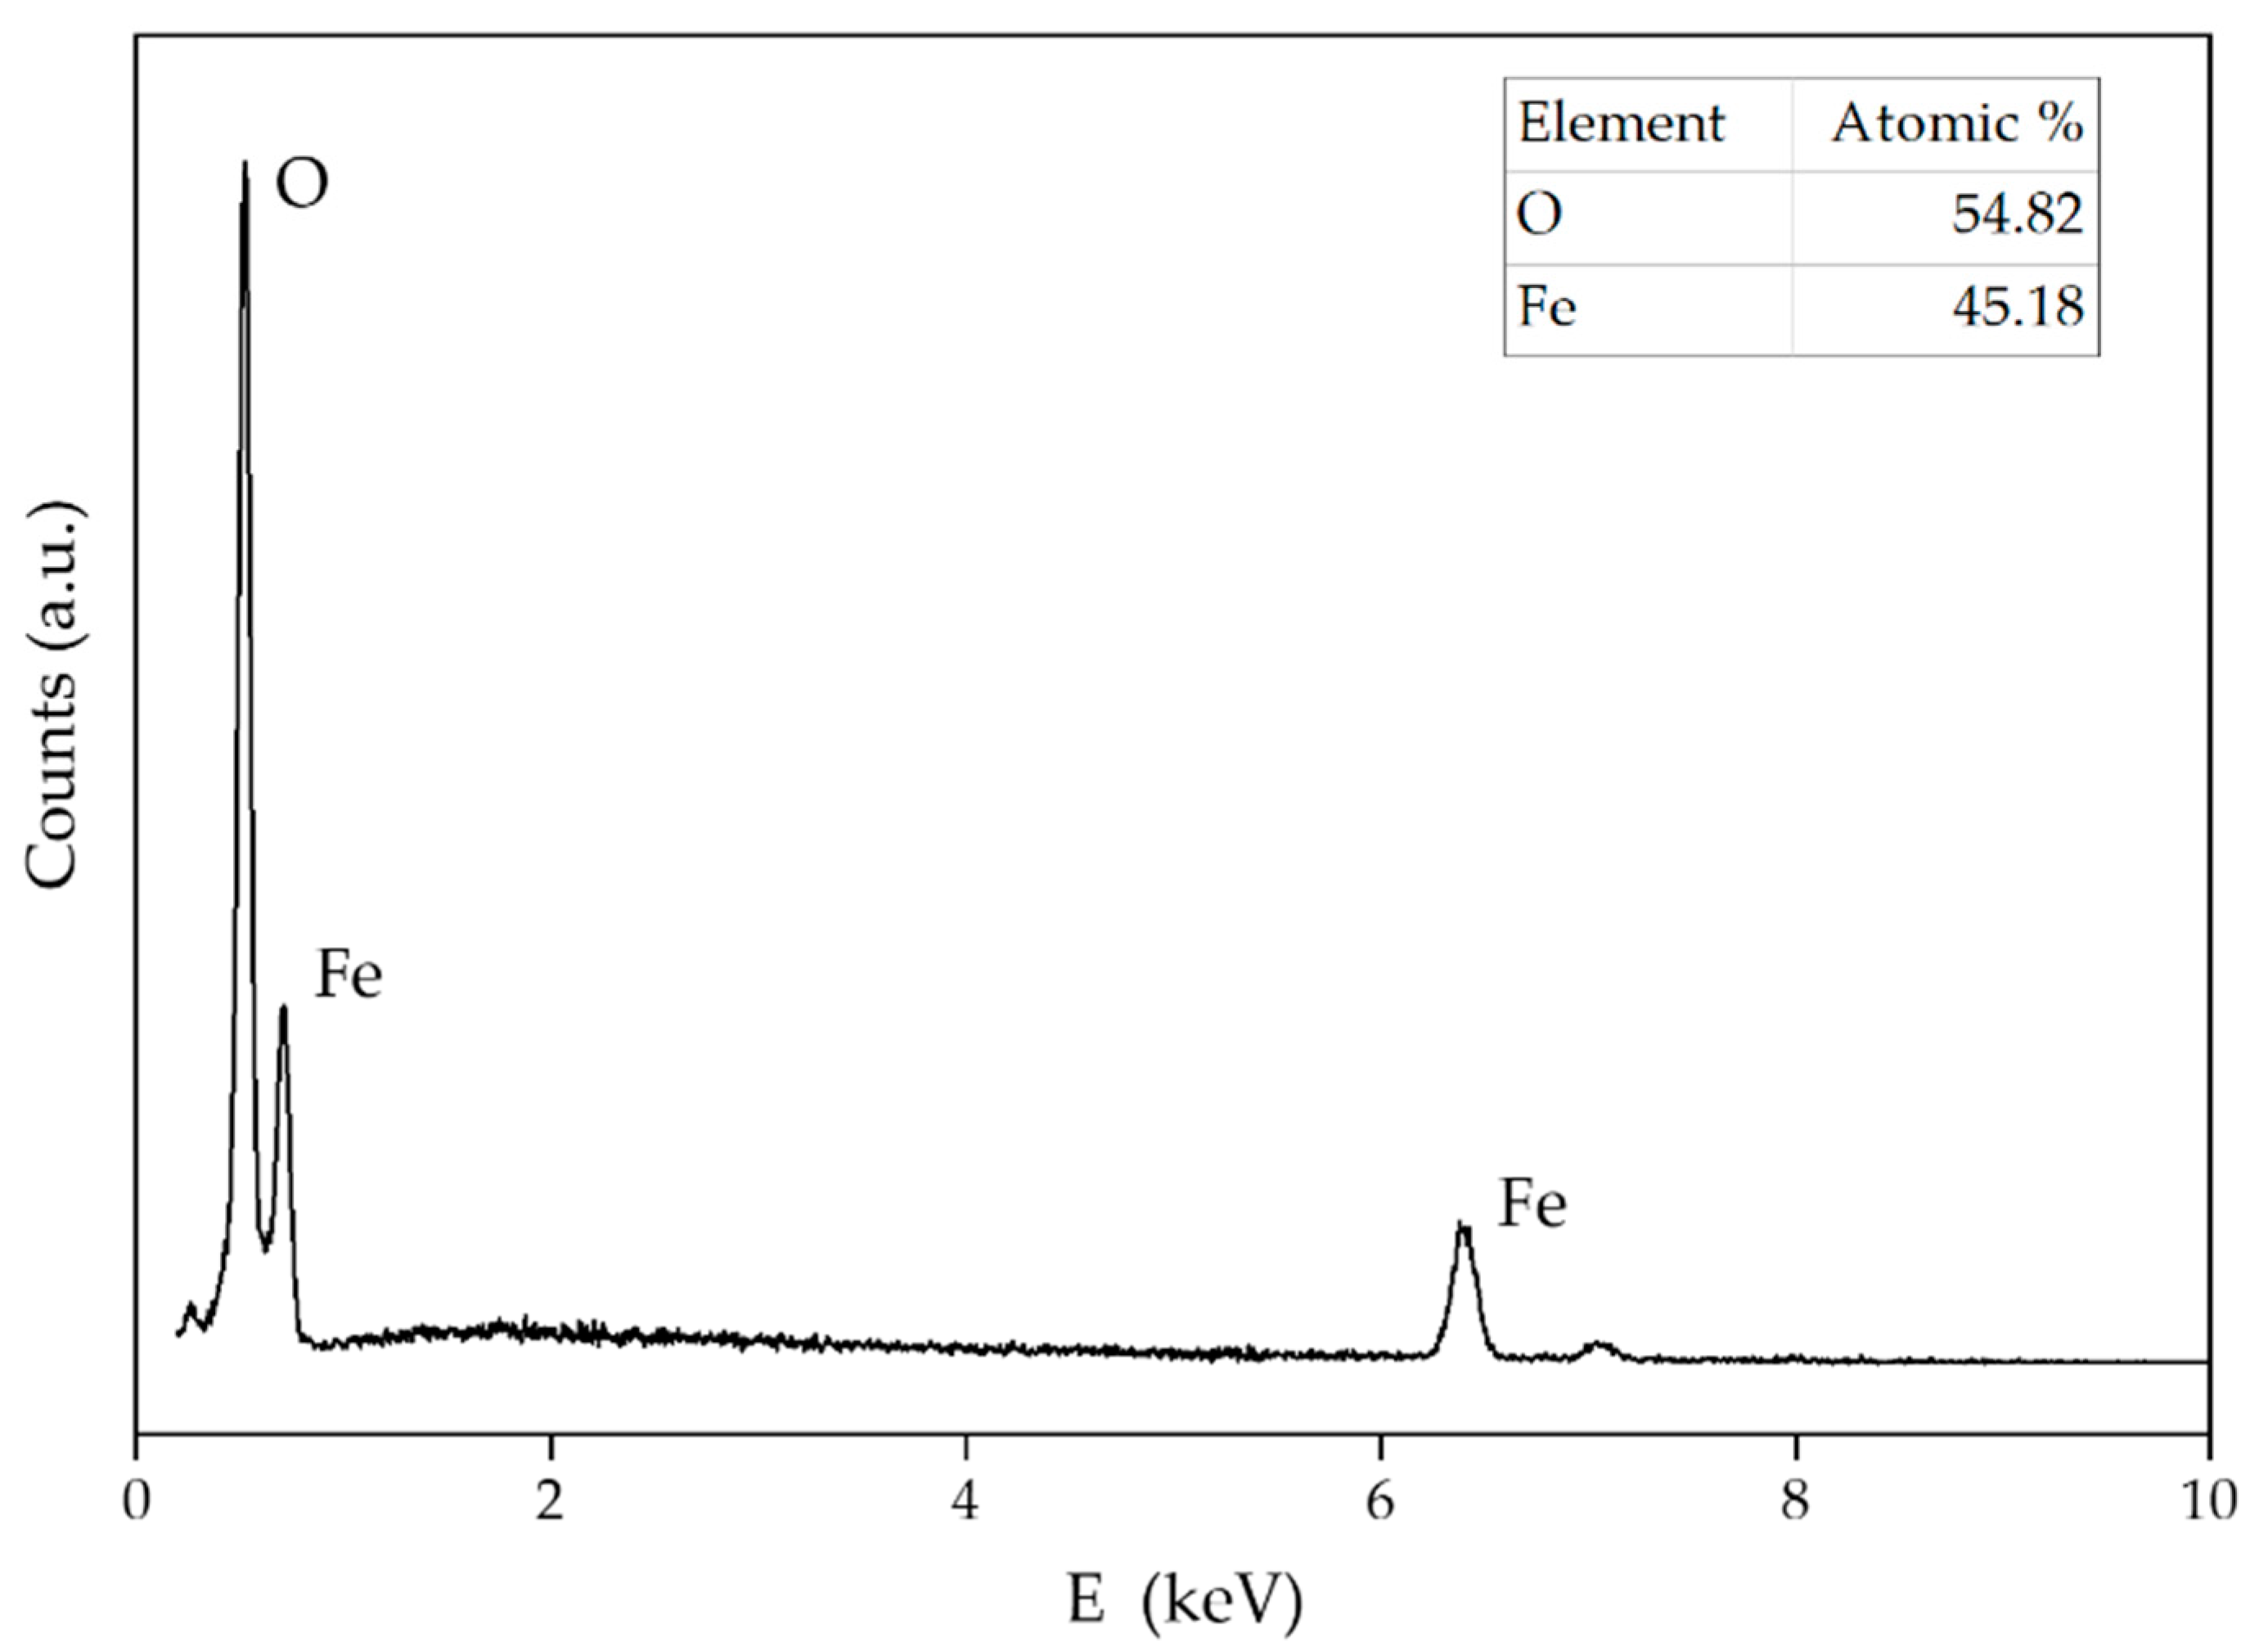
3.3. Magnetite NPs
3.4. Membranes with Alumina, Boehmite, Magnetite and Hematite NPs
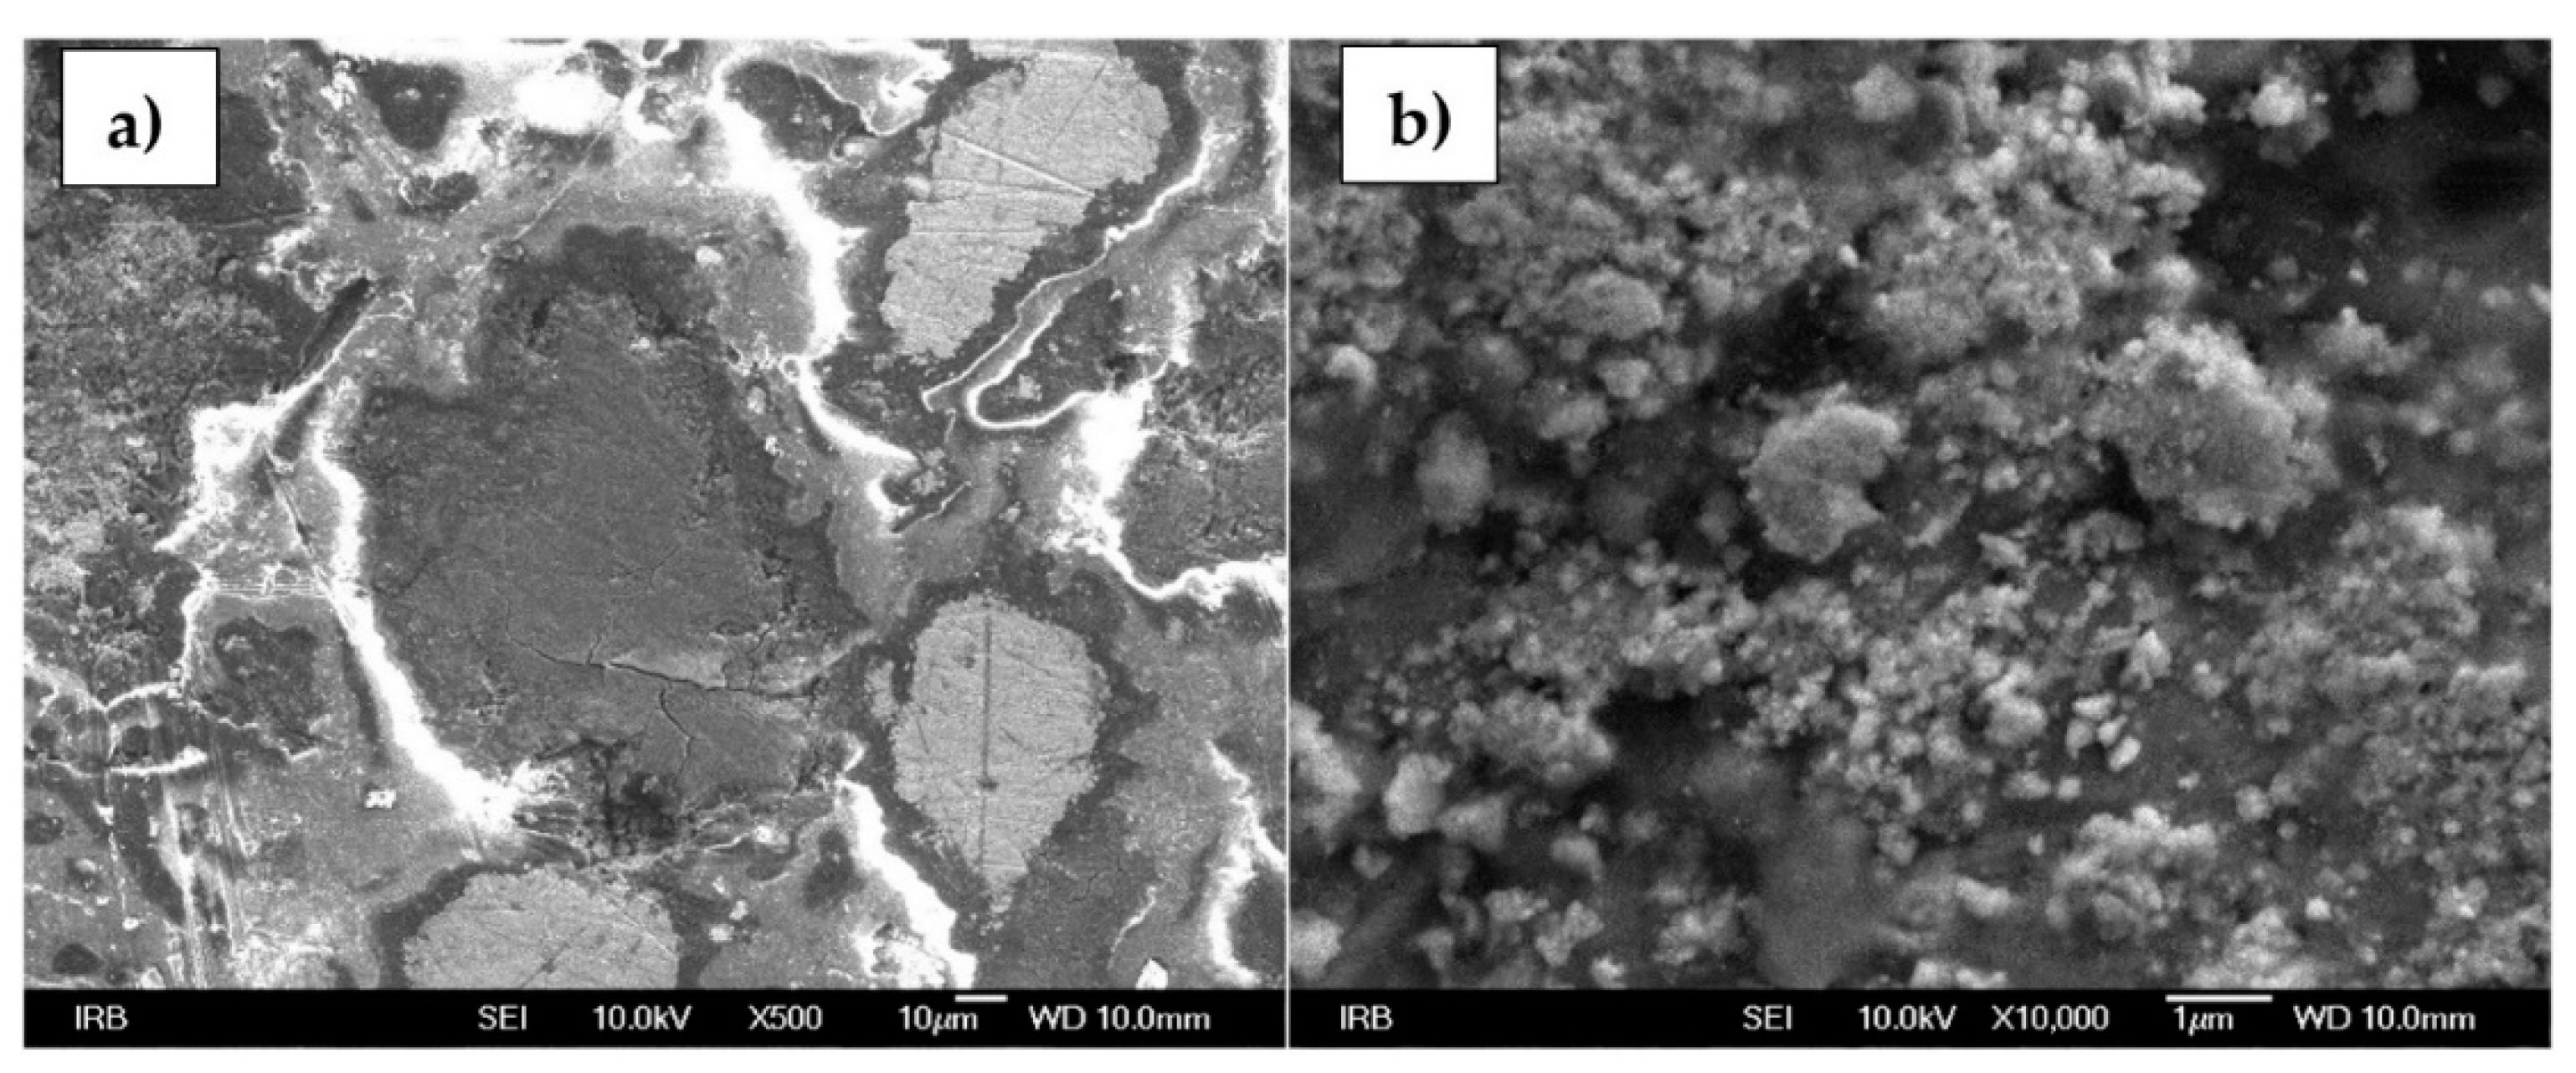
3.5. Surface of an Ion-Selective Membrane
4. Conclusions
Author Contributions
Funding
Institutional Review Board Statement
Informed Consent Statement
Data Availability Statement
Conflicts of Interest
References
- Urbanova, V.; Magro, M.; Gedanken, A.; Baratella, D.; Vianello, F.; Zboril, R. Nanocrystalline iron oxides, composites, and related materials as a platform for electrochemical, magnetic, and chemical biosensors. Chem. Mater. 2014, 26, 6653–6673. [Google Scholar] [CrossRef]
- Shao, Y.Z.; Ying, Y.B.; Ping, J.F. Recent advances in solid-contact ion-selective electrodes: Functional materials, transduction mechanisms, and development trends. Chem. Soc. Rev. 2020, 49, 4405–4465. [Google Scholar] [CrossRef] [PubMed]
- Kakhki, R.M. Application of nanoparticles in the potentiometric ion selective electrodes. Russ. J. Electrochem. 2013, 49, 458–465. [Google Scholar] [CrossRef]
- Yin, T.; Qin, W. Applications of nanomaterials in potentiometric sensors. TrAC Trends Anal. Chem. 2013, 51, 79–86. [Google Scholar] [CrossRef]
- Asefa, T.; Duncan, C.T.; Sharma, K.K. Recent advances in nanostructured chemosensors and biosensors. Analyst 2009, 134, 1980. [Google Scholar] [CrossRef]
- George, J.M.; Antony, A.; Mathew, B. Metal oxide nanoparticles in electrochemical sensing and biosensing: A review. Microchim. Acta 2018, 185, 358. [Google Scholar] [CrossRef] [PubMed]
- Katz, E.; Willner, I.; Wang, J. Electroanalytical and Bioelectroanalytical Systems Based on Metal and Semiconductor Nanoparticles. Electroanalysis 2004, 16, 19–44. [Google Scholar] [CrossRef]
- Wang, F.; Hu, S. Electrochemical sensors based on metal and semiconductor nanoparticles. Microchim. Acta 2009, 165, 1–22. [Google Scholar] [CrossRef]
- Li, Y.; Zhang, J.; Zhu, H.; Yang, F.; Yang, X. Gold nanoparticles mediate the assembly of manganese dioxide nanoparticles for H2O2 amperometric sensing. Electrochim. Acta 2010, 55, 5123–5128. [Google Scholar] [CrossRef]
- Zhang, S.; Zheng, J. Synthesis of single-crystal α-MnO2 nanotubes-loaded Ag@C core–shell matrix and their application for electrochemical sensing of nonenzymatic hydrogen peroxide. Talanta 2016, 159, 231–237. [Google Scholar] [CrossRef]
- Fan, Y.; Huang, K.-J.; Niu, D.-J.; Yang, C.-P.; Jing, Q.-S. TiO2-graphene nanocomposite for electrochemical sensing of adenine and guanine. Electrochim. Acta 2011, 56, 4685–4690. [Google Scholar] [CrossRef]
- Prkic, A.; Vukusic, T.; Giljanovic, J.; Sokol, V.; Boskovic, P.; Lavcevic, M.L.; Mitar, I.; Jakic, M. Development of a New Potentiometric Sensor based on home made Iodide ISE Enriched with ZnO Nanoparticles and its Application for Determination of Penicillamine. Int. J. Electrochem. Sc. 2018, 13, 10894–10903. [Google Scholar] [CrossRef]
- Prkic, A.; Vukusic, T.; Mitar, I.; Giljanovic, J.; Sokol, V.; Boskovic, P.; Jakic, M.; Sedlar, A. New sensor based on AgCl containing Iron Oxide or Zinc Oxide Nanoparticles for Chloride Determination. Int. J. Electrochem. Sc. 2019, 14, 861–874. [Google Scholar] [CrossRef]
- Chekin, F.; Yazdaninia, M. A sensor based on incorporating Ni2+ into ZnO nanoparticles-multi wall carbon nanotubes-poly methyl metacrylat nanocomposite film modified carbon paste electrode for determination of carbohydrates. Russ. J. Electrochem. 2014, 50, 967–973. [Google Scholar] [CrossRef]
- Li, S.-J.; Du, J.-M.; Zhang, J.-P.; Zhang, M.-J.; Chen, J. A glassy carbon electrode modified with a film composed of cobalt oxide nanoparticles and graphene for electrochemical sensing of H2O2. Microchim. Acta 2014, 181, 631–638. [Google Scholar] [CrossRef]
- Yao, S.S.; Zhi, L.F.; Guo, J.; Yan, S.J.; Zhang, M.G. Hierarchical Porous NiCo2O4 array grown on Ni foam for the Simultaneous Electrochemical Detection of Copper(II) and Mercury(II). Int. J. Electrochem. Sc. 2018, 13, 542–550. [Google Scholar] [CrossRef]
- Yuan, M.; Li, J.; Yu, Y.; Fu, Y.; Fong, A.; Hu, J. Fabrication of a Fe2O3Nanoparticles Implantation-modified Electrode and its Applications in Electrochemical Sensing. Electroanalysis 2015, 28, 954–961. [Google Scholar] [CrossRef]
- G. Uc-Cayetano, E. Enhancement of Electrochemical Glucose Sensing by Using Multiwall Carbon Nanotubes decorated with Iron Oxide Nanoparticles. Int. J. Electrochem. Sci. 2016, 11, 6356–6369. [Google Scholar] [CrossRef]
- Lee, S.; Oh, J.; Kim, D.; Piao, Y. A sensitive electrochemical sensor using an iron oxide/graphene composite for the simultaneous detection of heavy metal ions. Talanta 2016, 160, 528–536. [Google Scholar] [CrossRef]
- Radić, J.; Bralić, M.; Kolar, M.; Genorio, B.; Prkić, A.; Mitar, I. Development of the New Fluoride Ion-Selective Electrode Modified with Fe(x)O(y) Nanoparticles. Molecules 2020, 25, 5213. [Google Scholar] [CrossRef]
- Absalan, G.; Akhond, M.; Bananejad, A.; Ershadifar, H. Highly sensitive determination of nitrite using a carbon ionic liquid electrode modified with Fe3O4 magnetic nanoparticle. J Iran Chem Soc 2015, 12, 1293–1301. [Google Scholar] [CrossRef]
- Kaushik, A.; Solanki, P.R.; Ansari, A.A.; Sumana, G.; Ahmad, S.; Malhotra, B.D. Iron oxide-chitosan nanobiocomposite for urea sensor. Sens. Actuators B 2009, 138, 572–580. [Google Scholar] [CrossRef]
- Adekunle, A.S.; Agboola, B.O.; Pillay, J.; Ozoemena, K.I. Electrocatalytic detection of dopamine at single-walled carbon nanotubes–iron (III) oxide nanoparticles platform. Sens. Actuators B 2010, 148, 93–102. [Google Scholar] [CrossRef]
- Zhang, Y.; Cheng, Y.; Zhou, Y.; Li, B.; Gu, W.; Shi, X.; Xian, Y. Electrochemical sensor for bisphenol A based on magnetic nanoparticles decorated reduced graphene oxide. Talanta 2013, 107, 211–218. [Google Scholar] [CrossRef] [PubMed]
- Mitar, I.; Guć, L.; Soldin, Ž.; Vrankić, M.; Paut, A.; Prkić, A.; Krehula, S. Rapid Microwave Method for Synthesis of Iron Oxide Particles under Specific Conditions. Crystals 2021, 11, 383. [Google Scholar] [CrossRef]
- Baig, N.; Sajid, M.; Saleh, T.A. Recent trends in nanomaterial-modified electrodes for electroanalytical applications. TrAC Trends Anal. Chem. 2019, 111, 47–61. [Google Scholar] [CrossRef]
- Goldhaber, S.B. Trace element risk assessment: Essentiality vs. toxicity. Regul. Toxicol. Pharmacol. 2003, 38, 232–242. [Google Scholar] [CrossRef]
- Isildak, I.; Attar, A.; Demir, E.; Kemer, B.; Aboul-Enein, H.Y. A Novel all Solid-State Contact PVC-Membrane Beryllium-Selective Electrode Based on 4-Hydroxybenzo-15-Crown-5 Ether Ionophore. Curr. Anal. Chem. 2018, 14, 43–48. [Google Scholar] [CrossRef]
- Mizani, F.; Ganjali, M.R.; Faridbod, F.; Esmaeilnia, S. A Novel Iron(III) Selective Potentiometric Sensor Based on 9-Ethylacenaphtho [1, 2-B]Quinoxaline. Int. J. Electrochem. Sc. 2013, 8, 10473–10486. [Google Scholar]
- Bita, S.; Sadati, S.O.; Soleymanpour, A.; Amouzad, F. Highly Selective Solid Contact Sensor for Low Level Concentration Measurements of Iron(III) in Pharmaceutical and Biological Media. J. Anal. Chem. 2018, 73, 1202–1208. [Google Scholar] [CrossRef]
- Yari, A.; Bagheri, M.; Ghazizadeh, M. A Novel Iron(III) Potentiometric Sensor Based on (E)-N‘-((2-hydroxynaphthalen-3-yl)methylene)benzohydrazide. Int. J. Electrochem. Sc. 2016, 11, 6597–6608. [Google Scholar] [CrossRef]
- Fakhari, A.R.; Alaghemand, M.; Shamsipur, M. Iron(III)-selective membrane potentiometric sensor based on 5,10,15,20-tetrakis(pentafluorophenyl)-21H, 23H-porphyrin. Anal. Lett. 2001, 34, 1097–1106. [Google Scholar] [CrossRef]
- Ekmekci, G.; Uzun, D.; Somer, G.; Kalayci, S. A novel iron(III) selective membrane electrode based on benzo-18-crown-6 crown ether and its applications. J. Membr. Sci. 2007, 288, 36–40. [Google Scholar] [CrossRef]
- Vlascici, D.; Fagadar-Cosma, E.; Popa, I.; Chiriac, V.; Gil-Agusti, M. A Novel Sensor for Monitoring of Iron(III) Ions Based on Porphyrins. Sensors 2012, 12, 8193–8203. [Google Scholar] [CrossRef] [PubMed]
- Gupta, V.K.; Sethi, B.; Upadhyay, N.; Kumar, S.; Singh, R.; Singh, L.P. Iron (III) Selective Electrode Based on S-Methyl N-(Methylcarbamoyloxy) Thioacetimidate as a Sensing Material. Int. J. Electrochem. Sc. 2011, 6, 650–663. [Google Scholar]
- Ali, T.A.; Mahmoud, W.H.; Mohamed, G.G. Construction and characterization of nano iron complex ionophore for electrochemical determination of Fe(III) in pure and various real water samples. Appl. Organomet. Chem. 2019, 33, e5206. [Google Scholar] [CrossRef]
- Ali, T.A.; Mohamed, G.G.; El-Dessouky, M.M.I.; Abou El Ella, S.M.; Mohamed, R.T.F. Modified Carbon Paste Ion Selective Electrodes for the Determination of Iron (III) in Water, Soil and Fish Tissue Samples. Int. J. Electrochem. Sci. 2013, 8, 1469–1486. [Google Scholar]
- Duzgun, E.; Tastekin, M.; Atakol, O. A new modified Fe(III)-selective solid membrane electrode. Rev Anal Chem 2008, 27, 83–90. [Google Scholar] [CrossRef]
- Fung, Y.; Fung, K. Determination of iron (III) with a copper selective electrode. Anal. Chem. 1977, 49, 497–499. [Google Scholar] [CrossRef]
- Paut, A.; Prkić, A.; Mitar, I.; Bošković, P.; Jozić, D.; Jakić, M.; Vukušić, T. Potentiometric Response of Solid-State Sensors Based on Ferric Phosphate for Iron(III) Determination. Sensors 2021, 21, 1612. [Google Scholar] [CrossRef]
- Lewis, D.G.; Farmer, V.C. Infrared absorption of surface hydroxyl groups and lattice vibrations in lepidocrocite (γ-FeOOH) and boehmite (γ-AlOOH). Clay Miner. 1986, 21, 93–100. [Google Scholar] [CrossRef]
- Hou, H.; Xie, Y.; Yang, Q.; Guo, Q.; Tan, C. Preparation and characterization of γ-AlOOH nanotubes and nanorods. Nanotechnology 2005, 16, 741. [Google Scholar] [CrossRef]
- Milligan, W.O.; McAtee, J.L. Crystal Structure of γ-AlOOH and γ-ScOOH. J. Phys. Chem. 1956, 60, 273–277. [Google Scholar] [CrossRef]
- Buining, P.A.; Pathmamanoharan, C.; Jansen, J.B.H.; Lekkerkerker, H.N.W. Preparation of Colloidal Boehmite Needles by Hydrothermal Treatment of Aluminum Alkoxide Precursors. J. Am. Ceram. Soc. 1991, 74, 1303–1307. [Google Scholar] [CrossRef] [Green Version]
- Štefanić, G.; Musić, S. Microstructural analysis of boehmite nanoparticles prepared by rapid hydrolysis of aluminum sec-butoxide. Croat. Chem. Acta 2011, 84, 481–485. [Google Scholar] [CrossRef]
- Prabhakar, R.; Samadder, S.R. Low cost and easy synthesis of aluminium oxide nanoparticles for arsenite removal from groundwater: A complete batch study. J. Mol. Liq. 2018, 250, 192–201. [Google Scholar] [CrossRef]
- Stoia, M.; Istratie, R.; Păcurariu, C. Investigation of magnetite nanoparticles stability in air by thermal analysis and FTIR spectroscopy. J. Therm. Anal. Calorim. 2016, 125, 1185–1198. [Google Scholar] [CrossRef]
- Fleet, M.E. The structure of magnetite. Acta Crystallogr. Sect. B Struct. Crystallogr. Cryst. Chem 1981, 37, 917–920. [Google Scholar] [CrossRef]


| Sample | 0.1 M Al2(SO4)3∙18H2O (mL) | 25% NH3 (mL) | Temperature (°C) | Time (min) | Drying Temperature (°C) | Calcination Temperature (°C) | pH |
|---|---|---|---|---|---|---|---|
| boehmite | 24 | ~3.7 | 200 | 30 | 100 | − | 9 |
| alumina | 24 | ~3.7 | 200 | 30 | 100 | 800 | 9 |
| Sample | 1 M FeCl3 (mL) | 25% NH3 (mL) | FeCl2·4H2O (g) | Temperature (°C) | Time (min) | Drying Temperature (°C) | pH |
|---|---|---|---|---|---|---|---|
| magnetite | 8 | ~5.4 | 0.792 | 200 | 10 | 60 | 8.7 |
| Membrane | Membrane Mixture Composition (%) | ||||||
|---|---|---|---|---|---|---|---|
| FePO4 | Ag2S | PTFE | NP Type | ||||
| Hematite | Magnetite | Alumina | Boehmite | ||||
| MN1 | 25 | 25 | 50 | 0.25 | |||
| MN2 | 25 | 25 | 50 | 0.5 | |||
| MN3 | 25 | 25 | 50 | 1 | |||
| MN4 | 25 | 25 | 50 | 0.25 | |||
| MN5 | 25 | 25 | 50 | 0.5 | |||
| MN6 | 25 | 25 | 50 | 1 | |||
| MN7 | 25 | 25 | 50 | 0.25 | |||
| MN8 | 25 | 25 | 50 | 0.5 | |||
| MN9 | 25 | 25 | 50 | 1 | |||
| MN10 | 25 | 25 | 50 | 0.25 | |||
| MN11 | 25 | 25 | 50 | 0.5 | |||
| MN12 | 25 | 25 | 50 | 1 | |||
| Membrane | Slope (mV dec−1) | Linear Range (mol L−1) | LOD (mol L−1) | R2 |
|---|---|---|---|---|
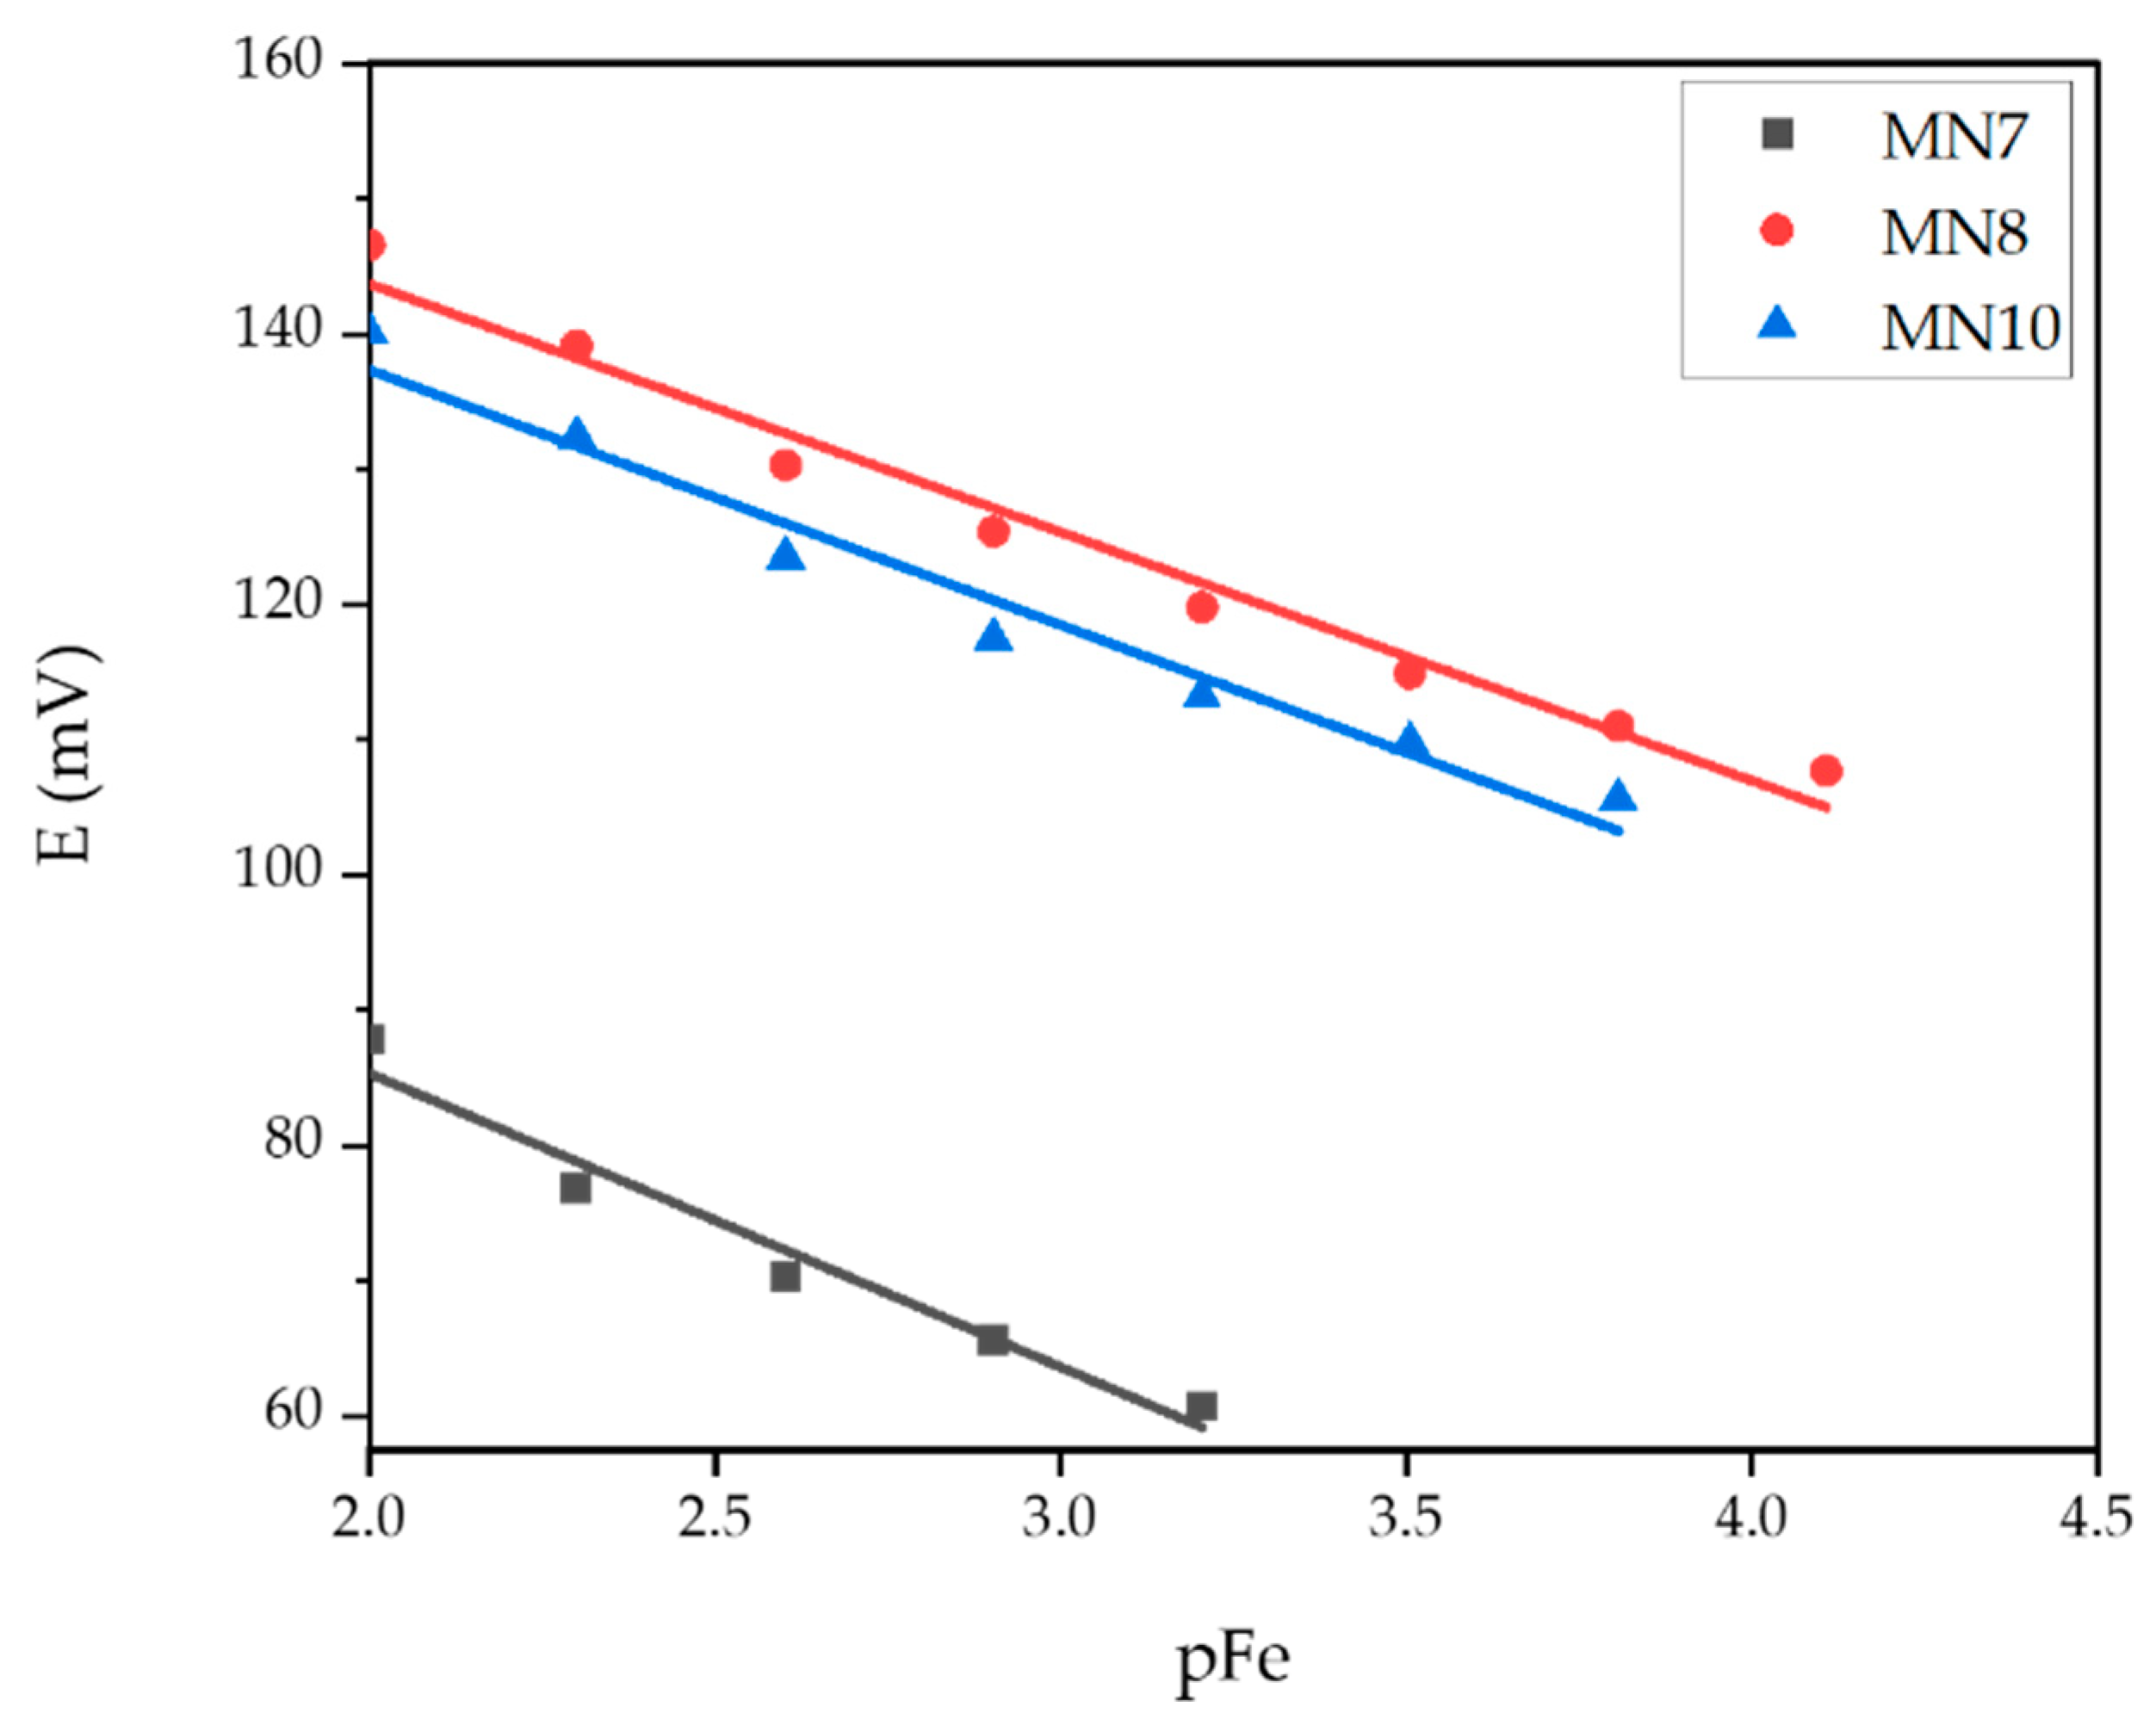
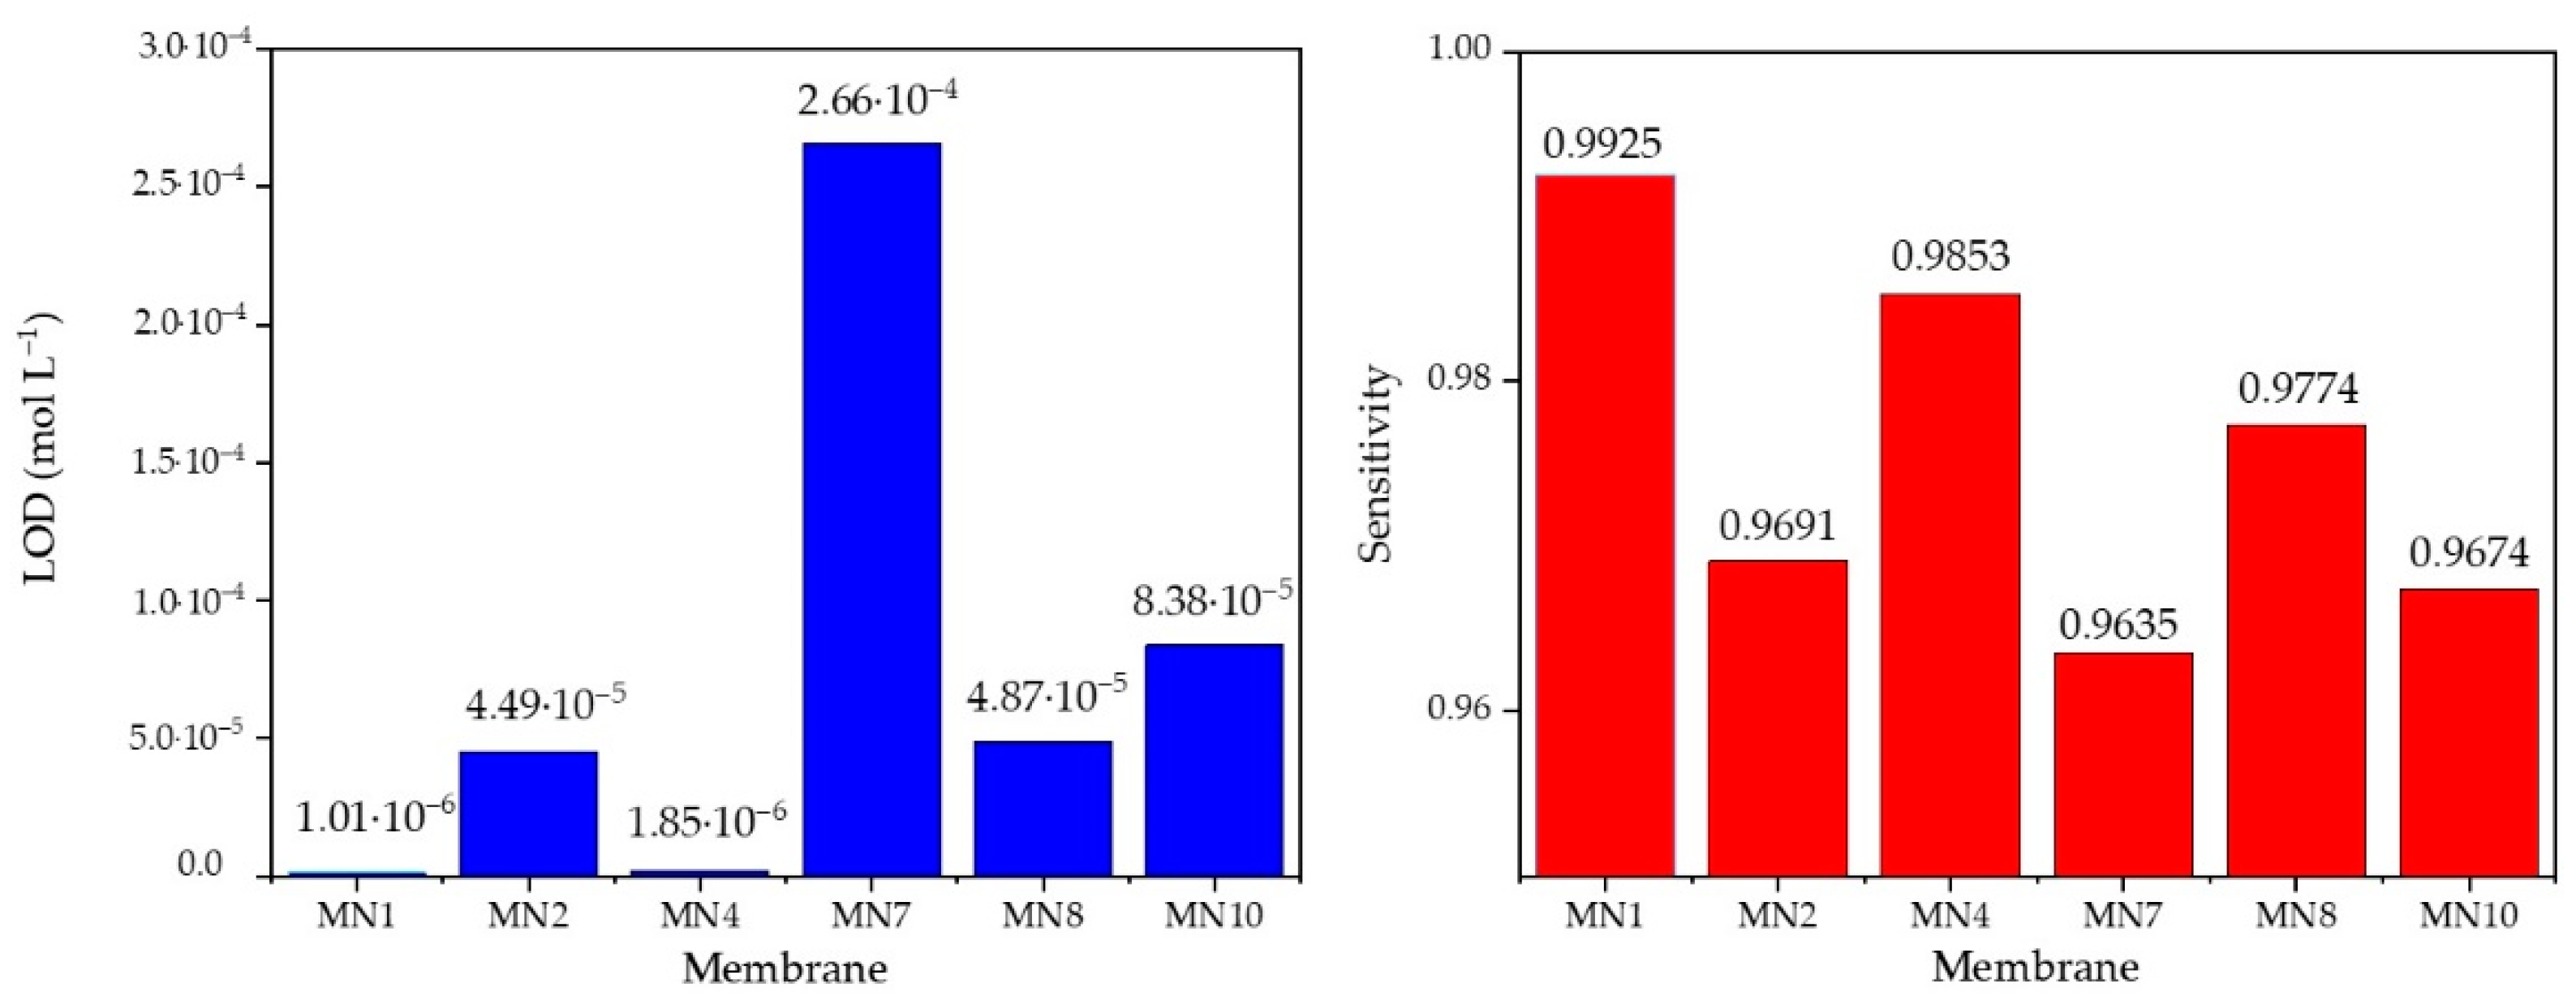
| MN7 | −21.73 | 6.25·10−4–1·10−2 | 2.66·10−4 | 0.9635 |
| MN8 | −18.37 | 7.81·10−5–1·10−2 | 4.87·10−5 | 0.9774 |
| MN10 | −18.86 | 1.56·10−4–1·10−2 | 8.38·10−5 | 0.9674 |
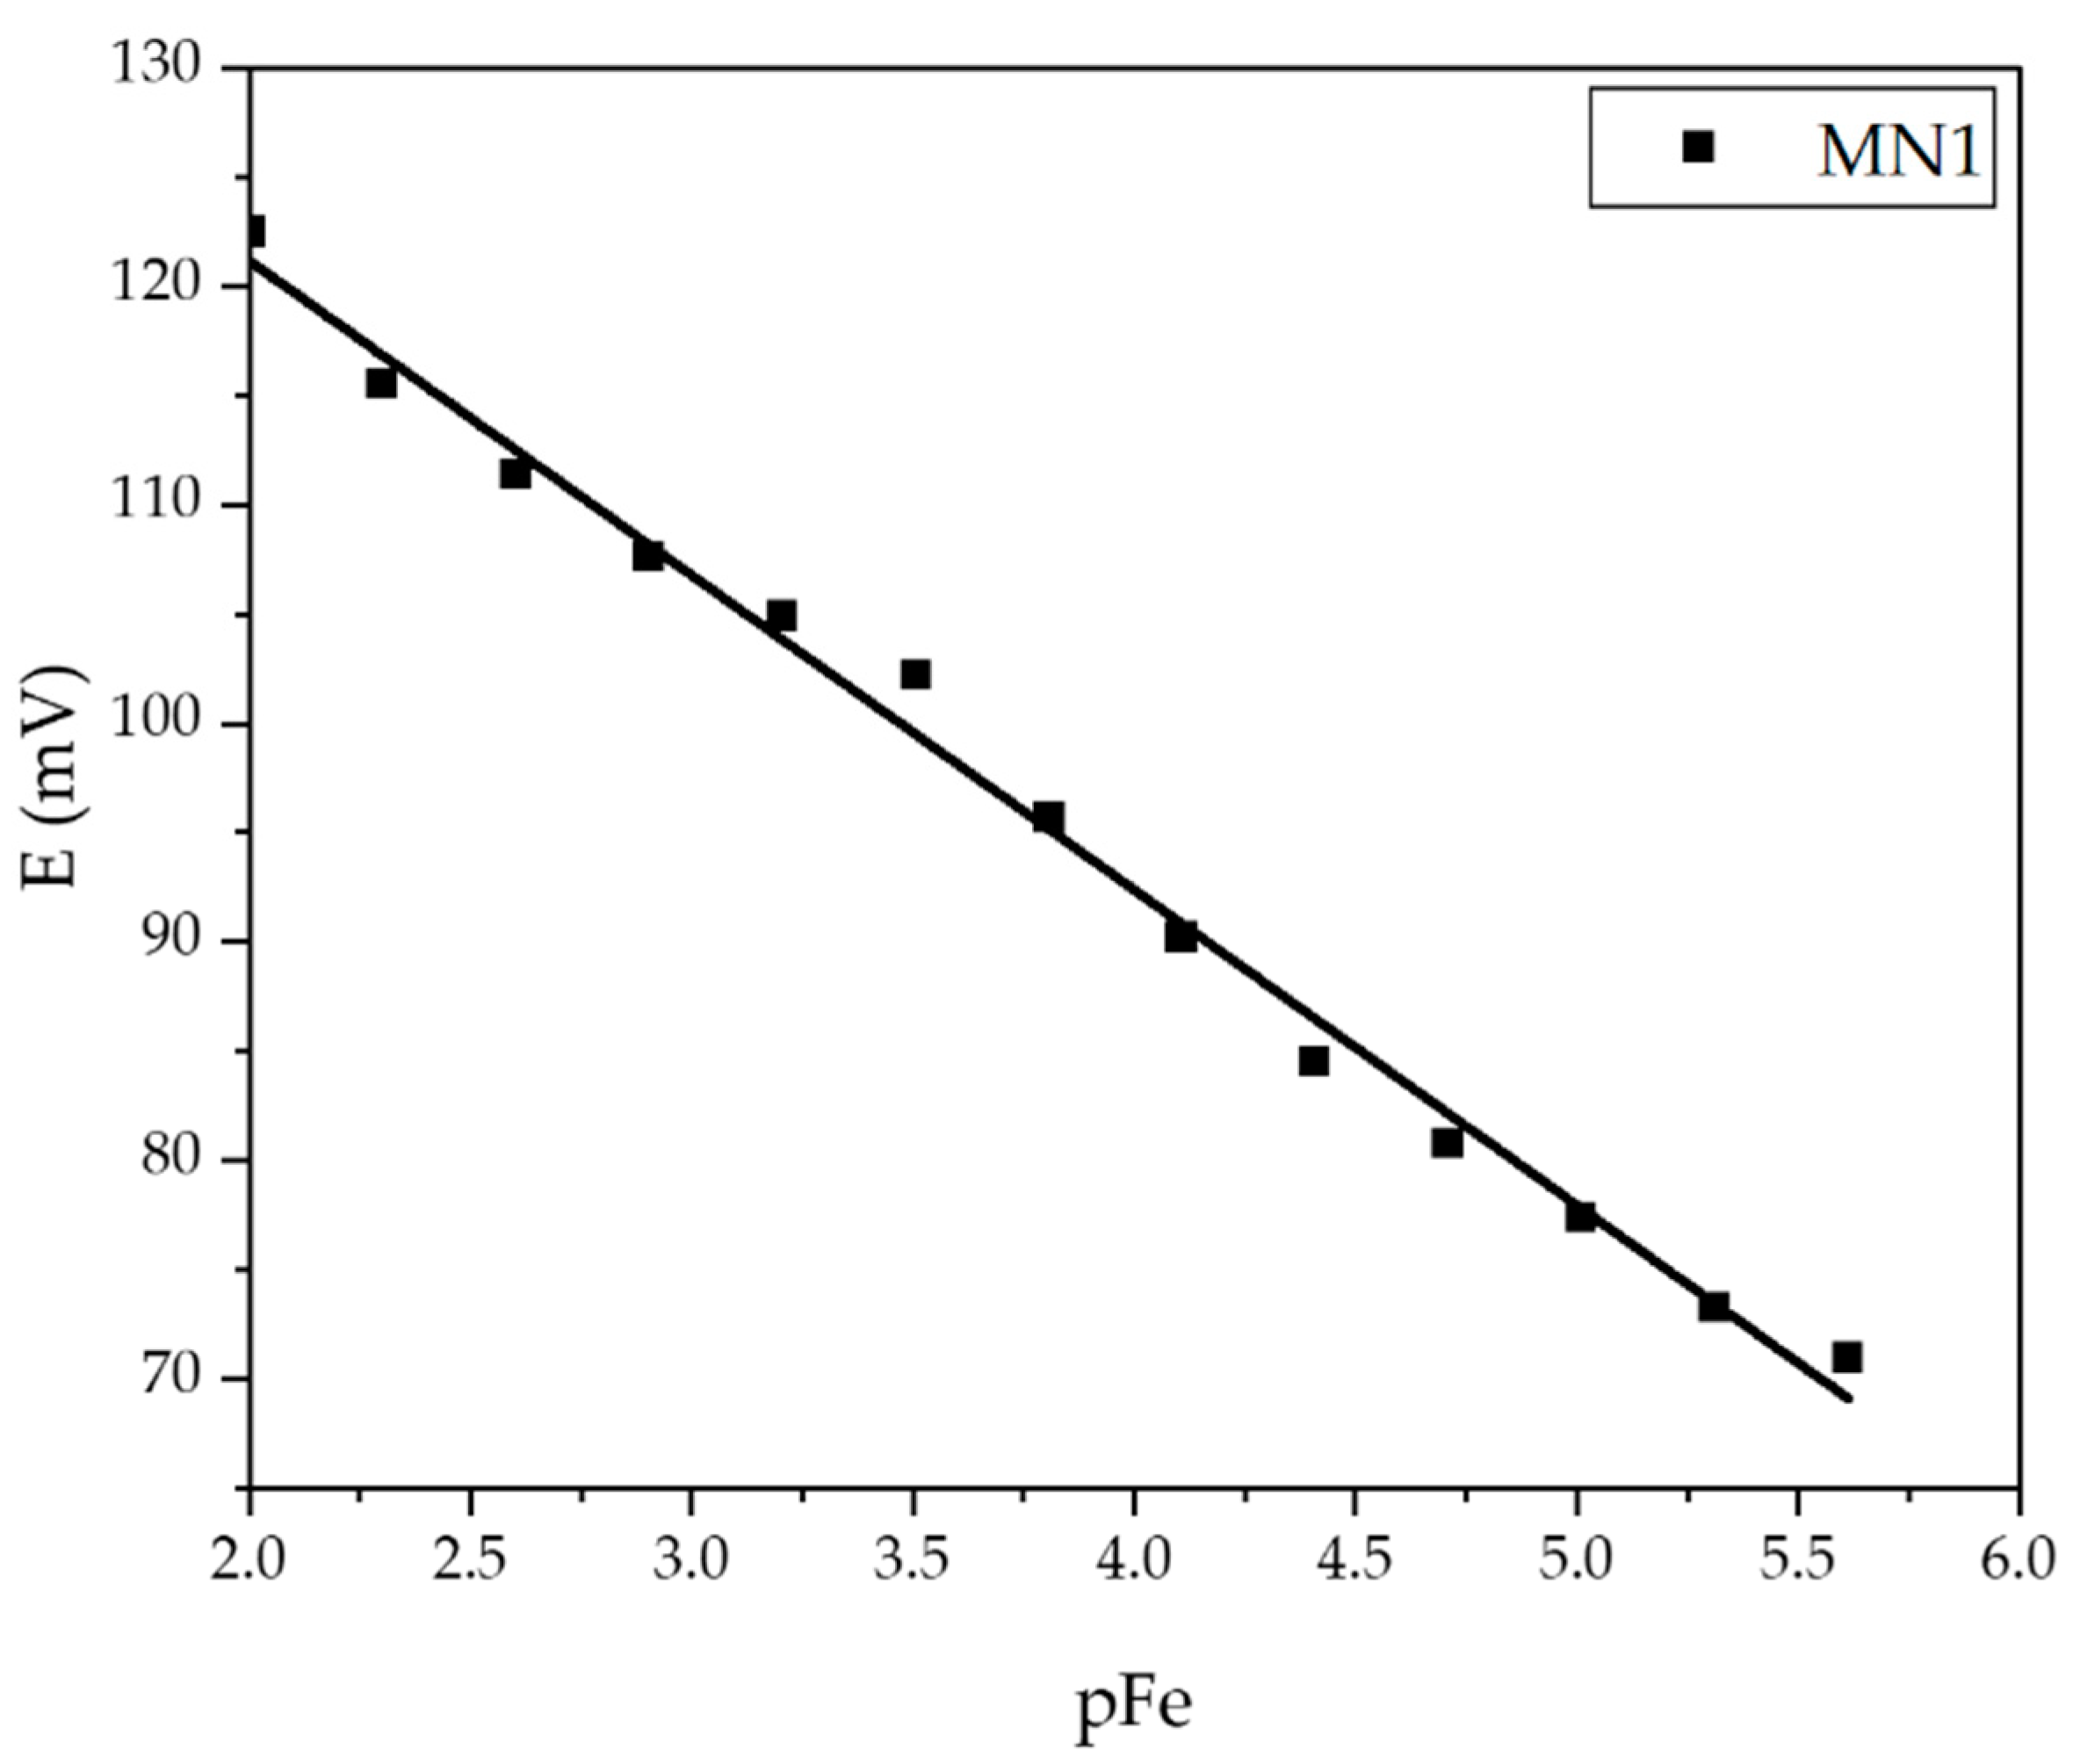
| Membrane | Slope (mV dec−1) | Linear Range (mol L−1) | LOD (mol L−1) | R2 |
|---|---|---|---|---|
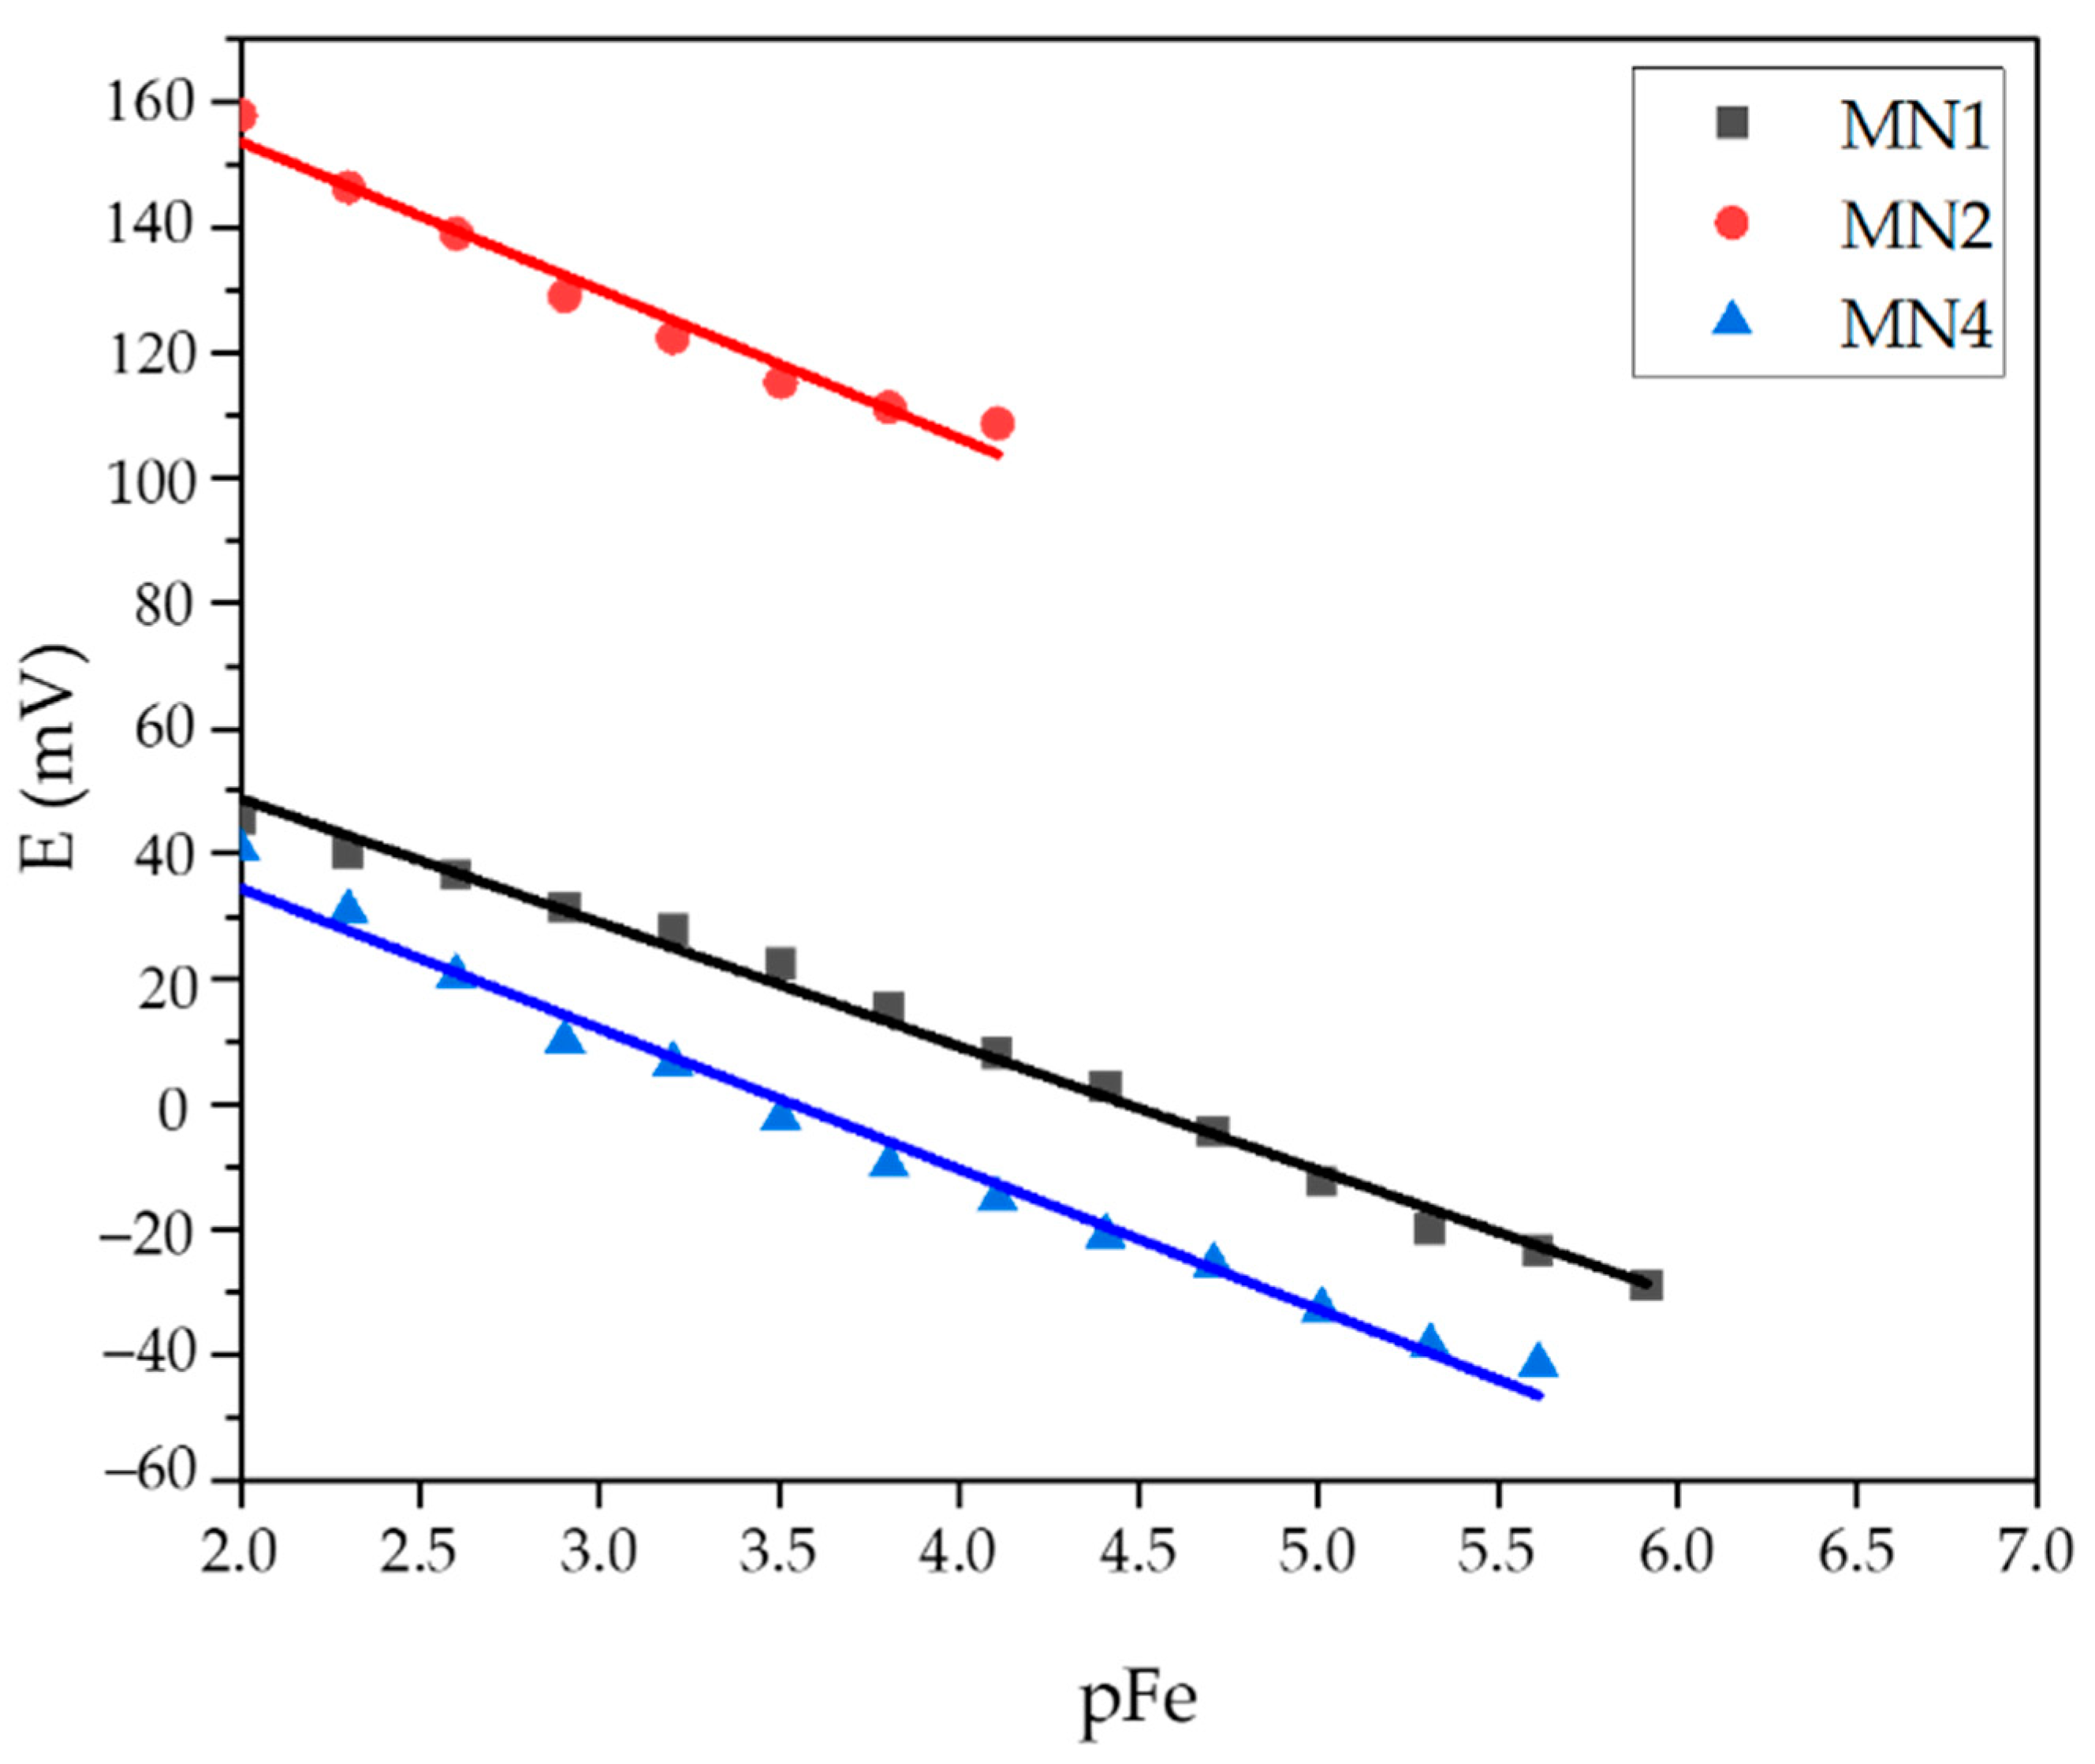
| MN4 | −22.38 | 2.44·10−6–1·10−2 | 1.85·10−6 | 0.9853 |
| MN1 | −19.75 | 1.22·10−6–1·10−2 | 1.01·10−6 | 0.9925 |
| MN2 | −23,64 | 7.81·10−5–1·10−2 | 4.49·10−5 | 0.9691 |
| m(Fe3+) = 1.1169 mg; Ecalc. = 23.1 mV | ||||
|---|---|---|---|---|
| 1st Cycle | 2nd Cycle | 3rd Cycle | Average | |
| E(measured) (mV) | 23.3 | 23.1 | 22.8 | 23.07 |
| m(Fe3+)measured (mg) | 1.1394 | 1.1169 | 1.0749 | 1.1104 |
| recovery (%) | 102.01 | 100 | 96.2 | 99.4 |
| m(Fe3+) = 2.2338 mg; Ecalc = 106.8 mV | ||||
| 1st Cycle | 2nd Cyle | 3rd Cycle | Average | |
| Emeasured (mV) | 108 | 107 | 106.4 | 107.1 |
| m(Fe3+)measured (mg) | 2.7213 | 2.3193 | 2.1072 | 2.3826 |
| recovery (%) | 121.8 | 103.8 | 94.3 | 106.7 |
| m(Fe3+) = 1.1169 mg; Ecalc. = 102.4 mV | ||||
| 1st cycle | 2nd cycle | 3rd cycle | average | |
| Emeasured (mV) | 102.5 | 102 | 101.5 | 102 |
| m(Fe3+)measured (mg) | 1.1297 | 1.0429 | 0.9628 | 1.0451 |
| recovery (%) | 101.1 | 93.4 | 86.2 | 93.6 |
| m(Fe3+) = 0.2234 mg; Ecalc. = 92.4 mV | ||||
| 1st cycle | 2nd cycle | 3rd cycle | average | |
| Emeasured (mV) | 92.9 | 92 | 92.4 | 92.4 |
| m(Fe3+)measured (mg) | 0.2435 | 0.2109 | 0.2234 | 0.2259 |
| recovery (%) | 109.0 | 94.4 | 100 | 101.1 |
Publisher’s Note: MDPI stays neutral with regard to jurisdictional claims in published maps and institutional affiliations. |
© 2021 by the authors. Licensee MDPI, Basel, Switzerland. This article is an open access article distributed under the terms and conditions of the Creative Commons Attribution (CC BY) license (https://creativecommons.org/licenses/by/4.0/).
Share and Cite
Paut, A.; Prkić, A.; Mitar, I.; Guć, L.; Marciuš, M.; Vrankić, M.; Krehula, S.; Tomaško, L. The New Ion-Selective Electrodes Developed for Ferric Cations Determination, Modified with Synthesized Al and Fe−Based Nanoparticles. Sensors 2022, 22, 297. https://doi.org/10.3390/s22010297
Paut A, Prkić A, Mitar I, Guć L, Marciuš M, Vrankić M, Krehula S, Tomaško L. The New Ion-Selective Electrodes Developed for Ferric Cations Determination, Modified with Synthesized Al and Fe−Based Nanoparticles. Sensors. 2022; 22(1):297. https://doi.org/10.3390/s22010297
Chicago/Turabian StylePaut, Andrea, Ante Prkić, Ivana Mitar, Lucija Guć, Marijan Marciuš, Martina Vrankić, Stjepko Krehula, and Lara Tomaško. 2022. "The New Ion-Selective Electrodes Developed for Ferric Cations Determination, Modified with Synthesized Al and Fe−Based Nanoparticles" Sensors 22, no. 1: 297. https://doi.org/10.3390/s22010297
APA StylePaut, A., Prkić, A., Mitar, I., Guć, L., Marciuš, M., Vrankić, M., Krehula, S., & Tomaško, L. (2022). The New Ion-Selective Electrodes Developed for Ferric Cations Determination, Modified with Synthesized Al and Fe−Based Nanoparticles. Sensors, 22(1), 297. https://doi.org/10.3390/s22010297